2 0 1 8 - A Partnership of UConn and Eversource
28
EVERSOURCE ENERGY CENTER A utility-university partnership at UConn 2 0 1 8 ANNUAL REPORT
Transcript of 2 0 1 8 - A Partnership of UConn and Eversource

EVERSOURCE ENERGY CENTERA utility-university partnership at UConn
2 0 1 8
annualreport

Welcome by the Center Director 3 Our Mission 4Our Team 5 Principal Investigators 5 Graduate Research Assistants 5 Postdocs and Staff 5Our History, Our Drive 6 Key Initiatives 7 Timeline of the Center’s Progress 7 Strategic Partnerships 7Center by the Numbers, 2016–18 8 Awarded Amounts 8 Expenditures 8 Students and Postdocs 8 Alumni 8 Publications 8Power Grid Storm Readiness 8 The Eversource Energy Center’s Power Outage Prediction Model 8 Extreme Weather Forecasting 10 Restoration Time Estimation 11Tree and Forest Management 12 Roadside Management 12 Remote Sensing for Monitoring Vegetation 13 Biomechanical Assessment of Roadside Forest 13 Human Dimension to Roadside Forest Management 14Grid Vulnerability Assessment 15 Substations’ Risk of Flooding 15 Substation Physical Security 16 Evaluating LiDAR Technologies 16 Utility Infrastructure Mapping 17 Grid Hardening against Geomagnetic Disturbance 18Grid Resilience 19 Total System Assessment Model 19 Utility Resiliency Investment Planning 20 Economic Value of Avoided Outages 21Grid Modernization 21 Evaluation of Unintentional Islanding 21 Eversource Extreme PV Power Analytics 23Bibliography 24
contents

I warmly welcome you to the first annual report of the University of Connecticut Eversource Energy Center, in which we summarize our leading-edge research and collaborations with utilities and industry partners for mitigating storm hazards and increasing the resilience and security of the electric grid. These efforts benefit millions of people and the communities and businesses in which they live and work.
As you will see, we are taking an interdisciplinary approach to delivering to the utility industry vital and timely science-based solutions to a broad
range of problems. Our state-of-the-art research, technology, and software address real-world challenges at the intersection of weather, climate, and energy with important societal benefits, including the enhancement of reliability and emergency response and the minimization of storm and other security-event impacts.
We invite universities and research centers, as well as utilities, organizations, and industry partners, to participate in our research, activities, and initiatives. Our proven consortium method will produce the next generation of technologies and software, leading to transformative commercial products and services and advances in storm preparedness and grid modernization. Our exceptional partnerships are driving innovation, and we invite you to join us in building the grid of the future, today.
Professor Emmanouil Anagnostou, PhD Director, Eversource Energy Center
welcome by the center Director
3

our missionWe are the leading energy utility–university partnership in New
England and a trusted source of energy expertise, advancing
new research and technologies to ensure reliable power during
extreme weather and security events. Through its consortium
approach, our Center creates partnerships, develops next-
generation technology and software, and collaborates on
solving current and future reliability and energy needs.
“We are a hub for innovative and progressive thinking to build the electric
grid of the future, today.”
4

Department of Civil and Environmental EngineeringEmmanouil N. Anagnostou, Professor and Eversource Energy Endowed Chair in Environmental Engineering, Director of the Eversource Energy Center
Marina Astitha, Assistant Professor
Amvrossios Bagtzoglou, Professor
Jonathan Mellor, Assistant Professor
Efthymios Nikolopoulos, Assistant Research Professor
Malaquias Peña, Associate Professor, Manager of the Eversource Energy Center
Xinyi Shen, Assistant Research Professor
David Wanik, Adjunct Assistant Professor
Wei Zhang, Assistant Professor
Department of Electrical and Computer EngineeringYang Cao, Associate Professor
Peng Zhang, Associate Professor
Department of FinancePaul Borochin, Assistant Professor
Fred Carstensen, Professor, Director of the Connecticut Center for Economic Analysis
Suresh Nair, Professor
Department of Natural Resources and the EnvironmentRobert Fahey, Assistant Professor
Thomas H. Meyer, Professor
Anita Morzillo, Assistant Professor, Associate Director of the Eversource Energy Center
Jason Parent, Assistant Research Professor
John C. Volin, Professor, Vice Provost of Academic Affairs, UConn
Chandi Witharana, Visiting Assistant Professor
Thomas Worthley, Assistant Extension Professor and Forestry Specialist
Graduate Research Assistants
Department of Civil and Environmental Engineering
Abul Ehsan BhuiyanDiego CerraiYagmur DerinLanxin HuMarika KoukoulaRehenuma LazinXuan LiXiaolong MaMichael WaltersPeter WatsonFeifei YangHao Yuan
Department of Electrical and Computer EngineeringGuannan LiangTohid ShahsavarianAjabshir
Department of Natural Resources and the Environment
Abul Ehsan BhuiyaAmanda BunceDaniel HaleDanielle KlosterNancy MarekJulia Roger
Postdoc Weixing Zhang
Staff
Kailee Collins, Student AssistantArlene Goodwin, Financial Assistant Ronny Heredia, Financial Assistant
our team
Principal Investigators
5

our Driveour history
R
1 “Public Release Report from the Council on Environmental Quality Interagency Climate Change Adaptation Task Force”, http://www.whitehouse.gov/sites/default/files/microsites/ceq/napdraft6_2_11_final.pdf.
2 Webster et al., “Changes in Tropical Cyclone Number, Duration, and Intensity in a Warming Environment,” Science 309 (5742): 1844–46, 2005.3 https://portal.ct.gov/Office-of-the-Governor/Working-Groups/Two-Storm-Panel.
ecent storms in the northeastern United States have clearly demonstrated the vulner-ability of Connecticut residents, the state’s economy, and much of its infrastructure to
increasingly frequent severe weather events. In 2011, Eversource Energy (formerly Northeast
Utilities) was overwhelmed by the effects of the two largest storms to strike in the company’s history. Tropical Storm Irene and the October Snowstorm occurred less
than ten weeks apart and together caused one and a half million customer outages in Connecticut alone. A
year later, Superstorm Sandy battered the entire northeastern shoreline, also causing widespread
and extended power outages. These storms damaged or destroyed public and private
property, crippled critical infrastructure, and disrupted business for extended
periods, resulting in billions of dollars of losses to Connecticut’s economy.
They also exposed the weak-nesses of utilities, businesses, local governments, and resi-dents with regard to disaster preparedness, response, restoration, and mitigation and their ability to antici-pate and manage the risks involved.
These kinds of weather events cannot just be consigned to the past. In 2011 the Council on Environmental Quality
Interagency Climate Change Adaptation Task Force forecast a 67 percent increase in the severity of extreme events over the Northeast attributable to climate change in this century.1 A 2005 study reported in Science noted an increase in the occurrence of Category 3 and 4 hurricanes in the region2—an alarming finding, considering the high potential for tree- and flooding-related harm to the heavy infrastructure and high populations of its densely vegetated and coastal areas.
To address these growing threats, the Two Storm Panel, commissioned by Governor Dannel P. Malloy, provided in its 2012 report specific recommendations and action items to prepare for and respond to future storms.3 Among them was the creation of an interdisciplinary “Center for Research on Storm Hazard Mitigation and Power System Resiliency.” This would eventually become the Eversource Energy Center at the University of Connecticut.
Formed through a partnership between Eversource Energy and UConn, the Center comprises university experts, state organizations, and major utilities who collaborate within the framework of a Center of Excellence to enhance pre-paredness and infrastructure hardening, improve predictive accuracy regarding localized storm severity, and enable effective resource allocation for response to and recovery from extreme weather events. By marshaling the expertise of these various stakeholders through an integrated ana-lytical approach, we are able to develop a comprehensive assessment of the region’s most vulnerable “hot spots” for severe weather hazards, yielding strategies and actions to manage these threats. Importantly, research in the Center features a dynamic vision: it accounts for climate evolu-tion, as well as the changes in exposure and vulnerability to extreme weather events produced by different societal activities and demographics. n
6

Timeline of the Center’s Progress
In 2013–14, the seeds for the leading energy utility–university partnership in New England were planted with a pair of two-year pilot projects on outage forecasting and forest manage-
ment conducted by engineers at the University of Connecticut. Their results motivated Eversource Energy to make a $9 million, five-year investment in the formation of the Eversource Energy Center at UConn. The Center was inaugurated in 2015 with continuation of the two milestone pilot projects, while nine Phase I projects were funded in 2016–17. The results reported here are from the Phase I projects and subprojects. The Center is currently running nine Phase II projects. n
Pilot Projects
2013–14
Formation of the Center
2015
Phase I Projects
2016–17
Phase II Projects
2018–19
Key Initiatives
Through the Eversource Energy Center, UConn and Eversource Energy are joining forces to drive the
innovations and advances that will create the grid of the future—intelligent, interactive, automated, and safe. We catalyze multidisciplinary and collaborative research in five thematic areas:
• Storm outage forecasting• Tree and forest management• Cyber and physical security• Electric grid hardening• Electric grid modernization
As part of the UConn Tech Park initiative, the Center also enables Eversource Energy and other utilities, private indus-try, and the State of Connecticut to capitalize on UConn’s commitment to enhancing science, technology, engineering, and math (STEM) disciplines to address energy distribution challenges. The Eversource Energy Center collaboration puts Eversource at the fore-front of the state’s campaign to nur-ture and attract new industry that is heavily dependent on affordable, reliable, and green power. n
Strategic Partnerships
The Eversource Energy Center is establishing strategic partnerships nationally in the areas of grid resilience, security, and modernization.
With the Electric Power Research Institute, we are developing a collabo-ration on storm damage recovery and situational awareness. With the Gas Technology Institute, we are formulating research topics on remote sensing–based monitoring of natural gas and electrical infrastructure, electrical power line systems safety and automated detection algorithms, and post-event evaluations of natural force threats. Within UConn, we work with the Connecticut Institute for Resilience and Climate Adaptation (CIRCA) to address the “Sustainability and Resilience” theme of the university’s academic plan. Through this last collaboration we will enhance strategic risk-based decision making to address climate change and weather extremes and build a stronger academic and multi-disciplinary research environment at UConn.n
7

Center by the Numbers, 2016–18
Expenditures
Awarded Amounts
2016 $998,059
2017 2,158,683
2018 3,753,090
2016 $3,919,478
2017 2,543,393
2018 4,201,225
2019 (projected) 11,870,427
Students and Postdocs UNDERGRADUATES 17
GRADUATES 19
POSTDOC 1
AlumniPhD 11
MS 4
The Eversource Energy Center’s Power Outage Prediction Model
n October 28, 2011, a “Halloween nor’easter” that blasted through New England dumped heavy snow on trees still in leaf, bringing down branches, trees, and power lines and causing widespread outages that, in some
parts of Connecticut, lasted eleven days. The following year, in an effort to help utilities make
decisions that could improve restoration time after such extreme weather events, Eversource began working with
UConn to research and develop the Eversource Energy Center’s Outage Prediction Model.
The idea behind the OPM is to provide estimates of the number and location of outages to the overhead electrical distribution network that will be caused by severe weather. Outage predictions are based on a database developed by a project team consisting of Eversource person-nel and UConn staff and graduate students, using nearly fifteen years of Eversource data from significant storms.
To make accurate predictions, the OPM uses state-of-the-art technology and techniques. It works by comparing a current weather forecast against the database of 187 storm events (as of March 2, 2018) and associated outages and applying artificial intelligence to gain an understanding of the complex relationship among the weather, land surface conditions, electrical infrastructure, surrounding vegeta-tion, and the outages. Based on this understanding, the model predicts how many outages can be expected in each part of the service territory.
O
PublicationsPEER-REViEWED 31
8
Power Grid Storm Readiness

By telling them how many outages they can expect to be caused by a thunderstorm or nor’easter and where they can expect them to occur, the OPM helps electric utili-ties respond quickly and intelligently to impacts from weather. The information allows them to position and prepare their repair crews for the coming storm, as well as call in crews from other parts of the country before a single outage occurs.
The OPM has become an essential decision support tool for Eversource in its entire service territory covering Connecticut, Massachusetts, and New Hampshire, as well as for AVANGRID-CT. In addition, since 2017, the OPM team has developed systems for outage risk assessment of Eversource’s power grid based on the OPM tools.
During a series of nor’easters in March 2018, the OPM proved its worth. Eversource utilities with access to the OPM were better prepared and better able to restore power quickly to their customers than neighboring utilities. Extra help called in from places as far away as Arkansas and
Florida based on the informa-tion the model provided enabled
Eversource managers to achieve full recovery days before these neigh-
bors. OPM predictions will continue to help Eversource plan for needed resources, dispatch crews
in advance of storms, and significantly improve recovery times.
The OPM not only can predict power outages; it can help prevent them. By simulating changes to the electric grid, it can determine which will most effectively reduce the num-ber of outages seen in extreme weather. We are currently applying this method to help quantify the effect of differ-ent tree trimming strategies on the resilience of the grid.
In these ways, the Eversource Energy Center’s Outage Prediction Model benefits millions of people where they live and work. It has proved influential and valuable to Eversource Energy and is becoming a powerful tool to help researchers understand the complex interactions between the power grid infrastructure and the environment during extreme weather events. n
1–5
5–10
10–20
20–30
30–40
40–60
60–lnf
1–5
5–10
10–20
20–30
30–40
40–60
60–lnf
Territory Predicted Actual Trouble Spots Trouble Spots
Ui 120–250 360
CT 500–1,000 646
WMA 20–40 22
NH 200–400 78
EMA 2,000–3,500+ 4,874
Side-by-side comparison of OPM predictions and actual outages from
March 13–14, 2018, nor’easter.
OUTAGES PREDiCTEDBy OPM
ACTUAl OUTAGES
BY TOWN BY TOWN
9

Satellite image from the National Oceanic and Atmospheric Administration of a March 2, 2018, storm over the northeastern United States (above), with output for that day from the NWP model (right).
PhOTO CrEdIT NOAA National Environmental Satellite, data, and Information Service (NESdIS)
10
NWP models to determine how accurately they have rep-resented such atmospheric variables as wind speed, wind gust, and precipitation (ice, snow, and mixed), among oth-ers, during past extreme weather events of low, medium, and high impact. We are then developing techniques to estimate the uncertainty of weather forecasts and reduce forecast errors; and, finally, we are evaluating the uncer-tainty in the outage prediction models, as influenced by the uncertainty in weather forecasting.
Extreme Weather Forecasting has three main objectives. First, the project aims to improve the reliability of our predictions of extreme weather events with regard to loca-tion, duration, and intensity. Second, it aims to contribute to improvements in power outage prediction functionality and accuracy. And, third, it will benefit power utility, pub-lic, and government agencies by enabling them to prepare appropriately for prolonged power outages driven by major storms.n
Extreme Weather Forecasting
Severe weather is a major cause of power outages in electricity distribution networks. Weather-induced
blackouts on U.S. distribution grids have cost over $1 tril-lion in damage since the 1980s, with weather events like Storm Irene (2011) and Hurricane Sandy (2012) highlight-ing the need for improved disaster preparedness, response, and mitigation strategies. Nor’easters, as well as blizzards, tropical storms, and thunderstorms, are among the storms that most severely affect the grid.
The outage prediction models (OPMs) developed by the Eversource Energy Center at the University of Connecticut use geographical data, data on attributes of the electri-cal system, and, especially, numerical weather prediction (NWP) information to predict the impact of storms many days before they happen.
The Center’s Extreme Weather Forecasting project aims to assess the uncertainty and improve the accuracy of weather prediction so we can, in turn, more accurately predict the number, locations, and duration of power outages. We are accomplishing this by evaluating multiple high-resolution

The user interface of the ABM following a storm simulation; the sliders for initiating the variables are at left. The graphs and map update pe-riodically throughout the simulation to show the customers remaining without power, the number of individual outages remaining, and the routes the crews have traveled.
Restoration Time Estimation
Each year, lengthy power outages caused by extreme weather cost U.S. consumers between $20 billion and
$55 billion. With the rising frequency of extreme weather events, the potential for more frequent extended outages is rising as well. When outages happen, the emergency man-agers of most utility companies rely on experience alone to make crew allocation decisions.
A more comprehensive approach to crew allocation is agent-based modeling. ABM makes it possible to simulate the actions and interactions of a set of agents (such as utility crews) who are given defined rules (regarding, for example, outage repair times, how to prioritize repairs, paths taken between outages, rest periods, and so on) and are allowed to operate in a given environment (the utility grid in the state of Connecticut). A user of this model is able to test out strategies for allocating crews to determine which would most effectively reduce power restoration times and costs.
To create an agent-based model for this purpose, we developed its structure in consultation with Eversource
restoration managers and validated it with data from five historical storm events. The new ABM incorporates the road network and electric utility grid for Connecticut, crew rest periods, and area work center locations. Using it, restoration managers can simulate recovery scenarios to quantify the costs and benefits of alternative restoration strategies and determine which is best.
A user of ABM sees a map of Connecticut, along with sliders that can be adjusted to vary within possible ranges the number of crews working in different areas, their starting locations, outage repair times, and travel speeds, as well as to input search criteria to determine where crews should go after repairing each outage. Supplemental crews can be called and arrive after a set amount of time to simulate the cost and time benefits of using out-of-state crews.
This modular and scalable simulation can be applied to other regions or used to train emergency managers to improve their performance. It is also an important step to reduce outage durations after extreme weather events.n
11

Roadside Managementtormwise is an innovative and multifaceted forest management and public
education initiative that aims to reduce the risk of power outages and other damage caused by wind-related tree failure, especially along wood-ed roadsides and electricity distribution lines. Stormwise applies what
we know about growing trees to develop management strategies for more storm-resistant roadside woodlands that maintain the functions of forest
ecosystems and preserve their beauty, while reducing or at least shortening tree-related outages and extending intervals between trimming or management treatments.
Since roadside forest management to enhance storm resistance is a new and different idea for utilities, tree-work contractors, elected officials, homeowners, and others, Stormwise presents management concepts to interested audiences locally and at the state, regional, and national levels through numerous field workshops addressed to local groups, presentations at professional conferences, posters, radio interviews, and tours of a dozen demonstration sites established around the state of Connecticut.
The demonstration sites also host ongoing study of the effects of treatments on the forest ecological system, enabling land managers to make more informed
decisions about roadside management. n
Tree and Forest Management
Tom Worthley, forestry professor at UConn, gives a
tree felling demonstration in a
field workshop at a roadside forest
site.
Stormwise forest management follows this general process.
Photo: Eric hansen
S
12
Graduate student Julia Rogers wrangles several plant subjects (representing four species, two native and two invasive) for a study of “Edge Effects on Plant Communities in Stormwise Management Sites.”
Lower-density post-treatment desired condition: Removing undesirable trees and creating more growing space for acceptable ones encourages healthy growth and the development of more wind-firm features, creating a stand that is more resistant to storm damage.
10–15 years later: re-evaluate
Identify acceptable low trees:Within roadside stands are many healthy, robust, straight trees with balanced crowns that present little risk to power infrastructure.
Identify and remove high-risk trees:There are also diseased or dying trees, or trees with visible structural defects and/or pronounced lean to the ROW, and these do present a risk to roads and wires.
Current conditions:Along much of the roadside in southern New England, are dense woodlands of maturing trees, growing under stressful conditions.

Remote Sensing for Monitoring Vegetation
Utility companies maintain power grids containing thousands of miles of power lines, hundreds of thou-
sands of poles, and a great deal of equipment, all of which need to be kept intact to keep our lights on. Airborne laser scanners and cameras are now helping utilities keep an eye on the grid to help find problems before they happen. At the Eversource Energy Center, we have used 3D remote sensing to map trees that are close to the power lines across the state. Now we are combining that information with information on other environmental conditions to show where trees are most likely to break and cause damage to the lines.
Our goal has been threefold. First, we created a map show-ing areas where trees pose a risk to individual power line circuits. Now we are developing an algorithm to update this “risk map” over time by simulating vegetation growth. The product of these efforts will meet the third part of our goal: the development of a new tool that shows utility com-panies where the risks are and helps them prioritize areas
A 3D rendering of roadside vegetation mapped with an unmanned aerial vehicle (UAV).
for reducing those risks through vegetation management and installation of stronger poles and power lines. This tool will also help other scientists at the Eversource Energy Center predict where problems are likely to occur before a storm strikes so utility companies can be better prepared for the resulting outages. n
Biomechanical Assessment of Roadside Forest
Trees are the biggest cause of power outages during storms. In Hurricane Irene, which left 754,000 customers in
Connecticut—about 50 percent—without power in August 2011, an estimated 90 percent of the outages were caused by falling trees or branches. Full restoration took over a week, particularly in rural or forested areas, even with help from as far away as British Columbia. This situation is especially prev-alent in southern New England, a densely populated area that is also densely forested. Nearly half of forest land is within three hundred feet of development and, generally, roadside forest has been left to grow unmanaged for the last century.
The Biomechanical Assessment Project was initiated to monitor tree sway in the roadside forests of southern New England, to improve our understanding of the motion characteristics of trees and see what changes take place after a thinning operation. Our findings are helping us learn how best to manage roadside forests to increase their “wind-firmness” and reduce tree-related storm damage to utility infrastructure. Since 2012, three study sites have been established along roadsides in Storrs, Torrington, and Orange, Connecticut. They differ in terms of soil types, forest conditions, and other characteristics, but all are common for southern New England. Within the sites, we have been monitoring forty-one individual trees, representing nine species and
13
Managing the roadside forest to foster stout tree forms has the potential to increase sway frequency and tree
resistance to wind throw.Tree sway frequency increases with loss of foliage, freezing
temperatures and more stout trees forms .

a wide range of sizes. We tracked their sway motion for a year, followed by a crown thinning at each site. The data gathered before thinning have been used in several analyses to determine what factors of weather, tree architecture, and the surrounding forest affected the sway motion, and we continue to monitor the sway of the trees for changes resulting from the thinning. Meteorological towers maintained at each site mea-sure ambient temperature as well as wind speed and direction.
Our analysis revealed that, of twenty-five potential variables, only four were significant in predicting the frequency with
Human Dimension to Roadside Forest Management
To maintain the power grid in areas where people work and live, utilities must regularly interact with residents
and other members of the public regarding tree and veg-etation management. Among the public, however, many
Left: Informational brochure and consent form packet for residential vegetation management. Right: A utility crew trims branches for roadside vegetation management.
14
which a tree sways back and forth: the presence or absence of foliage, freezing temperatures, tree slenderness, and the height to the tree crown. These findings highlight the relationship between sway frequency and the size and shape of the trees in closed-canopy forests. Given what we know about the relationship between sway frequency and the stability of trees in windstorms, roadside forests may be managed to increase wind-firmness and reduce tree-related storm damage to utility infrastructure. n
different perspectives and opinions exist about the tree trimming and removal that takes place to maintain reliable power.
UConn researchers are using social science tools to evalu-ate potential opportunities for and barriers to the imple-mentation of Stormwise management strategies across Connecticut towns, conducting in-depth interviews with key stakeholders in community vegetation management and surveys of residents to understand their perceptions.
Through our work, we are exploring the needs of homeown-ers, private landowners, municipal and other public officials, professional organizations, and tree and forest managers, among others, to find out under what conditions they are willing to adopt Stormwise tree management strategies. We are even learning what the public believes are the best uses of the wood resources produced by tree management efforts in local communities.
With our findings, we will provide guidance for management activities intended to improve the stability of forests near util-ity infrastructure. Our results will also help utilities and others who manage the roadside forest understand and consider pub-lic perceptions about tradeoffs between vegetation manage-ment practices to maintain both reliable power and aesthetics and other environmental services provided by trees. n
Slender trees in the UConn Forest (left) and a stout-shaped tree on the UConn Great Lawn (right). Closely grown for-est trees develop slender trunks, and the crown forms high in the canopy, resulting in lower sway frequencies. Trees grown in the open have lower crowns, stouter trunks, and higher sway frequencies, which are associated with greater wind-firmness. Forest management aimed at developing characteristics of the open-grown trees has the potential to increase wind-firmness of a forest stand.
Photo: Amanda Bunce

Grid Vulnerability AssessmentSubstations’ Risk of Flooding
he ability to assess the risk of flooding is es-sential to utilities. Knowing what to expect from an incoming inundation allows power restoration departments to allocate their resources efficiently to deal with outages and
improve their preparedness for whatever other challenges the flooding may bring.
The goal of the flood vulnerability project is to develop a real-time early warning system by integrating existing meteorological, hydrological, and hydraulic models to estimate potential flood damage and the risk posed by incoming storms to Eversource substations in Connecticut and Massachusetts.
Our first step in developing the system will be to estimate the frequency of 100- to 500-year floods for the entire riv-er network flowing through the Connecticut, Housatonic, and Thames rivers, encompassing both Connecticut and Massachusetts substations, based on a hydrological framework developed at the Eversource Energy Center in a 2016–17 project.
Second, we will develop a daily flood forecasting system tailored to the substation locations, using weather forecasts and hourly precipitation data from radar to predict floods up to three days in advance and issuing warnings when they are expected to rise above a given level. We will also incorporate data on upstream river flow, coastal storm surge, tides, and sea-level rise into hydrological and hy-draulic models to forecast the extent and depth of inunda-tion to which critical substations will be subjected during floods of varying frequencies and levels.
For coastal rivers, we will overlay the surge, tide, and sea-level rise to form hydrographs—that is,
plots of time series of streamflow stage height—from the river in-
flow and oceanic backwater, respectively. Finally, we
will forecast inunda-tion extent and depth of critical substation levels by running a
T
hydraulic model with synthetic hydrographs derived in the previous step.
The product of our integration of these models will be maps, like the one shown, depicting the extent and depth of inundation expected for floods of varying severity. n
Map produced by integration of existing meteorological reanalysis data and hydrological and hydraulic models, showing 100-year return period river flood peak in Connecticut and Massachusetts (top) and detail of inundation in Freight St., Waterbury, CT, along the Naugatuck River (bottom).
15

Substation Physical Security
Personal unmanned aerial vehicles (UAVs) are commonplace throughout
the United States—so commonplace, in fact, that many who see them may not give them a second glance. Most of the time, the operators of personal UAVs are using them just for recreation or work. Unfortunately, however, the possibility of their causing dam-age to the electric grid is very real, whether from accidental crashes or from malicious use for spying or as weapons. In 2016, a drone crashed into power lines in Sichuan, China, and caused a six-hour blackout, and a UAV collided with a nuclear power plant in South Africa. Both incidents were believed to be due to amateur operator error. In Iraq, how-ever, modified commercial UAVs have been used by terror-ists to drop explosives on Iraqi soldiers. Similar threats are foreseeable in the United States, where electrical substations
An “off-the-shelf” commercial unmanned
aerial vehicle.
are vulnerable to accidental UAV crashes and the potential for large disruptions caused by power outages may make them a prime target for terrorist activity.
The Eversource Energy Center’s Substation Physical Security project will be exploring ways utilities can detect UAVs that fly near their substations and prevent them from physically approach-
ing vital equipment. Many of the remote sensing technolo-gies we use for monitoring the power grid can also be used to detect UAVs, and a number of companies already have products available for this purpose. The project team will be testing some of these products to see how well they work and whether they are practical and cost-effective to use at Eversource facilities. We will also seek some low-tech solu-tions, like the deployment of cages or netting, for keeping UAVs away from important electrical equipment. n
A utility pole, as seen in a LiDAR point cloud.
Evaluating LiDAR Technologies
Remote sensing technology is revolutionizing the way we
monitor our electricity infrastruc-ture. In a matter of days or even hours, a sensor carried by a motor vehicle or aircraft can gather valu-able data across an entire utility network. Images collected by aircraft can have resolutions high enough for users to see utility poles and wires. Light Detection and Ranging (LiDAR) devices can collect millions or even billions of measurements per square mile, providing an incredibly detailed, three-dimensional view of any objects in the area.
These amazing technologies are not yet yielding their full benefits to science or society, however. Although humans can easily see objects—like utility poles and wires—in both airborne imagery and LiDAR datasets, us-ing our own brains to get enough information out of these datasets to be useful is very time consuming and tedious. Far better would be if we could teach a computer to get that information for us.
The goal of the Evaluation of LiDAR and Alternative Technologies for Monitoring Roadside Vegetation and Utility Infrastructure project is to write software that will allow computers to get detailed information auto-matically about the condition of utility poles and wires from remote sensing data. The project aims to go beyond simply mapping poles and wires to measuring pole heights and lean, wire sag, and other important specifications. Also to be developed are computer models and simulations engineers can use to determine whether the poles are up to the job of holding up the wires and equipment attached to them, as well as identify the trees and branches that might fall on them in stormy conditions.
Ultimately, as a result of the Evaluation of LiDAR and Alternative Technologies project,
utility engineers will be able to accomplish in days at the office what used to take them months in the sometimes hazardous field. Utility companies will be able to look at much more of their utility networks each year and find problems sooner. And engineers will be able to do their work in greater safety. n
16

Utility Infrastructure Mapping
Even with the rapid advancements in technology, some remote sensing jobs are still best carried out by people.
One of these is the Utility Infrastructure Mapping Project currently underway at UConn’s Eversource Energy Center.
Within its Connecticut service area, Eversource has about 27,000 kilometers of power lines and 750,000 poles. The planning of upgrades and vegetation management to im-prove reliability and ensure efficient response to widespread power outages both depend on having accurate maps of this vast network. A monumental task last carried out fif-teen years ago, the mapping of Eversource’s utility lines and poles took twelve months, a small army of workers, and the best GPS technology available to complete. Despite this enormous effort, a recent assessment using re-mote sensing imagery showed the resulting map was less accurate than expected, with the pole locations off by an average of more than ten meters.
Today, remote sensing allows us to create far more accurate maps, taking much less time and effort and at much lower cost. In 2016, the Connecticut state government purchased highly detailed aerial images across the state, which it has made freely available to the public. These datasets clearly show the loca-tions of nearly all utility poles—except for those in areas with the heaviest tree cover. Students at the Eversource Energy Center have been using the data to map utility poles and lines manually. Although the work is tedious, humans are far better than com-puters at using images for this purpose.
So far, our students have spent a total of 1,400 hours on the project and mapped utility poles and lines for forty-two towns in Connecticut, account-ing for nearly 90 percent of the utility poles in each town. We estimate that completing the maps for the remaining towns in Eversource’s Connecticut service area will take an additional 3,500–5,000 hours.
Original maps (power line shown in yellow) created with GPS in the early 2000s are much less accurate than maps created using modern aerial imagery (power line in green).
Because the data are free and the required skill is entry lev-el, taking this approach statewide will cost less than 5 per-cent of what it would to have third-party contractors create the maps using Light Detection and Ranging (LiDAR) technology. The very positive result is that Eversource gets a bargain rate for high-accuracy maps, and the students get professional experience.
In addition, these maps will allow Eversource to make much more efficient use of remote sensing to evaluate the condition of poles and wires and rapidly assess storm dam-age, and they will provide researchers with an important tool that will improve their predictions of where outages are likely to occur before a storm hits so Eversource can prepare more effectively. n
17

Of all solar activities, geomagnetic disturbance (GMD) has the greatest effect on the Earth’s
magnetic field. In recent decades, GMDs have received much attention because of their extensive impact on different types of infrastructure installa-tions and interconnected systems, such as pipelines, telecommunication systems, and, especially, power transmission grids. During a solar storm, geomag-netically induced direct currents can enter transform-ers through their ground connections and overload them, causing extreme temperature spikes that can go on for hours at a time. Their cumulative effects lead eventually to power outages and unacceptable down time, and to high replacement costs as the transformers fail altogether. On March 13, 1989, for instance, GMDs caused a blackout in Quebec whose net cost was about $13.2 million. To make matters worse, such expensive units are usually built to order, with long delivery times.
The study of a complex phenomenon like GMD to assess its impact on large-scale power systems provides a bet-ter understanding of the problem, allowing us to develop ways to mitigate it. To date, however, most comprehensive studies of GMD impacts on power grids in the United States have looked at the effects of solar storms on high-voltage alternating current (HVAC) grids. As Eversource adopts high-voltage direct current (HVDC) technology, with its better efficiency and stability, to transmit hydro-power from Canada, potential GMD-induced risks for HVDC and HVAC/HVDC–interconnected systems must be investigated.
Grid Hardening against Geomagnetic Disturbance
The goal of the HVDC grid hardening project is to gain vital knowledge about the GMD problem by modeling Eversource’s interconnected HVAC/HVDC network, including all components susceptible to damage from GMDs, and assessing various scenarios that might arise as the result of solar storms. To this end, the UConn team will verify the performance of Eversource’s HVAC system based on existing research and extend the study to examine fully the characteristics of the HVDC system so ways to mitigate the problem may be developed. n
18
Schematic of a geomagnetic disturbance.
Fluctuating electrojet
(Millions of amps)
Magnetic field from electrojet induces voltage potential on
the surface of the earth

Many different options are available to increase the resilience of the overhead electrical distribution sys-
tem in the wake or antici-pation of severe weather or
security events. These include trimming trees near power lines, installing stron-ger poles, and improving the design of electricity distribution systems, among others. The question is, which of these methods will be most cost-effective in reducing power outages? Our UConn team is developing a total system assess-ment (TOSA) physics-based modeling framework to provide answers using a series of databases, including informa-tion on observed or predicted weather and the condition of the physical pole–wire system.
The TOSA model is designed to inte-grate key parameters and different types of such datasets from many sources to establish a modeling framework for effectively assessing the power grid on a system level, with the goal of mak-ing recommendations for resilience intervention.
The results TOSA generates will sup-port solutions that account for power demand, power supply, grid structure, climate, population growth, business value and economic impact, and soil behavior, while meeting the challenges of business and engineering constraints, such as limited availability of capital, utility crews, and equipment. This sup-port in the management of its power grid assets will help Eversource make the best possible decisions for enhancing the resilience of its power systems, to the benefit of the people of Connecticut and other New England states. n
The structure of the TOSA model in schematic form and the interplay among different datasets and processes.
Total System Assessment Model
Grid Resilience
In this prediction based on 76 storm events, replacement of 10 percent of the old poles is expected to reduce outages by 26 percent.
SCENARIO PREdICTEd OUTAGES PERCENT REdUCTION
Baseline 13,874 0
1% replacement 12,748 8.12
10% replacement 10,256 26.08
50% replacement 4,438 68.01
19
Baseline
1% replacement10% replacement50% replacement

Utility Resiliency Investment Planning
The extensive damage wrought by hurricanes on Connecticut’s aging electrical infrastructure in recent
years has focused the attention of state regulatory agencies on the need for investment in resilience activities to speed up recovery from outages. The objective of the Planning Electric Utility Resiliency Investments project is to find out how utilities can best direct their resilience investments to minimize the amount of time customers are without power following an extreme weather event.
In the first part of a two-part model, we determine the optimal actions to take in each segment of the electrical network, such as a circuit or isolation zone, under incrementally increasing budget constraints. Each segment is defined in terms of several variables, such as severity of weather, number of customers, length of circuit, and so on. Our model minimizes the sum of the System Average Interruption Duration Index (SAIDI)—a reliability indicator commonly used by electric power utilities to express the average outage duration for each customer served—over a given time period over all resilience actions that can be taken in that segment of the network.
Different segments of the electrical network have different numbers of customers, so, once the model is run for all segments, we multiply SAIDI by the number of customers to get total customer minutes interrupted (CMI) over the entire electrical network per year—a figure that will determine how much of the total budget should be allocated to each segment—and then, based on the solution generated by part 1 of the model, we can determine in part 2 the optimal resilience action to take for that segment that year. Such activities may include enhanced tree trimming (ETT), indicated for segment 1 in the table at right, electrical hardening (EH, segment 2), standard maintenance trimming (SMT, segment 1,000), and so on. In some cases, such as segment 3, the model may recommend no action be taken this year—a finding that will prevent the expenditure of limited funds on activities that may not improve resilience. The Planning Electric Utility Resiliency Investments project is ongoing, and we are presently in the process of evaluating the impact our model will have on resilience investments at Eversource. n
Optimal actions recommended based on Eversource’s overall budget for resilience improve-ment. Segments are defined in terms of several variables, such as severity of weather affecting that circuit, number of customers in the circuit, length of circuit, and so on.
20
Budget consumed (thousands of dollars)
Bud
get
Co
nsum
ed (
tho
usan
ds
of
do
llars
)
The results of optimal allocation of budget to re-silience actions for a sample of ten segments over five years. As the budget for resilience increases, SAIDI goes down. Note that the effectiveness of similar resilience investments in reducing SAIDI varies for the different segments.

Economic Value of Avoided Outages
A new study by the Connecticut Center for Economic Analysis (CCEA) looks at the economic
benefits of tree trimming in terms of reducing the cost and duration of nonresidential outages. The Benefit of Investing in Resiliency: A Dynamic Economic Analysis examines the economic impacts of tree trimming carried out by Eversource in Connecticut counties over the past five years. The results justify support in the rate base for funding tree trimming, finding, not surprisingly, the most benefit when the weather is at its worst—for ex-ample, in the wake of Hurricane Sandy in 2011 and the sequential severe spring storms of this year. With global warming likely to increase the frequency and intensity of storms, the study underlines the long-term importance of this maintenance.
For its analysis, CCEA estimated direct economic impacts as production foregone and total economic impacts over time, utilizing the interindustry relationships from Regional Economic Model Inc., Policy Insight (REMI-PI), its dynamic model of Connecticut’s economy (see http://www.remi.com). CCEA impacts cover all major economic indicators, includ-ing employment and various income and fiscal outcomes.
The study found that, during the year following trimming, the number and duration of electrical outages of five minutes or more decreased among industries whose reliance on a sus-tained supply of electricity makes them vulnerable to power interruptions; examples include manufacturers using robots or electrolysis and retailers and wholesalers of frozen foods.
Our estimated benefits likely understate the true benefits of tree trimming because they do not include the impact of outages of less than five minutes or of outages on residential users. n
Evaluation of Unintentional Islanding he deepening integration of distributed energy
sources (DERs) into power grids in the United States has worryingly increased the likelihood of unintentional island-ing of feeders—that is, the
situation that occurs when a DER connected to a feeder
continues to power a location even when the grid supply is disconnected. This serious hazard to both unsuspect-ing customers and crews working to restore power during outages has rapidly escalated with the rising frequency of storm-induced blackouts, in which DER units may
continue to energize power lines from homes or busi-nesses. Also of concern for power distribution
planning and operations is whether the continuing proliferation of DERs
n DPI: Vulnerable at average benefits
n DPI: Vulnerable receive all benefits
n PI: Vulnerable at average benefits
n PI: Vulnerable receive all benefits
55
40
25
10
–5
PI and DPI by Connecticut County, 2013–18
Mill
ion
s o
f cu
rre
nt
do
llars
Grid Modernization
T
21

will increase the risk that unintentional islanding will escape detection, leaving crews unaware of and unpro-tected from the danger. How, then, can utility companies reliably assess the unintentional islanding hazards of an arbitrary feeder where DERs are especially numerous?
Eversource Energy has been working with engineers at the University of Connecticut to devise a method for quantifying effectively the risks of unintentional islanding in non-detection zones (NDZs)—that is, the regions in which islanding detection schemes fail to detect the abnormal islanding mode. DER-Driven Non-Detection Zone (D2NDZ) is a practical, learning-based tool for assessing the hazard of unintentional islanding.
The idea behind D2NDZ is to construct a baseline NDZ determined by the steady state of the feeder and then augment this baseline by incorporating the dynamic impacts of DERs. The baseline NDZ is derived from a rigorous theoretical analysis, and the dynamic impacts of DERs are extracted from detailed simulation-based data on extensive Eversource feeders, which are generated by a project team consisting of Eversource personnel and UConn graduate students.
The bottom figure at right demonstrates the overall unintentional islanding risk levels of one feeder, validating that the D2NDZ results are extremely close to those obtained from detailed simulation-based methods.
To date, a software tool with an easy-to-use Excel interface has been developed and successfully deployed by Eversource Energy for the planning and operation of DER interconnections. In the future, operators will be able to update the experimental database and system operation information online, which will enable D2NDZ to serve as a real-time tool for running unintentional islanding analytics. The data-driven, learning-based approach of D2NDZ will potentially reduce utility engineers’ case study time from months to just a few minutes, making it a promising tool U.S. power utilities can use to protect both their customers and their workers. n
Unintentional islanding frequencies assessment.
Impact of loads on baseline NDZ.
22
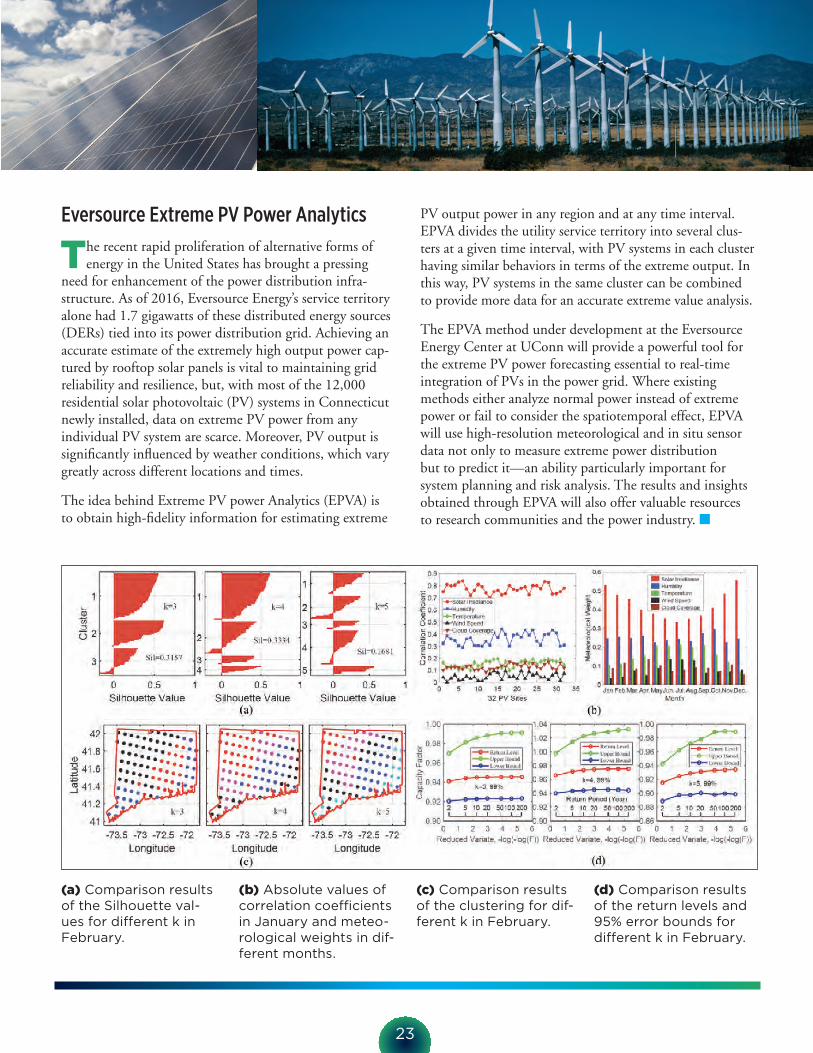
Eversource Extreme PV Power Analytics
The recent rapid proliferation of alternative forms of energy in the United States has brought a pressing
need for enhancement of the power distribution infra-structure. As of 2016, Eversource Energy’s service territory alone had 1.7 gigawatts of these distributed energy sources (DERs) tied into its power distribution grid. Achieving an accurate estimate of the extremely high output power cap-tured by rooftop solar panels is vital to maintaining grid reliability and resilience, but, with most of the 12,000 residential solar photovoltaic (PV) systems in Connecticut newly installed, data on extreme PV power from any individual PV system are scarce. Moreover, PV output is significantly influenced by weather conditions, which vary greatly across different locations and times.
The idea behind Extreme PV power Analytics (EPVA) is to obtain high-fidelity information for estimating extreme
PV output power in any region and at any time interval. EPVA divides the utility service territory into several clus-ters at a given time interval, with PV systems in each cluster having similar behaviors in terms of the extreme output. In this way, PV systems in the same cluster can be combined to provide more data for an accurate extreme value analysis.
The EPVA method under development at the Eversource Energy Center at UConn will provide a powerful tool for the extreme PV power forecasting essential to real-time integration of PVs in the power grid. Where existing methods either analyze normal power instead of extreme power or fail to consider the spatiotemporal effect, EPVA will use high-resolution meteorological and in situ sensor data not only to measure extreme power distribution but to predict it—an ability particularly important for system planning and risk analysis. The results and insights obtained through EPVA will also offer valuable resources to research communities and the power industry. n
(a) Comparison results of the Silhouette val-ues for different k in February.
(b) Absolute values of correlation coefficients in January and meteo-rological weights in dif-ferent months.
(c) Comparison results of the clustering for dif-ferent k in February.
(d) Comparison results of the return levels and 95% error bounds for different k in February.
23

2018
1. Borochin, P., and Y. Zhao, 2018: Identifying Recommended Funding Levels of Power Grid Resilience Programs, IEEE Transactions on Power Systems (in review).
2. Bunce A., J.C. Volin, D.R. Miller, J. Parent, M. Rudnicki, 2018: UCONN Tree Sway Biomechanics Project (pre-thinning tree sway and weather data), DOI: 10.17632/65z8hkzfz7.2
3. Cerrai D., E.N. Anagnostou, et al., 2018: Improving Predictability of Storm Power Outages by Evaluating a New Representation of Weather and Vegetation in Non-parametric Modeling, International Journal of Forecasting (submitted)
4. Destro E., W. Amponsah, E.I. Nikolopoulos, L. Marchi, F. Marra, D. Zoccatelli and M. Borga, 2018: Coupled prediction of flash flood re-sponse and debris flow occurrence: application on an alpine extreme flood event, Journal of Hydrology, 558, 225-237.
5. Li Y., P. Zhang, J. N. Debs, D. A. Ferrante, D. J. Kane, S. N. Woolard, R. Kalbfleisch, and K. B. Bowes, A Generic Method for the Determination of Non-Detection Zone in DER-Dominated Distribution Grids, IEEE PES General Meeting (under review).
6. Marra, F., E. Nikolopoulos, E.N. Anagnostou, and E. Morin, 2018: Metastatistical Extreme Value analysis of hourly rainfall from short records: estimation of high quantiles and impact of measurement errors, Advances in Water Resources, Volume 117, Pages 27-39, https://doi.org/10.1016/j.advwatres.2018.05.001.
24
Bibliography7. Nikolopoulos E.I., E. Destro, A.E. Bhuiyan, M.
Borga, and E.N. Anagnostou, 2018: Evaluation of predictive models for post-fire debris flows occur-rence in the western United States, Nat. Hazards Earth Syst. Sci., 18, 2331-2343, https://doi.org/10.5194/nhess-18-2331-2018, 2018
8. Shen X., E.N. Anagnostou, and G.H. Allen, 2018: Near Real-Time (NRT) Flood Inundation Mapping by Synthetic Aperture Radar (SAR), Remote Sensing of Environment (in review).
9. Wanik D., E. N. Anagnostou, T. Layton, B. M. Hartman, 2018: Estimated Time of Restoration (ETR) Guidance for Electric Distribution Networks, Journal of Homeland Security and Emergency Management, https://doi.org/10.1515/jhsem20160063.
10. Yang, J., M. Astitha, L. Delle Monache, S. Alessandrini, 2017: An Analog technique to improve storm wind speed prediction using a dual NWP model approach, Monthly Weather Review (in press)
11. Yuan, H., W. Zhang, J. Zhu, and A.C. Bagtzoglou, 2018: Resilience Assessment of Overhead Power Distribution System under Strong Winds for Hardening Prioritization, ASCE-ASME Journal of Risk and Uncertainty in Engineering Systems, Part A: Civil Engineering (under revision after review).
12. Zhang P., Z. Tang, J. Yang, K. Muto, X. Liu, M. Astitha, J.N. Debs, D.A. Ferrante, D. Marcaurele, I.M. Hazlewood, and D. Hedman, PV Extreme Capacity Factor Analysis, IEEE PES General Meeting (under review).

25
2017
13. Bartsotas N., E.I. Nikolopoulos, E.N. Anagnostou, S. Solomos, G. Kallos, 2017: Moving towards sub-km modeling grid spacings: Impacts on atmospheric and hydrological simulations of extreme flash-flood inducing storms, Journal of Hydrometeorology, 18(1), 209-226.
14. Frediani M., T. Hopson, J. Hacker, E.N. Anagnostou, L. Monache, F. Vandenberg, 2017: Object-Based Analog Forecasts for Surface Wind Speed, Monthly Weather Review, Vol 145 (12), 10.1175/MWR-D-17-0012.1
15. Li Y., P. Zhang, L. Zhang, and B. Wang, 2017: Active synchronous detection of decep-tion attacks in microgrid control systems, IEEE Trans. Smart Grid, vol. 8, no. 1, pp. 373-375, Jan. 2017.
16. Li Y., P. Zhang, W. Li, J. N. Debs, D. A. Ferrante, D. J. Kane, S. N. Woolard, R. Kalbfleisch, and K. B. Bowes, 2017: Non-detection zone analytics for un-intentional islanding in distribution grid integrated with distributed energy resources, IEEE Transactions on Sustainable Energy (under review).
17. Maggioni V., E.I. Nikolopoulos, E.N. Anagnostou and M. Borga, 2017: Modeling satellite precipita-tion errors over mountainous terrain: the influence of gauge density, seasonality, and temporal resolu-tion, IEEE Transactions on Geosciences and Remote Sensing, PP(99), 1-11.
18. Mei, Y., E.N. Anagnostou, X. Shen, and E.I. Nikolopoulos, 2017: Decomposing the satellite precipitation error propagation through the rainfall-runoff processes. Advances in Water Resources, 109, 253-266.
19. Mei Y., X. Shen and E.N. Anagnostou, 2017: A Synthesis of Space-time Variability in Multi-component Flood Response. Hydrology and Earth System Sciences, vol. 21, pp.2277-2299.
20. Nikolopoulos E.I., E. Destro, V. Maggioni, F. Marra and M. Borga, 2017: Satellite-rainfall estimates for debris flow prediction: An evaluation based on rainfall accumulation-duration thresholds. Journal of Hydrometeorology, 18(8), 2207-2214.
21. Orekan T., P. Zhang, and C. Shih, 2017: Analysis, design and maximum power efficiency tracking for undersea wireless power transfer, IEEE Journal of Emerging and Selected Topics in Power Electronics, Aug. 4th, 2017, DOI: 10.1109/JESTPE.2017.2735964.
22. Orekan T., and P. Zhang, 2017: Modelling and maximum power extraction of a novel smart wave energy converter, IEEE Transactions on Industrial Electronics (under review).
23. Shen X., Yiwen Mei and Emmanouil N. Anagnostou, 2017: A Comprehensive Flood Events Database in Continental United States. Bulletin of the American Meteorological Society, DOI: 10.1175/BAMS-D-16-0125.1.

24. Shen X., and Emmanouil Anagnostou, 2017: A Framework to Improve Hyper-Resolution Hydrologic Simulation in Snow-Affected Regions. Journal of Hydrology, vol.552, pp.1-12, DOI:10.1016/j.jhydrol.2017.05.048.
25.Wanik D., E.N. Anagnostou, M. Astitha, B. M. Hartman, M. E. B. Frediani, G. M. Lackmann, Jichao He, J. Yang, 2017: A Case Study on Power Outage Impacts from Future Hurricane Sandy Scenarios, Journal of Applied Meteorology, https://doi.org/10.1175/JAMC-D-16-0408.1.
26.Wanik D., J. Parent, E. N. Anagnostou, B. M. Hartman, 2017: Using Vegetation Management and LiDAR-Derived Tree Height Data to Improve Outage Predictions for Electric Utilities. Electric Power Systems Research, Volume 146, Pages 236–245.
27. Yang J., M. Astitha, E. Anagnostou, B. Hartman, 2017: Using a Bayesian regression approach on dual-model weather simulations to improve wind speed prediction, Journal of Applied Meteorology and Climatology, Vol 56, 1155-1174, DOI: 10.1175/JAMC-D-16-0206.1.
2016
28.Frediani, M. E. B., Hacker, J. P., Anagnostou, E. N., Hopson, T., 2016: Evaluation of PBL Parameterizations for Modeling Surface Wind Speed During Storms in the Northeast U.S., Weather and Forecasting, DOI: http://dx.doi.org/10.1175/WAF-D-15-0139.1
29. He J., D.W. Wanik, B. M. Hartman, E. N. Anagnostou, M. Astitha, 2016: Nonparametric Tree-based Predictive Modeling of Storm Damages to Electric Distribution Network, Risk Analysis, DOI: 10.1111/risa.12652
30. Shen X., E. N. Anagnostou, Y. Mei and Y. Hong (2016), A Global Distributed Basin Morphometric Dataset, Nature-Scientific Data, 4:160124, DOI: 10.1038/sdata.2016.124.
2015
31. Wanik D., E. N. Anagnostou, B. M. Hartman, M. E. Frediani, M. Astitha, 2015: Storm Outage Modeling for an Electric Distribution Network in Northeastern US, Natural Hazards, Volume 79, Issue 2, pp 1359-1384.
26

Eversource Energy CenterInnovation Partnership Building
159 discovery driveStorrs, CT 06269
[email protected] www.eversource.uconn.edu

EVERSOURCE ENERGY CENTERA utility-university partnership at UConn
www.eversource.uconn.edu