1QFY17 Canara Bank - bsmedia.business-standard.com
12
25 July 2016 1QFY17 Results Update | Sector: Financials Canara Bank BSE SENSEX S&P CNX CMP: INR254 TP: INR240(-6%) Neutral 28,095 8,636 Bloomberg CBK IN Equity Shares (m) 543.0 M.Cap.(INRb)/(USDb) 137.8 / 2.0 52-Week Range (INR) 360 / 156 1, 6, 12 Rel. Per (%) 14/23/-9 12M Avg Val (INR M) 821 Free float (%) 33.7 Financials & Valuations (INR b) Y/E Mar 2016 2017E 2018E NII 97.6 98.4 110.7 OP 71.5 76.0 87.1 NP -28.1 13.8 18.9 NIM (%) 1.9 1.9 1.9 EPS (INR) -51.8 25.4 34.8 EPS Gr. (%) NM NM 37.1 BV/Sh. (INR) 477 497 524 ABV/Sh. (INR) 227 269 326 RoE (%) -10.8 5.2 6.8 RoA (%) -0.5 0.2 0.3 P/E (x) -4.9 10.0 7.3 P/BV (x) 0.53 0.51 0.48 P/ABV (x) 1.12 0.94 0.78 Weak core operating performance continues; NSL increases 40bp QoQ Canara Bank (CBK) reported a 41% PAT miss, led by weak core PPoP growth (- 59% YoY) and elevated credit costs (1.8%), partly offset by high trading gains (186% of PBT). Gross slippages moderated to INR38.8b (4.8% of loans, annualized) vs. INR146b (17.7%) in 4QFY16. More importantly, net slippages decreased to 2.5% (annualized) v/s 16.8% a quarter ago. Management expects the strong trends in upgrades/recoveries (INR18.4b) to continue with a full-year target of INR80- 100b. Overall GNPA increased 2% QoQ, and GNPA ratio stood at 9.7%. Net stressed loans increased 40bp QoQ to 10.9%. OSRL ratio increased to 4.2% (+14bp QoQ) and, excluding SEB/aviation, it now stands at 3.7% of loans. Relapse from restructured loans was INR860m. In 1QFY17, CBK refinanced INR2.9b under the 5:25 scheme (all standard accounts), and converted ~INR15b into equity under SDR (all standard restructured). Further, five accounts were referred under the S4A scheme amounting to INR23.7b. Cumulative stock under 5:25 refinancing, SDR and S4A now stands at 4.7% of loans (largely standard). Other highlights: (a) Loan growth remained muted (-1% YoY), (b) Opex grew 28% YoY albeit on a lower base and (c) CET 1 ratio stood at 8.21%. Valuation and view: Overall, we expect CBK’s stress addition to remain elevated in FY17, and an improvement in the economic environment holds the key to its growth (infrastructure accounts for 17% of total loans). A large proportion of stressed loans (in various forms), moderate PCR ratio (33.5%) and weak capital position (CET1 at 8.2%) remain the key concerns. We cut earnings by ~18% for FY17-19E led by lower core income growth and higher credit costs. The stock’s headline valuation appears attractive, although the gap between BV and ABV remains significant. Remain Neutral with a target price of INR240 (0.46x FY18 BV). Investors are advised to refer through important disclosures made at the last page of the Research Report. Motilal Oswal research is available on www.motilaloswal.com/Institutional-Equities, Bloomberg, Thomson Reuters, Factset and S&P Capital. Alpesh Mehta ([email protected]); +91 22 3982 5415 Krishnan ASV ([email protected]); +91 22 3010 2603 / Dhaval Gada ([email protected]); +91 22 3982 5505 Motilal Oswal values your support in the Asiamoney Brokers Poll 2016 for India Research, Sales and Trading team. We request your ballot.
Transcript of 1QFY17 Canara Bank - bsmedia.business-standard.com

25 July 2016
1QFY17 Results Update | Sector: Financials
Canara Bank
BSE SENSEX S&P CNX CMP: INR254 TP: INR240(-6%) Neutral 28,095 8,636
Bloomberg CBK IN Equity Shares (m) 543.0 M.Cap.(INRb)/(USDb) 137.8 / 2.0
52-Week Range (INR) 360 / 156 1, 6, 12 Rel. Per (%) 14/23/-9 12M Avg Val (INR M) 821 Free float (%) 33.7
Financials & Valuations (INR b) Y/E Mar 2016 2017E 2018E NII 97.6 98.4 110.7 OP 71.5 76.0 87.1 NP -28.1 13.8 18.9 NIM (%) 1.9 1.9 1.9 EPS (INR) -51.8 25.4 34.8 EPS Gr. (%) NM NM 37.1 BV/Sh. (INR) 477 497 524 ABV/Sh. (INR) 227 269 326 RoE (%) -10.8 5.2 6.8 RoA (%) -0.5 0.2 0.3 P/E (x) -4.9 10.0 7.3 P/BV (x) 0.53 0.51 0.48 P/ABV (x) 1.12 0.94 0.78
Weak core operating performance continues; NSL increases 40bp QoQ Canara Bank (CBK) reported a 41% PAT miss, led by weak core PPoP growth (-
59% YoY) and elevated credit costs (1.8%), partly offset by high trading gains (186% of PBT).
Gross slippages moderated to INR38.8b (4.8% of loans, annualized) vs. INR146b (17.7%) in 4QFY16. More importantly, net slippages decreased to 2.5% (annualized) v/s 16.8% a quarter ago. Management expects the strong trends in upgrades/recoveries (INR18.4b) to continue with a full-year target of INR80-100b. Overall GNPA increased 2% QoQ, and GNPA ratio stood at 9.7%.
Net stressed loans increased 40bp QoQ to 10.9%. OSRL ratio increased to 4.2% (+14bp QoQ) and, excluding SEB/aviation, it now stands at 3.7% of loans. Relapse from restructured loans was INR860m. In 1QFY17, CBK refinanced INR2.9b under the 5:25 scheme (all standard accounts), and converted ~INR15b into equity under SDR (all standard restructured). Further, five accounts were referred under the S4A scheme amounting to INR23.7b. Cumulative stock under 5:25 refinancing, SDR and S4A now stands at 4.7% of loans (largely standard).
Other highlights: (a) Loan growth remained muted (-1% YoY), (b) Opex grew 28% YoY albeit on a lower base and (c) CET 1 ratio stood at 8.21%.
Valuation and view: Overall, we expect CBK’s stress addition to remain elevated in FY17, and an improvement in the economic environment holds the key to its growth (infrastructure accounts for 17% of total loans). A large proportion of stressed loans (in various forms), moderate PCR ratio (33.5%) and weak capital position (CET1 at 8.2%) remain the key concerns. We cut earnings by ~18% for FY17-19E led by lower core income growth and higher credit costs. The stock’s headline valuation appears attractive, although the gap between BV and ABV remains significant. Remain Neutral with a target price of INR240 (0.46x FY18 BV).
Investors are advised to refer through important disclosures made at the last page of the Research Report. Motilal Oswal research is available on www.motilaloswal.com/Institutional-Equities, Bloomberg, Thomson Reuters, Factset and S&P Capital.
Alpesh Mehta ([email protected]); +91 22 3982 5415 Krishnan ASV ([email protected]); +91 22 3010 2603 / Dhaval Gada ([email protected]); +91 22 3982 5505
Motilal Oswal values your support in the Asiamoney Brokers Poll 2016 for
India Research, Sales and Trading team. We request your ballot.
Canara Bank
25 July 2016 2
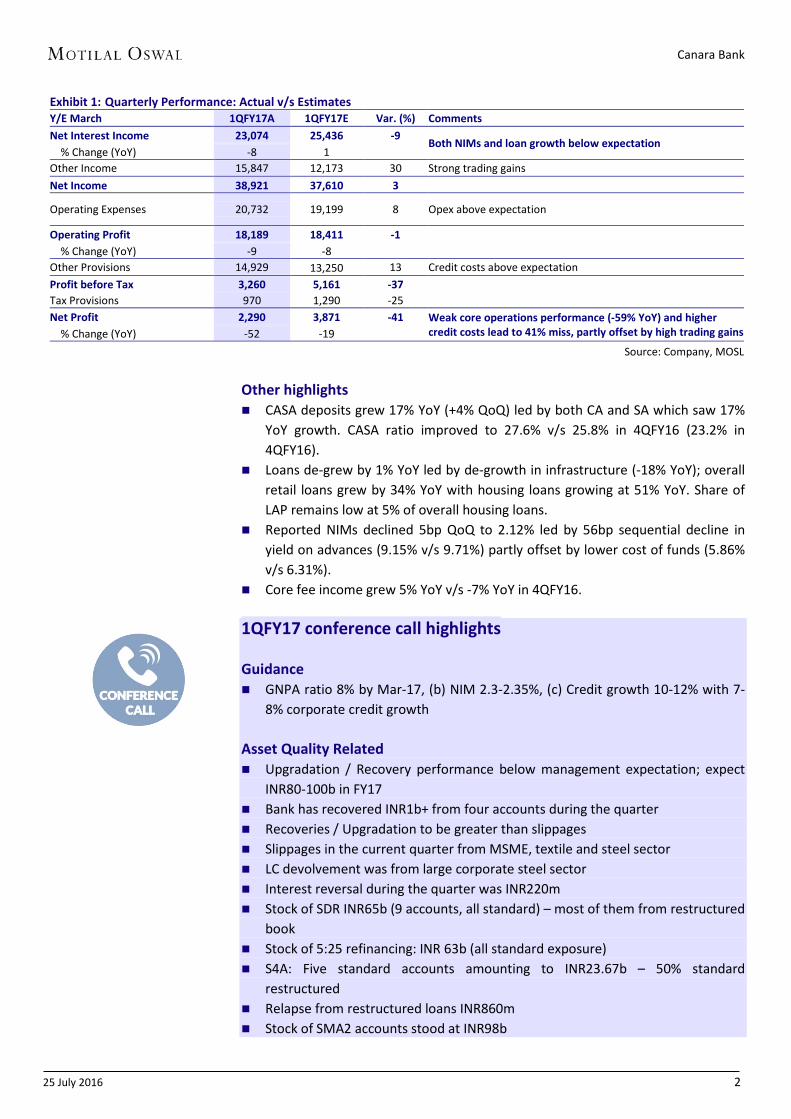
Exhibit 1: Quarterly Performance: Actual v/s Estimates Y/E March 1QFY17A 1QFY17E Var. (%) Comments Net Interest Income 23,074 25,436 -9
Both NIMs and loan growth below expectation % Change (YoY) -8 1
Other Income 15,847 12,173 30 Strong trading gains Net Income 38,921 37,610 3
Operating Expenses 20,732 19,199 8 Opex above expectation
Operating Profit 18,189 18,411 -1
% Change (YoY) -9 -8 Other Provisions 14,929 13,250 13 Credit costs above expectation
Profit before Tax 3,260 5,161 -37 Tax Provisions 970 1,290 -25 Net Profit 2,290 3,871 -41 Weak core operations performance (-59% YoY) and higher
credit costs lead to 41% miss, partly offset by high trading gains % Change (YoY) -52 -19 Source: Company, MOSL
Other highlights CASA deposits grew 17% YoY (+4% QoQ) led by both CA and SA which saw 17%
YoY growth. CASA ratio improved to 27.6% v/s 25.8% in 4QFY16 (23.2% in 4QFY16).
Loans de-grew by 1% YoY led by de-growth in infrastructure (-18% YoY); overall retail loans grew by 34% YoY with housing loans growing at 51% YoY. Share of LAP remains low at 5% of overall housing loans.
Reported NIMs declined 5bp QoQ to 2.12% led by 56bp sequential decline in yield on advances (9.15% v/s 9.71%) partly offset by lower cost of funds (5.86% v/s 6.31%).
Core fee income grew 5% YoY v/s -7% YoY in 4QFY16. 1QFY17 conference call highlights Guidance GNPA ratio 8% by Mar-17, (b) NIM 2.3-2.35%, (c) Credit growth 10-12% with 7-
8% corporate credit growth Asset Quality Related Upgradation / Recovery performance below management expectation; expect
INR80-100b in FY17 Bank has recovered INR1b+ from four accounts during the quarter Recoveries / Upgradation to be greater than slippages Slippages in the current quarter from MSME, textile and steel sector LC devolvement was from large corporate steel sector Interest reversal during the quarter was INR220m Stock of SDR INR65b (9 accounts, all standard) – most of them from restructured
book Stock of 5:25 refinancing: INR 63b (all standard exposure) S4A: Five standard accounts amounting to INR23.67b – 50% standard
restructured Relapse from restructured loans INR860m Stock of SMA2 accounts stood at INR98b

Canara Bank
25 July 2016 3
Provisions include INR889m of excess provision write-back against Punjab Food Corp.
SRs outstanding: INR19.47b against which bank holds INR7.71b provisions Other highlights Have made organizational structure changes; two tier sanctioning for large
corporate and regional office (under circle office) for faster TAT for retail lending LAP book is very small (~5% of housing book) Valuation and view Over last six years, CBK’s profitability has declined significantly led by
compression in core revenues and higher provisioning costs. While we expect stress addition to decrease in FY17; it is likely to remain elevated. Improvement in economic environment remains the key.
Sensitivity of earnings to risk-adjusted NIMs has increased significantly. With every (1) 10bp NIM expansion, earnings could see an upgrade of ~20%, and (2) 10bp decline in credit cost, earnings could see an upside of ~15%.
RBI has allowed various tools apart from normal restructuring (5:25, SDR, S4A, sale to ARC-leading to security receipts etc.) to tackle the stress loans. Hence, actual overall stress loans have been significantly higher than reported NNPAs.
Difference between reported BV and ABV (NNPA at 70%) is high at ~40%.Until the improvement in economic growth and resolution of key sectors problems (Infra and Iron and Steel) comes through markets would focus on adjusted P/BV.
We have cut estimates by 13-23% for FY17/18/19E to factor in lower core income growth and high credit costs partly offset by higher than expected trading gains. We expect ROEs to remain around 5-7%. CET1 at 8.2% remains a key concern. Remain Neutral with a target price of INR240 (0.46x FY18 BV) – based on RI model. We assume CoE of 15.7% (7.5% risk free rate, Beta of 1.4 and 6% market risk premium) and 5% growth.
Exhibit 2: We cut earnings estimate by 13-23% for FY17-19E led by higher credit costs
INR b Old Est Revised Est Change (%)
FY17 FY18 FY19 FY17 FY18 FY19 FY17 FY18 FY19 Net Interest Income 103.9 116.6 130.9 98.4 110.7 125.5 -5.4 -5.1 -4.2 Other Income 56.7 63.9 72.0 58.7 66.1 74.4 3.5 3.4 3.3 Total Income 160.6 180.5 202.9 157.0 176.8 199.8 -2.2 -2.1 -1.5 Operating Expenses 80.4 89.0 98.5 81.0 89.7 99.3 0.8 0.8 0.8 Operating Profits 80.2 91.5 104.4 76.0 87.1 100.6 -5.2 -4.8 -3.7 Provisions 56.3 58.6 61.9 57.6 60.1 63.5 2.5 2.5 2.6 PBT 23.9 32.9 42.4 18.4 27.0 37.0 -23.3 -17.9 -12.7 Tax 6.0 9.9 12.7 4.6 8.1 11.1 -23.3 -17.9 -12.7 PAT 18.0 23.0 29.7 13.8 18.9 25.9 -23.3 -17.9 -12.7 Margins (%) 1.98 2.02 2.02 1.88 1.92 1.93 Credit Cost (%) 1.50 1.40 1.30 1.55 1.45 1.35 RoA (%) 0.31 0.36 0.42 0.24 0.30 0.36 RoE (%) 6.7 8.1 9.8 5.2 6.8 8.8
Source: MOSL, Company
Maintain Neutral rating with target price of INR240
(0.46x FY18 BV)

Canara Bank
25 July 2016 4
Exhibit 3: One year forward P/BV
Source: Company, MOSL
Exhibit 4: One year forward P/E
Source: Company, MOSL
Exhibit 5: Improvement in margins or lower credit costs key to sharp rise in profitability (%) Y/E MARCH FY09 FY10 FY11 FY12 FY13 FY14 FY15 FY16 FY17E FY18E FY19E Net Interest Income 2.36 2.35 2.56 2.17 2.00 1.98 1.86 1.77 1.71 1.75 1.76 Fee income 0.63 0.56 0.55 0.51 0.44 0.48 0.43 0.47 0.51 0.53 0.54 Fee to core Income (%) 21.1 19.4 17.5 19.0 17.8 19.6 18.8 21.1 23.1 23.3 23.4 Core Income 2.99 2.91 3.11 2.67 2.44 2.46 2.29 2.25 2.22 2.28 2.30 Operating Expenses 1.53 1.44 1.47 1.32 1.31 1.34 1.40 1.36 1.40 1.41 1.39 Cost to Core Income 51.3 49.4 47.3 49.2 53.6 54.7 61.0 60.6 63.3 62.1 60.6 Employee cost 0.94 0.91 0.98 0.84 0.83 0.81 0.82 0.81 0.81 0.81 0.79 Other operating expenses 0.59 0.53 0.49 0.48 0.48 0.53 0.57 0.55 0.59 0.60 0.60 Core operating Profits 1.46 1.47 1.64 1.36 1.13 1.11 0.89 0.89 0.81 0.86 0.91 Trading and others 0.53 0.62 0.39 0.32 0.37 0.39 0.44 0.41 0.51 0.51 0.51 Operating Profits 1.98 2.09 2.03 1.67 1.50 1.50 1.34 1.30 1.32 1.37 1.41 Provisions 0.70 0.51 0.35 0.52 0.56 0.83 0.66 1.88 1.00 0.95 0.89 NPA provisions 0.45 0.59 0.33 0.36 0.47 0.47 0.73 1.75 0.92 0.87 0.81 Other Provisions 0.25 -0.08 0.02 0.16 0.09 0.35 -0.06 0.13 0.08 0.08 0.08 PBT 1.29 1.58 1.67 1.15 0.93 0.68 0.67 -0.58 0.32 0.43 0.52 Tax 0.25 0.33 0.33 0.23 0.20 0.14 0.15 -0.07 0.08 0.13 0.16
Tax Rate 19.4 20.9 19.9 19.6 21.8 20.4 22.7 11.7 25.0 30.0 30.0 RoA 1.04 1.25 1.34 0.92 0.73 0.54 0.52 -0.51 0.24 0.30 0.36 Leverage (x) 21.9 21.5 19.7 18.5 18.2 19.4 20.7 21.1 21.8 22.9 24.2 RoE 22.7 26.8 26.4 17.1 13.3 10.5 10.8 -10.8 5.2 6.8 8.8
Company, MOSL
0.5
1.7
0.9
0.3 0.2
0.7
1.2
1.7
2.2
Jul-0
6
Oct
-07
Jan-
09
Apr-
10
Jul-1
1
Oct
-12
Jan-
14
Apr-
15
Jul-1
6
PB (x) Peak(x) Avg(x) Min(x)
6.6
19.7
6.2
2.3 1
5
9
13
17
21
Jul-0
6
Oct
-07
Jan-
09
Apr-
10
Jul-1
1
Oct
-12
Jan-
14
Apr-
15
Jul-1
6
PE (x) Peak(x) Avg(x) Min(x)
Negative Earnings
Cycle

Canara Bank
25 July 2016 5
Story in charts
Exhibit 6: Loan growth continues to remain muted (%)
Source: Company, MOSL
Exhibit 7: Strong traction in CASA deposits (+17% YoY)
Source: Company, MOSL
Exhibit 8: Reported global NIMs (cumulative basis) remain stable
Source: Company, MOSL
Exhibit 9: Credit costs moderate yet remain elevated (%)
Source: Company, MOSL
Exhibit 10: Absolute GNPA up 2% QoQ; PCR (cal.) declined 70bp QoQ to 33.5%
Source: Company, MOSL
Exhibit 11: NSL increased ~50bp QoQ to 10.9% (%)
Source: Company, MOSL
2,1
50
2,1
79
2,1
76
2,3
25
2,2
56
2,1
58
2,1
82
2,4
22
2,4
99
2,8
11
2,8
77
3,0
11
3,0
30
3,1
09
3,1
23
3,3
00
3,2
41
3,2
31
3,3
19
3,2
47
3,2
13
24 24 15 10 5 (1) 0
4 11
30 32 24 21
11 9 10 7 4 6(2) (1)
1QFY
121H
FY12
9MFY
12FY
121Q
FY13
1HFY
139M
FY13
FY13
1QFY
141H
FY14
9MFY
14FY
141Q
FY15
1HFY
159M
FY15
FY15
1QFY
161H
FY16
9MFY
16FY
161Q
FY17
Loans (INR b) YoY gr. (%)
25 26 24 24 23 25 25 24 23 24 23 25 23 23 23 24 23 24 24 26 28
10 12
(1) (4)2 3
8 8 13 14 16
20
11 9 11 10 12 12 129
17
1QFY
121H
FY12
9MFY
12FY
121Q
FY13
1HFY
139M
FY13
FY13
1QFY
141H
FY14
9MFY
14FY
141Q
FY15
1HFY
159M
FY15
FY15
1QFY
161H
FY16
9MFY
16FY
161Q
FY17
CASA Ratio (calc,%) CASA YoY gr. (%)
2.4
2.6
2.6
2.6
2.3
2.5
2.2
2.4
2.2
2.2
2.2 2.
3 2.3
2.2 2.
2 2.
3 2.
2 2.2
2.2
2.2
2.2
1QFY
121H
FY12
9MFY
12FY
121Q
FY13
1HFY
139M
FY13
FY13
1QFY
141H
FY14
9MFY
14FY
141Q
FY15
1HFY
159M
FY15
FY15
1QFY
161H
FY16
9MFY
16FY
161Q
FY17
0.5 0.9
0.3 0.
7 0.8
0.8 1.1
0.6 0.7
0.5 0.8 1.1 1.
5 1.
2 1.
2 1.
0 1.6
1.2 1.
7 7.
2 1.
8
1QFY
122Q
FY12
3QFY
124Q
FY12
1QFY
132Q
FY13
3QFY
134Q
FY13
1QFY
142Q
FY14
3QFY
144Q
FY14
1QFY
152Q
FY15
3QFY
154Q
FY15
1QFY
162Q
FY16
3QFY
164Q
FY16
1QFY
17
1.7
1.7
1.8 1.
72.
0 2.6 2.8
2.6 2.9
2.6
2.8
2.5 2.7 2.9 3.4 3.9
4.0 4.3 5.
8 9.
4 9.7
1.3 1.
4 1.
5 1.
5 1.7 2.1
2.4
2.2 2.5 2.3
2.4
2.0
2.0 2.3
2.4 2.7
2.7 2.9 3.
9 6.
4 6.7
1QFY
121H
FY12
9MFY
12FY
121Q
FY13
1HFY
139M
FY13
FY13
1QFY
141H
FY14
9MFY
14FY
141Q
FY15
1HFY
159M
FY15
FY15
1QFY
161H
FY16
9MFY
16FY
161Q
FY17
Gross NPA (%) Net NPA (%)
1.1
1.3
1.4
1.5
1.5
1.7 2.1
2.4
2.2
2.5
2.3
2.4
2.0
2.0
2.3
2.4
2.7
2.7
2.9 3.9 6.
4 6.
7
3.5 3.6
3.5 3.9
3.2 5.
7 6.4
6.1
6.6 6.9
6.4
6.4
6.7
6.9
6.6
6.6 6.9 7.1
7.1 6.2 4.
0 4.2
4QFY
11
2QFY
12
4QFY
12
2QFY
13
4QFY
13
2QFY
14
4QFY
14
2QFY
15
4QFY
15
2QFY
16
4QFY
16NNPA (%) OSRL (%)

Canara Bank
25 July 2016 6
Exhibit 12: Quarterly Snapshot FY15 FY16 FY17 Variation (%)
INR m 1Q 2Q 3Q 4Q 1Q 2Q 3Q 4Q 1Q QoQ YoY Profit and Loss Net Interest Income 24,293 23,678 23,805 24,861 25,165 26,465 22,266 23,738 23,074 -3 -8Other Income 10,269 10,213 11,762 13,258 11,130 12,105 11,686 13,832 15,847 15 42
Trading profits 909 1,440 3,010 5,090 1,980 2,950 1,610 3,360 6,070 81 207 Forex Income 2,630 2,060 2,510 610 1,020 1,650 2,090 1,930 2,760 43 171 Recoveries 1,180 900 930 800 2,100 1,610 1,410 960 500 -48 -76Core Fees 5,550 5,813 5,312 6,758 6,030 5,895 6,576 7,582 6,517 -14 8
Total Income 34,562 33,891 35,567 38,120 36,295 38,570 33,952 37,570 38,921 4 7 Operating Expenses 16,612 17,636 17,594 20,794 16,259 19,129 18,427 21,104 20,732 -2 28
Employee 10,381 10,358 10,379 11,625 10,588 11,078 10,398 12,395 12,082 -3 14 Others 6,231 7,278 7,215 9,169 5,672 8,050 8,030 8,709 8,650 -1 53
Operating Profits 17,950 16,255 17,973 17,325 20,036 19,441 15,524 16,466 18,189 10 -9Provisions 7,881 8,137 8,413 10,096 13,597 12,123 14,289 63,315 14,929 -76 10
NPA provisions 11,250 9,120 9,520 7,820 13,140 9,790 14,320 58,830 14,690 -75 12 Provisions on Invst. -4,160 -220 -2,360 160 1,330 640 1,550 -850 170 NM -87Others 791 -763 1,253 2,116 -873 1,693 -1,582 5,335 69 -99 NM
PBT 10,069 8,118 9,560 7,230 6,438 7,318 1,236 -46,850 3,260 NM -49Taxes 2,000 1,850 3,000 1,100 1,650 2,029 386 -7,795 970 NM -41PAT 8,069 6,268 6,560 6,130 4,788 5,289 850 -39,055 2,290 NM -52Asset Quality GNPA 81,595 91,643 105,736 130,400 130,806 140,213 198,134 316,378 323,341 2 147 NNPA 61,501 71,703 75,559 87,401 88,881 93,825 129,401 208,329 214,939 3 142 GNPA (%) 2.7 2.9 3.4 3.9 4.0 4.3 5.8 9.4 9.7 31 573 NNPA (%) 2.0 2.3 2.4 2.7 2.7 2.9 3.9 6.4 6.7 27 395 PCR (Calculated, %) 24.6 21.8 28.5 33.0 32.1 33.1 34.7 34.2 33.5 -63 147 PCR (Reported, %) 60.1 58.7 59.4 57.3 59.0 59.8 54.0 50.1 50.8 71 -820Slippages 25,950 31,780 22,920 28,050 25,190 22,010 54,020 146,020 38,780 -73 54 Slippage Ratio (%) 4.2 4.5 3.2 3.7 3.3 2.8 6.9 17.7 4.8 -1291 146Credit Cost (%) 1.5 1.2 1.2 1.0 1.6 1.2 1.7 7.2 1.8 -535 21 Restructured loans* 209,010 203,920 206,750 226,210 230,370 228,910 206,080 130,633 133,801 2 -42 % to Loans 6.9 6.6 6.6 6.9 7.1 7.1 6.2 4.0 4.2 14 -294Ratios (%) Fees to Total Income 16.1 17.2 14.9 17.7 16.6 15.3 19.4 20.2 16.7 Cost to Core Income 55.7 59.8 60.4 65.8 52.1 59.1 63.9 67.4 70.1 Tax Rate 19.9 22.8 31.4 15.2 25.6 27.7 31.2 16.6 29.8 CASA (cal) 22.9 22.6 22.7 24.0 23.2 23.9 24.1 25.7 27.6 Loan/Deposit 70.6 67.4 67.5 69.7 68.7 66.6 67.7 67.7 69.0 CAR 10.2 10.2 9.9 10.6 10.8 11.0 11.5 11.1 12.1 Tier I 7.4 7.4 7.2 8.0 8.3 8.6 8.7 8.8 8.8 Margins - Cumulative (%) Yield on loans 10.7 10.7 10.8 10.8 10.2 10.2 9.9 9.7 9.2 -56 -107Yield On Investments 8.1 8.0 8.0 8.0 8.0 8.0 7.9 7.9 7.9 0 -5Cost of Deposits 7.4 7.4 7.4 7.4 7.1 7.1 7.0 6.9 6.5 -49 -67Margins 2.3 2.2 2.2 2.3 2.2 2.2 2.2 2.2 2.2 -4 -6Balance sheet (INR b) Loans 3,030 3,109 3,123 3,300 3,241 3,231 3,319 3,247 3,213 -1 -1 Retail Loans 362 389 402 423 420 445 484 541 562 4 34 Deposits 4,290 4,612 4,624 4,738 4,719 4,852 4,906 4,798 4,653 -3 -1 CASA Deposits 983 1,040 1,050 1,135 1,097 1,160 1,181 1,235 1,283 4 17 Savings Deposits 816 863 863 937 921 967 989 1,037 1,078 4 17 Current Deposits 167 177 187 198 175 193 192 198 204 3 17
Source: Company, MOSL

Canara Bank
25 July 2016 7
Financials: Valuation metrics 66 Rating CMP Mcap EPS (INR) P/E (x) BV (INR) P/BV (x) RoA (%) RoE (%)
(INR) (USDb) FY17 FY18 FY17 FY18 FY17 FY18 FY17 FY18 FY17 FY18 FY17 FY18 ICICIBC* Buy 269 23.7 18.1 20.8 11.1 8.4 145 159 1.30 1.09 1.19 1.22 11.1 11.8 HDFCB Buy 1,247 47.8 58.4 70.2 21.3 17.7 332 386 3.75 3.23 1.90 1.89 18.9 19.6 AXSB Buy 538 19.4 31.8 37.4 16.9 14.4 243 274 2.21 1.97 1.32 1.31 13.8 14.4 KMB* Buy 765 21.3 26.8 34.0 28.6 22.5 207 240 3.69 3.19 1.61 1.82 14.2 15.4 YES Buy 1,183 7.5 78.9 97.3 15.0 12.2 391 468 3.03 2.53 1.81 1.83 22.0 22.7 IIB Buy 1,157 10.4 50.5 63.8 22.9 18.1 334 389 3.46 2.97 1.92 1.96 16.2 17.6 IDFC Bk Buy 51 2.6 3.0 4.1 17.1 12.3 42 46 1.20 1.12 1.09 1.12 7.2 9.4 FB Neutral 66 1.7 3.9 4.7 16.9 14.1 50 54 1.32 1.23 0.67 0.67 8.0 9.0 DCBB Buy 100 0.4 7.4 8.6 13.6 11.7 69 78 1.45 1.29 0.98 0.93 11.3 11.7 JKBK Neutral 69 0.5 17.6 21.2 3.9 3.2 146 162 0.47 0.42 0.99 1.05 12.7 13.7 SIB Buy 22 0.4 3.1 3.7 7.1 5.9 30 33 0.73 0.67 0.61 0.64 10.7 11.7 Private Aggregate 135.8 19.7 16.5 2.64 2.34 SBIN (cons)* Buy 230 27.0 19.3 24.3 11.9 9.4 240 259 1.01 0.93 0.49 0.54 8.3 9.7 PNB Neutral 130 3.9 15.7 19.9 8.3 6.5 200 220 0.65 0.59 0.44 0.50 8.2 9.5 BOI Neutral 110 1.4 9.3 23.5 11.9 4.7 337 356 0.33 0.31 0.12 0.27 2.8 6.8 BOB Buy 156 5.5 14.7 18.7 10.6 8.3 159 173 0.98 0.90 0.48 0.54 9.6 11.2 CBK Neutral 254 2.1 33.1 42.4 7.7 6.0 505 537 0.50 0.47 0.31 0.36 6.7 8.1 UNBK Buy 132 1.4 26.8 36.7 4.9 3.6 318 351 0.41 0.37 0.43 0.53 8.7 11.0 OBC Neutral 116 0.6 22.1 27.9 5.2 4.2 473 494 0.25 0.23 0.28 0.32 4.8 5.8 INBK UR 153 1.1 22.2 29.1 6.9 5.3 298 320 0.51 0.48 0.49 0.56 7.7 9.4 ANDB Buy 61 1.9 2.9 8.2 20.6 7.4 129 136 0.47 0.45 0.15 0.39 2.3 6.2 Public Aggregate 44.8 11.8 8.7 0.76 0.71 Banks Aggregate 180.6 16.9 13.5 1.64 1.50 HDFC* Buy 1,380 33.0 40.1 46.3 24.2 19.4 194 221 4.64 3.75 1.89 2.10 20.0 22.1 LICHF Buy 518 4.0 39.5 47.3 13.1 10.9 213 251 2.43 2.07 1.49 1.51 20.1 20.9 IHFL Buy 742 4.7 68.2 84.0 10.9 8.8 280 315 2.65 2.36 3.84 3.78 23.4 28.2 GRHF Buy 292 1.6 8.3 10.7 35.1 27.4 28 35 10.28 8.27 2.33 2.34 32.4 33.5 REPCO Buy 828 0.8 30.3 39.0 27.3 21.2 179 214 4.61 3.87 2.14 2.17 18.2 19.8 DEWH Buy 225 1.0 29.7 36.4 7.6 6.2 194 221 1.16 1.02 1.19 1.21 16.2 17.5 Housing Finance 45.1 21.3 18.0 4.30 3.80 RECL Neutral 216 3.2 59.2 68.6 3.6 3.1 336 389 0.64 0.56 2.63 2.55 18.9 18.9 POWF Neutral 222 4.4 46.8 49.1 4.7 4.5 72 107 3.09 2.08 2.69 2.35 85.1 55.0 Infra Finance 7.7 4.2 3.8 1.20 0.97 SHTF Buy 1,198 4.1 75.5 94.2 15.9 12.7 507 581 2.36 2.06 2.17 2.27 15.7 17.1 MMFS Buy 321 2.7 15.5 18.8 20.7 17.0 119 133 2.69 2.42 2.14 2.26 13.7 15.0 BAF Buy 8,978 7.3 308.1 380.8 29.1 23.6 1,631 1,956 5.51 4.59 3.14 3.02 20.6 21.2 MUTH Buy 278 1.7 24.9 32.0 11.2 8.7 157 177 1.77 1.57 3.29 3.47 16.7 19.2 SKSM Buy 864 1.7 48.8 52.5 17.7 16.5 157 210 5.49 4.12 6.30 4.48 36.7 28.6 Asset Finance 17.5 19.8 16.1 3.18 2.87 NBFC Aggregate 70.3 14.6 12.6 3.14 2.72 Financials 250.9 16.2 13.2 1.89 1.71 *Multiples adj. for value of key ventures/Investments; For ICICI Bank and HDFC Ltd BV is adjusted for investments in subsidiaries

Canara Bank
25 July 2016 8
Financials and Valuations
Income Statement (INR Million) Y/E March 2012 2013 2014 2015 2016 2017E 2018E 2019E Interest Income 308,506 340,779 395,476 437,500 440,221 4,34,530 4,72,070 5,22,076 Interest Expense 231,613 261,989 306,034 340,864 342,588 3,36,179 3,61,353 3,96,620 Net Interest Income 76,893 78,790 89,442 96,637 97,634 98,352 1,10,717 1,25,456 Change (%) -0.1 2.5 13.5 8.0 1.0 0.7 12.6 13.3 Non-Interest Income 29,276 31,530 39,328 45,503 48,752 58,670 66,107 74,376 Net Income 106,169 110,320 128,770 142,139 146,386 1,57,021 1,76,824 1,99,832 Change (%) 1.0 3.9 16.7 10.4 3.0 7.3 12.6 13.0 Operating Expenses 46,737 51,420 60,810 72,636 74,919 81,003 89,715 99,276 Pre Provision Profits 59,432 58,900 67,960 69,504 71,467 76,018 87,109 1,00,556 Change (%) -2.4 -0.9 15.4 2.3 2.8 6.4 14.6 15.4 Provisions (excl tax) 18,605 22,179 37,330 34,527 103,324 57,646 60,114 63,527 PBT 40,827 36,721 30,630 34,976 -31,858 18,372 26,995 37,028 Tax 8,000 8,000 6,250 7,950 -3,730 4,593 8,098 11,108 Tax Rate (%) 19.6 21.8 20.4 22.7 11.7 25.0 30.0 30.0 PAT 32,827 28,721 24,380 27,026 -28,128 13,779 18,896 25,920 Change (%) -18.5 -12.5 -15.1 10.9 -204.1 -149.0 37.1 37.2 Pref. Dividend (Incl tax) - - - - - - - - Profits for Equity SH 32,827 28,721 24,380 27,026 -28,128 13,779 18,896 25,920 Change (%) -18.5 -12.5 -15.1 10.9 -204.1 -149.0 37.1 37.2 Equity Dividend (Incl tax) 5,673 6,740 5,936 6,517 0 2,889 4,403 6,039 Core PPP* 48,166 44,488 50,376 46,392 48,797 46,885 54,666 64,554 Change (%) -2.1 -7.6 13.2 -7.9 5.2 -3.9 16.6 18.1 *Core PPP is (NII+Fee income-Opex)Balance Sheet (INR Million) Y/E March 2012 2013 2014 2015 2016 2017E 2018E 2019E Equity Share Capital 4,430 4,430 4,613 4,752 5,430 5,430 5,430 5,430 Reserves & Surplus 222,470 244,348 291,589 313,840 310,602 3,21,880 3,36,761 3,57,030 Net Worth 226,900 248,778 296,201 318,592 316,032 3,27,310 3,42,191 3,62,460 Deposits 3,270,537 3,558,560 4,207,228 4,738,401 4,797,916 52,29,728 58,57,295 66,77,317 Change (%) 11.5 8.8 18.2 12.6 1.3 9.0 12.0 14.0 of which CASA Dep 796,107 860,613 1,032,794 1,135,322 1,235,422 13,58,964 15,17,678 17,25,355 Change (%) -4.2 8.1 20.0 9.9 8.8 10.0 11.7 13.7 Borrowings 155,254 202,834 272,306 256,716 268,733 2,76,961 2,91,511 3,07,516 Other Liabilities & Prov. 88,911 113,255 143,483 166,297 146,927 1,68,145 1,92,767 2,21,351 Total Liabilities 3,741,602 4,123,426 4,919,219 5,480,006 5,529,608 60,02,143 66,83,764 75,68,643 Current Assets 281,794 347,147 448,287 486,411 567,337 5,45,642 5,80,416 6,60,913 Investments 1,020,574 1,211,328 1,268,283 1,420,614 1,423,093 15,65,402 17,53,251 19,63,641 Change (%) 22.0 18.7 4.7 12.0 0.2 10.0 12.0 12.0 Loans 2,324,898 2,421,766 3,010,675 3,300,355 3,247,148 35,71,863 40,00,487 45,60,555 Change (%) 10.0 4.2 24.3 9.6 -1.6 10.0 12.0 14.0 Fixed Assets 28,575 28,627 66,416 69,494 71,981 72,781 73,582 74,382 Other Assets 85,760 114,557 125,558 203,131 220,049 2,46,455 2,76,029 3,09,153 Total Assets 3,741,602 4,123,426 4,919,219 5,480,006 5,529,608 60,02,143 66,83,764 75,68,643
Asset Quality (%) GNPA (INR M) 40,318 62,602 75,702 130,399 316,380 3,20,685 3,15,147 3,01,372 NNPA (INR M) 33,862 52,780 59,654 87,862 208,928 1,90,386 1,64,948 1,28,387 GNPA Ratio 1.73 2.58 2.50 3.90 9.43 8.66 7.59 6.37 NNPA Ratio 1.46 2.18 1.98 2.66 6.43 5.33 4.12 2.82 PCR (Excl Tech. write off) 16.0 15.7 21.2 32.6 34.0 40.6 47.7 57.4 PCR (Incl Tech. Write off) 67.6 61.4 60.1 57.3 50.1 56.5 63.3 71.7 E: MOSL Estimates

Canara Bank
25 July 2016 9
Financials and Valuations
Y/E March 2012 2013 2014 2015 2016 2017E 2018E 2019E Spreads Analysis (%) Avg. Yield-Earning Assets 9.5 9.4 9.5 9.2 8.8 8.3 8.2 8.1 Avg. Yield on loans 10.6 10.3 10.5 10.2 9.6 9.2 9.0 8.9 Avg. Yield on Investments 7.6 8.2 8.3 7.9 8.0 7.1 7.0 6.8 Avg. Cost-Int. Bear. Liab. 7.1 7.3 7.4 7.2 6.8 6.4 6.2 6.0 Avg. Cost of Deposits 7.1 7.4 7.4 7.2 6.8 6.3 6.1 5.9 Interest Spread 2.4 2.1 2.1 2.0 2.0 1.9 2.0 2.0 Net Interest Margin 2.4 2.2 2.1 2.0 1.9 1.9 1.9 1.9
Profitability Ratios (%) RoE 17.1 13.3 10.5 10.8 -10.8 5.2 6.8 8.8 RoA 0.9 0.73 0.54 0.52 -0.51 0.2 0.3 0.4 Int. Expense/Int.Income 75.1 76.9 77.4 77.9 77.8 77.4 76.5 76.0 Fee Income/Net Income 15.4 16.3 13.3 15.3 15.3 16.6 16.7 16.8 Non Int. Inc./Net Income 27.6 28.6 30.5 32.0 33.3 37.4 37.4 37.2
Efficiency Ratios (%) Cost/Income* 45.4 49.7 49.8 55.6 54.9 56.6 55.5 54.2 Empl. Cost/Op. Exps. 63.6 63.3 60.4 58.8 59.3 57.9 57.4 56.9 Busi. per Empl. (INR m) 125.9 135.6 136.1 141.3 144.7 143.0 150.0 160.9 NP per Empl. (INR lac) 7.8 6.7 5.0 5.0 -5.1 2.3 3.0 4.0 * ex treasuryAsset-Liability Profile (%) Loans/Deposit Ratio 71.1 68.1 71.6 69.7 67.7 68.3 68.3 68.3 CASA Ratio 24.3 24.2 24.5 24.0 25.7 26.0 25.9 25.8 Investment/Deposit Ratio 31.2 34.0 30.1 30.0 29.7 29.9 29.9 29.4 G-Sec/Investment Ratio 87.0 84.2 84.8 88.4 89.2 100.2 100.2 102.0 CAR 13.8 12.4 10.6 10.2 11.1 10.3 9.6 8.9 Tier 1 10.4 9.8 7.7 7.6 8.8 8.3 7.8 7.4
Valuation Book Value (INR) 463.8 513.4 518.1 552.5 477.2 497.3 523.9 560.6 Change (%) 14.6 10.7 0.9 6.6 -13.6 4.2 5.4 7.0 Price-BV (x) 0.5 0.5 0.5 0.5 0.5 0.5 0.5 0.5 Adjusted BV (INR) 414.1 436.0 434.1 432.4 227.1 269.3 326.5 406.9 Price-ABV (x) 0.6 0.6 0.6 0.6 1.1 0.9 0.8 0.6 EPS (INR) 74.1 64.8 52.9 56.9 -51.8 25.4 34.8 47.7 Change (%) -18.5 -12.5 -18.5 7.6 -191.1 -149.0 37.1 37.2 Price-Earnings (x) 3.4 3.9 4.8 4.5 -4.9 10.0 7.3 5.3 Dividend Per Share (INR) 11.0 13.0 11.0 10.5 0.0 4.6 7.0 9.5 Dividend Yield (%) 4.3 5.1 4.3 4.1 0.0 1.8 2.7 3.8 E: MOSL Estimates

Canara Bank
25 July 2016 10
Corporate profile Exhibit 1: Sensex rebased
Source: MOSL/Bloomberg
Exhibit 2: Shareholding pattern (%) Jun-16 Mar-16 Jun-15
Promoter 66.3 66.3 64.5
DII 19.6 18.6 20.7
FII 6.2 7.1 8.2
Others 7.9 8.0 6.7
Note: FII Includes depository receipts Source: Capitaline
Exhibit 3: Top holders Holder Name % Holding
Lic Of India and their Schemes 13.8
Hdfc Trustee Company Limited 2.9
Source: Capitaline
Exhibit 4: Top management Name Designation Thothala Narayanasamy Manoharan Chairman (Non-Executive)
Rakesh Sharma Managing Director & CEO
Dina Bandhu Mohapatra Executive Director
Harideesh Kumar B Executive Director
Pradyuman Singh Rawat Executive Director
B Nagesh Babu Company Secretary
Source: Capitaline
Exhibit 5: Directors Name Name
G V Manimaran Sanjay Jain
Sairam Mocherla Sunil Hukumchand Kocheta
Rajinder Kumar Goel Pankaj Jain
Uma Shankar
*Independent
Exhibit 6: Auditors Name Type
J L Sengupta & Co Statutory
J Singh & Associates Statutory
Ram Raj & Co Statutory
S C Vasudeva & Co Statutory
V K Niranjan & Co Statutory Source: Capitaline
Exhibit 7: MOSL forecast v/s consensus EPS (INR)
MOSL forecast
Consensus forecast Variation (%)
FY17 25.4 21.5 18.4
FY18 34.8 40.0 -13.0
Source: Bloomberg
Company description Set up in 1906, Canara Bank (CBK) it one of the oldest banks in the India. The government nationalized the bank in 1969. Over the years bank has made several acquisitions, major one being Lakshmi Commercial Bank which gave significant presence in northern India. As of June 2016, the bank had a network of 5,855 branches and 9,657 ATMs spread across India. The bank also has several overseas branches and subsidiaries / joint ventures (Can Fin Homes Limited, Canara Robeco AMC, Canara HSBC Oriental Life Insurance Company amongst others).

Canara Bank
25 July 2016 11
N O T E S

Canara Bank
25 July 2016 12
Disclosures
This document has been prepared by Motilal Oswal Securities Limited (hereinafter referred to as Most) to provide information about the company (ies) and/sector(s), if any, covered in the report and may be distributed by it and/or its affiliated company(ies). This report is for personal information of the selected recipient/s and does not construe to be any investment, legal or taxation advice to you. This research report does not constitute an offer, invitation or inducement to invest in securities or other investments and Motilal Oswal Securities Limited (hereinafter referred as MOSt) is not soliciting any action based upon it. This report is not for public distribution and has been furnished to you solely for your general information and should not be reproduced or redistributed to any other person in any form. This report does not constitute a personal recommendation or take into account the particular investment objectives, financial situations, or needs of individual clients. Before acting on any advice or recommendation in this material, investors should consider whether it is suitable for their particular circumstances and, if necessary, seek professional advice. The price and value of the investments referred to in this material and the income from them may go down as well as up, and investors may realize losses on any investments. Past performance is not a guide for future performance, future returns are not guaranteed and a loss of original capital may occur.
MOSt and its affiliates are a full-service, integrated investment banking, investment management, brokerage and financing group. We and our affiliates have investment banking and other business relationships with a some companies covered by our Research Department. Our research professionals may provide input into our investment banking and other business selection processes. Investors should assume that MOSt and/or its affiliates are seeking or will seek investment banking or other business from the company or companies that are the subject of this material and that the research professionals who were involved in preparing this material may educate investors on investments in such business . The research professionals responsible for the preparation of this document may interact with trading desk personnel, sales personnel and other parties for the purpose of gathering, applying and interpreting information. Our research professionals are paid on twin parameters of performance & profitability of MOSt. MOSt generally prohibits its analysts, persons reporting to analysts, and members of their households from maintaining a financial interest in the securities or derivatives of any companies that the analysts cover. Additionally, MOSt generally prohibits its analysts and persons reporting to analysts from serving as an officer, director, or advisory board member of any companies that the analysts cover. Our salespeople, traders, and other professionals or affiliates may provide oral or written market commentary or trading strategies to our clients that reflect opinions that are contrary to the opinions expressed herein, and our proprietary trading and investing businesses may make investment decisions that are inconsistent with the recommendations expressed herein. In reviewing these materials, you should be aware that any or all of the foregoing among other things, may give rise to real or potential conflicts of interest. MOSt and its affiliated company(ies), their directors and employees and their relatives may; (a) from time to time, have a long or short position in, act as principal in, and buy or sell the securities or derivatives thereof of companies mentioned herein. (b) be engaged in any other transaction involving such securities and earn brokerage or other compensation or act as a market maker in the financial instruments of the company(ies) discussed herein or act as an advisor or lender/borrower to such company(ies) or may have any other potential conflict of interests with respect to any recommendation and other related information and opinions.; however the same shall have no bearing whatsoever on the specific recommendations made by the analyst(s), as the recommendations made by the analyst(s) are completely independent of the views of the affiliates of MOSt even though there might exist an inherent conflict of interest in some of the stocks mentioned in the research report Reports based on technical and derivative analysis center on studying charts company's price movement, outstanding positions and trading volume, as opposed to focusing on a company's fundamentals and, as such, may not match with a report on a company's fundamental analysis. In addition MOST has different business segments / Divisions with independent research separated by Chinese walls catering to different set of customers having various objectives, risk profiles, investment horizon, etc, and therefore may at times have different contrary views on stocks sectors and markets.
Unauthorized disclosure, use, dissemination or copying (either whole or partial) of this information, is prohibited. The person accessing this information specifically agrees to exempt MOSt or any of its affiliates or employees from, any and all responsibility/liability arising from such misuse and agrees not to hold MOSt or any of its affiliates or employees responsible for any such misuse and further agrees to hold MOSt or any of its affiliates or employees free and harmless from all losses, costs, damages, expenses that may be suffered by the person accessing this information due to any errors and delays. The information contained herein is based on publicly available data or other sources believed to be reliable. Any statements contained in this report attributed to a third party represent MOSt’s interpretation of the data, information and/or opinions provided by that third party either publicly or through a subscription service, and such use and interpretation have not been reviewed by the third party. This Report is not intended to be a complete statement or summary of the securities, markets or developments referred to in the document. While we would endeavor to update the information herein on reasonable basis, MOSt and/or its affiliates are under no obligation to update the information. Also there may be regulatory, compliance, or other reasons that may prevent MOSt and/or its affiliates from doing so. MOSt or any of its affiliates or employees shall not be in any way responsible and liable for any loss or damage that may arise to any person from any inadvertent error in the information contained in this report. MOSt or any of its affiliates or employees do not provide, at any time, any express or implied warranty of any kind, regarding any matter pertaining to this report, including without limitation the implied warranties of merchantability, fitness for a particular purpose, and non-infringement. The recipients of this report should rely on their own investigations.
This report is intended for distribution to institutional investors. Recipients who are not institutional investors should seek advice of their independent financial advisor prior to taking any investment decision based on this report or for any necessary explanation of its contents.
Most and it’s associates may have managed or co-managed public offering of securities, may have received compensation for investment banking or merchant banking or brokerage services, may have received any compensation for products or services other than investment banking or merchant banking or brokerage services from the subject company in the past 12 months. Most and it’s associates have not received any compensation or other benefits from the subject company or third party in connection with the research report. Subject Company may have been a client of Most or its associates during twelve months preceding the date of distribution of the research report
MOSt and/or its affiliates and/or employees may have interests/positions, financial or otherwise of over 1 % at the end of the month immediately preceding the date of publication of the research in the securities mentioned in this report. To enhance transparency, MOSt has incorporated a Disclosure of Interest Statement in this document. This should, however, not be treated as endorsement of the views expressed in the report.
Motilal Oswal Securities Limited is registered as a Research Analyst under SEBI (Research Analyst) Regulations, 2014. SEBI Reg. No. INH000000412
Pending Regulatory inspections against Motilal Oswal Securities Limited: SEBI pursuant to a complaint from client Shri C.R. Mohanraj alleging unauthorized trading, issued a letter dated 29th April 2014 to MOSL notifying appointment of an Adjudicating Officer as per SEBI regulations to hold inquiry and adjudge violation of SEBI Regulations; MOSL replied to the Show Cause Notice whereby SEBI granted us an opportunity of Inspection of Documents. Since all the documents requested by us were not covered we have requested to SEBI vide our letter dated June 23, 2015 to provide pending list of documents for inspection.
List of associate companies of Motilal Oswal Securities Limited -Click here to access detailed report
Analyst Certification The views expressed in this research report accurately reflect the personal views of the analyst(s) about the subject securities or issues, and no part of the compensation of the research analyst(s) was, is, or will be directly or indirectly related to the specific recommendations and views expressed by research analyst(s) in this report. The research analysts, strategists, or research associates principally responsible for preparation of MOSt research receive compensation based upon various factors, including quality of research, investor client feedback, stock picking, competitive factors and firm revenues Disclosure of Interest Statement CANARA BANAK Analyst ownership of the stock No Served as an officer, director or employee No
A graph of daily closing prices of securities is available at www.nseindia.com and http://economictimes.indiatimes.com/markets/stocks/stock-quotes
Regional Disclosures (outside India) This report is not directed or intended for distribution to or use by any person or entity resident in a state, country or any jurisdiction, where such distribution, publication, availability or use would be contrary to law, regulation or which would subject MOSt & its group companies to registration or licensing requirements within such jurisdictions.
For Hong Kong: This report is distributed in Hong Kong by Motilal Oswal capital Markets (Hong Kong) Private Limited, a licensed corporation (CE AYY-301) licensed and regulated by the Hong Kong Securities and Futures Commission (SFC) pursuant to the Securities and Futures Ordinance (Chapter 571 of the Laws of Hong Kong) “SFO”. As per SEBI (Research Analyst Regulations) 2014 Motilal Oswal Securities (SEBI Reg No. INH000000412) has an agreement with Motilal Oswal capital Markets (Hong Kong) Private Limited for distribution of research report in Kong Kong. This report is intended for distribution only to “Professional Investors” as defined in Part I of Schedule 1 to SFO. Any investment or investment activity to which this document relates is only available to professional investor and will be engaged only with professional investors.” Nothing here is an offer or solicitation of these securities, products and services in any jurisdiction where their offer or sale is not qualified or exempt from registration. The Indian Analyst(s) who compile this report is/are not located in Hong Kong & are not conducting Research Analysis in Hong Kong.
For U.S Motilal Oswal Securities Limited (MOSL) is not a registered broker - dealer under the U.S. Securities Exchange Act of 1934, as amended (the"1934 act") and under applicable state laws in the United States. In addition MOSL is not a registered investment adviser under the U.S. Investment Advisers Act of 1940, as amended (the "Advisers Act" and together with the 1934 Act, the "Acts), and under applicable state laws in the United States. Accordingly, in the absence of specific exemption under the Acts, any brokerage and investment services provided by MOSL, including the products and services described herein are not available to or intended for U.S. persons.
This report is intended for distribution only to "Major Institutional Investors" as defined by Rule 15a-6(b)(4) of the Exchange Act and interpretations thereof by SEC (henceforth referred to as "major institutional investors"). This document must not be acted on or relied on by persons who are not major institutional investors. Any investment or investment activity to which this document relates is only available to major institutional investors and will be engaged in only with major institutional investors. In reliance on the exemption from registration provided by Rule 15a-6 of the U.S. Securities Exchange Act of 1934, as amended (the "Exchange Act") and interpretations thereof by the U.S. Securities and Exchange Commission ("SEC") in order to conduct business with Institutional Investors based in the U.S., MOSL has entered into a chaperoning agreement with a U.S. registered broker-dealer, Motilal Oswal Securities International Private Limited. ("MOSIPL"). Any business interaction pursuant to this report will have to be executed within the provisions of this chaperoning agreement.
The Research Analysts contributing to the report may not be registered /qualified as research analyst with FINRA. Such research analyst may not be associated persons of the U.S. registered broker-dealer, MOSIPL, and therefore, may not be subject to NASD rule 2711 and NYSE Rule 472 restrictions on communication with a subject company, public appearances and trading securities held by a research analyst account.
For Singapore Motilal Oswal Capital Markets Singapore Pte Limited is acting as an exempt financial advisor under section 23(1)(f) of the Financial Advisers Act(FAA) read with regulation 17(1)(d) of the Financial Advisors Regulations and is a subsidiary of Motilal Oswal Securities Limited in India. This research is distributed in Singapore by Motilal Oswal Capital Markets Singapore Pte Limited and it is only directed in Singapore to accredited investors, as defined in the Financial Advisers Regulations and the Securities and Futures Act (Chapter 289), as amended from time to time.
In respect of any matter arising from or in connection with the research you could contact the following representatives of Motilal Oswal Capital Markets Singapore Pte Limited: Varun Kumar Kadambari Balachandran [email protected] [email protected] Contact : (+65) 68189232 (+65) 68189233 / 65249115 Office Address:21 (Suite 31),16 Collyer Quay,Singapore 04931
Motilal Oswal Securities Ltd Motilal Oswal Tower, Level 9, Sayani Road, Prabhadevi, Mumbai 400 025
Phone: +91 22 3982 5500 E-mail: [email protected]