![BW 1Q Corporate Presentation [Read-Only] - listed companybestworld.listedcompany.com/.../BW_May052016_1Q_Corporate_Presentation.p… · Corporate Presentation . ... Arab Emirates](https://static.fdocuments.in/doc/165x107/5ec613b17de35c0582412e26/bw-1q-corporate-presentation-read-only-listed-corporate-presentation-arab.jpg)
1Q 2021 Operational Update - listed company
25
Operational Update 11 May 2021 1Q 2021
Transcript of 1Q 2021 Operational Update - listed company
Operational Update
11 May 2021
1Q 2021
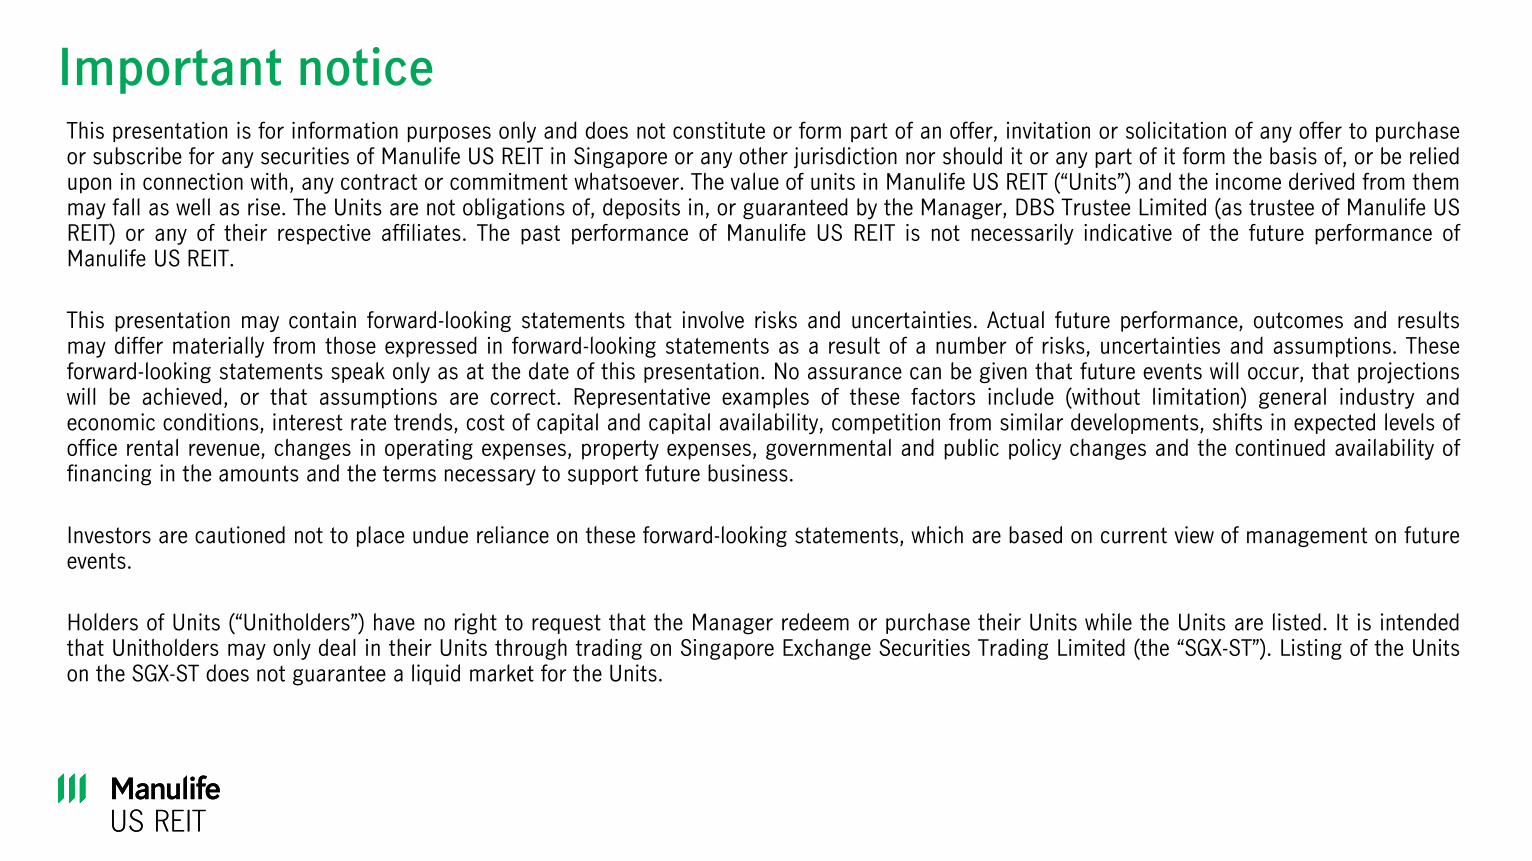
Important noticeThis presentation is for information purposes only and does not constitute or form part of an offer, invitation or solicitation of any offer to purchaseor subscribe for any securities of Manulife US REIT in Singapore or any other jurisdiction nor should it or any part of it form the basis of, or be reliedupon in connection with, any contract or commitment whatsoever. The value of units in Manulife US REIT (“Units”) and the income derived from themmay fall as well as rise. The Units are not obligations of, deposits in, or guaranteed by the Manager, DBS Trustee Limited (as trustee of Manulife USREIT) or any of their respective affiliates. The past performance of Manulife US REIT is not necessarily indicative of the future performance ofManulife US REIT.
This presentation may contain forward-looking statements that involve risks and uncertainties. Actual future performance, outcomes and resultsmay differ materially from those expressed in forward-looking statements as a result of a number of risks, uncertainties and assumptions. Theseforward-looking statements speak only as at the date of this presentation. No assurance can be given that future events will occur, that projectionswill be achieved, or that assumptions are correct. Representative examples of these factors include (without limitation) general industry andeconomic conditions, interest rate trends, cost of capital and capital availability, competition from similar developments, shifts in expected levels ofoffice rental revenue, changes in operating expenses, property expenses, governmental and public policy changes and the continued availability offinancing in the amounts and the terms necessary to support future business.
Investors are cautioned not to place undue reliance on these forward-looking statements, which are based on current view of management on futureevents.
Holders of Units (“Unitholders”) have no right to request that the Manager redeem or purchase their Units while the Units are listed. It is intendedthat Unitholders may only deal in their Units through trading on Singapore Exchange Securities Trading Limited (the “SGX-ST”). Listing of the Unitson the SGX-ST does not guarantee a liquid market for the Units.
Peachtree, Georgia
1Q 2021 Financial and Portfolio Updates
Looking Forward
ESG
Appendix: U.S. Outlook
01
02
03
04
Content

Michelson, Irvine

5
1Q 2021 portfolio remains stable with high occupancy
(1) Source: JLL U.S. Office Report 1Q 2021(2) Based on gross borrowings as percentage of total assets(3) Based on net income before finance expenses, taxes and net fair value change in investment properties and derivatives over finance expenses
Occupancy
92.0%Above U.S. Class
A average
~ 82%1
WALE
5.3 years
.
Executed Leases
5.8%By portfolio NLA
~270,000 sq ft
executed
Gearing
41.3%2
Well below MAS
50.0% limit
Weighted Avg.Interest Rate
3.18%
Interest Coverage
3.5 times3
6
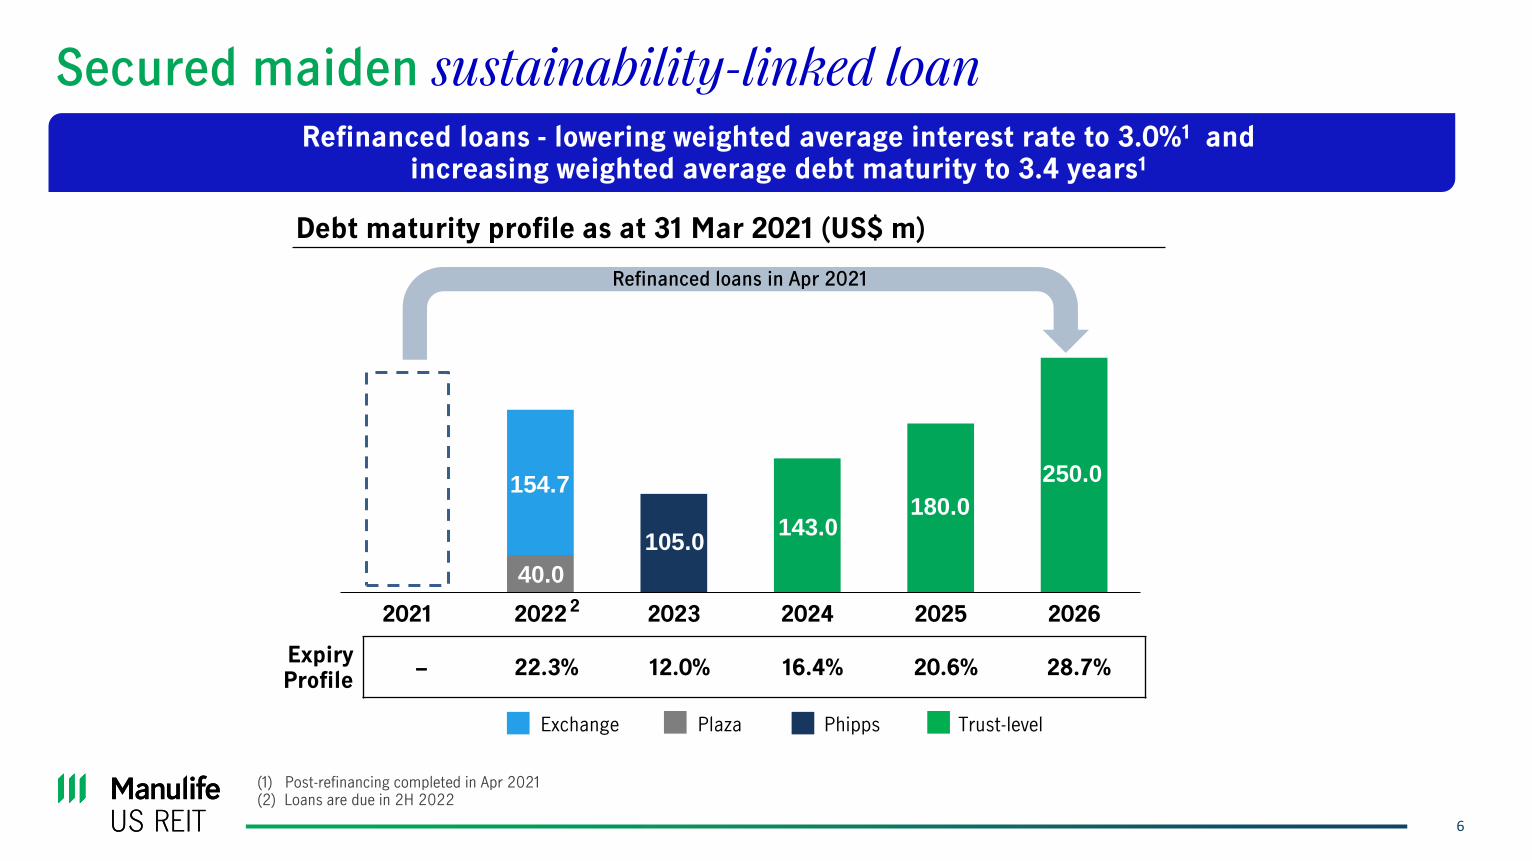
40.0
154.7
105.0 143.0
180.0
250.0
2021 2022 2023 2024 2025 2026
Debt maturity profile as at 31 Mar 2021 (US$ m)
Exchange Plaza Phipps Trust-level
Expiry Profile
22.3% 12.0% 16.4% 20.6% 28.7%
Refinanced loans in Apr 2021
2
Refinanced loans - lowering weighted average interest rate to 3.0%1 and increasing weighted average debt maturity to 3.4 years1
Secured maiden sustainability-linked loan
(1) Post-refinancing completed in Apr 2021(2) Loans are due in 2H 2022
7
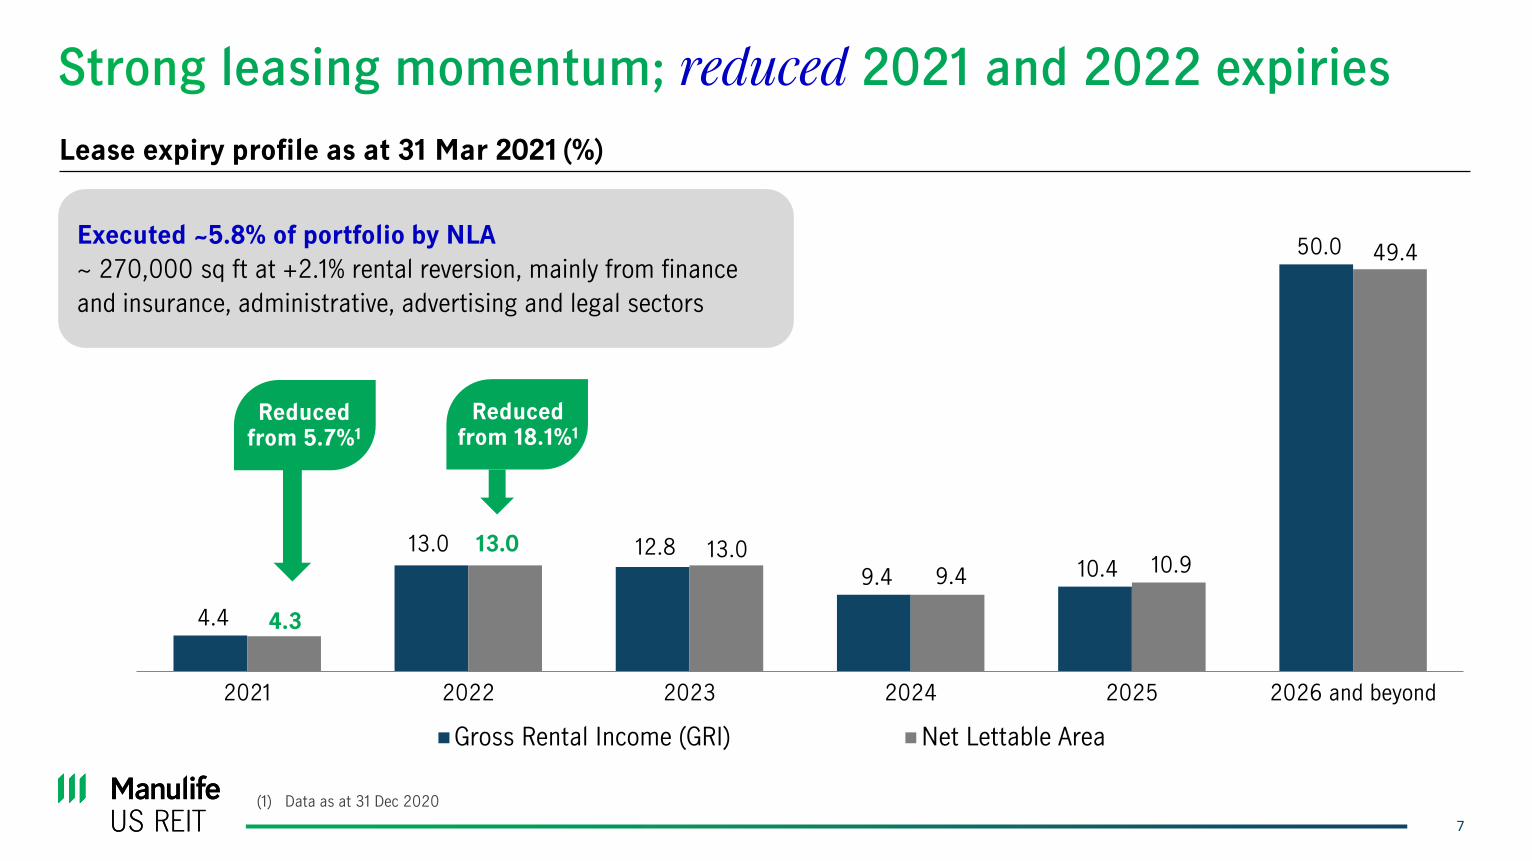
Lease expiry profile as at 31 Mar 2021 (%)
Strong leasing momentum; reduced 2021 and 2022 expiries
4.4
13.0 12.8
9.4 10.4
50.0
4.3
13.0 13.0 9.4
10.9
49.4
2021 2022 2023 2024 2025 2026 and beyond
Gross Rental Income (GRI) Net Lettable Area
Reduced from 18.1%1
Reduced from 5.7%1
Executed ~5.8% of portfolio by NLA
~ 270,000 sq ft at +2.1% rental reversion, mainly from finance
and insurance, administrative, advertising and legal sectors
(1) Data as at 31 Dec 2020
8
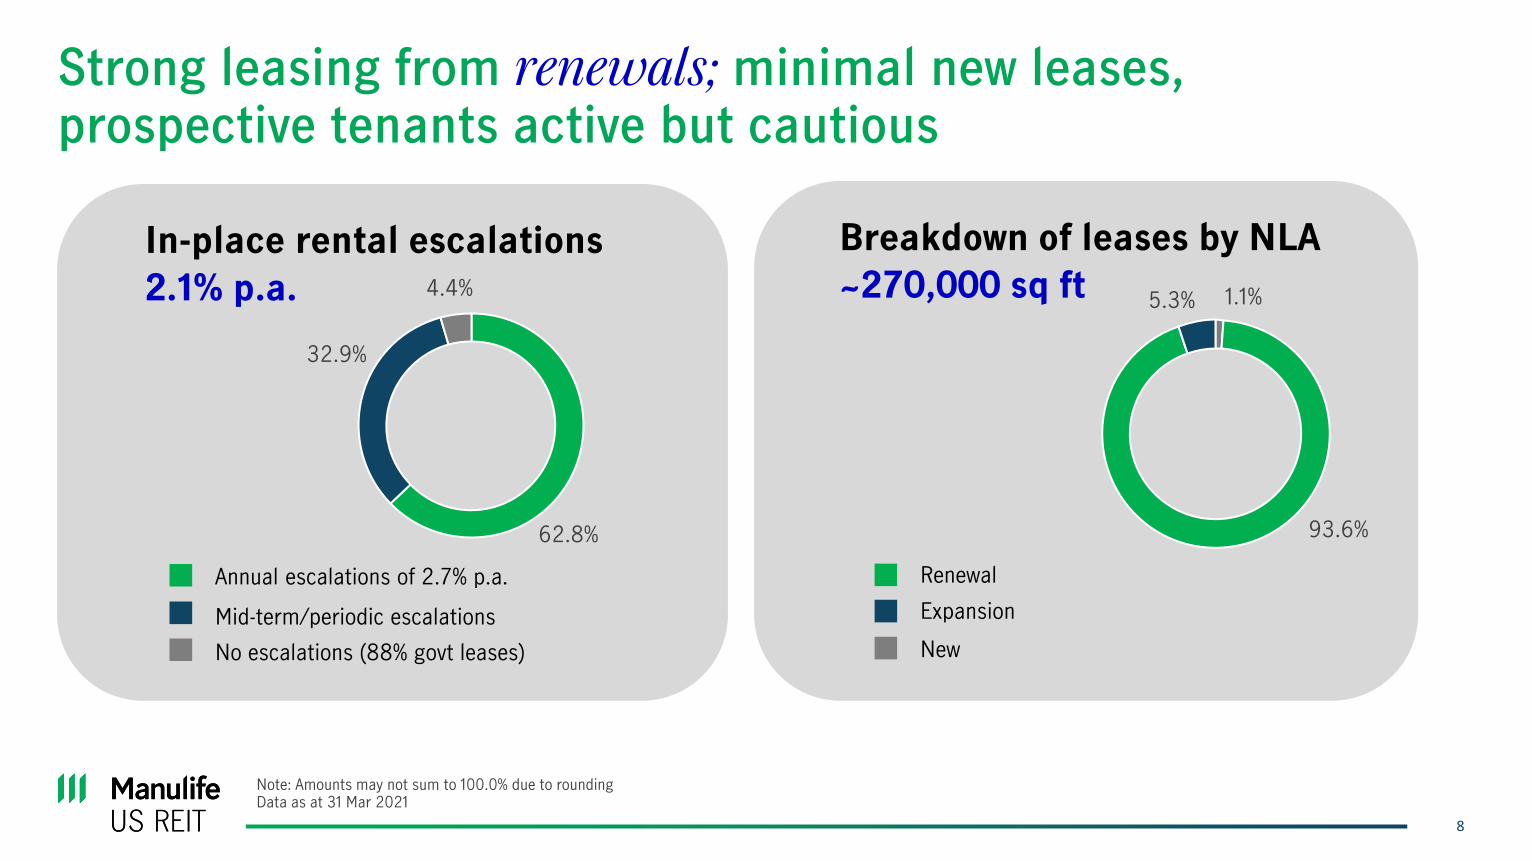
In-place rental escalations
2.1% p.a.
62.8%
32.9%
4.4%
Annual escalations of 2.7% p.a.
Mid-term/periodic escalations
No escalations (88% govt leases)
Note: Amounts may not sum to 100.0% due to rounding Data as at 31 Mar 2021
Strong leasing from renewals; minimal new leases, prospective tenants active but cautious
1.1%
93.6%
5.3%
Breakdown of leases by NLA
~270,000 sq ft
Renewal
Expansion
New
9
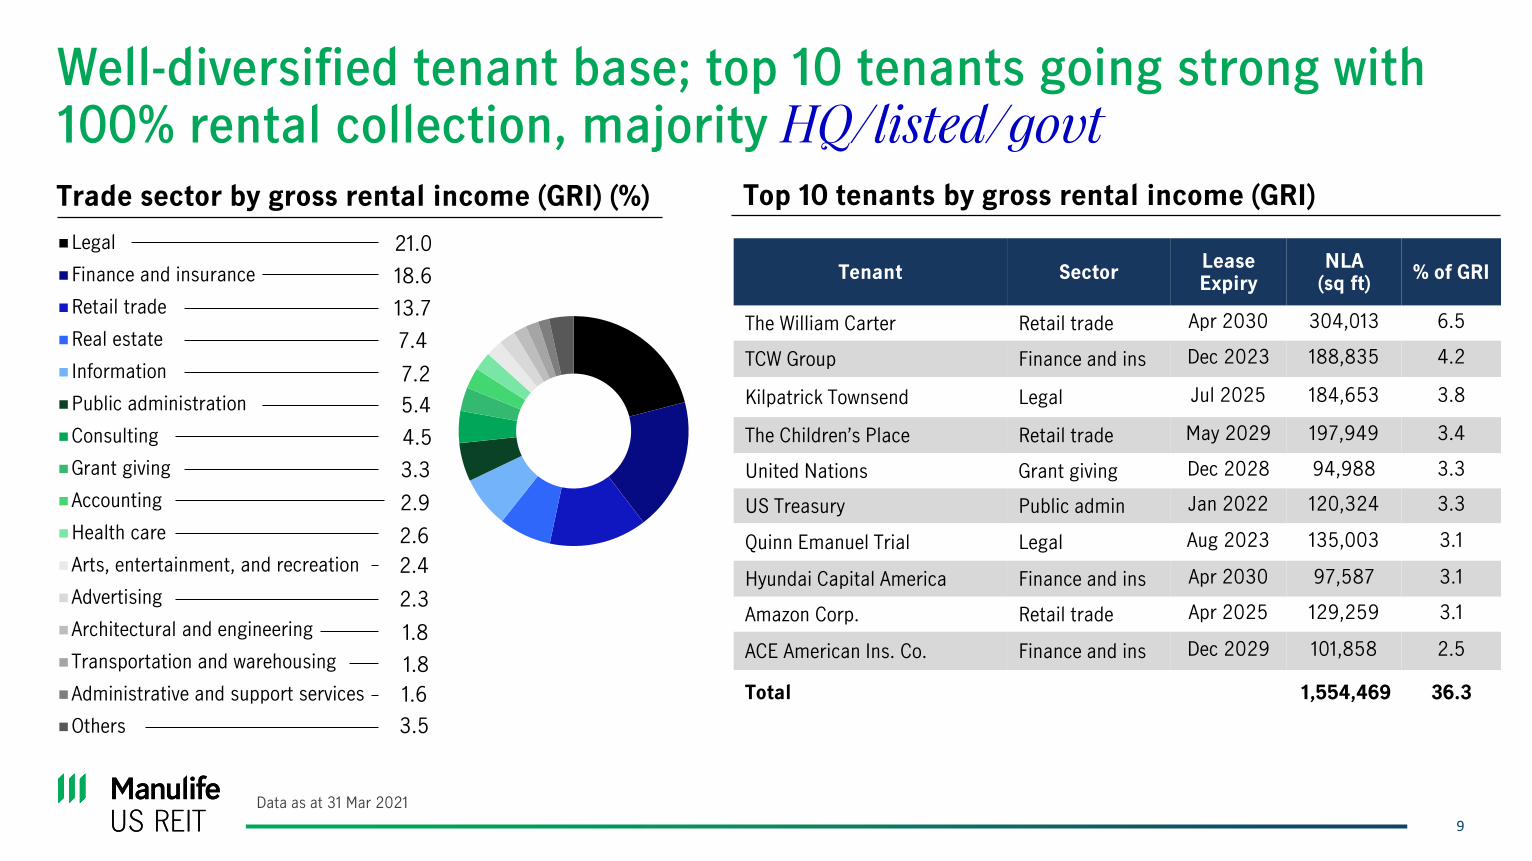
Well-diversified tenant base; top 10 tenants going strong with 100% rental collection, majority HQ/listed/govt
Top 10 tenants by gross rental income (GRI)
Tenant SectorLease Expiry
NLA(sq ft)
% of GRI
The William Carter Retail trade Apr 2030 304,013 6.5
TCW Group Finance and ins Dec 2023 188,835 4.2
Kilpatrick Townsend Legal Jul 2025 184,653 3.8
The Children’s Place Retail trade May 2029 197,949 3.4
United Nations Grant giving Dec 2028 94,988 3.3
US Treasury Public admin Jan 2022 120,324 3.3
Quinn Emanuel Trial Legal Aug 2023 135,003 3.1
Hyundai Capital America Finance and ins Apr 2030 97,587 3.1
Amazon Corp. Retail trade Apr 2025 129,259 3.1
ACE American Ins. Co. Finance and ins Dec 2029 101,858 2.5
Total 1,554,469 36.3
Legal
Finance and insurance
Retail trade
Real estate
Information
Public administration
Consulting
Grant giving
Accounting
Health care
Arts, entertainment, and recreation
Advertising
Architectural and engineering
Transportation and warehousing
Administrative and support services
Others
21.0
18.6
13.7
7.4
7.2
5.4
4.5
3.3
2.9
2.6
2.3
2.4
1.8
1.8
1.6
3.5
Trade sector by gross rental income (GRI) (%)
Data as at 31 Mar 2021
10
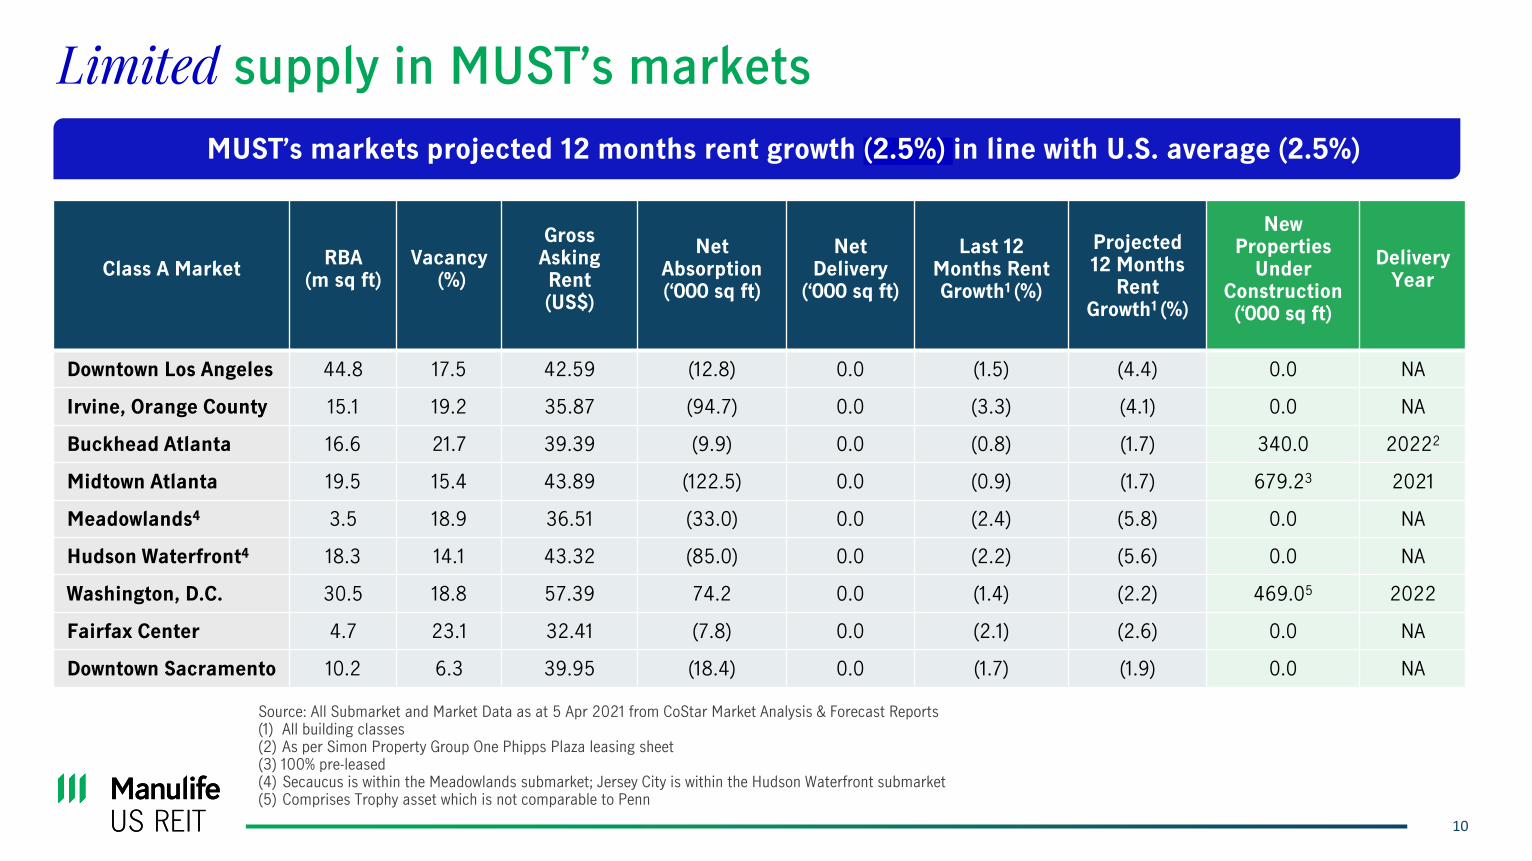
Limited supply in MUST’s markets
Class A MarketRBA
(m sq ft)Vacancy
(%)
Gross Asking Rent(US$)
Net Absorption(‘000 sq ft)
Net Delivery
(‘000 sq ft)
Last 12Months Rent Growth1 (%)
Projected 12 Months
Rent Growth1 (%)
New Properties
Under Construction(‘000 sq ft)
Delivery Year
Downtown Los Angeles 44.8 17.5 42.59 (12.8) 0.0 (1.5) (4.4) 0.0 NA
Irvine, Orange County 15.1 19.2 35.87 (94.7) 0.0 (3.3) (4.1) 0.0 NA
Buckhead Atlanta 16.6 21.7 39.39 (9.9) 0.0 (0.8) (1.7) 340.0 20222
Midtown Atlanta 19.5 15.4 43.89 (122.5) 0.0 (0.9) (1.7) 679.23 2021
Meadowlands4 3.5 18.9 36.51 (33.0) 0.0 (2.4) (5.8) 0.0 NA
Hudson Waterfront4 18.3 14.1 43.32 (85.0) 0.0 (2.2) (5.6) 0.0 NA
Washington, D.C. 30.5 18.8 57.39 74.2 0.0 (1.4) (2.2) 469.05 2022
Fairfax Center 4.7 23.1 32.41 (7.8) 0.0 (2.1) (2.6) 0.0 NA
Downtown Sacramento 10.2 6.3 39.95 (18.4) 0.0 (1.7) (1.9) 0.0 NA
Source: All Submarket and Market Data as at 5 Apr 2021 from CoStar Market Analysis & Forecast Reports(1) All building classes(2) As per Simon Property Group One Phipps Plaza leasing sheet(3) 100% pre-leased(4) Secaucus is within the Meadowlands submarket; Jersey City is within the Hudson Waterfront submarket(5) Comprises Trophy asset which is not comparable to Penn
MUST’s markets projected 12 months rent growth (2.5%) in line with U.S. average (2.5%)
Centerpointe, Virginia
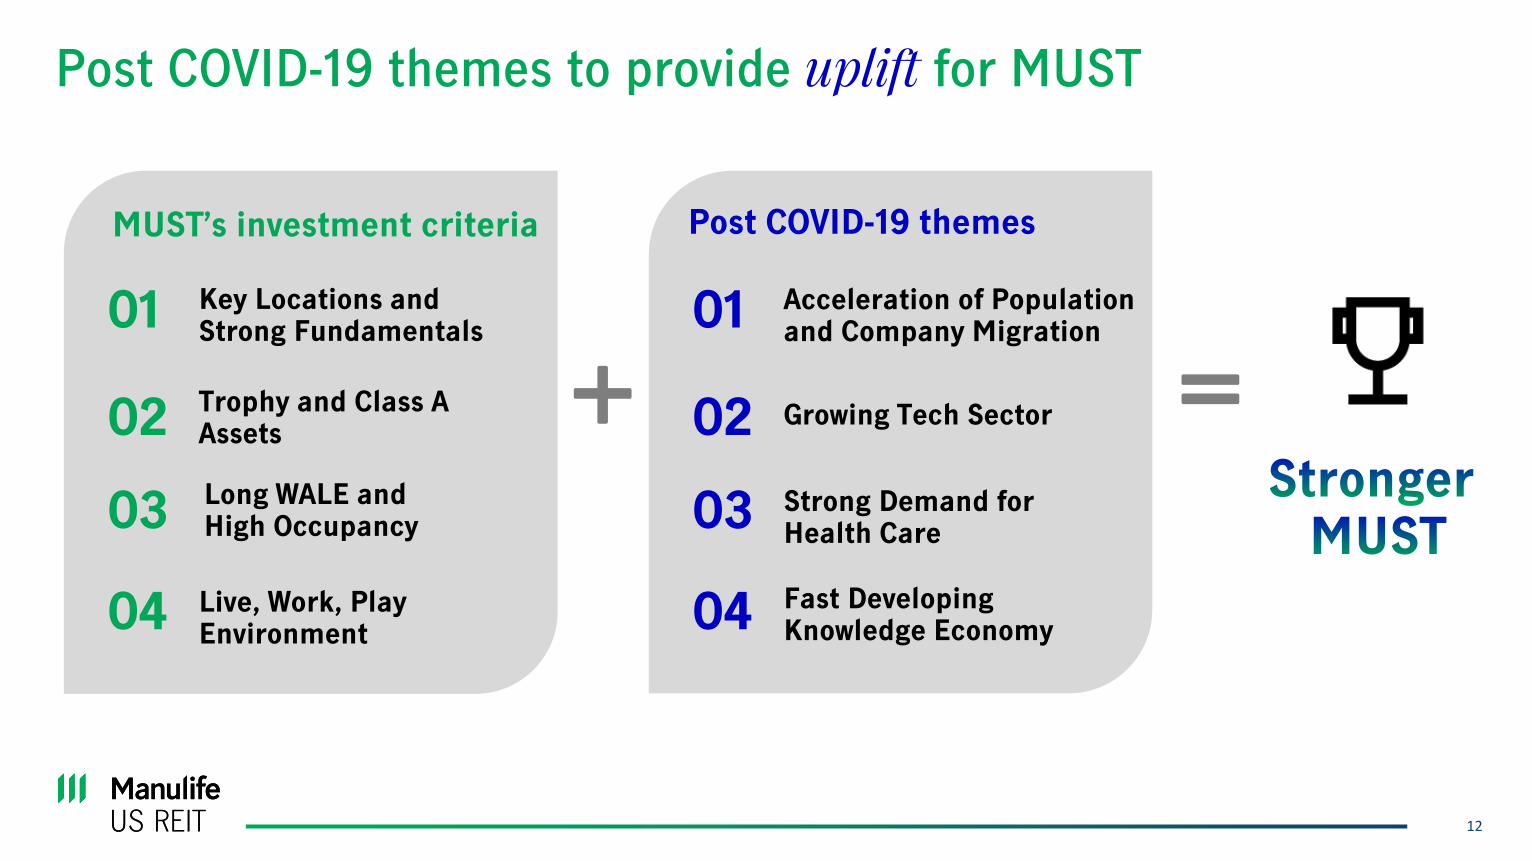
Post COVID-19 themes to provide uplift for MUST
12
Key Locations and Strong Fundamentals
Trophy and Class A Assets
Long WALE and High Occupancy
Live, Work, Play Environment
01
02
03
04
MUST’s investment criteria
Acceleration of Population and Company Migration
Growing Tech Sector
Strong Demand for Health Care
Fast Developing Knowledge Economy
01
02
03
04
Post COVID-19 themes
13
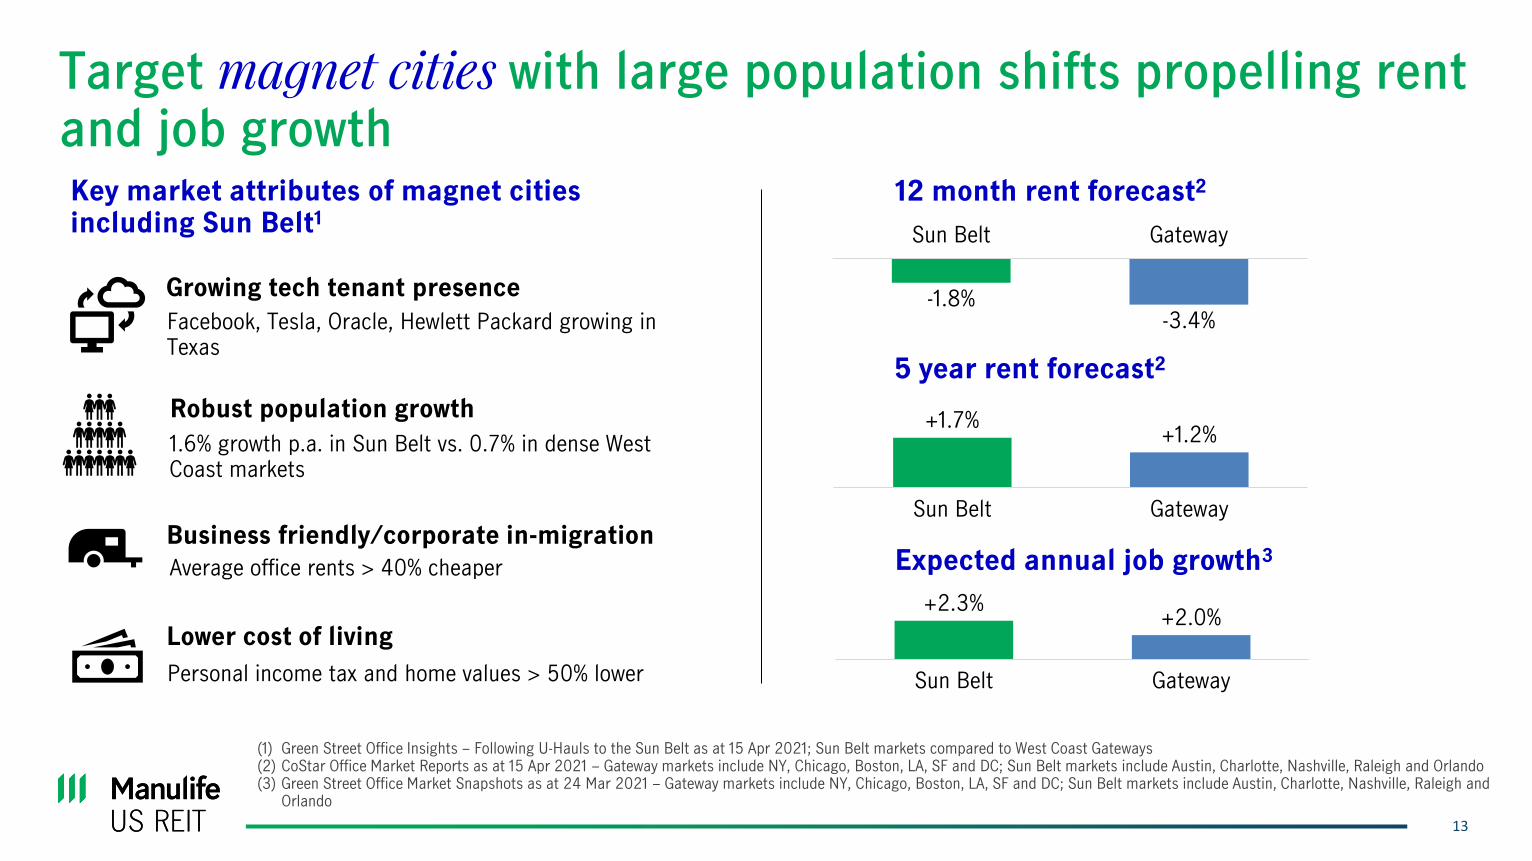
Target magnet cities with large population shifts propelling rent and job growth
(1) Green Street Office Insights – Following U-Hauls to the Sun Belt as at 15 Apr 2021; Sun Belt markets compared to West Coast Gateways(2) CoStar Office Market Reports as at 15 Apr 2021 – Gateway markets include NY, Chicago, Boston, LA, SF and DC; Sun Belt markets include Austin, Charlotte, Nashville, Raleigh and Orlando(3) Green Street Office Market Snapshots as at 24 Mar 2021 – Gateway markets include NY, Chicago, Boston, LA, SF and DC; Sun Belt markets include Austin, Charlotte, Nashville, Raleigh and
Orlando
Growing tech tenant presence
Robust population growth
Business friendly/corporate in-migration
Lower cost of living
Personal income tax and home values > 50% lower
Average office rents > 40% cheaper
Key market attributes of magnet cities including Sun Belt1
Facebook, Tesla, Oracle, Hewlett Packard growing in Texas
1.6% growth p.a. in Sun Belt vs. 0.7% in dense West Coast markets
12 month rent forecast2
5 year rent forecast2
Expected annual job growth3
-1.8%-3.4%
Sun Belt Gateway
+1.7%+1.2%
Sun Belt Gateway
+2.3%+2.0%
Sun Belt Gateway
14
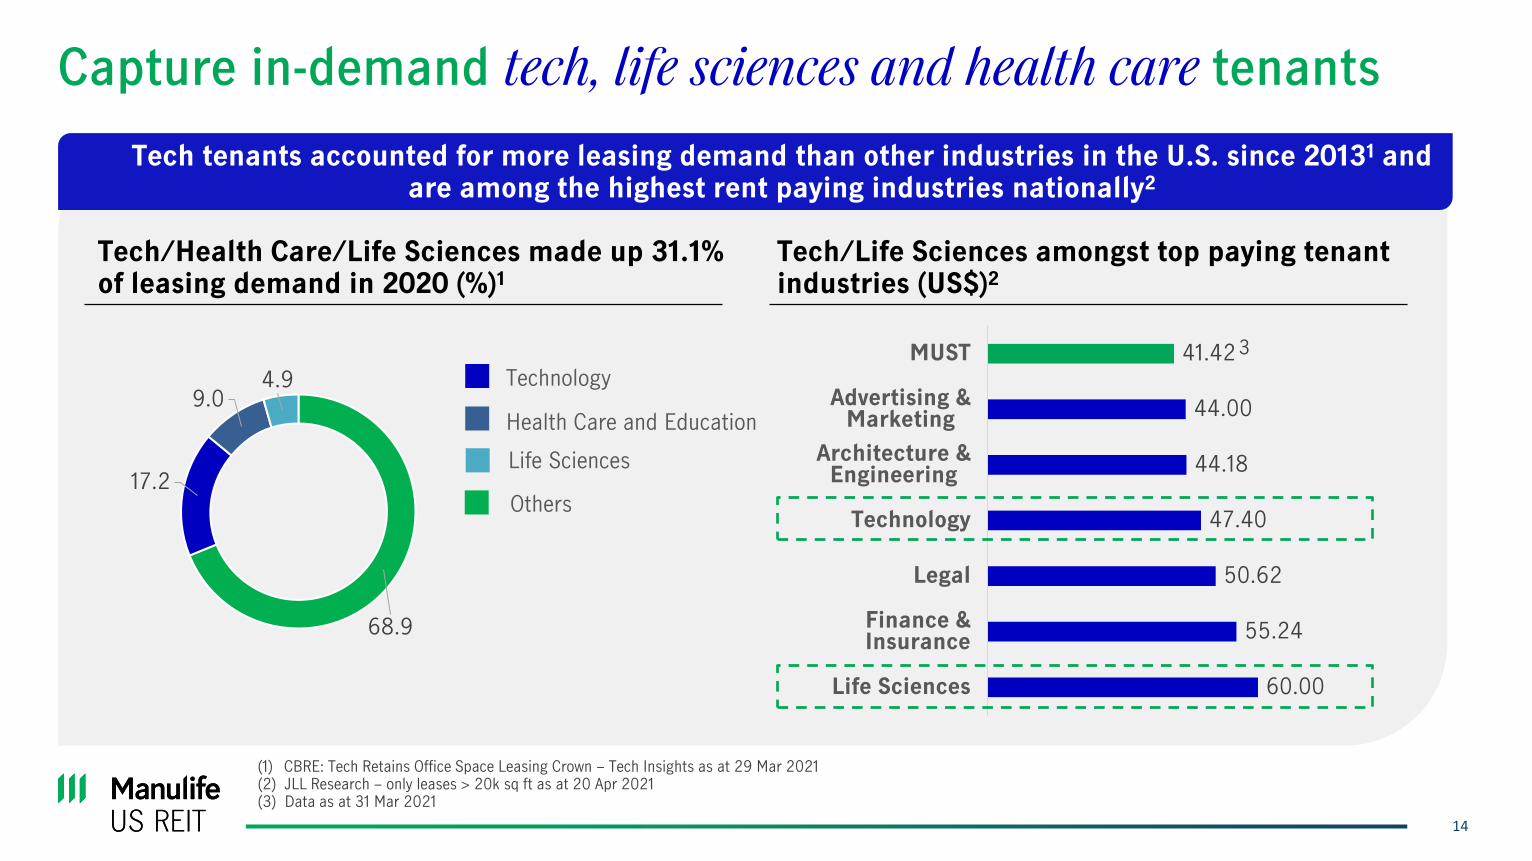
Capture in-demand tech, life sciences and health care tenants
(1) CBRE: Tech Retains Office Space Leasing Crown – Tech Insights as at 29 Mar 2021(2) JLL Research – only leases > 20k sq ft as at 20 Apr 2021(3) Data as at 31 Mar 2021
Tech/Health Care/Life Sciences made up 31.1% of leasing demand in 2020 (%)1
Tech/Life Sciences amongst top paying tenant industries (US$)2
Tech tenants accounted for more leasing demand than other industries in the U.S. since 20131 and are among the highest rent paying industries nationally2
68.9
17.2
9.04.9
Life Sciences
Technology
Health Care and Education
60.00
55.24
50.62
47.40
44.18
44.00
41.42
Life Sciences
Finance &Insurance
Legal
Technology
Architecture &Engineering
Advertising &Marketing
MUST
Others
3
15
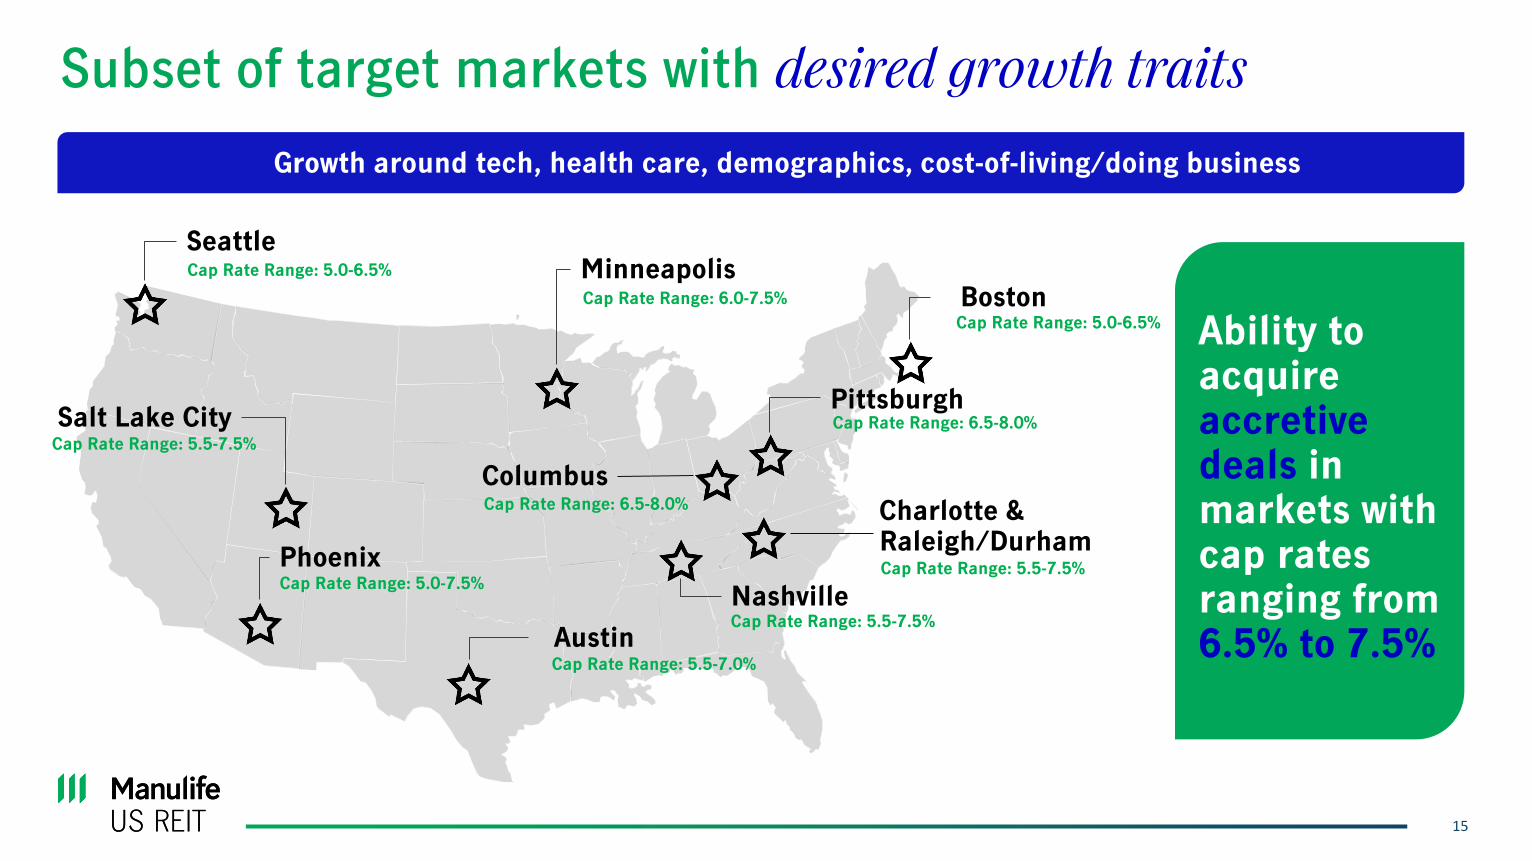
Subset of target markets with desired growth traits
Seattle
Salt Lake CityPittsburgh
Columbus
Phoenix
Minneapolis
Nashville
Charlotte & Raleigh/Durham
Austin
BostonCap Rate Range: 5.0-6.5%
Cap Rate Range: 5.0-6.5%
Cap Rate Range: 5.5-7.0%
Cap Rate Range: 5.5-7.5%
Cap Rate Range: 5.5-7.5%
Cap Rate Range: 5.0-7.5%
Cap Rate Range: 6.0-7.5%
Cap Rate Range: 6.5-8.0%
Cap Rate Range: 6.5-8.0%
Cap Rate Range: 5.5-7.5%
Growth around tech, health care, demographics, cost-of-living/doing business
Ability to acquireaccretive deals in markets with cap rates ranging from 6.5% to 7.5%
17
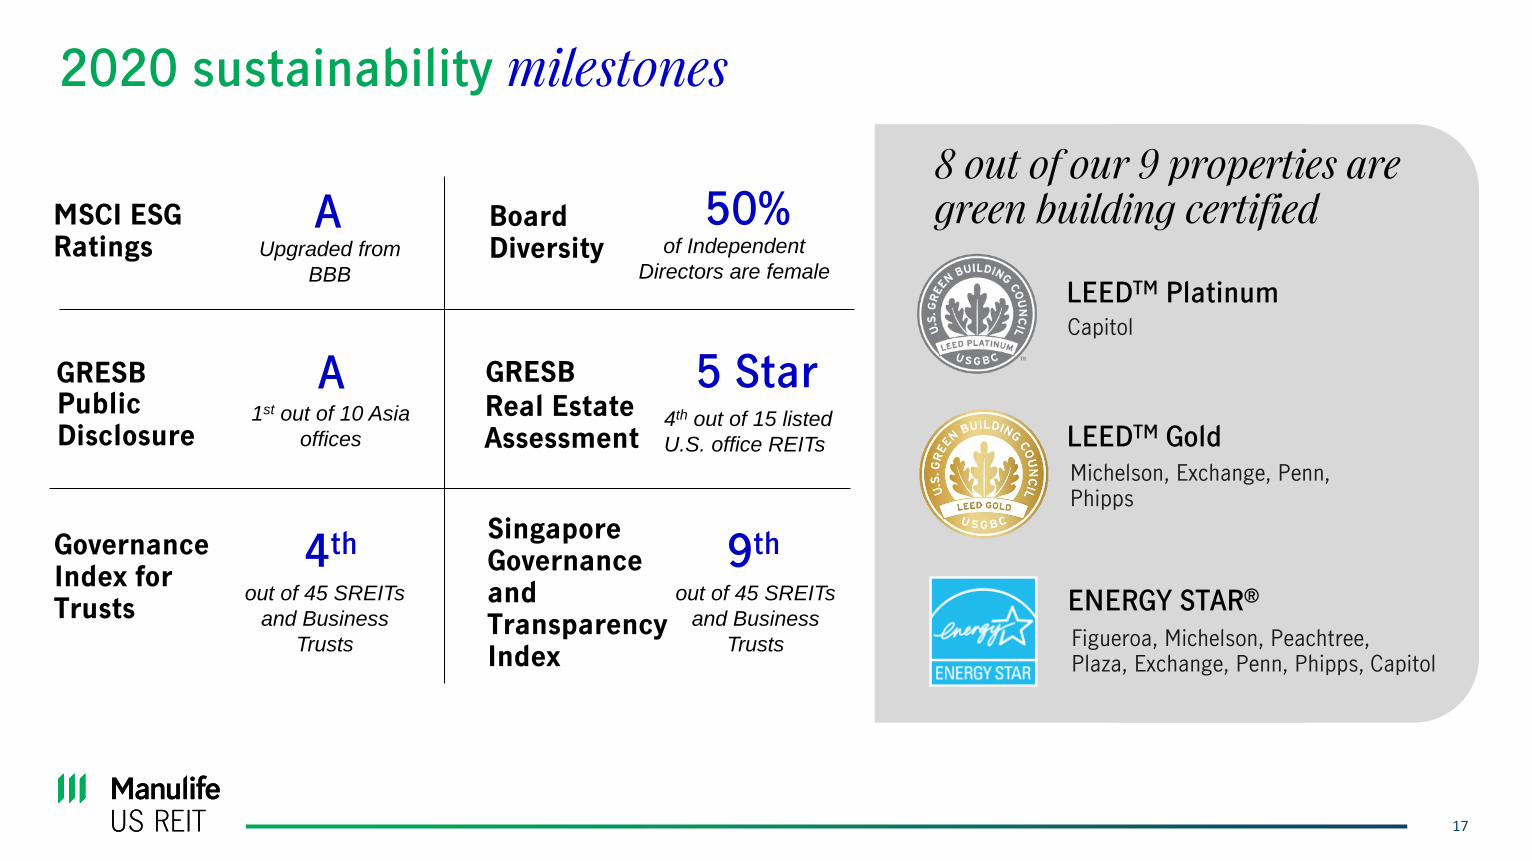
2020 sustainability milestones
Governance Index for Trusts
4th
out of 45 SREITs
and Business
Trusts
Singapore Governance and Transparency Index
Capitol
Michelson, Exchange, Penn, Phipps
Figueroa, Michelson, Peachtree,Plaza, Exchange, Penn, Phipps, Capitol
LEEDTM Gold
ENERGY STAR®
LEEDTM Platinum
8 out of our 9 properties are green building certified MSCI ESG
RatingsA
Upgraded from
BBB
Board Diversity
50% of Independent
Directors are female
GRESB A Public Disclosure
5 Star Real Estate Assessment
GRESB
9th
out of 45 SREITs
and Business
Trusts
4th out of 15 listed
U.S. office REITs
1st out of 10 Asia
offices
18
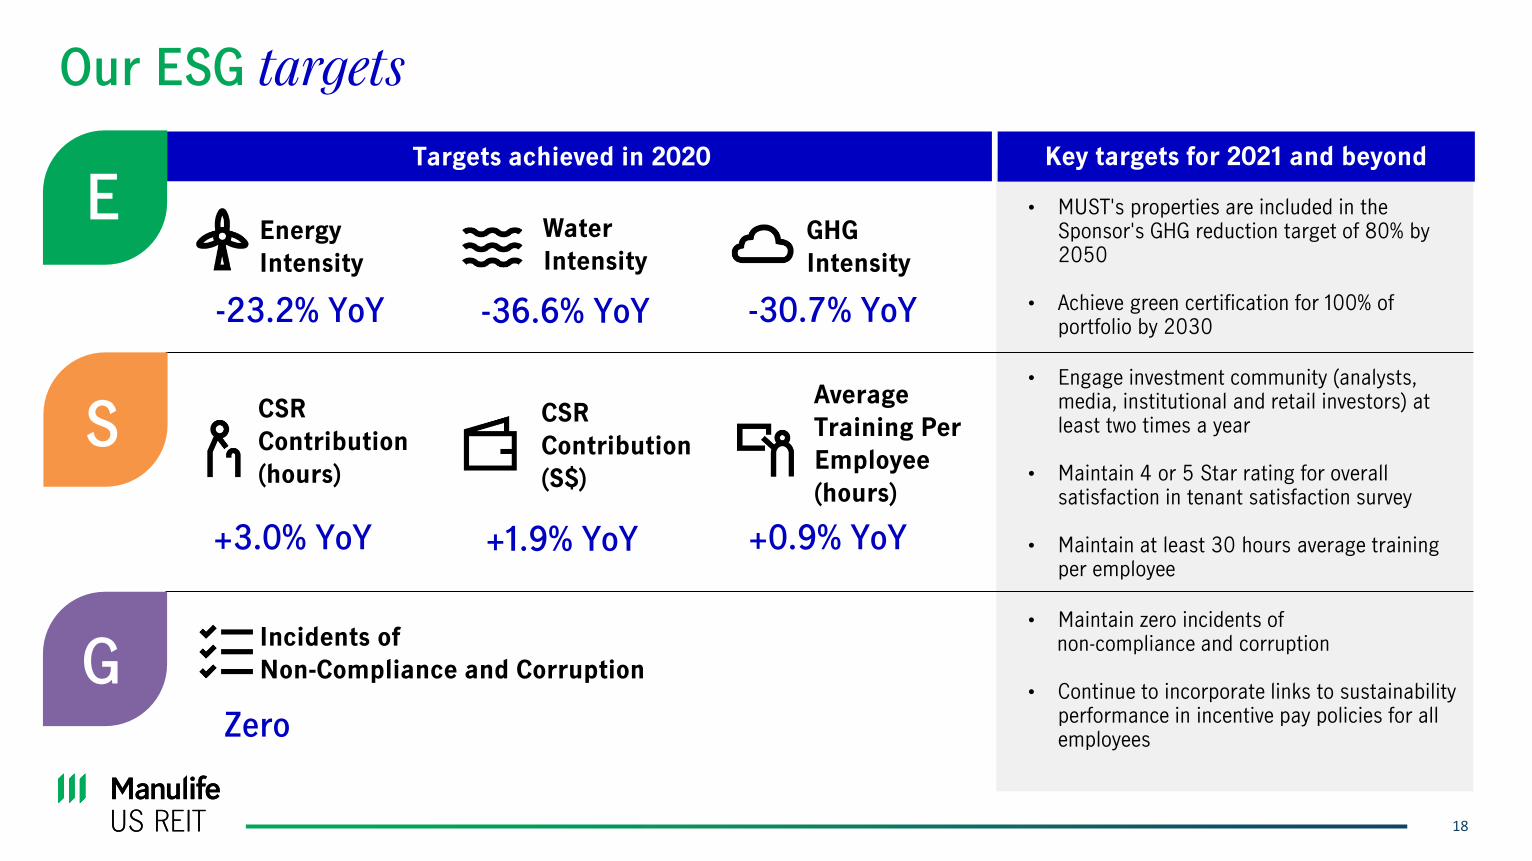
Our ESG targets
Energy
Intensity
-23.2% YoY -36.6% YoY
Water
Intensity
GHG
Intensity
-30.7% YoY
CSR
Contribution
(hours)
CSR
Contribution
(S$)
Average
Training Per
Employee
(hours)
+3.0% YoY +1.9% YoY +0.9% YoY
Incidents of
Non-Compliance and Corruption
Zero
Targets achieved in 2020 Key targets for 2021 and beyond
• MUST's properties are included in the Sponsor's GHG reduction target of 80% by 2050
• Achieve green certification for 100% of portfolio by 2030
• Engage investment community (analysts, media, institutional and retail investors) at least two times a year
• Maintain 4 or 5 Star rating for overall satisfaction in tenant satisfaction survey
• Maintain at least 30 hours average training per employee
• Maintain zero incidents of non-compliance and corruption
• Continue to incorporate links to sustainability performance in incentive pay policies for all employees
E
S
G
19
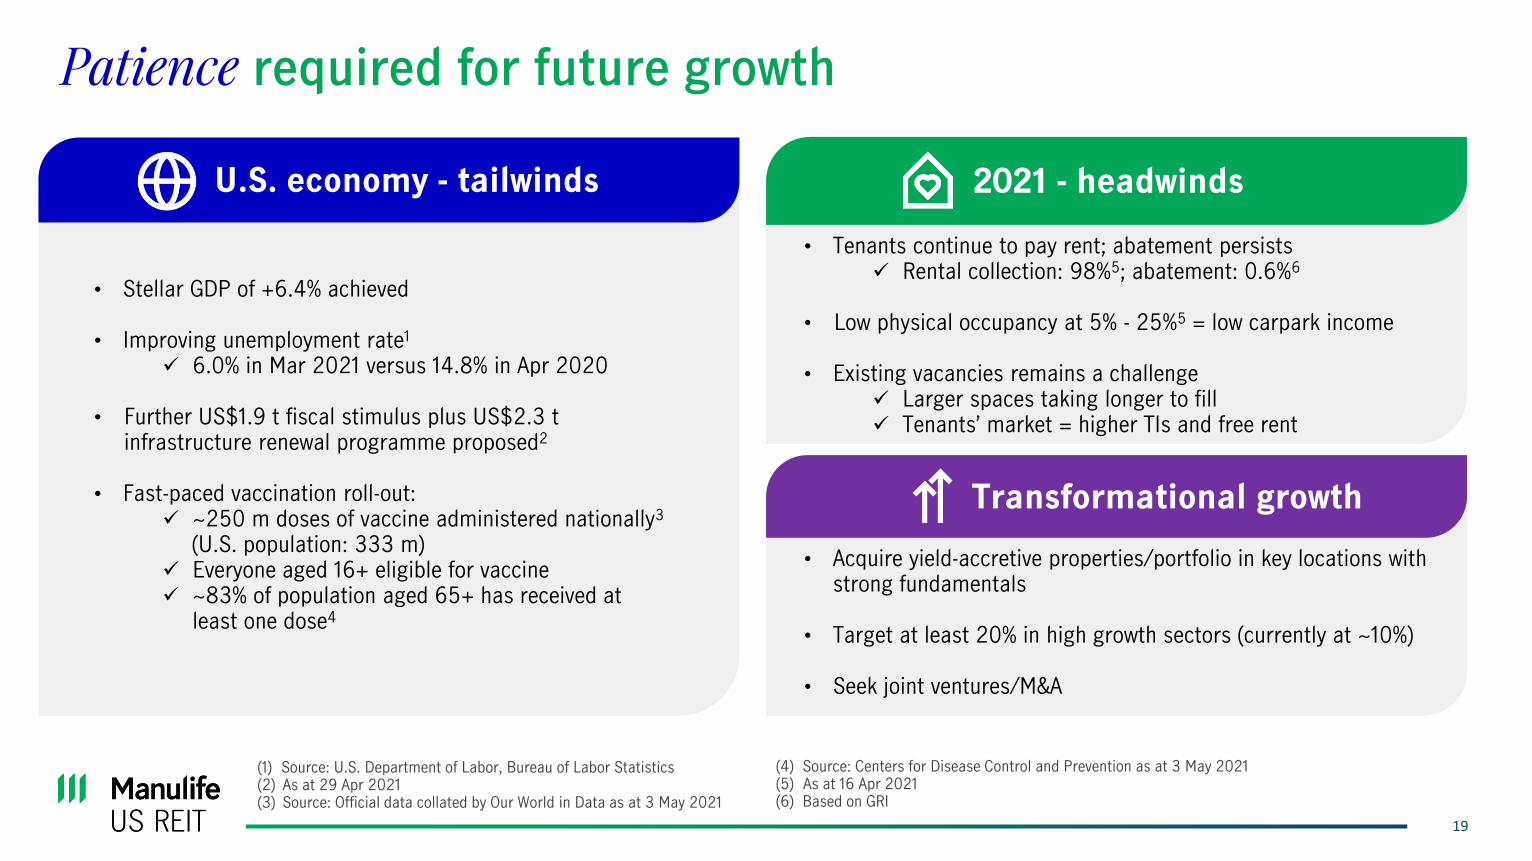
Patience required for future growth
• Stellar GDP of +6.4% achieved
• Improving unemployment rate1
✓ 6.0% in Mar 2021 versus 14.8% in Apr 2020
• Further US$1.9 t fiscal stimulus plus US$2.3 t infrastructure renewal programme proposed2
• Fast-paced vaccination roll-out:✓ ~250 m doses of vaccine administered nationally3
(U.S. population: 333 m)✓ Everyone aged 16+ eligible for vaccine✓ ~83% of population aged 65+ has received at
least one dose4
(1) Source: U.S. Department of Labor, Bureau of Labor Statistics(2) As at 29 Apr 2021(3) Source: Official data collated by Our World in Data as at 3 May 2021
• Tenants continue to pay rent; abatement persists✓ Rental collection: 98%5; abatement: 0.6%6
• Low physical occupancy at 5% - 25%5 = low carpark income
• Existing vacancies remains a challenge✓ Larger spaces taking longer to fill✓ Tenants’ market = higher TIs and free rent
(4) Source: Centers for Disease Control and Prevention as at 3 May 2021(5) As at 16 Apr 2021(6) Based on GRI
U.S. economy - tailwinds 2021 - headwinds
Transformational growth
• Acquire yield-accretive properties/portfolio in key locations with strong fundamentals
• Target at least 20% in high growth sectors (currently at ~10%)
• Seek joint ventures/M&A
Michelson, Irvine
Thank You!
Manulife US Real Estate Management Pte. Ltd.
(Company registration no. 201503253R)
8 Cross Street, #16-03 Manulife Tower, Singapore 048424
http://www.manulifeusreit.sg
For enquiries, please contact:
Ms Caroline Fong
Chief Investor Relations and Capital Markets Officer
(65) 6801 1066

Penn, Washington, D.C.
22
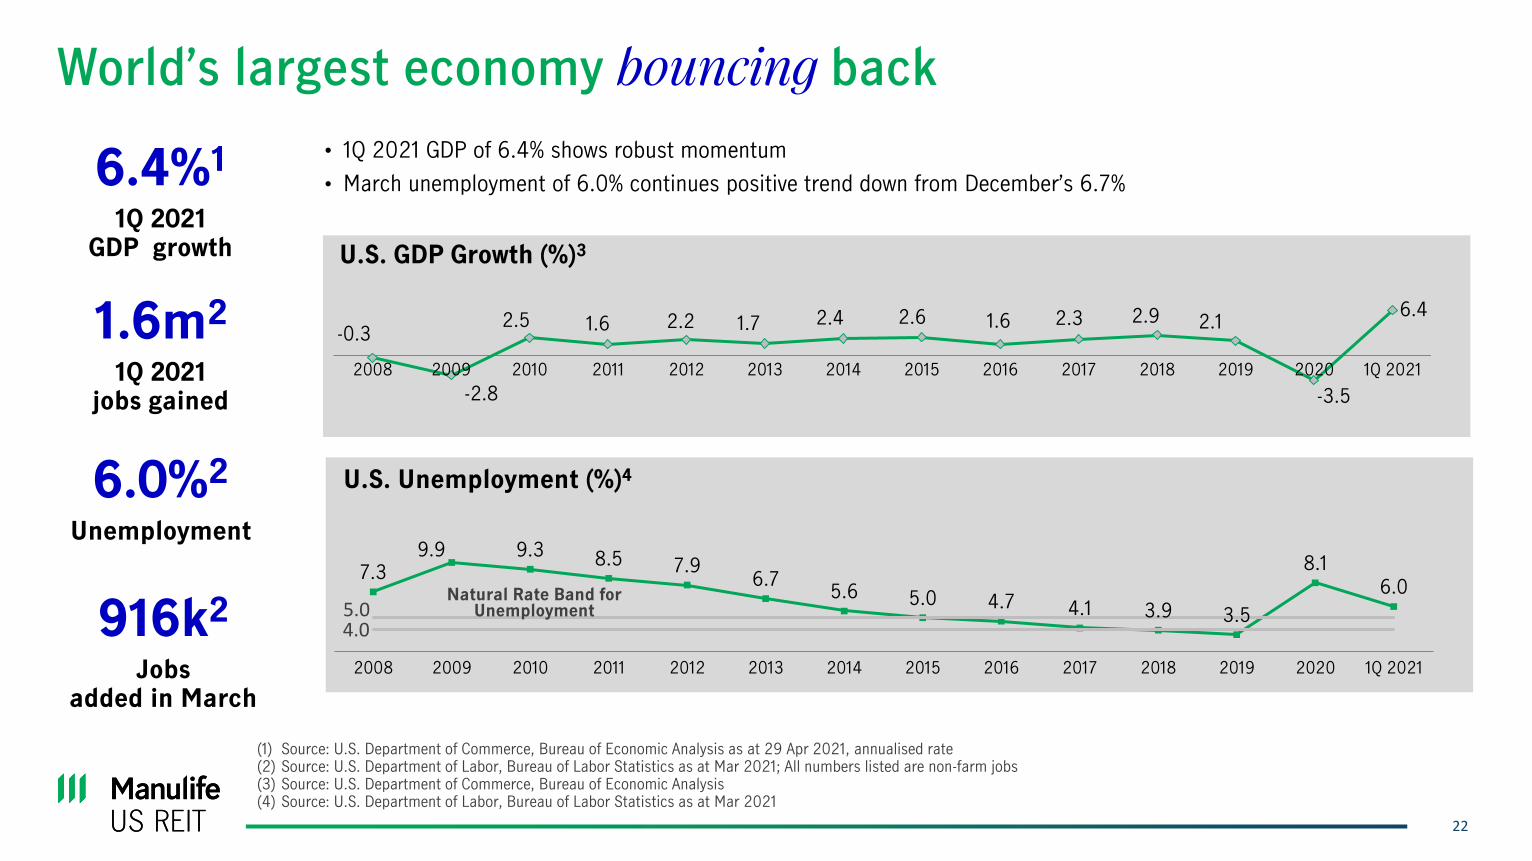
World’s largest economy bouncing back
• 1Q 2021 GDP of 6.4% shows robust momentum
• March unemployment of 6.0% continues positive trend down from December’s 6.7%
(1) Source: U.S. Department of Commerce, Bureau of Economic Analysis as at 29 Apr 2021, annualised rate(2) Source: U.S. Department of Labor, Bureau of Labor Statistics as at Mar 2021; All numbers listed are non-farm jobs(3) Source: U.S. Department of Commerce, Bureau of Economic Analysis(4) Source: U.S. Department of Labor, Bureau of Labor Statistics as at Mar 2021
U.S. GDP Growth (%)3
U.S. Unemployment (%)4
7.39.9 9.3 8.5 7.9
6.75.6 5.0 4.7 4.1 3.9 3.5
8.1
6.0
2008 2009 2010 2011 2012 2013 2014 2015 2016 2017 2018 2019 2020 1Q 2021
Natural Rate Band for Unemployment
4.05.0
-0.3
-2.8
2.5 1.6 2.2 1.7 2.4 2.6 1.6 2.3 2.9 2.1
-3.5
6.4
2008 2009 2010 2011 2012 2013 2014 2015 2016 2017 2018 2019 2020 1Q 2021
6.0%2
Unemployment
6.4%1
1Q 2021GDP growth
1.6m2
1Q 2021 jobs gained
916k2
Jobsadded in March
23
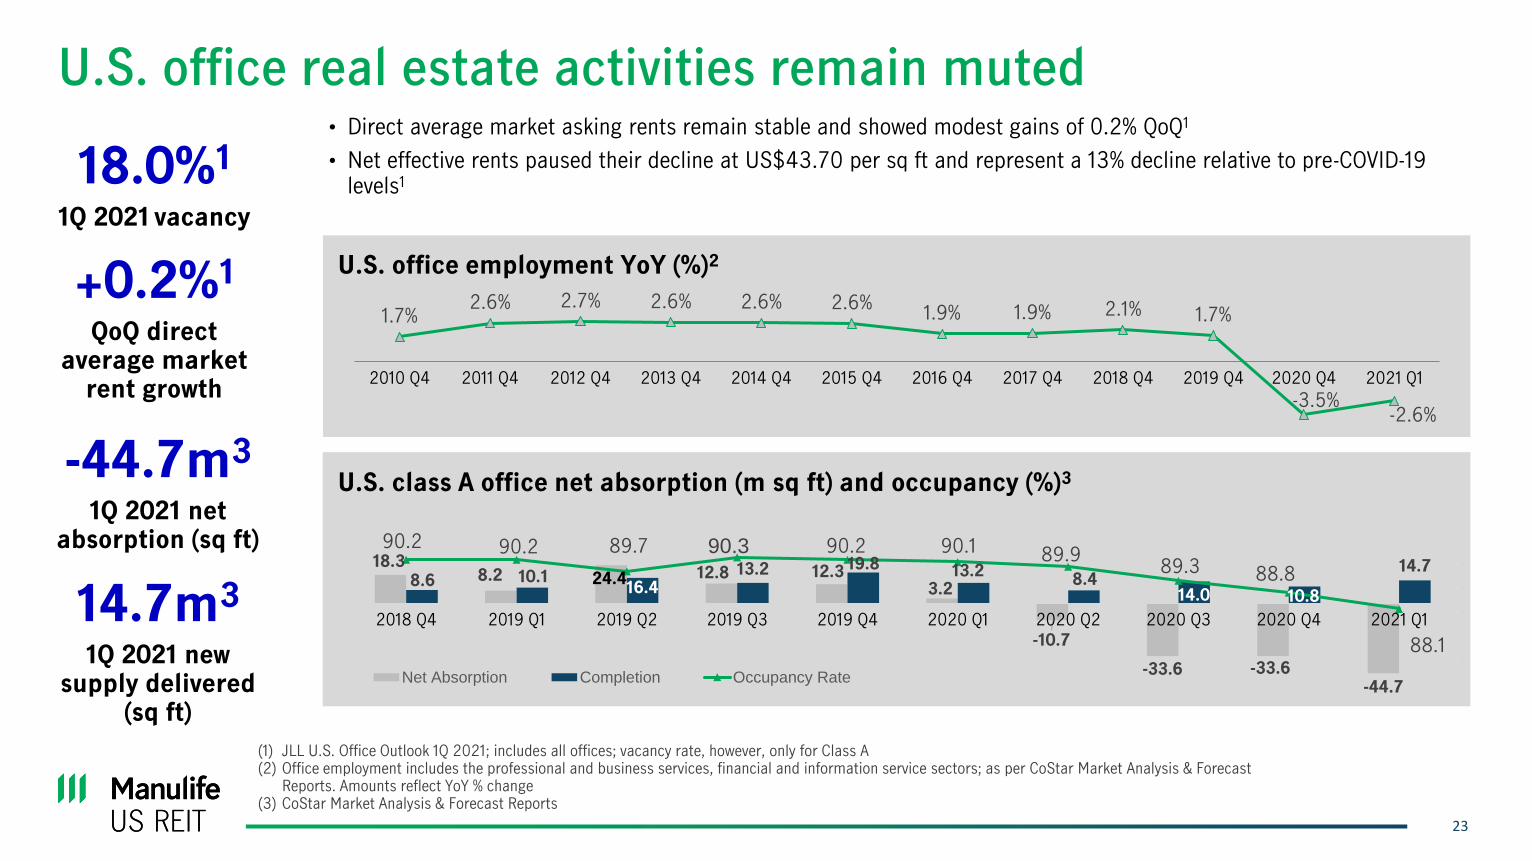
U.S. office real estate activities remain muted• Direct average market asking rents remain stable and showed modest gains of 0.2% QoQ1
• Net effective rents paused their decline at US$43.70 per sq ft and represent a 13% decline relative to pre-COVID-19 levels1
+0.2%1
QoQ direct average market
rent growth
18.0%1
1Q 2021 vacancy
14.7m3
1Q 2021 new supply delivered
(sq ft)
-44.7m3
1Q 2021 net absorption (sq ft)
U.S. office employment YoY (%)2
1.7%2.6% 2.7% 2.6% 2.6% 2.6%
1.9% 1.9% 2.1% 1.7%
-3.5%-2.6%
2010 Q4 2011 Q4 2012 Q4 2013 Q4 2014 Q4 2015 Q4 2016 Q4 2017 Q4 2018 Q4 2019 Q4 2020 Q4 2021 Q1
U.S. class A office net absorption (m sq ft) and occupancy (%)3
18.38.2 24.4 12.8 12.3
3.2
-10.7
-33.6 -33.6-44.7
8.6 10.116.4
13.2 19.8 13.28.4
14.0 10.8
14.7
90.2 90.2 89.7 90.3 90.2 90.1 89.989.3 88.8
88.1
85. 0
86. 0
87. 0
88. 0
89. 0
90. 0
91. 0
-50.0
-40.0
-30.0
-20.0
-10.0
0.0
10. 0
20. 0
30. 0
40. 0
2018 Q4 2019 Q1 2019 Q2 2019 Q3 2019 Q4 2020 Q1 2020 Q2 2020 Q3 2020 Q4 2021 Q1
Net Absorption Completion Occupancy Rate
(1) JLL U.S. Office Outlook 1Q 2021; includes all offices; vacancy rate, however, only for Class A(2) Office employment includes the professional and business services, financial and information service sectors; as per CoStar Market Analysis & Forecast
Reports. Amounts reflect YoY % change(3) CoStar Market Analysis & Forecast Reports

24
40
38
36
34
32
30
28
26
24
199
5Q
4
Office-using employment (ex. gov and medical) (%)2
(1) Note: OECD’s definition of Knowledge Economy – “The knowledge based economy” is an expression coined to describe trends in advanced economies towards greater dependence on knowledge, information and high skill levels, and the increasing need for ready access to all of these by the business and public sectors.
(2) Source: Cushman and Wakefield report as at 30 Sep 2020: U.S. Property Markets & the Economy, U.S. Bureau of Labor Statistics; Moody's Analytics Forecasted(3) Source: CoStar Office Big Book as at Apr 2021
Future of U.S. office – strong structural demand fuels growth
Office-using employment (m)
Rent growth forecast3
199
7Q
3
20
20
Q2
199
9Q
2
20
01Q
1
25
24
23
22
21
20
19
18
17
20
02
Q4
20
04
Q3
20
06
Q2
20
08
Q1
20
09
Q4
20
11Q
3
20
13Q
2
20
15Q
1
20
16Q
4
20
18Q
3
20
22
Q1
20
23
Q4
20
25
Q3
20
27
Q2
20
29
Q1
20
30
Q4
% of total, RHS
Knowledge economy1 – Office-using industries take disproportionate share of future U.S. job gains
12
9
6
3
0
(3)
(6)
(9)
(12)
Annual Rent Growth (%)Rent per SF ($)42
37
32
27
22
17
12
7
2
25
Additional disclaimer
CoStarPS does not purport that the CoStarPS Materials herein are comprehensive, and, while they are believed to be accurate, the CoStarPS
Materials are not guaranteed to be free from error, omission or misstatement. CoStarPS has no obligation to update any of the CoStarPS Materials
included in this document, Any user of any such CoStarPS Materials accepts them “AS IS” WITHOUT ANY WARRANTIES WHATSOEVER, EITHER
EXPRESS OR IMPLIED, INCLUDING BUT NOT LIMITED TO THE IMPLIED WARRANTIES OF MERCHANTABILITY, NON-INFRINGEMENT, TITLE
AND FITNESS FOR ANY PARTICULAR PURPOSE. UNDER NO CIRCUMSTANCES SHALL COSTARPS OR ANY OF ITS AFFILIATES, OR ANY
OF THEIR DIRECTORS, OFFICERS, EMPLOYEES OR AGENTS, BE LIABLE FOR ANY INDIRECT, INCIDENTAL OR CONSEQUENTIAL
DAMAGES WHATSOEVER ARISING OUT OF THE COSTARPS MATERIALS, EVEN IF COSTARPS OR ANY OF ITS AFFILIATES HAS BEEN
ADVISED AS TO THE POSSIBILITY OF SUCH DAMAGES.
The CoStarPS Materials do not purport to contain all the information that may be required to evaluate the business and prospects of Manulife US
REIT or any purchase or sale of Manulife US REIT units. Any potential investor should conduct his, her or its own independent investigation and
analysis of the merits and risks of an investment in Manulife US REIT. CoStarPS does not sponsor, endorse, offer or promote an investment in
Manulife US REIT. The user of any such CoStarPS Materials accepts full responsibility for his, her or its own investment decisions and for the
consequences of those decisions.