
1Q 2018 EARNINGS...
21
1 1Q 2018 EARNINGS PRESENTATION APRIL 24, 2018
Transcript of 1Q 2018 EARNINGS...

1
1Q 2018 EARNINGS PRESENTATIONAPRIL 24, 2018

2
SAFE HARBOR
This presentation contains forward-looking statements within the meaning of the Private Securities Litigation Reform Act of 1995, Section 27A of the
Securities Act of 1933, as amended, or the Securities Act, and Section 21E of the Securities Exchange Act of 1934, as amended, or the Exchange Act,
which represent our management's beliefs and assumptions concerning future events. When used in this document and in documents incorporated
herein by reference, the words “expects,” “plans,” “anticipates,” “indicates,” “believes,” “forecast,” “guidance,” “outlook,” “may,” “will,” “should,” “seeks,”
“targets” and similar expressions are intended to identify forward-looking statements. Forward-looking statements involve risks, uncertainties and
assumptions, and are based on information currently available to us. Actual results may differ materially from those expressed in the forward-looking
statements due to many factors, including, without limitation, our extremely competitive industry; volatility in financial and credit markets which could
affect our ability to obtain debt and/or lease financing or to raise funds through debt or equity issuances; our significant fixed obligations and substantial
indebtedness; volatility in fuel prices, maintenance costs and interest rates; our reliance on high daily aircraft utilization; our ability to implement our
growth strategy; our ability to attract and retain qualified personnel and maintain our culture as we grow; our reliance on a limited number of suppliers;
our dependence on the New York and Boston metropolitan markets and the effect of increased congestion in these markets; our reliance on automated
systems and technology; our being subject to potential unionization, work stoppages, slowdowns or increased labor costs; our presence in some
international emerging markets that may experience political or economic instability or may subject us to legal risk; reputational and business risk from
information security breaches or cyber-attacks; changes in or additional domestic or foreign government regulation; changes in our industry due to other
airlines' financial condition; acts of war or terrorism; global economic conditions or an economic downturn leading to a continuing or accelerated
decrease in demand for air travel; the spread of infectious diseases; adverse weather conditions or natural disasters; and external geopolitical events
and conditions. It is routine for our internal projections and expectations to change as the year or each quarter in the year progresses, and therefore it
should be clearly understood that the internal projections, beliefs and assumptions upon which we base our expectations may change prior to the end of
each quarter or year. Further information concerning these and other factors is contained in the Company's Securities and Exchange Commission filings,
including but not limited to, the Company's 2017 Annual Report on Form 10-K and Quarterly Reports on Form 10-Q. In light of these risks and
uncertainties, the forward-looking events discussed in this presentation might not occur. We undertake no obligation to update any forward-looking
statements to reflect events or circumstances that may arise after the date of this presentation.
The following presentation also includes certain “non-GAAP financial measures” as defined in Regulation G under the Securities Exchange Act of 1934.
We refer you to the reconciliations made available in our Quarterly Reports on Form 10-Q and Annual Reports on Form 10-K (available on our website at
jetblue.com and at sec.gov) and in our first quarter earnings call (furnished on April 24th, 2018), which reconcile the non-GAAP financial measures
included in the following presentation to the most directly comparable financial measures calculated and presented in accordance with U.S. GAAP.
3

1Q 2018 EARNINGS UPDATE
ROBIN HAYES
PRESIDENT & CEO

4
• Maintaining mid-to-high single digit growth
• Focusing on up-gauging Boston and New York, and growing
Fort Lauderdale
• Further developing each Focus City to strengthen relevance
PRE-TAX MARGINS JBLU VS PEERS*
*Average of peer set (AAL, ALK, DAL, LUV, SAVE, UAL), consensus, guidance and reported results
WORKING TOWARDS SUPERIOR MARGINS
4
TTM1Q 2018
2018 KEY INITIATIVES
CO
MM
ER
CIA
LG
RO
WT
HS
TR
UC
TU
RA
L
CO
ST
S
FY 2017**
Peers Peers Peers
• Leveraging both All-Core and Mint A321s to enhance margins
• Implementing self-service strategies to improve Customer
experience and increase efficiencies
• New President for JetBlue Travel Products announced
• Technology investments to support Structural Cost Program
• Engine selection milestone achieved under Tech Ops
• Making further progress on A320 cabin restyling program
Superior Margins defined as the simple average of LUV, SAVE, ALK
**Pre-Tax Margins for FY 2017 under new accounting standards for Revenue from Contracts with Customers (Topic 606), where available
6.3%
5.3%
13.0% 12.8% 12.6%12.0%

COMMERCIAL UPDATE & OUTLOOK
MARTY ST. GEORGE
EVP COMMERCIAL AND PLANNING

6
FOCUSED GROWTH SUPPORTS MARGIN COMMITMENTS
*Flown capacity
6
ASM YOY GROWTH*
− RASM growth outperforming system for four consecutive quarters
− Network growth continues via added frequencies and destinations
− Low completion factor in the Northeast reduced growth below initial
capacity guidance range
− Continuing to up-gauge VFR and leisure markets
− Transcon franchise performing well, both Mint and non-Mint markets
− New Mint routes (San Diego, Las Vegas, Seattle) ramping as expected
− Strongest region in year over year RASM growth
− Puerto Rico recovery continues and developing as expected
3.3%
1Q 2018 2Q 2018E 2018E
6.5% - 8.5%
5.0% - 7.0%
NY
CF
LL
BO
SM
INT
/ T
CO
NL
AT
IN
− Strengthening business franchise (Minneapolis starting 2Q)
− Similar to NYC, leisure market up-gauging with A321 deliveries
3.5 - 5.5%

7
6.1%
1Q 2018 2Q 2018E
RASM YOY GROWTH
UNIT REVENUE: DRIVEN BY STRONG CLOSE-IN DEMAND
• 1Q RASM exceeded expectations, driven by strong
close-in peak demand
− Close-in leisure drove incremental RASM strength
− Solid pricing environment in both Mint and non-Mint transcon
− 1.0 point tailwind from weather impact in 1Q
• 2Q RASM headwinds: calendar and tougher comps
− 2.5 point calendar placement headwind: holiday moving from
2Q (2017) into 1Q (2018)
− 1.25 point tougher comp from lower completion factor and
incentive payments related to co-brand card (2Q 2017)
− Strong peak demand; fewer peak days in 2Q than 1Q
• Ancillaries better than expected
− Co-brand credit card continues to grow
− Starting to lap 1Q 2017 initiatives
7
(3.0%) – (0.0%)
3.5 - 5.5%
8
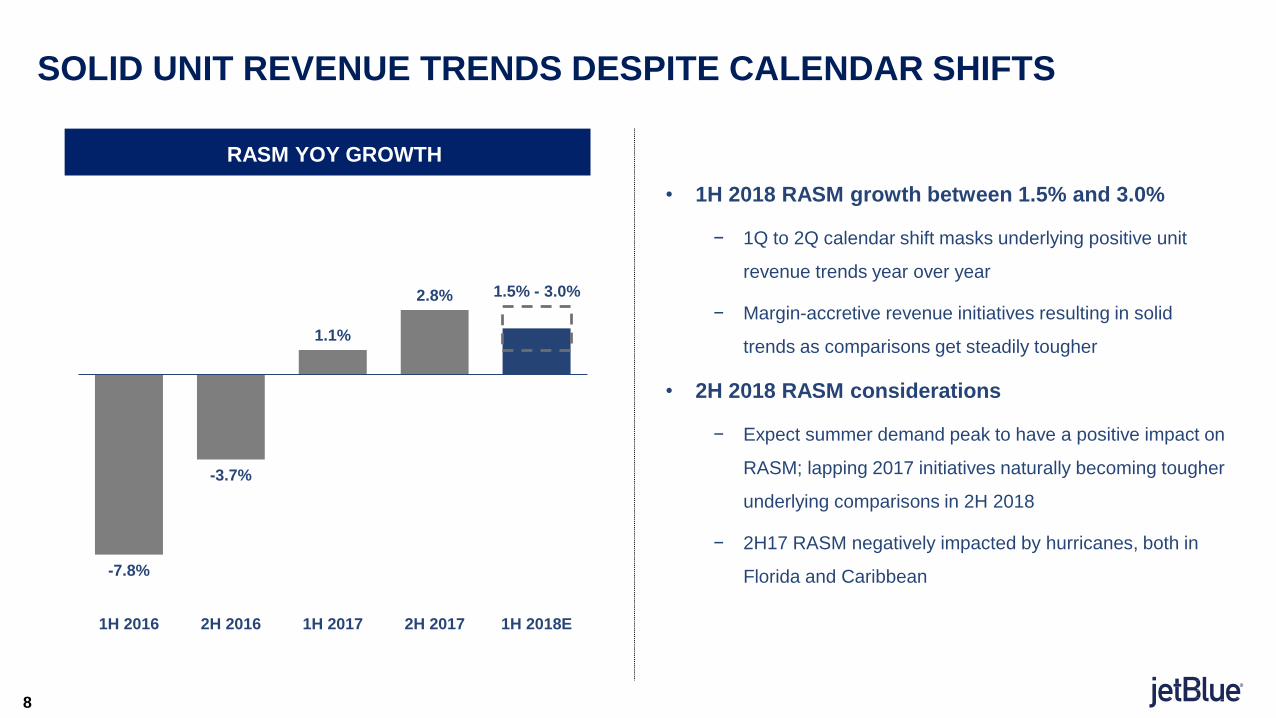
-7.8%
-3.7%
1.1%
2.8%
1H 2016 2H 2016 1H 2017 2H 2017 1H 2018E
RASM YOY GROWTH
SOLID UNIT REVENUE TRENDS DESPITE CALENDAR SHIFTS
• 1H 2018 RASM growth between 1.5% and 3.0%
− 1Q to 2Q calendar shift masks underlying positive unit
revenue trends year over year
− Margin-accretive revenue initiatives resulting in solid
trends as comparisons get steadily tougher
• 2H 2018 RASM considerations
− Expect summer demand peak to have a positive impact on
RASM; lapping 2017 initiatives naturally becoming tougher
underlying comparisons in 2H 2018
− 2H17 RASM negatively impacted by hurricanes, both in
Florida and Caribbean
8
1.5% - 3.0%

FINANCIAL UPDATE & OUTLOOK
STEVE PRIEST
EVP CHIEF FINANCIAL OFFICER

10
11.79
12.50
1Q 2017 1Q 2018 1Q 2017 1Q 2018
1Q 2018 RESULTS
10
CASM EX-FUEL* PRE TAX MARGIN EARNINGS PER SHARE
• Solid revenue growth driven by
close-in leisure demand
• Growing ancillary revenues
• Pressure from lower
completion factor (weather)
• Positive impact of shift
of maintenance expenses
• Higher fuel prices more
than offset strong RASM
performance
• Pressure from fuel was
offset by lower tax rate
and share repurchases
6.1%
8.30
8.55
1Q 2017 1Q 2018
3.1%
7.6%
6.3%
1Q 2017 1Q 2018
(US$ cents) (US$ cents) (US$ cents)
27
24
RASM
*Refer to Appendix D on Non-GAAP Financial Measures

11
CASM EX-FUEL YOY GROWTH*
UNIT COSTS: MANAGING HEADWINDS TO ACHIEVE GOALS
• 1Q CASM ex-fuel at the mid-point of initial guidance
− Lower completion factor from a more active winter than
normal in the Northeast, resulted in ~one point headwind to
CASM ex-fuel
− Strong focus on cost management; timing of maintenance
expenses shifting to later in the year
• 2Q and full year 2018 cost guidance
− 2Q 2018 range between 2.0% to 4.0%, driven by
maintenance timing from 1Q
− Continue to expect full year 2018 CASM ex-fuel growth
between (1.0%) and 1.0%, driven by ongoing cost controls
and progress in Structural Cost program
11
4.8%
3.1%
2017 1Q 2018 2Q 2018E 2018E
2.0% - 4.0% 2.0% - 4.0%
(1.0)% - 1.0%
*Refer to Appendix D on Non-GAAP Financial Measures

12
4.1%
5.3%
1H 2017 2H 2017 1H 2018 2H 2018
EXPECT CASM EX-FUEL INFLECTION DURING 2H 2018
• CASM ex-fuel growth negative by 2H 2018
− 1H expected to grow between 2.0-4.0%; only material
change is lower completion factor in 1Q 2018
− 2H expected to decline 2.0% or more, including storm
impact and one-time Crewmember bonus (2017)
• 2H 2018 CASM ex-fuel trends lower as Structural
Cost benefits ramp up
− Tech Ops unit costs still expected to decline materially
− Unit labor costs flat
• 2019 & 2020 to see further CASM ex-fuel benefits
− Added savings as Structural Cost Program ramps up
− Added seats from restyle program impacting 2019 / 2020
*CASM ex-fuel including impact of hurricanes and tax reform bonus in FY 2017
Note: The estimates above do not include the potential outcome of a pilot deal
Refer to Appendix D on Non-GAAP Financial Measures
CASM ex-fuel (0.5) to
+1.5% by 2H 2018, ex-
impact of hurricanes and
tax reform bonus
1412
CASM EX-FUEL YOY GROWTHCASM EX-FUEL YOY GROWTH*
(0.5) - 1.5%*
2.0 - 4.0%
(4.0) - (2.0)%

13
STRUCTURAL COST PROGRAM UPDATE: TRACKING TO $250-$300M
13
Renegotiating sourcing and IT contracts
Maximizing data storage infrastructure, software utilization
Enabling Customer support tools to increase service efficiency
Re-negotiating distribution contracts to minimize transaction costs
TE
CH
OP
SC
OR
PO
RA
TE
AIR
PO
RT
SD
IST
RIB
UT
ION
Ongoing RFP for V2500 heavy maintenance
Lease buyouts; long term planning and mobility software
KEY 1Q 2018 DEVELOPMENTSPILLARS
• NEO engine maintenance deal achieved
− Pratt & Whitney selected for 85 NEO aircraft on order
− Terms include purchase and maintenance
− 183 engines in total, including spares
− 15 year term from delivery of each engine
• 16 airport lobbies with self-tagging capabilities
− 24 JetBlue cities expected to be completed by year-end
− Enhancing Crewmember efficiency, improving
Customer experience
Deploying self-service technology to airport lobbies
Consolidating sourcing contracts

14
2Q 2018E 2018E 2017-2020E
CAPEX: ACCRETIVE FLEET GROWTH AND REINVESTMENT
14
Year A320neo A321ceo A321neo Total
2018 - 10 - 10
2019 - - 13 13
2020 6 - 7 13
~$1.1b
60 60 60 60
130 130 130 130
21 21 23 28
32 34 34 35
2017 1Q 2018 2Q 2018E 2018E
E190 A320 A321 HD A321 Mint
243 245253
247
FLEET CAPITAL EXPENDITURES
$35m - $50m
$190m - $225m
$150m - $200m
$750m - $900m
Guidance as of 04/24/18
Aircraft Non-Aircraft

15
1,422
267
1,120
202
367
CAPITAL ALLOCATION PRIORITIES
15
General Guidelines
• Maintain investment grade financial metrics
• Balanced approach to growth, reinvestment and capital
return to shareholders
• Support EPS growth via share repurchases
Priorities
• Investments in fleet to support organic growth and improve
returns (e.g., cabin restyling and lease buy-outs)
• Return-accretive non-aircraft CAPEX to support margin
commitments and structural cost savings
SOURCES / USES OF CASH
SOURCES USES
(US$ millions)
CAPITAL ALLOCATION FRAMEWORK
TTM 1Q 2018 TTM 1Q 2018
Cash from
Ops and
other
Reduced
Cash and STI
Balance
Share
Repurchases,
net
Debt
Repayments
CAPEX

16
2018 GUIDE SUMMARY
16
CAPACITY
2Q 2018 FY 2018
5.0 – 7.0% 6.5 – 8.5%
RASM
2Q 2018 FY 2018
(3.0) – 0.0% N/A
CASM EX-FUEL
2Q 2018 FY 2018
2.0 – 4.0% (1.0) – 1.0%
ALL-IN FUEL PRICE
2Q 2018 FY 2018
$2.23 / gal N/A
CAPEX AIRCRAFT
2Q 2018 FY 2018
$190 - 225m $750 – 900m
CAPEX NON-AIRCRAFT
2Q 2018 FY 2018
$35 – 50m $150 – 200m
OTHER INCOME / (EXPENSE)
2Q 2018 FY 2018
($18) – (23)m ($80) – (90)m
JBTP / JTV (EXPENSES)
2Q 2018 FY 2018
($9) – (14)m ($35) – (45)m


18
APPENDIX A: 1Q 2018 FINANCIAL RESULTS
US$ millions 1Q 2018 1Q 2017 Var %
Total Operating Revenues 1,754 1,600 9.6
Aircraft fuel and related taxes 417 323 29.2
Salaries, wages and benefits 499 466 7.0
Landing fees and other rents 100 95 4.4
Depreciation and amortization 117 105 11.7
Aircraft rent 24 26 (5.2)
Sales and marketing 67 61 10.8
Maintenance, materials and repairs 142 152 (6.9)
Other operating expenses 260 230 12.8
OPERATING INCOME 128 142 (10.0)
Other Income (Expense) (18) (21) (15.0)
Income before taxes 110 121 (9.2)
Income tax expense 22 39 (43.4)
NET INCOME 88 82 7.0
Pre-Tax Margin 6.3% 7.6% (1.3) pts
Earnings per Share (EPS) $0.27 $0.24

19
APPENDIX B: OTHER NON-AIRLINE OPERATING EXPENSES
(JBTP/JTV EXPENSES, $m)
$8$9 $9 $9 $9
1Q 2017 2Q 2017 3Q 2017 4Q 2017 1Q 2018 2Q 2018E 2017 2018E
$36
$35 - $45
$9 – $14

20
APPENDIX C: RELEVANT JETBLUE MATERIALS
Investor Presentations http://blueir.investproductions.com/investor-relations/events-and-presentations/presentations
Earnings Releases http://blueir.investproductions.com/investor-relations/financial-information/quarterly-results
Annual Reports http://blueir.investproductions.com/investor-relations/financial-information/reports/annual-reports
SEC Filings http://blueir.investproductions.com/investor-relations/financial-information/sec-filings
Proxy Statements http://blueir.investproductions.com/investor-relations/financial-information/reports/proxy-statements
Investor Updates http://blueir.investproductions.com/investor-relations/financial-information/investor-updates
Traffic Reports http://blueir.investproductions.com/investor-relations/financial-information/traffic-releases
ESG Reports* http://blueir.investproductions.com/investor-relations/financial-information/reports/sustainable-accounting-standards-board-reports
www.investor.jetblue.com/investor-relations
DOCUMENT LOCATION
* Environmental, Social, and Governance Reports

21
APPENDIX D: NOTE ON NON-GAAP FINANCIAL MEASURES
Consolidated operating cost per available seat mile, excludes fuel and related taxes, and operating expenses
related to other non-airline businesses (CASM Ex-Fuel) is a non-GAAP financial measure that we use to
measure our core performance. Note A within our quarterly earnings release (provided in our Current Report
on Form 8-K furnished to the Securities and Exchange Commission on April 24, 2018) provides a
reconciliation of non-GAAP financial measures used in this presentation and provides the reasons
management uses those measures.


