
1“Principles & Applications of SAR” Instructor: Franz Meyer © 2009, University of Alaska ALL...
27
1 “Principles & Applications of SAR” Instructor: Franz Meyer © 2009, University of Alaska ALL RIGHTS RESERVED Dr. Franz J Meyer Earth & Planetary Remote Sensing University of Alaska Fairbanks [email protected] -4 -2 0 2 4 -4 -2 0 2 4 -0.5 0 0.5 -4 -2 0 2 4 2 x 1 x 2 1 , x x u Mathematical Basics
-
Upload
horatio-black -
Category
Documents
-
view
217 -
download
2
Transcript of 1“Principles & Applications of SAR” Instructor: Franz Meyer © 2009, University of Alaska ALL...

1“Principles & Applications of SAR”Instructor: Franz Meyer
© 2009, University of AlaskaALL RIGHTS RESERVED
Dr. Franz J MeyerEarth & Planetary Remote Sensing
University of Alaska [email protected]
-4
-2
0
2
4-4
-2
0
2
4
-0.5
0
0.5
-4
-2
0
2
4
2x
1x
21, xxu
Mathematical Basics

2“Principles & Applications of SAR”Instructor: Franz Meyer
© 2009, University of AlaskaALL RIGHTS RESERVED
Complex Numbers and Oscillating Signals
-4
-2
0
2
4-4
-2
0
2
4
-0.5
0
0.5
-4
-2
0
2
4
2x
1x
21, xxu
3“Principles & Applications of SAR”Instructor: Franz Meyer
© 2009, University of AlaskaALL RIGHTS RESERVED
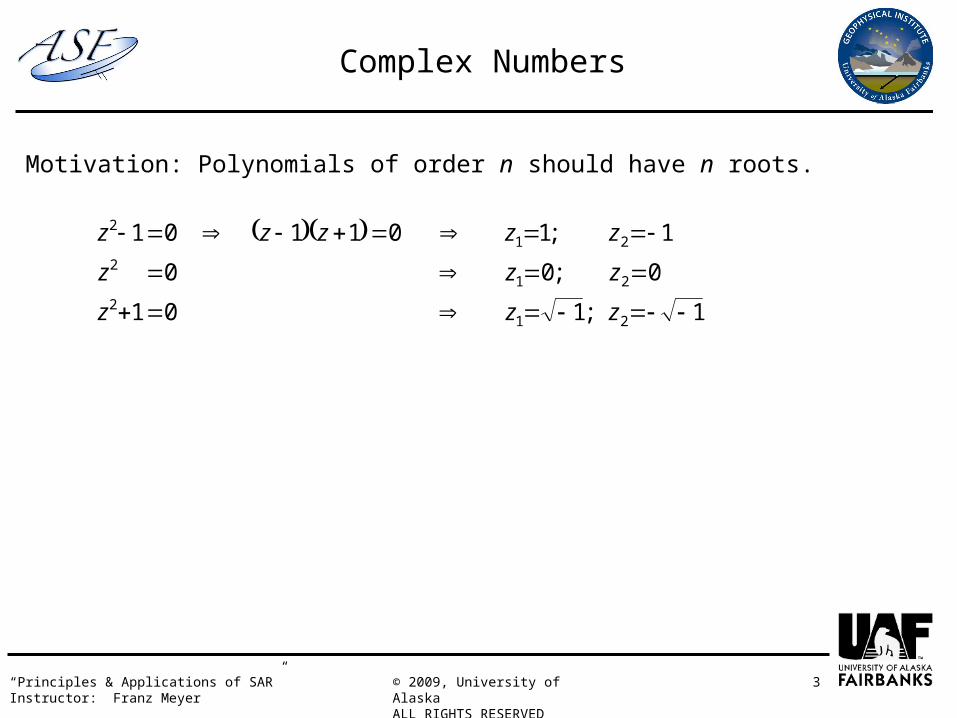
Complex Numbers
Motivation: Polynomials of order n should have n roots.
1;101
0;00
1;101101
212
212
212
zzz
zzz
zzzzz

4“Principles & Applications of SAR”Instructor: Franz Meyer
© 2009, University of AlaskaALL RIGHTS RESERVED
Complex Numbers
Motivation: Polynomials of order n should have n roots.
Def.: 1j imaginary unit (in mathematics mostly: „ i “)
real part
1;101
0;00
1;101101
212
212
212
zzz
zzz
zzzzz
yxyjxz ,
zx Re
zy Im imaginary part
complex number
5“Principles & Applications of SAR”Instructor: Franz Meyer
© 2009, University of AlaskaALL RIGHTS RESERVED
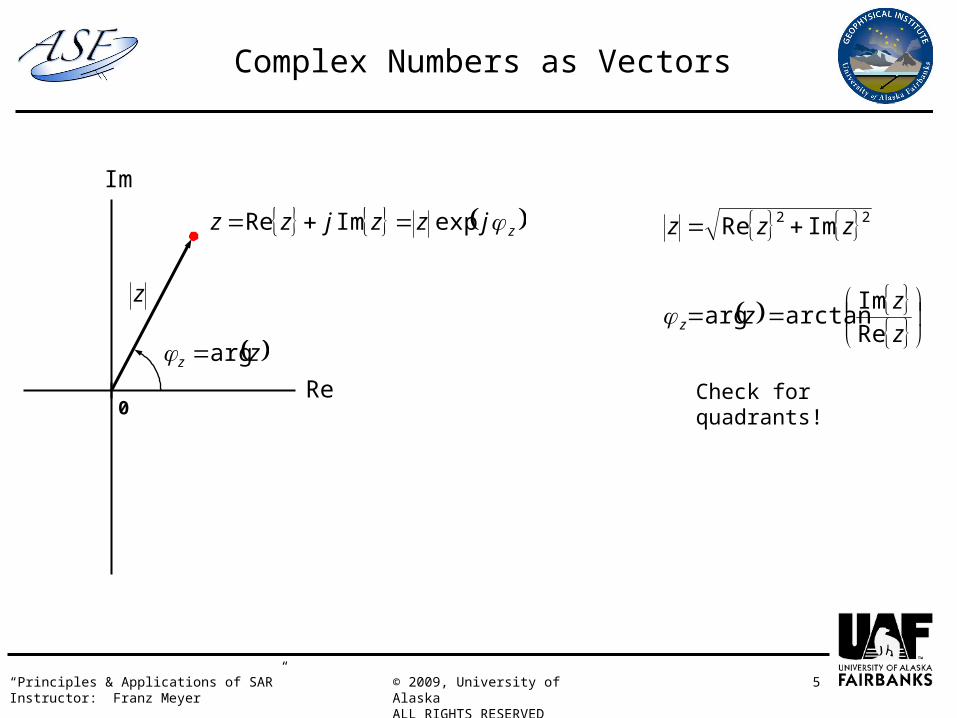
Complex Numbers as Vectors
zjzzjzz expImRe
z
Im
Re
zz argCheck for quadrants!
22 ImRe zzz
z
zzz Re
Imarctanarg
0

6“Principles & Applications of SAR”Instructor: Franz Meyer
© 2009, University of AlaskaALL RIGHTS RESERVED
Corresponds to vector sum:
212121 ImImReRe zzjzzzz
1z
2z
21 zz
Im
Re
Summation of Complex Numbers
7“Principles & Applications of SAR”Instructor: Franz Meyer
© 2009, University of AlaskaALL RIGHTS RESERVED
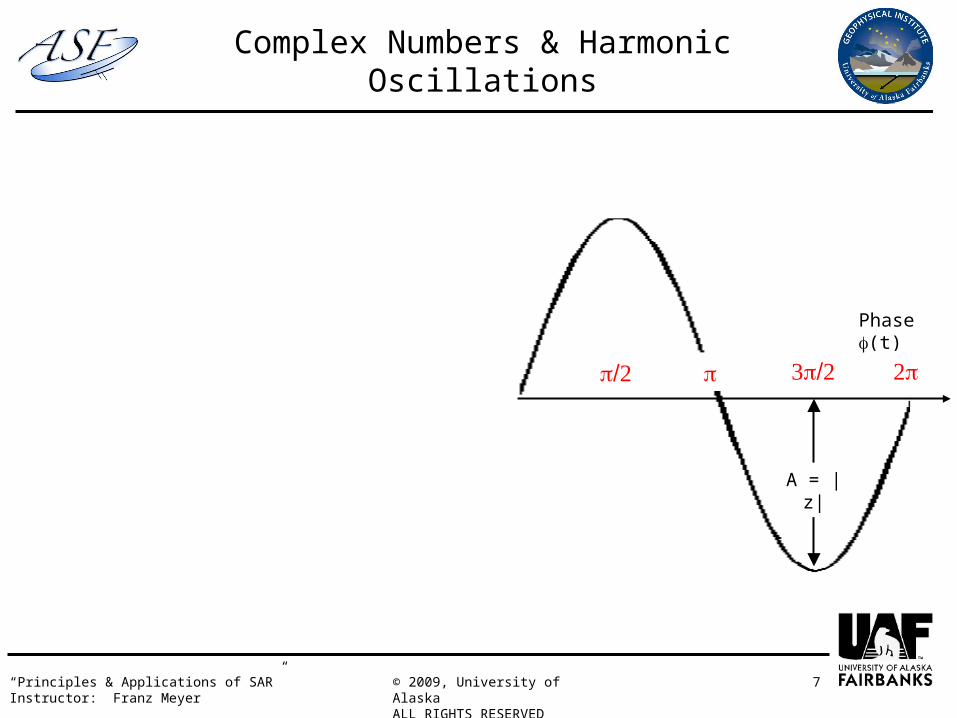
Complex Numbers & Harmonic Oscillations
Phase (t)
A = |z|
8“Principles & Applications of SAR”Instructor: Franz Meyer
© 2009, University of AlaskaALL RIGHTS RESERVED
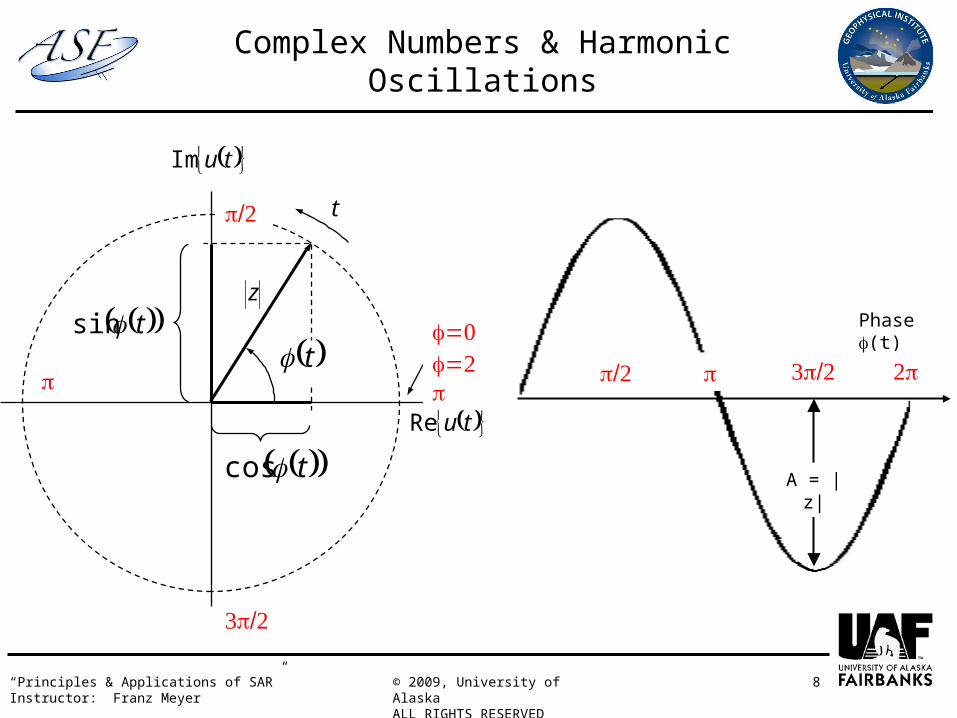
Complex Numbers & Harmonic Oscillations
t
tuRe
tuIm
tsin
tcos
t
Phase (t)
z
A = |z|
9“Principles & Applications of SAR”Instructor: Franz Meyer
© 2009, University of AlaskaALL RIGHTS RESERVED
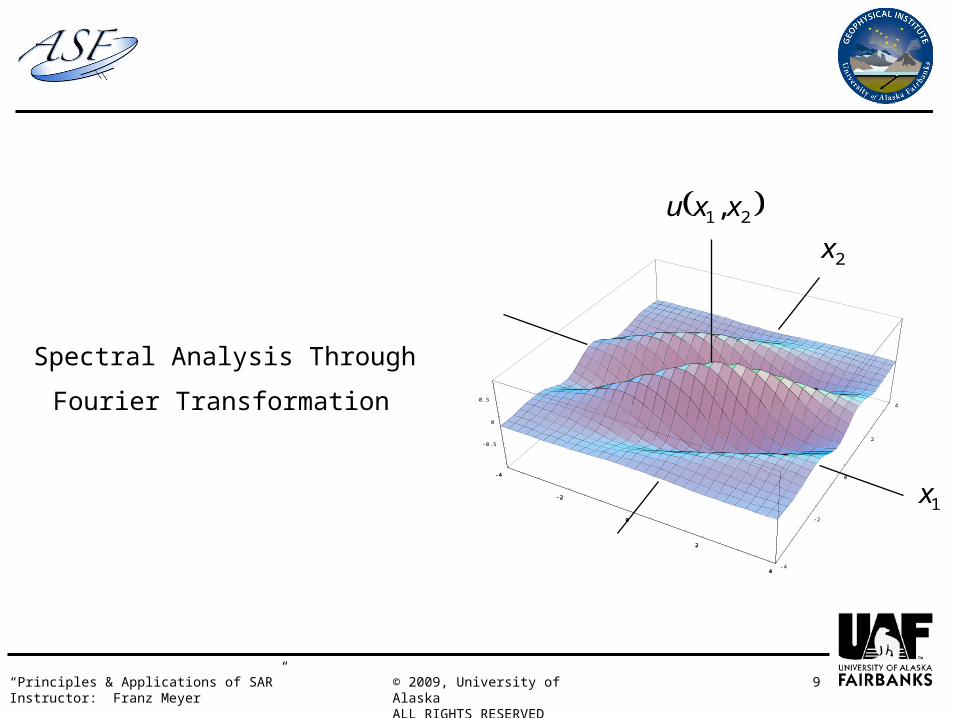
Spectral Analysis Through
Fourier Transformation
-4
-2
0
2
4-4
-2
0
2
4
-0.5
0
0.5
-4
-2
0
2
4
2x
1x
21, xxu
10“Principles & Applications of SAR”Instructor: Franz Meyer
© 2009, University of AlaskaALL RIGHTS RESERVED
Spectral Analysis
• Fourier analysis of signals:
Representation of a signal by sine and cosine oscillations of varying amplitude and frequency
=> Transformation from time domain to frequency domain & analysis of signal energy in different frequencies
11“Principles & Applications of SAR”Instructor: Franz Meyer
© 2009, University of AlaskaALL RIGHTS RESERVED
Spectral Analysis
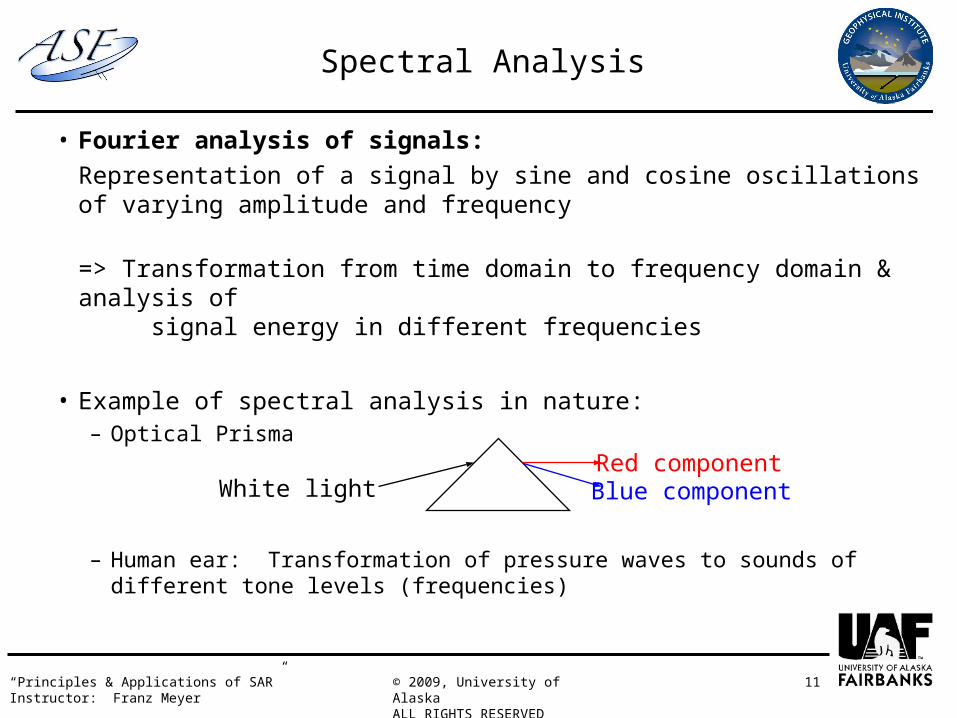
• Fourier analysis of signals:
Representation of a signal by sine and cosine oscillations of varying amplitude and frequency
=> Transformation from time domain to frequency domain & analysis of signal energy in different frequencies
• Example of spectral analysis in nature:– Optical Prisma
– Human ear: Transformation of pressure waves to sounds of different tone levels (frequencies)
White light Blue componentRed component

Spectral Analysis
Example:
12

13“Principles & Applications of SAR”Instructor: Franz Meyer
© 2009, University of AlaskaALL RIGHTS RESERVED
Spectral Analysis
• Benefit of Fourier Analysis:– Transformation of difficult signal into a set of very simple signals eases signal
analysis– Removal of frequencies with low amplitude allows signal compression without loss of
signal quality (e.g. mpeg, jpeg, ...)
• Analysis of image content and image manipulation:– E.g. Design of low-pass and high-pass filters– Texture analysis– ...
• Some mathematical operations much easier in frequency domain– Correlation in time domain: many thousand operations (depending on signal length)– Correlation in frequency domain: only a single multiplication
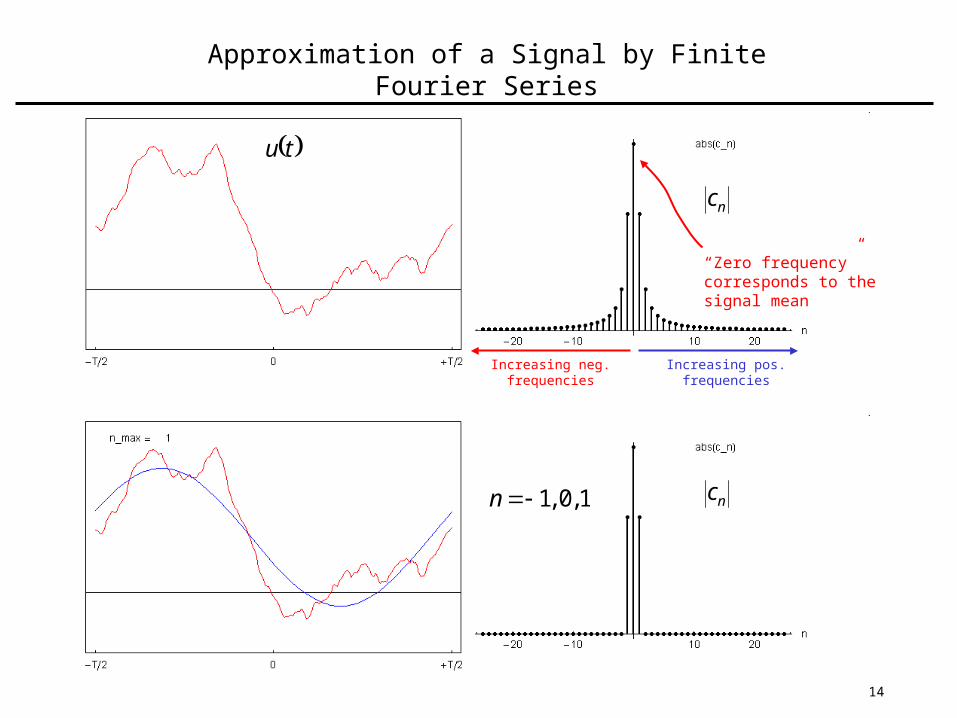
nc
tu
1,0,1n nc
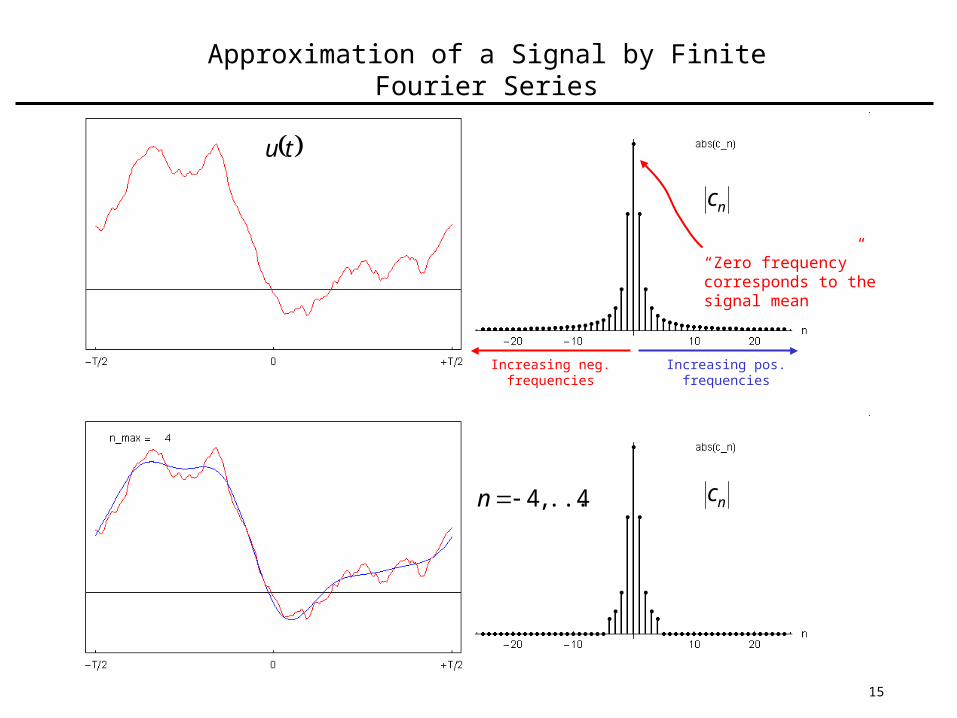
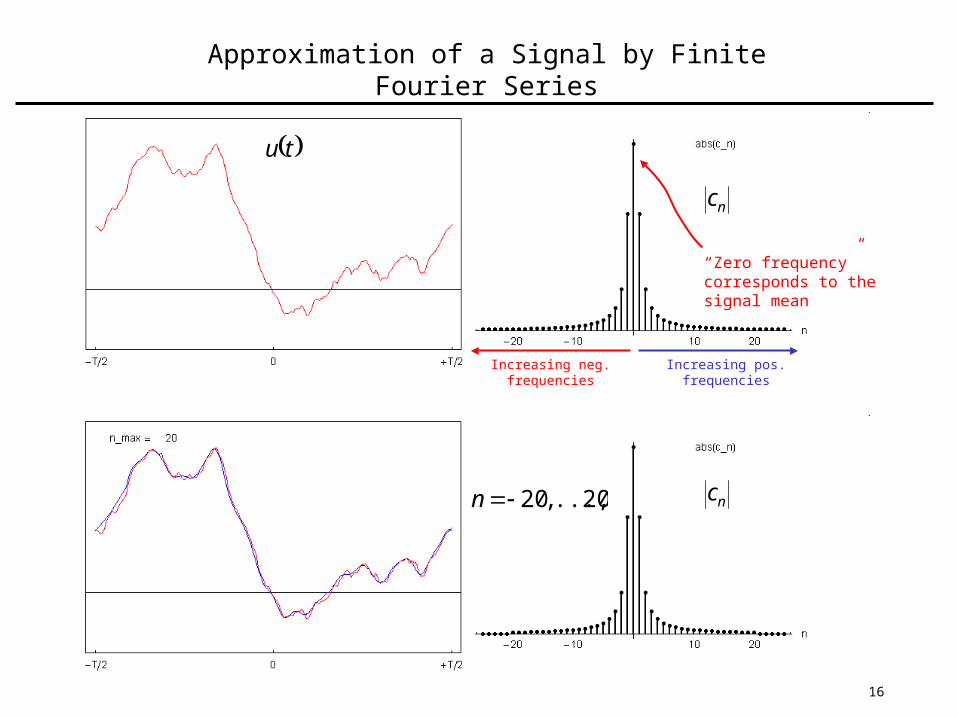
Approximation of a Signal by Finite Fourier Series
14
“Zero frequency” corresponds to the signal mean
Increasing pos. frequenciesIncreasing neg. frequencies
nc
tu
Approximation of a Signal by Finite Fourier Series
15
“Zero frequency” corresponds to the signal mean
Increasing pos. frequenciesIncreasing neg. frequencies
nc4...,,4n
nc
tu
Approximation of a Signal by Finite Fourier Series
16
“Zero frequency” corresponds to the signal mean
Increasing pos. frequenciesIncreasing neg. frequencies
20...,,20n nc
17“Principles & Applications of SAR”Instructor: Franz Meyer
© 2009, University of AlaskaALL RIGHTS RESERVED
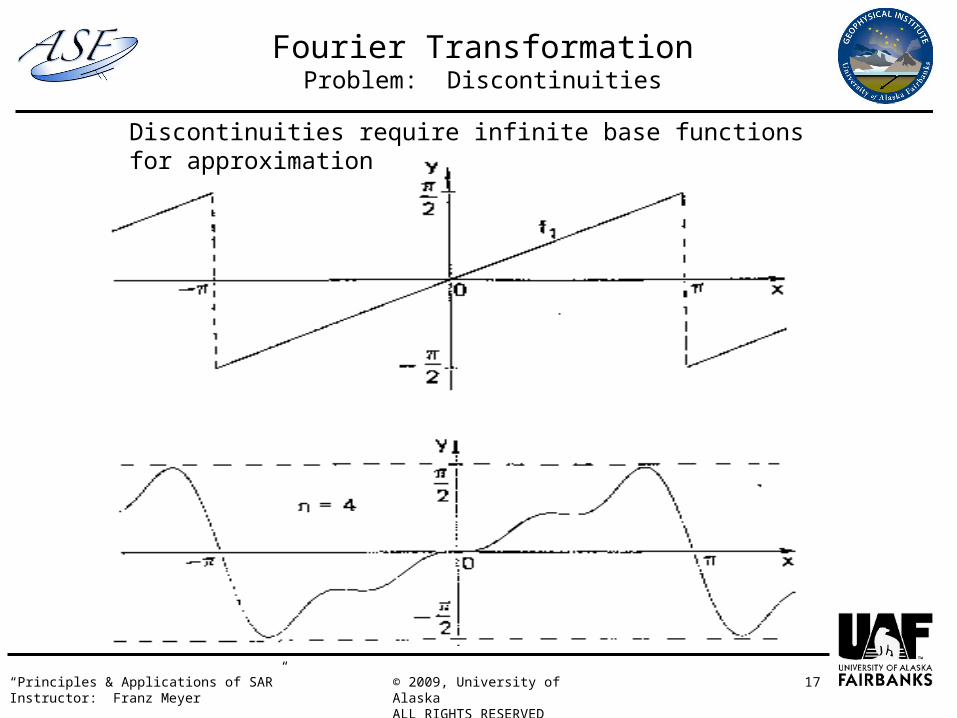
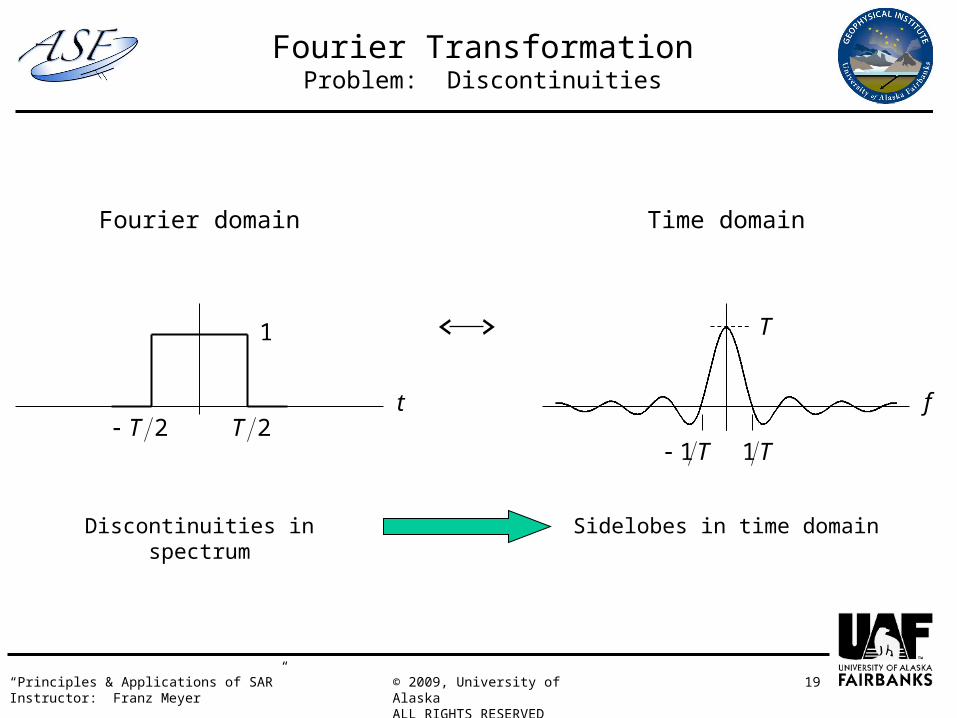
Fourier TransformationProblem: Discontinuities
Discontinuities require infinite base functions for approximation
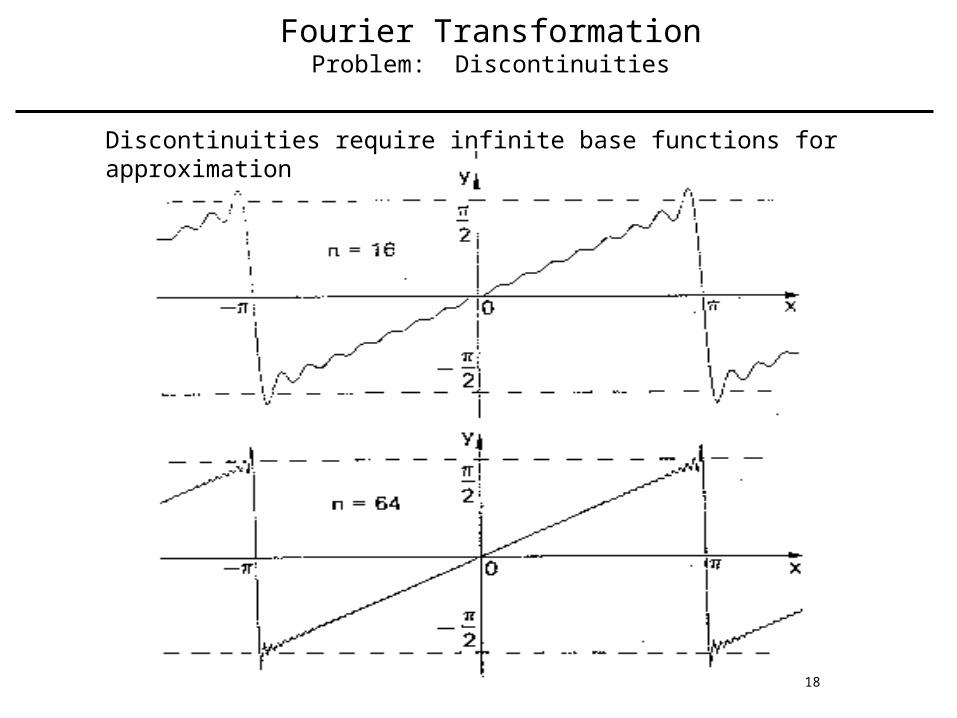
Fourier TransformationProblem: Discontinuities
Discontinuities require infinite base functions for approximation
18
19“Principles & Applications of SAR”Instructor: Franz Meyer
© 2009, University of AlaskaALL RIGHTS RESERVED
Fourier TransformationProblem: Discontinuities
t f
T
2T 2T
1
T1 T1
Fourier domain Time domain
Discontinuities in spectrum Sidelobes in time domain
20“Principles & Applications of SAR”Instructor: Franz Meyer
© 2009, University of AlaskaALL RIGHTS RESERVED
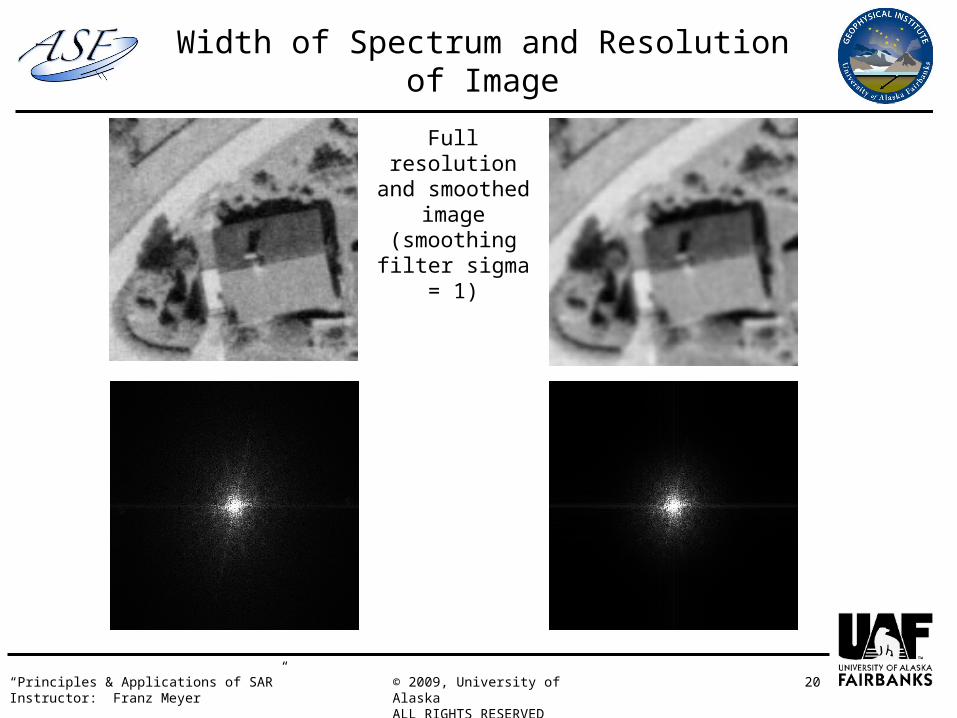
Width of Spectrum and Resolution of Image
Full resolution and smoothed
image (smoothing filter sigma = 1)

21“Principles & Applications of SAR”Instructor: Franz Meyer
© 2009, University of AlaskaALL RIGHTS RESERVED
Width of Spectrum and Resolution of Image
Full resolution and smoothed
image (smoothing filter sigma = 5)

22“Principles & Applications of SAR”Instructor: Franz Meyer
© 2009, University of AlaskaALL RIGHTS RESERVED
Auto and Cross-Correlation
Functions
-4
-2
0
2
4-4
-2
0
2
4
-0.5
0
0.5
-4
-2
0
2
4
2x
1x
21, xxu
23“Principles & Applications of SAR”Instructor: Franz Meyer
© 2009, University of AlaskaALL RIGHTS RESERVED
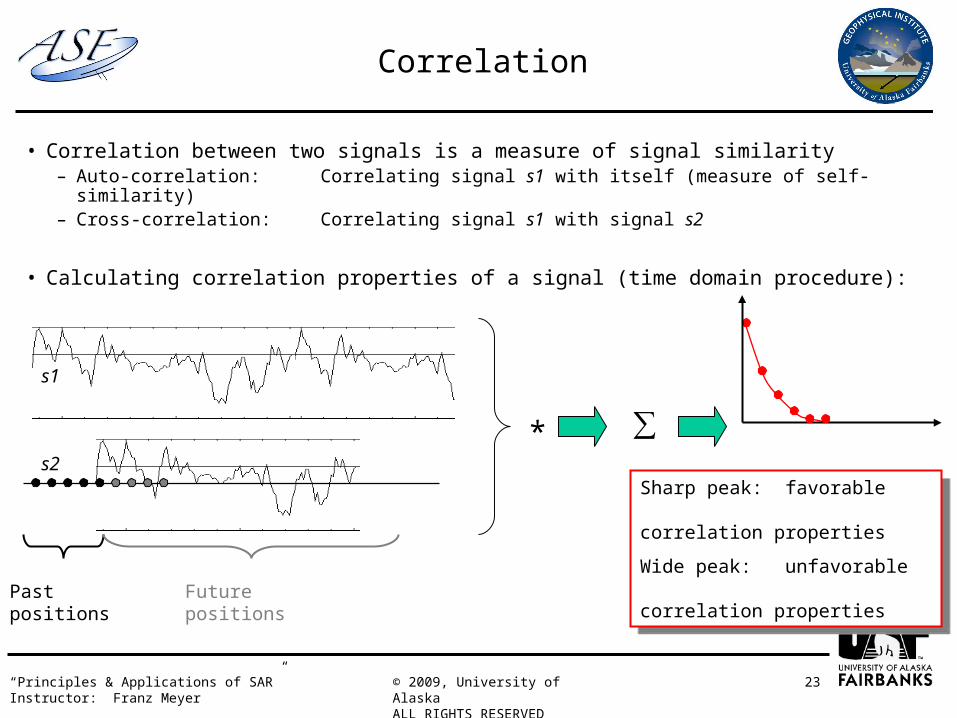
Correlation
• Correlation between two signals is a measure of signal similarity– Auto-correlation: Correlating signal s1 with itself (measure of self-similarity)– Cross-correlation: Correlating signal s1 with signal s2
• Calculating correlation properties of a signal (time domain procedure):
* ∑
Past positions Future positions
Sharp peak: favorable correlation properties
Wide peak: unfavorable correlation properties
Sharp peak: favorable correlation properties
Wide peak: unfavorable correlation properties
s1
s2
t
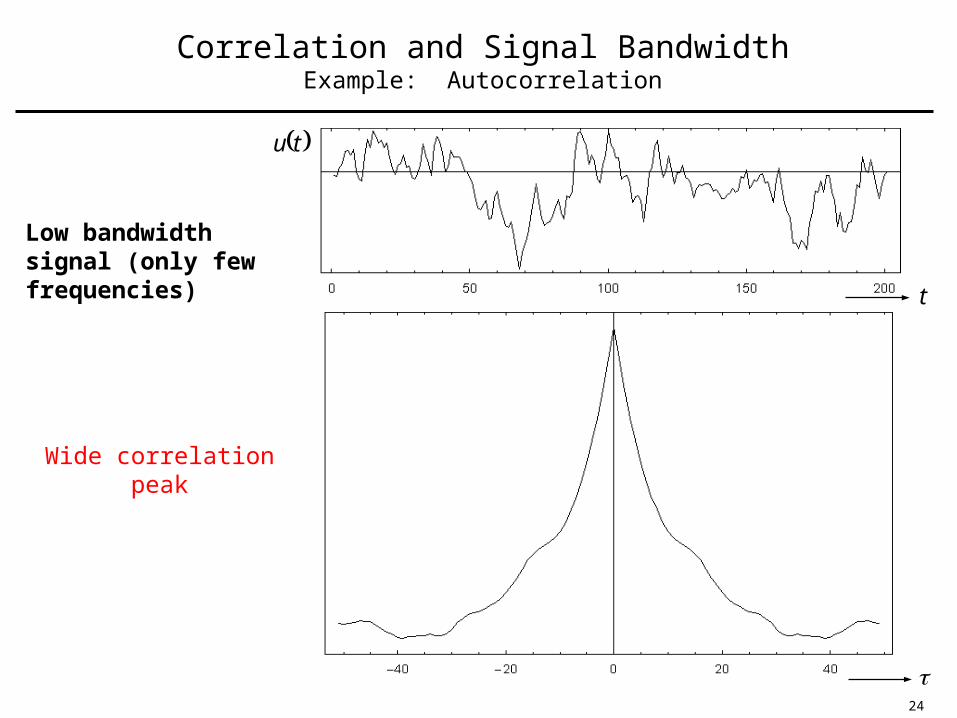
Low bandwidth signal (only few frequencies)
tu
Correlation and Signal BandwidthExample: Autocorrelation
24
Wide correlation peak
t
tu
Correlation and Signal BandwidthExample: Autocorrelation
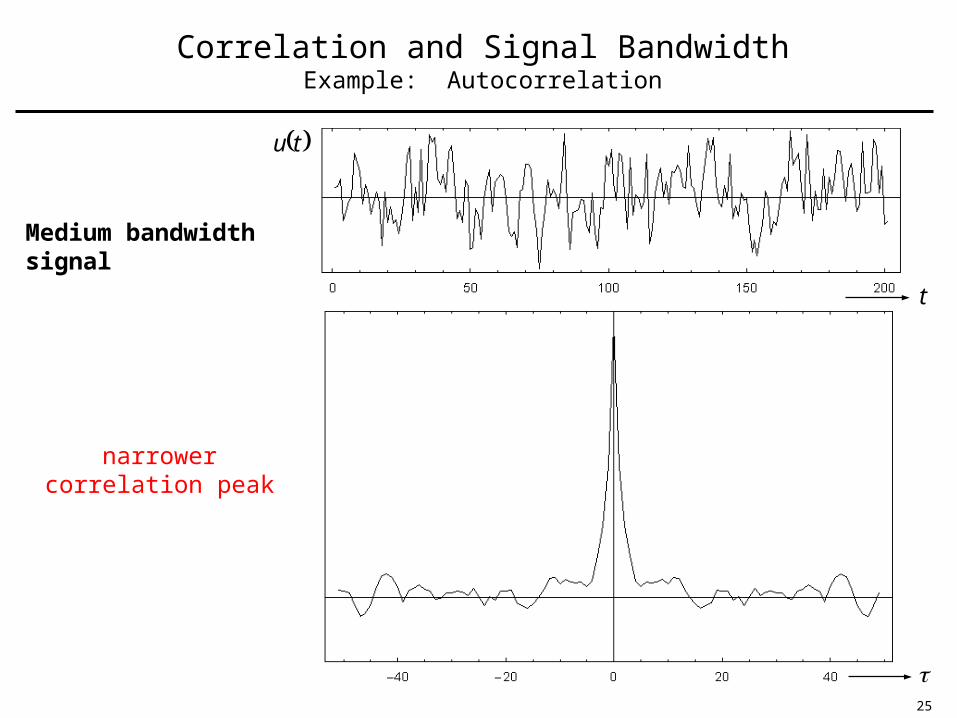
Medium bandwidth signal
narrower correlation peak
25
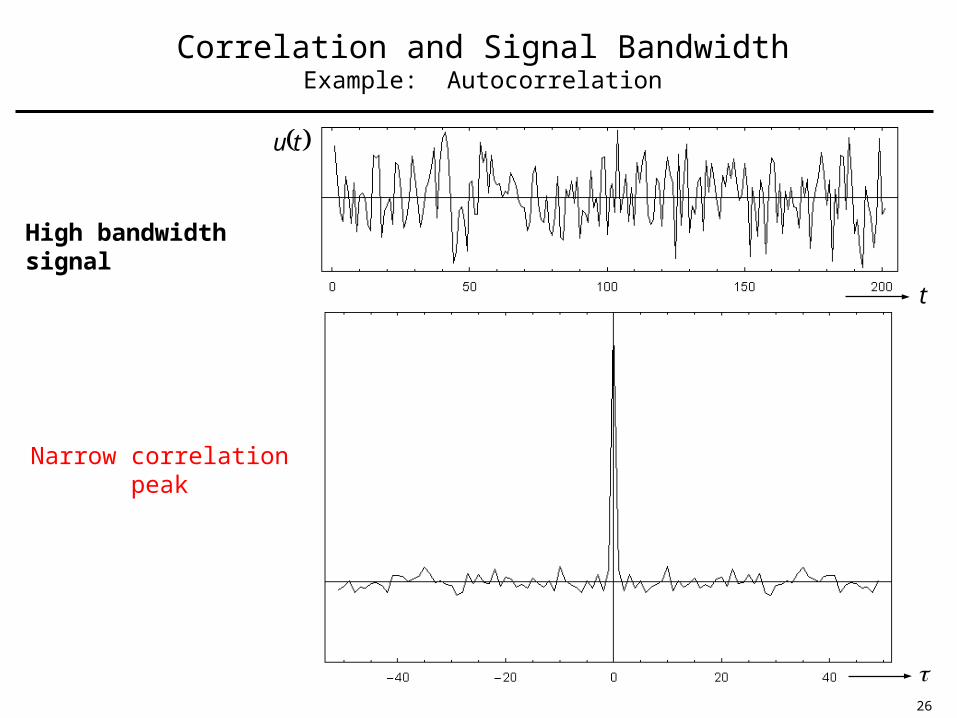
t
tu
Correlation and Signal BandwidthExample: Autocorrelation
High bandwidth signal
Narrow correlation peak
26
27“Principles & Applications of SAR”Instructor: Franz Meyer
© 2009, University of AlaskaALL RIGHTS RESERVED
Correlation and SAR
• We learned that high bandwidth signals have a narrow peak in the auto-correlation function
• In SAR, we will correlate the observed signal with a synthetic filter for image focusing
• As high-bandwidth signals result in a narrower correlation peak → high bandwidth SARs produce higher resolution (narrower peak → closer objects can be discriminated → higher resolution)


![Untitled-34 [] John Bowles, publisher of this print; the portraits on the top row are those ... Marc Chagall: His Graphic Art by Franz Meyer and Hans Bolliger; Abrams, ...](https://static.fdocuments.in/doc/165x107/5af8f6697f8b9abd588c3bff/untitled-34-john-bowles-publisher-of-this-print-the-portraits-on-the-top-row.jpg)