1.Introduction 2.Monitoring-related features of XRootD 3.Issues with CMS federation monitoring Talk...
47
Understand ing 1.Introduction 2.Monitoring-related features of XRootD 3.Issues with CMS federation monitoring Talk outline: Matevž Tadel [email protected] Monitori ng
-
Upload
roy-kennedy -
Category
Documents
-
view
217 -
download
0
Transcript of 1.Introduction 2.Monitoring-related features of XRootD 3.Issues with CMS federation monitoring Talk...

Understanding
1. Introduction2. Monitoring-related features of XRootD3. Issues with CMS federation monitoring
Talk outline:
Matevž Tadel [email protected]
Monitoring

M. Tadel: Understanding XRootD Monitoring 2
WHAT’S THERE TO MONITOR
XRootD@UCSD, 1/28/15

M. Tadel: Understanding XRootD Monitoring 3
XRootD perspective
• Are your servers configured and used right?– We care, because it affects xrootd operation and you’ll
blame us if things are not good enough.• XRootD daemon performance– Memory, CPU, storage & network usage– How are xrootd daemons using their resources
– e.g.: threads, data buffers, number of connections
• Cluster performance:– File lookup & Redirection to “right” servers
• Accounting – who is using the system and howXRootD@UCSD, 1/28/15
M. Tadel: Understanding XRootD Monitoring 4
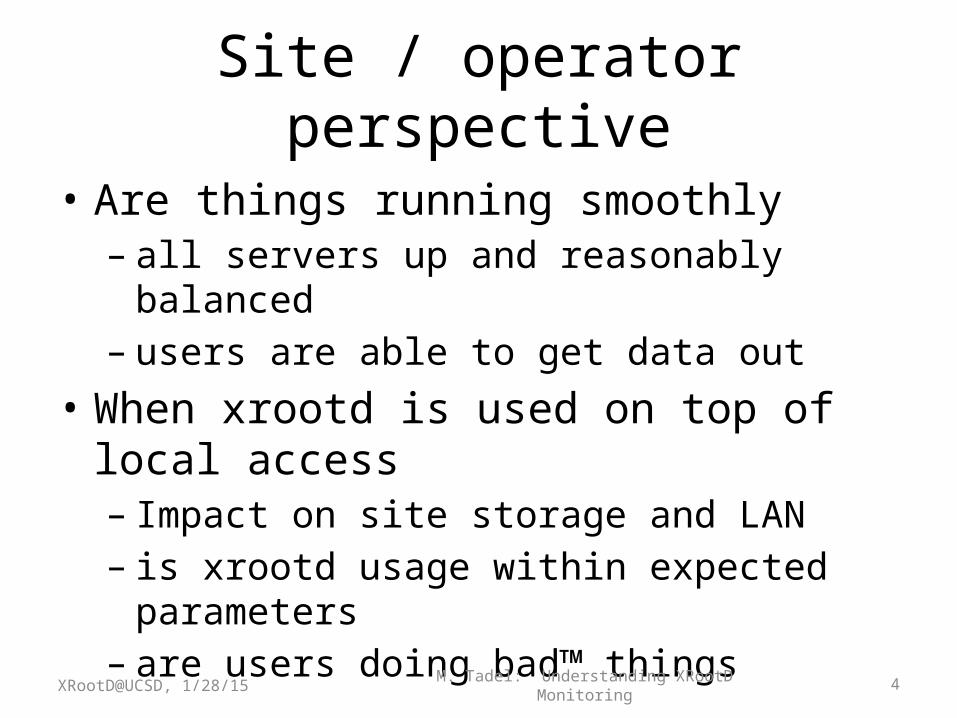
Site / operator perspective
• Are things running smoothly– all servers up and reasonably balanced– users are able to get data out
• When xrootd is used on top of local access– Impact on site storage and LAN– is xrootd usage within expected parameters– are users doing bad™ things
XRootD@UCSD, 1/28/15

M. Tadel: Understanding XRootD Monitoring 5
VO / Data-federation perspective• Is the site working for us?– Can find its data / be redirected to it– Users can open and read files
➙ authentication & storage access configuration• Is site & federation performance acceptable:– Lookup, redirection and file open rate– Read / request rate – global and per connection
• Impacts CPU efficiency for remote reading
➙ Storage and WAN throughput & latency ➙ How suitable the application is for remote access
• Accounting that can be correlated with centrally controlled activities.
XRootD@UCSD, 1/28/15

M. Tadel: Understanding XRootD Monitoring 6
What XRootD can not do for youXRootD monitoring can only provide a part of the total picture. It does not do:
1. overall system monitoring2. network / connectivity monitoring3. check if authentication / file access works4. performance / scaling measurements
If needed, one needs to do it independently:– 1, 2 on site level– 3, 4 (and maybe 2) on VO level
Large VOs (like LHC ones) and Grid providers (like OSG) all have frameworks for handling this.XRootD@UCSD, 1/28/15

M. Tadel: Understanding XRootD Monitoring 7
BUILTIN XROOTD MONITORING FEATURES
Documentation: http://xrootd.org/docs.html• Configuration: “Xrd/XRootd Configuration Reference”• What is reported:“System monitoring reference”
XRootD@UCSD, 1/28/15

M. Tadel: Understanding XRootD Monitoring 8
Built-in Monitoring from 30kft
• Report what XRootD processes are doing– on the level of a whole process
Summary monitoring– on the level of individual user session / open file
Detailed monitoringIncludes also redirection & staging events
• Both are sent as UDP packages to up to two destinations– Implemented so as to have minimal impact on servers.– Detailed monitoring is somewhat stateful (packet loss can be a
problem).– Ideally, collectors should run “close” to servers (sigh, etc).
XRootD@UCSD, 1/28/15

M. Tadel: Understanding XRootD Monitoring 9
Common configuration
• Specifying site nameall.sitename sname
– If configured, this shows up in• every summary message• in server identification (‘=‘) detailed stream
– periodic, typically every 2 to 5 min
– E.g., at UCSD for CMS:all.sitename T2_US_UCSD
XRootD@UCSD, 1/28/15
M. Tadel: Understanding XRootD Monitoring 10
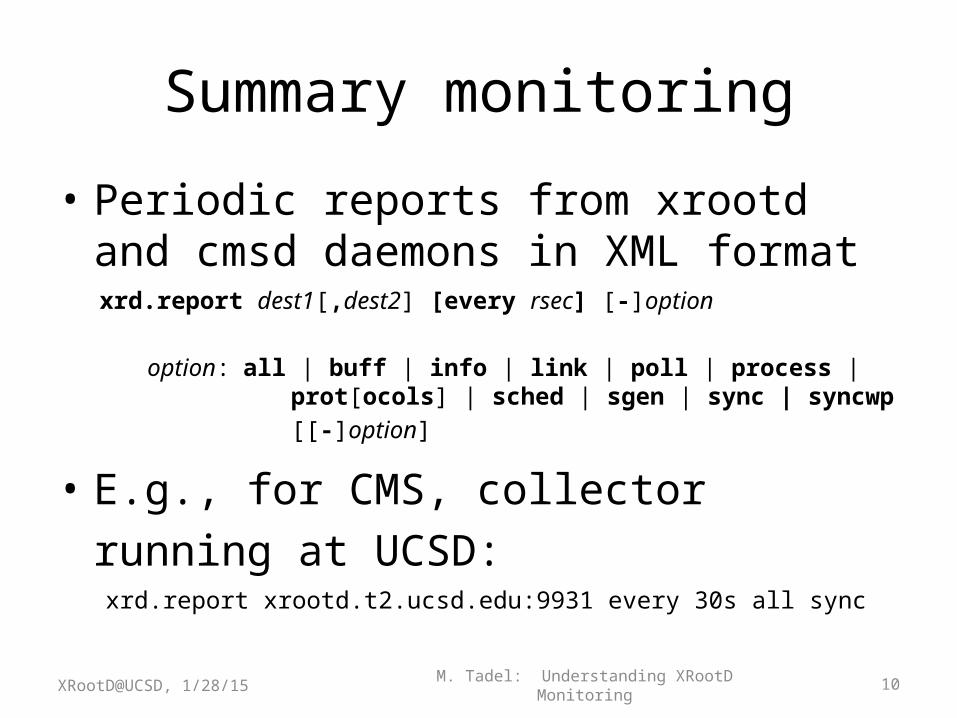
Summary monitoring
• Periodic reports from xrootd and cmsd daemons in XML formatxrd.report dest1[,dest2] [every rsec] [-]option
option: all | buff | info | link | poll | process | prot[ocols] | sched | sgen | sync | syncwp
[[-]option]
• E.g., for CMS, collector running at UCSD:xrd.report xrootd.t2.ucsd.edu:9931 every 30s all
sync
XRootD@UCSD, 1/28/15

M. Tadel: Understanding XRootD Monitoring 11
How it looks …<statistics tod="1421698118" ver="v3.3.5" src="cabinet-8-8-6.t2.ucsd.edu:1094" tos="1418409578" pgm="xrootd" ins="anon" pid="3541" site="T2_US_UCSD"><stats id="info"><host>cabinet-8-8-6.t2.ucsd.edu</host><port>1094</port><name>anon</name></stats><stats id="buff"><reqs>110624</reqs><mem>176465920</mem><buffs>358</buffs><adj>0</adj></stats><stats id="link"><num>1</num><maxn>122</maxn><tot>5301</tot><in>526680393</in><out>1749220925590</out><ctime>36508960</ctime><tmo>249066</tmo><stall>3</stall><sfps>0</sfps></stats><stats id="poll"><att>1</att><en>249066</en><ev>249072</ev><int>0</int></stats><stats id="proc"><usr><s>11863</s><u>39543</u></usr><sys><s>5465</s><u>697087</u></sys></stats><stats id="xrootd"><num>4680</num><ops><open>55092</open><rf>0</rf><rd>21972049</rd><pr>0</pr><rv>137063</rv><rs>9095834</rs><wr>0</wr><sync>0</sync><getf>0</getf><putf>0</putf><misc>61578</misc></ops><aio><num>0</num><max>44</max><rej>41</rej></aio><err>17690</err><rdr>0</rdr><dly>0</dly><lgn><num>4679</num><af>3</af><au>4673</au><ua>0</ua></lgn></stats><stats id="ofs"><role>server</role><opr>1</opr><opw>0</opw><opp>0</opp><ups>0</ups><han>1</han><rdr>0</rdr><bxq>0</bxq><rep>0</rep><err>0</err><dly>0</dly><sok>0</sok><ser>0</ser><tpc><grnt>0</grnt><deny>0</deny><err>0</err><exp>0</exp></tpc></stats><stats id="sched"><jobs>831528</jobs><inq>0</inq><maxinq>6</maxinq><threads>48</threads><idle>45</idle><tcr>115</tcr><tde>67</tde><tlimr>0</tlimr></stats><stats id="sgen"><as>0</as><et>0</et><toe>1421698118</toe></stats></statistics>
XRootD@UCSD, 1/28/15
M. Tadel: Understanding XRootD Monitoring 12
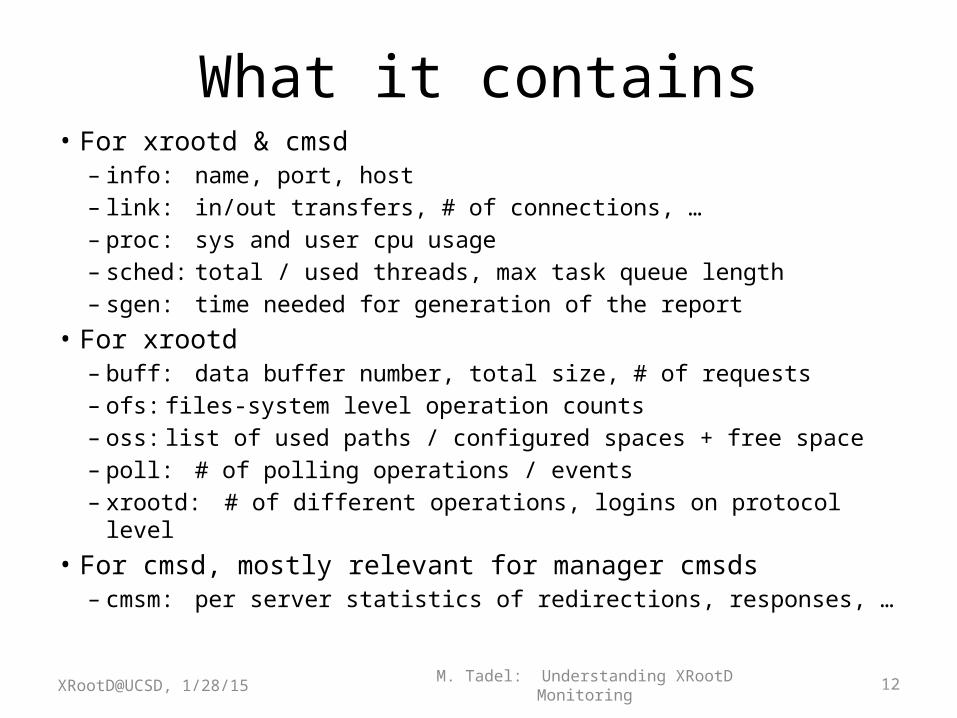
What it contains• For xrootd & cmsd
– info: name, port, host– link: in/out transfers, # of connections, …– proc: sys and user cpu usage– sched: total / used threads, max task queue length– sgen: time needed for generation of the report
• For xrootd– buff: data buffer number, total size, # of requests– ofs: files-system level operation counts– oss: list of used paths / configured spaces + free space– poll: # of polling operations / events– xrootd: # of different operations, logins on protocol level
• For cmsd, mostly relevant for manager cmsds– cmsm: per server statistics of redirections, responses, …
XRootD@UCSD, 1/28/15

M. Tadel: Understanding XRootD Monitoring 13
How does one collect this
• mpxstats included in distribution– aggregates messages into a single stream
• xrd-rep-snatcher developed for AAA– https://github.com/osschar/xrd-rep-snatcher– What it does:• Normalize input• Domain -> site name (a bit obsolete with all.sitename)• Calculate rates on relevant fields• Report selected fields to MonALISA using ApMon
– Can be extended for other time series tracking tools
XRootD@UCSD, 1/28/15

M. Tadel: Understanding XRootD Monitoring 14XRootD@UCSD, 1/28/15

M. Tadel: Understanding XRootD Monitoring 15XRootD@UCSD, 1/28/15
Requires post processing to mergeall servers from a given site

M. Tadel: Understanding XRootD Monitoring 16
Detailed monitoring
• Inspect in detail what servers are doing– xrootd process only– redirectors can also report every redirection
• “Standard operations”:– Session begin / end, authentication, user info– Open / close a file– Reporting of read / write events:
• report totals on file close• periodic “progress” updates (f-stream)• individual requests (t-stream with io option)• unpacked vector read requests (t-stream with iov option)
XRootD@UCSD, 1/28/15

M. Tadel: Understanding XRootD Monitoring 17
Purpose of detailed monitoring
• Detailed accounting– When, who, from where, how long and how much– Every access is reported.
• Analyze data-access patterns– Improve application access to data– Tune parameters for a prefetching proxy-cache
• Misuse and abuse detectionWhat could be added:– Reporting of failed authentication attempts– Getting exit status and CPU efficiency from client
XRootD@UCSD, 1/28/15

M. Tadel: Understanding XRootD Monitoring 18
Caveats about purpose
• Collecting and archiving this information gets hard in a large, non-uniform federation.– But then again, running large, non-uniform
federations is really hard in itself.• Somebody has to analyze this information and
stay on top of it.– Every access is registered, including active
monitoring probes, scaling tests, etc• Can easily skew the results / conclusions
XRootD@UCSD, 1/28/15

M. Tadel: Understanding XRootD Monitoring 19
Detailed monitoring – StreamsDifferent types of UDP packets – each coming in their own “stream” (from xrootd point of view).All have binary header followed by either string or more binary data.• = server identification – track server restarts• u user session + optional authentication info• r redirection events• d file open events• i application info; arbitrary string from client• Read/write progress – also include file close and session end
records.– f periodic report on amount of data read/written– t reports individual read/write requests
Streams use 8-bit sequential ids to determine out of order / lost packets.XRootD@UCSD, 1/28/15

M. Tadel: Understanding XRootD Monitoring 20
Configuring detailed monitoringxrootd.monitor [ options ] dest [ dest ] options:[all] [auth] [flush [io] intvl[m|s|h]]
[fstat intvl[m|s|h] [lfn] [ops] [ssq] [xfr cnt]]
[ident sec] [mbuff size[k] [rbuff size[k]]
[rnums cnt] [window intvl[m|s|h]]
dest: dest events host:port
events: [files] [fstat] [io[v]] [info] [redir] [user]
E.g., at UCSD for CMS:xrootd.monitor all auth flush io 60s ident 5m mbuff 8k
rbuff 4k rnums 3 window 10s dest files io info user redir xrootd.t2.ucsd.edu:9930 dest files iov info user xrootd.t2.ucsd.edu:9932
XRootD@UCSD, 1/28/15

M. Tadel: Understanding XRootD Monitoring 21
Configuration details, e.g. at UCSD
ident 5m server identification interval
all monitor all sessions / transfers
auth include authentication details
flush io 60s send out interval, including IO (t-stream)
mbuff 8k monitoring buffer size
window 10s timestamp precision
rbuff 4k rnums 3 redirection buffer size & number
dest files io info user redir xrootd.t2.ucsd.edu:9930
dest files iov info user xrootd.t2.ucsd.edu:9932
XRootD@UCSD, 1/28/15

M. Tadel: Understanding XRootD Monitoring 22
=-stream details
• Report static information about the processsrvinfo: &pgm=prog&ver=vname&inst=iname&port=pnum&site=sname
– Server is fully identified by hostname, port and start time.• UDP source port is also unique for the lifetime of server.• Start time is in header of every packet.
• Heart-beat – detect servers that go down
XRootD@UCSD, 1/28/15

M. Tadel: Understanding XRootD Monitoring 23
u-stream & authentication detailsu userid[\n[authinfo]]
userid: user.pid:sid@host
authinfo:&p=prot&n=[name]&h=[hname]&o=[org]&r=[role]&g=[grp]&m=[info]
• Maps the user to an dictid (32-bit unsigned int)– dictid in map record header
– used in binary streams ‘t’, ‘f’
• Single record per UDP packet, sent out as soon as it happens.• userid: provided by client: local username, process id and socket file
descriptor– This uniquely identifies a user session, used in ‘d’ stream
• authinfo: filled if requested, depends on protocol– &m= a special field for monitoring info
• User identity sent in plain-text– This got us into EU data privacy law hell
XRootD@UCSD, 1/28/15

M. Tadel: Understanding XRootD Monitoring 24
d-stream details
d userid\npath
• Maps file name to a dictid passed in header.– used in binary streams ‘t’, ‘f’
• Single record per UDP packet, sent out as soon as it happens.
• User must be found through user id (string).
Note: When using f-stream, one can get the information by specifying lfn option in fstat configuration fragment.XRootD@UCSD, 1/28/15

M. Tadel: Understanding XRootD Monitoring 25
t-stream details• Highly encoded binary stream:– Packet is sent out when mbuff is full or flush timeout is
reached … but only when the next message comes!• With io/iov each session has its own buffer!
– A vector of messages describing session / file events:• time window transition• file close / session end messages. Close includes xfer totals. • with io option: write / read / vector read messages
– read/write requests have offset, length– vector reads have: time, total length, number of sub-requests (offsets
are not known).
• With iov option: as above but– vector reads are unpacked so length and offset for every sub-request
are knownXRootD@UCSD, 1/28/15

M. Tadel: Understanding XRootD Monitoring 26
f-stream details
• Highly encoded binary stream:– Packet is sent out at configured interval
• Begin/End times in header
– After that the following records follow:• file open events, optionally including file name• transfer progress for files that were accessed in the interval; total
bytes read/written• close events with detailed statistics of accesses• disconnect events
• Uses much less resources– A good option when access details are not needed
• Is also supported by dCache-2.6 and later!XRootD@UCSD, 1/28/15

M. Tadel: Understanding XRootD Monitoring 27
f & t stream vs. UDP packet loss
• ‘u’ packet – session will not be tracked
• ‘d’ packet – the file will not be tracked
• ‘t’ packet without a file close/disconnect event– The lost part of accesses is not accounted for.
– Totals are still reported in close record.
• ‘t’ or ‘f’ packet containing a file close or a disconnect event:– Collector keeps the file / session as open and eventually times
out on inactivity.
– A possible way out: server periodically reports all session / filed dictids that are still active.
XRootD@UCSD, 1/28/15

M. Tadel: Understanding XRootD Monitoring 28
Hanging connections on XRootD servers
• xrootd does not always get notified that a client got zapped. Contributing factors:– Brutal killing of processes– Virtual machines, natted hosts, firewalls
• Monitoring can not know what happened, either.• Solution: tell xrootd to be more vigilant:
xrd.network keepalive kaparms 10m,1m,5xrd.timeout idle 60m
• With this, we have practically no hanging connections at UCSD and MIT.
XRootD@UCSD, 1/28/15

M. Tadel: Understanding XRootD Monitoring 29
COLLECTION AND ANALYSIS OF DETAILED MONITORING DATA
XRootD@UCSD, 1/28/15

M. Tadel: Understanding XRootD Monitoring 30
Collecting detailed monitoring data
• Not entirely straightforward – Maintain mapping of user and file dictids to
corresponding objects for each server• Tracking progress:– For io/iov: Accumulate information in memory
until a file is closed– For f-stream: Just update counters on update
• Real action can only be taken when file is closed.
XRootD@UCSD, 1/28/15

31
Collector overview• The official collector XrdMon:– http://www.gled.org/cgi-bin/twiki/view/Main/XrdMon
• Binary distribution:– RPM: ftp://ftp.gled.org/xrdmon/– Yum repo: http://linuxsoft.cern.ch/wlcg/init.d scripts packaged for usage at CERN
• A bit of a monster but not a hog!• Includes UDP to TCP translation service
ALICE uses their own Java implementation.
XRootD@UCSD, 1/28/15 M. Tadel: Understanding XRootD Monitoring

M. Tadel: Understanding XRootD Monitoring 32
XrdMon implementation
• Implemented as a library within Gled, http://gled.org
– C++ framework for The Brave & Bold– Uses ROOT for network interface, serialization, and
configuration (scripts)• Components:– Packet queues, sources and consumers– XrdMonSucker – processing of detailed streams– Domain, Server, User, File representations– Classes for generating output– Simple ROOT classes for exporting data in binary format.
XRootD@UCSD, 1/28/15

M. Tadel: Understanding XRootD Monitoring 33
Collector Output – Realtime
• View currently opened files:– via GUI on the collector itself• useful for development & debugging
– via a web page, e.g. for CMS, docs for url args• Other options were discussed:– Send periodic reports to higher level aggregators– Abuse detection: reports are only sent out when a
file is closed – collector could do it in real time.
XRootD@UCSD, 1/28/15

M. Tadel: Understanding XRootD Monitoring 34
Collector Output – Access reports• File Access Reports are produced at file close– Historically, t-stream with io/iov was used
• statistics of access produced at file close– number, min/avg/sigma/max size of requests, vread stats
• now f-stream produces the same information, collected at the server
• Output options:– ROOT TTrees, optionally including full IO and IOV
records– Plain text to an UDP destination OSG Gratia➙– JSON record via ActiveMQ Dashboard➙
XRootD@UCSD, 1/28/15

M. Tadel: Understanding XRootD Monitoring 35
Analyzing File Access Reports• When using TTrees it’s a lot like any physics
analysis – Bunch of root files you have to chain together.– An awful lot of background and noise.• In a large federation the sample is polluted by:
– Monitoring, probes, test jobs, scaling tests– Access types one is not interested in, e.g. local, xrdcp, ...
• Using event lists or skims makes a lot of sense
– Fun with aggregation into cumulative plots– The ultimate fun with ROOT 2D graphics
XRootD@UCSD, 1/28/15

M. Tadel: Understanding XRootD Monitoring 36
AnXrdMon• Micro framework for analysis of XrdMon TTrees– Steering code / manager– Filters– Extractors
• Produce 1D/2D histograms and cumulative plots• Several extractors with different filters get run in one pass
– Run over 1 year of AAA data can take close to an hour
• IOV analyzers, including caching proxy simulation– “Given this IOV trace, how would caching proxy perform?”
– Plotting scripts (combine histograms for comparison)
XRootD@UCSD, 1/28/15

M. Tadel: Understanding XRootD Monitoring 37XRootD@UCSD, 1/28/15
E.g. I.Total US CMS remote read rates

M. Tadel: Understanding XRootD Monitoring 38XRootD@UCSD, 1/28/15
E.g. II.
• Notice xrdcp / lazy-preload peaks
• Again, AOD access consistent, +/- an order of magnitude
Job read rate vs. request size
AOD
non-AOD, non-usernon-AOD, user

M. Tadel: Transcending the AAA access patterns 39
Offsets & extents within vector readsAverages (in bytes):• requests: 10 kB• offsets: 1 – 10 MB• total extent: up to 1 GB
Sum of each:• requests: sum up to at
most the file size• offsets and total extent
practically the same:They add up to from a
couple to 20-times!This covers the “missing” positive offsets.
Federated Storage, 4/10/14
E.g. III., the power of IOVUS CMS, remote AOD access

M. Tadel: Understanding XRootD Monitoring 40
AnXrdMon Availability
• Code is at:https://github.com/osschar/AnXrdMon
• I expect it will get extended and improved with OSG non-HEP VOs trying to use XRootD.
• Let me know if you’re interested in using this.
XRootD@UCSD, 1/28/15

M. Tadel: Understanding XRootD Monitoring 41
XROOTD MONITORING ISSUES IN CMS
After the sun comes the rain.
XRootD@UCSD, 1/28/15

M. Tadel: Understanding XRootD Monitoring 42
Issues – the enumeration• Several sites are not sending detailed monitoring at
all, e.g., FNAL using dCache-2.4• Discrepancy between summary monitoring and what
is seen by CERN Dashboard– Of course we are all pointing fingers across the Atlantic.
• Hanging connections – collector closes them after 24 hours:– Wrong open duration data rate calculations get screwed.➙
• EU privacy laws• Problem with mixed VO sites – to whom to report?
XRootD@UCSD, 1/28/15

M. Tadel: Understanding XRootD Monitoring 43
Issues – the consequences• We have a limited and erratic view of the federation.
Yay, etc …• The mngmnt wants a reliable reporting for production
and centrally controlled jobs.
Solution:• Collect statistics in CMS’s XrdAdapter and attach it into
cmssw job report.• Detailed monitoring as we have it:– Remains as an opt-in service for sites.– Is used by experts for data access debugging, optimizations
and development of new services.XRootD@UCSD, 1/28/15

M. Tadel: Understanding XRootD Monitoring 44
XRootD Client as the Source!
Provide detailed monitoring from XRootD Client:– Report progress in streams, as detailed monitoring does now.– Accumulate access history:
• Send a complete report at the end.• Application can also do what it wants, send it on to whomever,
include it in its log / job report.
– Can report full redirection paths, reconnects, multi-stream input etc.
– No problem with mixed VO sites!– Easier to avoid violation of privacy laws.
– The problem with zapped jobs remains (is even worse).XRootD@UCSD, 1/28/15

M. Tadel: Understanding XRootD Monitoring 45
Location of monitoring collectors
• Original monitoring design called for collectors to be “close” to monitored servers.– Nobody really expected them to be half way across the world
…• It also turned out that letting “random people” control
your redirectors isn’t such a great idea.
Provide a VM image that contains redirector and collector.
– Controlled by federation operators, not site admins.– Monitoring data can be collected on site and/or distributed to
a central location in a controlled and secure way.
XRootD@UCSD, 1/28/15

M. Tadel: Understanding XRootD Monitoring 46
CONCLUSION
XRootD@UCSD, 1/28/15

M. Tadel: Understanding XRootD Monitoring 47
Over and Out
• XRootD provides powerful and complete set of monitoring features, services, and tools.
• There is no complete framework:– The idea is one integrates this functionality with other site /
VO monitoring probes and tools.– XRootD can not provide all required information anyway.
• It is really hard to monitor huge non-homogenous federations with limited control over resources.– Client side monitoring seems to be the way to go – keep sites
out of the loop.• It will be interesting to see how things go with OSG …• We’re here to help: [email protected]
XRootD@UCSD, 1/28/15