
1H2017 Cover Page.ppt - Thomson...
15
GLOBAL CAPITAL MARKETS REVIEW REUTERS / Andrew Winning GLOBAL CAPITAL MARKETS REVIEW LEGAL ADVISORS First Half 2017
Transcript of 1H2017 Cover Page.ppt - Thomson...

GLOBAL CAPITAL MARKETS REVIEWREUTERS / Andrew Winning
GLOBAL CAPITAL MARKETS REVIEWLEGAL ADVISORS
First Half 2017
2
1
Global Straight Debt Excluding ABS & MBS (G03) - Issuer
1
Global Straight Debt Including ABS & MBS (G02) - Issuer
Global Straight Debt Including ABS & MBS (G02) - Manager
2
2
1
Global Debt, Equity & Equity-related Excluding FCA (G01) - Manager
Quarterly Global Legal Advisor Debt, Equity and Equity-related Chart
First Half 2017 | Global Capital Markets | Legal Advisors
GLOBAL CAPITAL MARKETS REVIEW
Table of Contents
Global Capital Markets
Global Deals Intelligence
Global Debt, Equity & Equity-related Excluding FCA (G01) - Issuer
1
10
10
Australia International Bonds (BW1) - Issuer
Australia International Bonds (BW2) - Manager
EMEA Capital Markets
7
7
All International Bonds (AV1) - Issuer
All International Bonds (AV2) - Manager
Canada Capital Markets
6
6
6
6
Canada All Debt (CAL1) - Issuer
Japan Capital Markets
Japan Common Stock (JL1) - Issuer
Japan Common Stock (JL2) - Manager
Samurai Bonds (JL5) - Issuer
Samurai Bonds (JL6) - Manager
11
11
11
11
Canada All Debt (CAL1) - Manager
Canada Equity & Equity-related (CAL4) - Issuer
Canada Equity & Equity-related (CAL4) - Manager
US Equity & Equity Related (AB2) - Manager
4
4
US Debt, Equity & Equity Related (AB1) - Manager 4
Global Straight Debt Excluding ABS & MBS (G03) - Manager
US Capital Markets
2
US Equity & Equity Related (AB2) - Issuer
12
Thomson Reuters Solutions For the Deal Making Community
13
Global Equity & Equity-related (G08) - Issuer
3
4
7
Global Equity & Equity-related (G08) - Manager
US Debt, Equity & Equity Related (AB1) - Issuer
3
US Straight Debt Including ABS & MBS (AB6) - Manager
US Straight Debt Including ABS & MBS (AB6) - Issuer
US Straight Debt Excluding ABS & MBS (AB7) - Issuer
US Straight Debt Excluding ABS & MBS (AB7) - Manager
5
5
5
5
Australia Equity & Equity-related (BY2) - Manager
9
10
10
Asia Pac G3 Bonds ex Australasia, Central Asia (BV4) - Manager
Australia Equity & Equity-related (BY1) - Issuer
Thomson Reuters Contact
8
8
7
te at o a o ds ( ) a age
EMEA Equity & Equity-related (AX1) - Issuer
9
Asia Pacific G3 Bonds (BV1) - Issuer
Asia Pacific (Ex Japan) Capital Markets
8
8
Asia Equity & Equity-related (BX1) - Issuer
Asia Equity & Equity-related (BX2) - Manager
Asia Pacific G3 Bonds (BV2) - Manager
Asia Pac G3 Bonds ex Australasia, Central Asia (BV3) - Issuer
EMEA Equity & Equity-related (AX2) - Manager
https://www.thomsonone.com
Sa u a o ds (J 6) a age
Criteria Summary
Ranking Criteria Summary 12
-230.343
10
0.345
0.4
57
16 15
10*12
5315
50
Skadden 0.5Grandall Law Firm
King & Wood Mallesons 0.557
11*
Freshfields Bruckhaus Deringer
11*
Sidley Austin LLP
9
17Baker & McKenzie 19Kirkland & Ellis
18*Morgan Lewis & Bockius
▼-110.5
13
1045,356.3+12
0.4
▼61
23
0.6 -14
0.4
0.454
+37
67
▲
105,040.3123,770.2
121,829.4
3.2-284
10.9
97,582.3
0.7
▼
0.874,306.7
▼
4111 1.97
Change in
+39Latham & Watkins-10
+1.0 ▲
Rank# of DealsShare
Anderson Mori & Tomotsune
Cleary Gottlieb Steen & Hamilton101
6976
2
6
16*
Jan 1 - Jun 30
Market# of Deals per Advisor Proceeds per Advisor (US$m)
2.51Proceeds
Global Debt, Equity & Equity-related Ex FCA (G01)
▼
13
1
2017 Rank Deals
# of
1.1
8
46 82
First Half 2017 | Global Capital Markets | Legal Advisors
GLOBAL CAPITAL MARKETS REVIEW†
Global Debt & Equity Proceeds Down 6% | Equity Proceeds Up 33% | Straight Debt Proceeds Down 9%
Share Ch.Market
-0.3
Market
141Sh (%)
2016 Rank
5
2 7*
Sullivan & Cromwell
Linklaters 3
Issuer Legal AdvisorAllen & Overy
+243
▲0.60.7
14▼
+3▲
42 0 3
▲0.3▼
▲+12▼
1511,546.8
60 -
0.8
19 0.5
▼+0.1
00 1-0.1▼
25,031.2▲
0.4
-0.1+0.1
▼
-20.814▼
-0.2
-0.10.2-0.2
30,247.7
1.418
31,129.3
53,296.30.6
▼
54,263.5 ▼1.49,112.7 40 ▼
9
0 --5 ▼
-0.122 015,389.0 0.4
+0.2▲ 88,167.4 630
2.3
+1.1
+0.11.12.388,790.9
-185
1.2
+0.72.7
7
▲
-0.8 ▼
0.3
▲3.1
▲+0.111,731.0
-1
▲12
0.5 ▲
Davis Polk & Wardwell
White & Case LLP 9Mayer Brown LLP
Clifford Chance
-9Simpson Thacher & Bartlett
0.5▲
8
42,462.37*4* 64
-
+15
▼
▲14
5110*4*
▼-31 ▼
32+2
20
16*
▲
-0.1+0.4
18*
3 973 918,633.8
▲
25*
43
Conyers Dill & Pearman 20
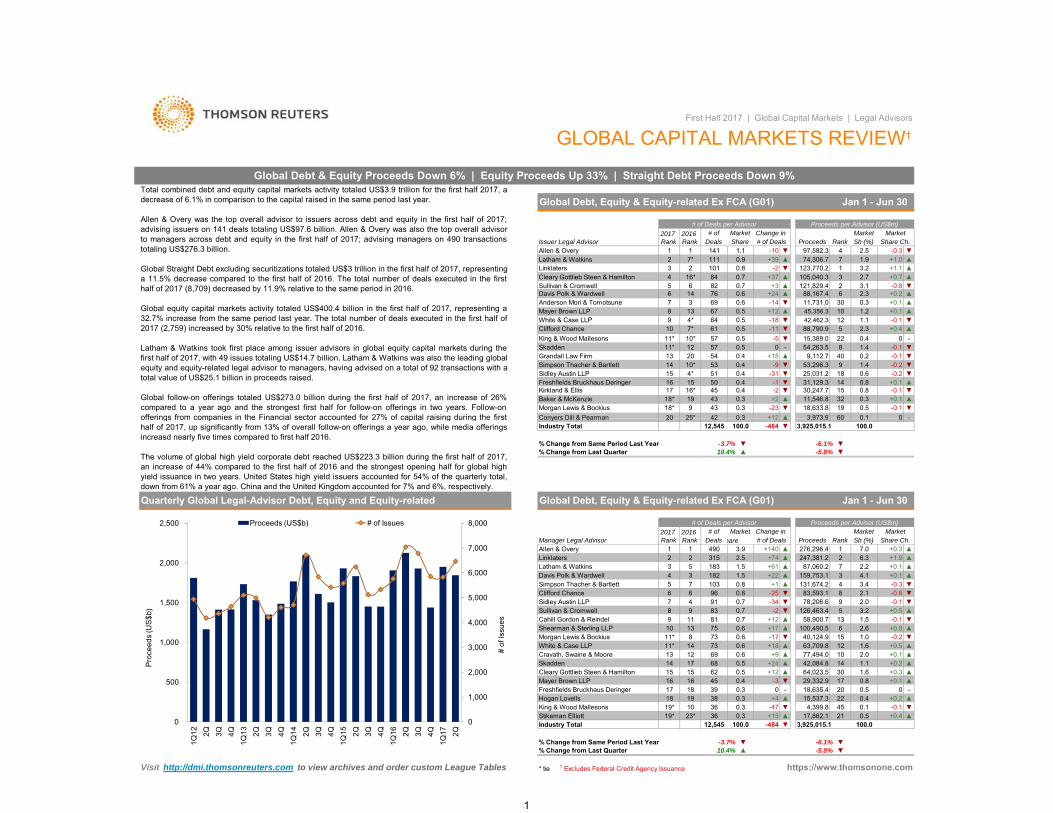
Total combined debt and equity capital markets activity totaled US$3.9 trillion for the first half 2017, adecrease of 6.1% in comparison to the capital raised in the same period last year.
Allen & Overy was the top overall advisor to issuers across debt and equity in the first half of 2017;advising issuers on 141 deals totaling US$97.6 billion. Allen & Overy was also the top overall advisorto managers across debt and equity in the first half of 2017; advising managers on 490 transactionstotaling US$276.3 billion.
Global Straight Debt excluding securitizations totaled US$3 trillion in the first half of 2017, representinga 11.5% decrease compared to the first half of 2016. The total number of deals executed in the firsthalf of 2017 (8,709) decreased by 11.9% relative to the same period in 2016.
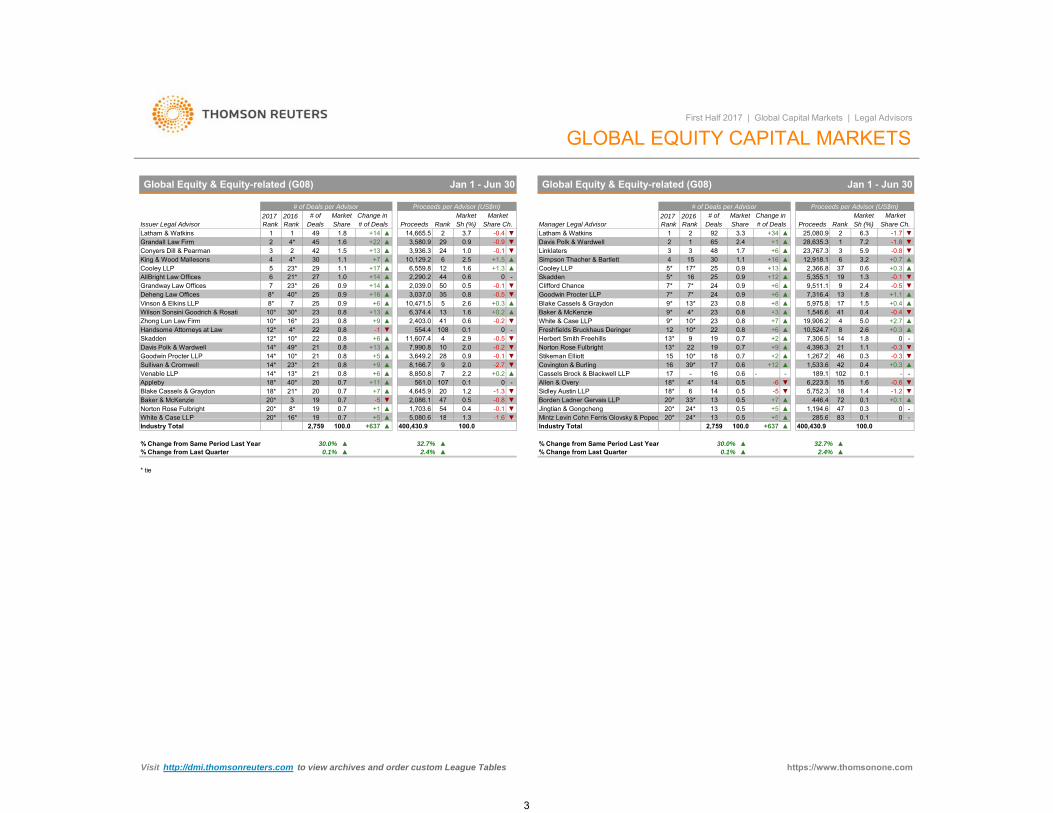
Global equity capital markets activity totaled US$400.4 billion in the first half of 2017, representing a32.7% increase from the same period last year. The total number of deals executed in the first half of2017 (2,759) increased by 30% relative to the first half of 2016.
Latham & Watkins took first place among issuer advisors in global equity capital markets during thefirst half of 2017, with 49 issues totaling US$14.7 billion. Latham & Watkins was also the leading globalequity and equity-related legal advisor to managers, having advised on a total of 92 transactions with atotal value of US$25.1 billion in proceeds raised.
Global follow-on offerings totaled US$273.0 billion during the first half of 2017, an increase of 26%compared to a year ago and the strongest first half for follow-on offerings in two years. Follow-onofferings from companies in the Financial sector accounted for 27% of capital raising during the first
hare
21 ▲▼
0.5Stikeman Elliott 19* 23* 36 0.3 ▲
Quarterly Global Legal-Advisor Debt, Equity and Equity-related
King & Wood Mallesons 19* 45 0.117,862.1
-0.1+0.4
10 36 0.3 -47 4,399.8
Mayer Brown LLP
1918
Cleary Gottlieb Steen & Hamilton
10.4%% Change from Last Quarter-3.7%
† Excludes Federal Credit Agency Issuance
-5.8%▼
▼
12,545Industry Total
-6.1%
Visit http://dmi.thomsonreuters.com to view archives and order custom League Tables
% Change from Same Period Last Year
-484
▲
https://www.thomsonone.com
75
▼+15
+12
-
3,925,015.1▼
15,537.3
Simpson Thacher & Bartlett
1412
131011*Morgan Lewis & Bockius
Sidley Austin LLP
Skadden
11*
Latham & Watkins
6
100.0
45
0.30.3
73
Davis Polk & Wardwell 3
0.5
4
1
3 52
Allen & Overy
Industry Total
10.4%
15
69
-3
0.6 +180.6 +9
0.5+24
12
+4
16
3839
0.4
681715
18
62▲
29,332.9 17 +0.10.81.6
14 1.1
0.40.5 0
22▲
▼ 1.0 -0.2
+0.277,494.0
20
0.6
▲ 64,023.5
18,635.40
30
1042,084.8
▼
2.014
▲
6
991
81.6
73 0.6 -17▲
40,124.9
0.781+17 ▲
▲
63,709.8
Sullivan & Cromwell
+0.81.51358,900.7
100,490.5 6 2.611
▼
+12
Clifford Chance -25
5126,463.47
96 ▼▼
8
0.8
▼2.03.2
131,674.2
-34-2
84
+74
+1+221.5
2.5+61
▲ 159,753.1▲
▲183
# of Market
42 0.3
Deals
▼
+140
5 7
247,381.21 3.9
315490
103182
1.5
-3.7% ▼
100.0
-6.1%
▲+12-484
60 03,925,015.1
0.1100.0
Change in
12,545
▼
3,973.9
# of Deals per Advisor
▲
25
2017 Rank
2016 Rank
% Change from Same Period Last Year
Global Debt, Equity & Equity-related Ex FCA (G01)
Proceeds per Advisor (US$m)
RankProceeds
0.783
40.7
0.8
Freshfields Bruckhaus Deringer
13White & Case LLPCravath, Swaine & Moore
17
Conyers Dill & Pearman
Cahill Gordon & Reindel 9Shearman & Sterling LLP
20
Linklaters
Manager Legal Advisor
% Change from Last Quarter
2
16
▼
Hogan Lovells
15
100.0
▲+0.3 ▲
* tie
+0.1
-0.1 ▼▲
▲▼
+0.5
3 +0.1▲
▲
# of Deals
▲▲1
6.387,060.2
Share Ch.▲
▲
Sh (%)276,296.4 7.0 +0.3
+1.9
4.1+0.1
-5.8% ▼
Market
Jan 1 - Jun 30
Market
72
2.2
-0.3
▲
3.4
9-0.883,593.1 2.1
78,206.6 -0.1▲▼
▲
▼
+0.5
▲
-+0.2
offerings from companies in the Financial sector accounted for 27% of capital raising during the firsthalf of 2017, up significantly from 13% of overall follow-on offerings a year ago, while media offeringsincreasd nearly five times compared to first half 2016.
The volume of global high yield corporate debt reached US$223.3 billion during the first half of 2017,an increase of 44% compared to the first half of 2016 and the strongest opening half for global highyield issuance in two years. United States high yield issuers accounted for 54% of the quarterly total,down from 61% a year ago. China and the United Kingdom accounted for 7% and 6%, respectively.
0
1,000
2,000
3,000
4,000
5,000
6,000
7,000
8,000
0
500
1,000
1,500
2,000
2,500
1Q12 2Q 3Q 4Q
1Q13 2Q 3Q 4Q
1Q14 2Q 3Q 4Q
1Q15 2Q 3Q 4Q
1Q16 2Q 3Q 4Q
1Q17 2Q
# of
Issu
es
Pro
ceed
s (U
S$b
)
Proceeds (US$b) # of Issues
1

3,491,119.6
Share Ch.Proceeds
First Half 2017 | Global Capital Markets | Legal Advisors
100.0
-0.6
117Latham & Watkins
2
# of
4.9
Market
5
0.8
2.3
11
+0.1
Cleary Gottlieb Steen & Hamilton
10
Morgan Lewis & Bockius 10 7
6*
+21▲▲3 1.2
4
+147 +0.5267
▲ 268,959.8+702.8 6.4
476▲
▲
91 0.9
0.8 +15-2977
73
+27
-
73
▲8
8
▼
70
Clifford Chance▼
71▼-3172
58
10 1.8
-15
▼
0.8
42,656.2
29,249.8
7.72
61,979.2130,426.3
2.1
3
# of Deals Sh (%)2017 Rank Deals
Jan 1 - Jun 30
Change in Share
2016 Rank
Jan 1 - Jun 30 Global Straight Debt Including ABS & MBS (G02)
Rank
# of Deals per AdvisorMarket
Manager Legal Advisor Share
Global Straight Debt Including ABS & MBS (G02)
Proceeds per Advisor (US$m) # of Deals per AdvisorMarket
GLOBAL DEBT CAPITAL MARKETS†
124Allen & Overy 1 1 ▼
Change in # ofIssuer Legal Advisor Deals
2017 Rank
79,961.9
1
64
4
▼0.6▼
59,641.245,223.6
750.7
7+0.3+1.0
+0.80.921.3
# of Deals
0.8 ▲
4 -0.2-13
▲1.7
2.81.3 ▲8
▲3
-0.1
99,715.8▼
0.3
0
+0.18,693.9
▲
113,562.7
6
16
31▲
-6▼▼
▼+0.20.816
Cravath, Swaine & Moore 22
9,645
17
0.3▲
17 29*18*
Shearman & Sterling LLP
18*0.30.329
8
100.023*
0.30.2
16,806.4
13
▼9,438.3
+8 ▲-3427
28
1.1 +0.8Mayer Brown LLP
▲
Skadden1.2-0.4
▼▼0.7
-0.120
Hogan Lovells-0.1 Milbank Tweed Hadley & McCloy
1.10.5
Industry Total
12
Baker & McKenzie 20
0.330Gibson Dunn & Crutcher
23
+18
-1,048
▲
▲
35
37,381.7
▼
▲▼
▲-16
+25
19,037.7-0.4
0.4
3.361
2.9
5 ▼▼
14
57
Davis Polk & Wardwell
+0.5
19
Industry Total
2
▼▼
White & Case LLP-0.2
Cravath, Swaine & Moore
7
2+0.798,691.6
Linklaters
Cahill Gordon & Reindel
+150.6
60.6
▲26,190.4
▲3
9113 +35
-1
6 6
2.689,264.0 Allen & OveryRank
1Share Ch.Proceeds
2016 Rank
Proceeds per Advisor (US$m)
Sh (%)▼
Market MarketMarket
1 1 ▲
04
+0.2
3.32.1 -0.8
-0.47
3.4
8
0+2.1
0.3
-17
223,458.83.7
24
-0
21,740.8
72,028.21.6
+0.3
0.417 0.41819
0.80.7
14
12* 42
▼▼
King & Wood Mallesons
1213
-9
+134
0.70.7
9
64
118,516.5
▲
0
100.0
74,082.0Anderson Mori & Tomotsune 3
-
▼▼
1254,953.4▲
0.6 +1185,789.7 5
1.11245 0.552 2.5
-23-13
Linklaters
Latham & Watkins 5 14 62Mayer Brown LLP 4
2Cleary Gottlieb Steen & Hamilton
9
Davis Polk & Wardwell 8 10 55
Sullivan & Cromwell
-0.140
Clifford Chance 9 7
Kirkland & Ellis 11
0.5
15*10White & Case LLP 5
0.4
▼
▲ 0.8▼
Freshfields Bruckhaus Deringer 12 15* 39 0.4 +3
0.40.4 -35
-8Sidley Austin LLP 13Simpson Thacher & Bartlett 14* 11 35
4 37
14*
Morgan Lewis & Bockius
17
11
109Skadden
27
40,843.4
39,634.9
23,130.336,859.7
4
11
18 0.6
Shearman & Sterling LLP
1.2
+0.8145
Sidley Austin LLP
Sullivan & Cromwell
5
Simpson Thacher & Bartlett 6* 6
3
+0.4
+0.169,823.5 9
1.2
2.0
115,294.1
92,027.2-0.239,933.0
12*+13+18
0.6
▼▲
0.65315▲
▲+0.4+9+9
+0.21.860,981.1
029,244.4
11▲▲ 13
15 +0.217 43 0.5
18
14 16 48 0.5
26
169 34
234,151.4▼
- 12,733.4-45
100.0
▲
▲
▲-
▲
--0.10.1
▲
▲▼
▲
33
3,491,119.6
42,841.4
1.12.66
+0.2 ▲+4 ▲
9,645 -1,048+6 +0.2 ▲
0.6 ▲
36,729.7
0.40.3
15
▼
16
19
1.10.8
▼
McCarthy Tetrault 20 22* 19 +3 9,683.1▲0.2▼
24 0.3 0 -
2.0
▲
Industry Total-0.2 ▼
-10 ▼
0.7 0.3
▼
0.3 ▼100.0
0.3
Sidley Austin LLP 19* 819* 15*
2222
-
▼
▼
-1,17422 0.4
% Change from Last Quarter-11.9%
8,709
▲
https://www.thomsonone.com
3,039,494.7 100.0
▼
-203,039,494.7
▼▼
▼-1,174
0.3▲
11,957.3
-11.5%
100.0
▼0.1
% Change from Same Period Last Year
44
-61921 +4
-0.1
16Hogan Lovells17*
1917*229,683.1McCarthy Tetrault
15
25*
19,555.039,492.9 10
10,236.023
13 14Gibson Dunn & Crutcher
30+1829*
26 ▲+0.220,608.1 1627*
0.3
+7
29-4
0.315 1714
16*
0.3
King & Wood Mallesons 3,843.1
26 0.3 ▲
17
18+13
0.1▼1.3 0 - 23Milbank Tweed Hadley & McCloy
340.7
-0.2
▲
▲ Latham & Watkins▼
% Change from Same Period Last Year
Linklaters
▼0.3
0.60.3 +3
▲
Skadden
8Sullivan & Cromwell
0.3
+0.2
1.2
▲
39,843.21.4
15-5
9,438.3
▲
Simpson Thacher & Bartlett-
Cravath, Swaine & Moore 10
1
3.7 -0.64
▲ Davis Polk & Wardwell+1.3
Cahill Gordon & Reindel 9
+214 ▲
1.15 69 0.8
18
120.545
7
0.2
16
11 64
▲
+0.1+0.2
-0.4
▼
0
▲2.82.6
43
9
4513
Shearman & Sterling LLP51
11*
6*8,693.9 0.329
31
Sidley Austin LLP+14
1.3
0.88
▲
▼
13
39
0.6
▲
1.9
49,369.0
+6 62,247.2
+12▲ 14King & Wood Mallesons
+0.9 15
-0 White & Case LLP▼ 10
-70.9
32
Mayer Brown LLP
11
16*
40,956.2129
26+3
Skadden 1411*11 9 -0.4
▼11Cleary Gottlieb Steen & Hamilton
20
Freshfields Bruckhaus Deringer 12*Simpson Thacher & Bartlett
10 0.50.4
Kirkland & EllisCravath, Swaine & Moore
Shearman & Sterling LLP
▼
0.6 ▼
34
36,859.7
0.4
-15 85,028.8
+4
0.3 ▼
+10
▲
+0.6
+0.232,880.426,190.4
▼
79,761.9
23,130.3
4
390.541
500.6
61
540.757
-8.6%
Market
-9.8%
# of Deals per AdvisorChange in
% Change from Same Period Last Year
2016 Rank
# of
▼
86,198.0
-6.2%
Market
▲
Issuer Legal Advisor
▼
Share Proceeds
Jan 1 - Jun 30
Proceeds per Advisor (US$m)
2.8
Cleary Gottlieb Steen & Hamilton
0.7
% Change from Last Quarter 14.4%
+230.712*Latham & Watkins
Allen & Overy
Global Straight Debt Excluding ABS & MBS (G03)
Linklaters
Deals1
2017 Rank
1.3
▲
11721
1.0
-22
# of Deals-12
16-6
▲
▼
92,698.8
▲▼
8
71
12
65
13
6
73
71
+153
1
8
73,750.5
3*
90
0.7
% Change from Last Quarter▼
-0.4+1.0
115,006.3 3.8 ▼
Manager Legal Advisor
6*+0.6
Clifford Chance0.8
▲
0
+0.1
10▲
+0.413
2.1▲
+0.4
1.0
3.0▲
-12▲ 1.4
92,027.2
31,731.0
▲0.5
12
+4
14
56,665.3
4,151.40.5
▼0.5
0.4
-9 4-32
115,294.1
0.7 +18-12 5
6
0.8▼
91
# of Deals per Advisor
1.3
0.8
5.2
▲
+135
0
+2.6
54,953.4▲ 117▼ 2.4
2017 Rank Share Ch.Deals
▲# of Deals
Global Straight Debt Excluding ABS & MBS (G03)
# of Market
1177
3.3 +1.0
▲
-0.1113,562.7 1▼3Anderson Mori & Tomotsune
+2
5Sullivan & Cromwell65
62 59,641.2▲+27
23
▲
Share Ch.453
3.1
Allen & Overy▲ 298,658.1 265
Jan 1 - Jun 30
3* 10
▼
+0.8
4Rank
-0.22
62
Sh (%)MarketShare
2016 Rank
Clifford ChanceDavis Polk & Wardwell
6
7
White & Case LLP 9
7
▲▼
8
-45
5
41,013.9
▼▲
-0.1
▲0
17
Baker & McKenzie +9
▲21,398.628 ▲
Visit http://dmi.thomsonreuters.com to view archives and order custom League Tables
14.3%% Change from Last Quarter -9.0%* tie† Excludes Federal Credit Agency Issuance
-11.9% -9.0%-11.5% 14.3%
100.08,709
% Change from Same Period Last Year
Industry Total
1.6
21
▼
8.3
1.8
3.8
130,426.3
▲
▼
Proceeds per Advisor (US$m)
Rank
▲
▲
+0.2
+0.1
▲▼ -8.6%
3▲
Proceeds
-
7.3+0.7
-
2.0
14.4% -6.2%
+0.2
▲
4.3+29
222,730.73.02
1.0
▲ 2
Market
▼
961,979.23
+74
Change in
▼-9.8%
1252,492.6
Market
0.2
0.2 -40.2 +12
▼▲
+0.1
-
+0.4
▲
Sh (%)
0.3 018 0.5 +0.4
Freshfields Bruckhaus DeringerStikeman Elliott
19 17 17 7,817.516,174.5
2320 41* 16 ▲
2
▼
22
18*
10*
Goodwin Procter LLP
Norton Rose Fulbright
Cassels Brock & Blackwell LLP
Stikeman Elliott
13* 9
0.1
0.4
Freshfields Bruckhaus DeringerWhite & Case LLP
129* 10*
22Herbert Smith Freehills
15
▲
▲17
+9
+1218
0.5
4*
-0.30.346
1.4-0.6
18
+2 1,267.2
0.1102 -6,223.5 1.6
1,533.6189.1
2.4
▼▲
-0.44
▲1.5
28,635.3 125,080.9
3
3.3 +34 ▲2
92 -1.7
GLOBAL EQUITY CAPITAL MARKETS
27.2 ▼
▼0.6
▲3.25.9
-1.8
-
-0.3
▼
+0.3 ▲
0
▼
+0.3+2.7
+6
▼
8 2.6+6
5,975.8 +0.4
14
▲
▲23 0.8
0.50.5
0.7
0.6
23
0.7
0.8Baker & McKenzie 9* 4*
Covington & Burling 16
446.4▼
▲
▲0.8
0.9
1913*0.7
211.8
17▲0.8
10*
5* 16
Blake Cassels & Graydon 9* 13*
247*7* 7* 24
▲ 9,511.1-0.10.9 5,355.1▲
+6+12
0.9
+0.7
19
1.8 +1.1
1.3+0.3
6
Norton Rose Fulbright
2.28,850.8 7107
Baker & McKenzie ▼ 4718* 21*20*
0.1
0.8
1.2▲+7▲+11
8,166.7▲ 9+0.2
0.9
+1 ▲ 1,703.6 542,086.1
20561.0
+5
-0.80.5
17▼
Borden Ladner Gervais LLP▼-0.1
-
▼-1.314Appleby
▲Sidley Austin LLP4,645.9
19 0.7 -520*
18*▲
+7
-
0.720
Blake Cassels & Graydon
+640*
20
0.73
Venable LLPSullivan & Cromwell
0.7
8* 19
2114* 13* 0.8
12* 10* 22Davis Polk & Wardwell 14*
0
+9▲
280.8 ▲23* 21
49* 21Goodwin Procter LLP 14* 10* 21
14*
41
2.0+13
0.10.6
0.80.8 ▲
▲
-1
3,649.2
2,403.0
▼-0.2 ▼
410
2.9 -0.5-▼ 554.4
11,607.4+6Handsome Attorneys at Law 12* 4* 22 0.8Skadden
108
Vinson & Elkins LLP13
0Zhong Lun Law Firm 10* 16* 23 0.8 +9 ▲Wilson Sonsini Goodrich & Rosati 10* 30* 23 0.8 +13
5 2.6 +0.3▲ 10,471.51.66,374.4 +0.2▲
35Deheng Law Offices 8* 40* 25 0.9 +16 0.8▼
8* 7 25 0.9 +63,037.0▲ -0.5
Grandway Law Offices 7 23* 26 0.9 +14 ▲
1.6 +1.344
2,039.0 502,290.2
0.5 -0.10.66 21* 27 1.0 +14
▲5 23* 29 1.1King & Wood Mallesons 4
-0.9▲ 24
3,580.93,936.3 1.0
29
6
AllBright Law Offices
▲+22
4* 30 1.1
4*
▲Cooley LLP +17
Conyers Dill & Pearman 3 2 42 1.5 +13▼0.92Grandall Law Firm 45 1.6
# of Deals per Advisor
Davis Polk & Wardwell
# of
Latham & Watkins1
2016 Rank
65
MarketSh (%) Share Ch.# of Deals
2.4
▼
▼Manager Legal Advisor
Latham & Watkins 1 +1449▲
1
▲3 +6
Global Equity & Equity-related (G08)
+1
DealsMarket# of
Proceeds2017 RankShare Deals ShareIssuer Legal Advisor
2017 Rank
2016 Rank
Proceeds per Advisor (US$m)Market
Share Ch.MarketChange in
Jan 1 - Jun 30
# of Deals per Advisor
First Half 2017 | Global Capital Markets | Legal Advisors
▲▲
-0.5139
72
▲ 7,316.4
▲
15 305*
12,918.1
7*
372,366.80.9 +1325
▲
-0.1
▼
▼
▲
-0.2
0 -
▲▼
-5
42
1320*
39*
Allen & Overy-18* 6
33*14
41
+2 7,306.5
+3
10,524.7
1,546.619,906.2
▲+7
1.1
0
4,396.3-
0.6
155,752.3 -1.2
0.4▲-
+0.1 ▲
5.0
▲
▼-0.8
6.3
MarketProceeds per Advisor (US$m)
Jan 1 - Jun 30
23,767.3
-0.4 21.8
Market Change in
Global Equity & Equity-related (G08)
▲Proceeds
10,129.26,559.8 12
2Rank Sh (%)# of Deals
+7
1
▲
0.4
14,665.5
7,990.8
1 3
Clifford Chance
+8
Linklaters
23
1.148
+1617* 25
3▼
Cooley LLPSkadden
▼
▼
▼
+1.5▲
-0.12.5
3.7
19
16-2.72.0
Jingtian & Gongcheng 20* 24* 13
Simpson Thacher & Bartlett 4
▲ 1,194.6
-6
1.7
Rank
▲ 5 080 6 1847
White & Case LLP 20* 16* 19 0 7 +5 ▼ Mintz Levin Cohn Ferris Glovsky & Popeo 20* 24* 13-0.30.5 +5
0 -0 5 +5 ▲ 285 6 83 0 1-1 6+637 ▲ 100.0Industry Total 2,759 100.0100.0
% Change from Last Quarter 0.1% ▲ 2.4% ▲
400,430.9
▲ 32.7% ▲ ▲
▲
% Change from Same Period Last Year% Change from Last Quarter 0.1% ▲
30.0% ▲% Change from Same Period Last Year
100.02,759 +637
30.0%
Industry Total
https://www.thomsonone.com
2.4%
400,430.9
▲32.7%
* tie
1.3
Visit http://dmi.thomsonreuters.com to view archives and order custom League Tables
▲ 5,080.6 18White & Case LLP 20 16 19 0.7 +5 ▼ Mintz Levin Cohn Ferris Glovsky & Popeo 20 24 13 00.5 +5 ▲ 285.6 83 0.11.6
3
▼+6 ▲ 7,645.919* 25 0.5
18Dechert
▲
1413
43
Industry Total
2.3
10+1265,771.2
8
2.2
3.48
-
▼
▲118,113.4
▼1 7.0 -2.5▼7.0 -2.7291
57,395.7
118,302.8
-343.1 +9
▲
64
+13
3.8
-0.5
12
3.6
8 10 60 2.93.1
2.6
-1.5
79
▲2 75
64 +2
5
7▼
Skadden54▼ 9*
66*
9
Mayer Brown LLP 141312
Allen & Overy54
11 4911
4.6
9*Cleary Gottlieb Steen & Hamilton
6.15.0
4Sidley Austin LLP
▼
5
▲
24
12,558.0
1.2 19,600.3
+9 ▲4,364.9
22.8
42,687.6
22,603.5
8
2.1112.0
+17▲
▼▲
-7
+2
7▼
▼
12
▼
▼Morgan Lewis & Bockius
40
▼
-0.5▼
26 8%
▲+216* 21
19*19,690.8
22
▲+444
Milbank Tweed Hadley & McCloy ▲
Vinson & Elkins LLP 21* 19
16*
46
-5
1,689,139.22,099
1.1 ▲
0.9
+31.0
▲▲
0.96,597.8
-0.10.4
Goodwin Procter LLP
19
White & Case LLPCooley LLP
152216* 24
16*
25*
+0.1
100.0
27+0.4+0.30.5
1.2
+10 ▲+1.4
7,814.640
18
0.1
38 1.831 28,648.7
2,165.7 0
2.1▲
1.1+20 ▲1.5
+14
1527,520.5+16
3.2▲617
▼+0.1
+10
3
988,455.3
+12
54,113.6-0.138,726.9
-1.0
+1.05.2
12
67,661.1 799,537.1 -0.95.9
4
+0.2
3.6▲
▼
▼
72,437.2
1.61.4▲
-2.7
-1.0
▲▲
▼
13 1.7
114.3
▲
▼4.03.9
▼
2.3
-0.2 ▼▲
▲
+20
▲
Shearman & Sterling LLP
+2060,759.2
22,763.0
▲
2.6▲
▼6*
-
+1.2
24
% Change from Same Period Last Year
Proceeds per Advisor (US$m)
US Debt, Equity & Equity Related (AB1)
138 6.6
# of DealsMarket
79,161.5
MarketSh (%)Sh (%) Share Ch.RankSh (%)
MarketDeals
-0.64.7 ▼Manager Legal Advisor
5Proceeds
▲+59166 7.93.5 ▲+1.8
Change in # ofShare Ch.
4Davis Polk & Wardwell 2 1
3
Simpson Thacher & Bartlett
Latham & Watkins 1-3.0
3
US CAPITAL MARKETS REVIEW†
Jan 1 - Jun 30
2017 Rank
2016 Rank
# of Deals per Advisor Proceeds per Advisor (US$m)Market
Rank59,878.7
2.9
# of Deals per Advisor# of
US Debt, Equity & Equity Related (AB1) Jan 1 - Jun 30
Market
52.356
Change in
13.1
+123.5 +26 ▲
-0.5▼
-0.4
78
245
8
486
1,689,139.2
14,760.2
-1.4
▼Cravath, Swaine & Moore
-0.7 Cahill Gordon & Reindel
-0.6
Sullivan & Cromwell▼
▲Linklaters
1.72.5
▲
-0.40.5
▲
+1.8
30
19
▼2.20.9 +0.2 ▲
▼
43▲12,318.4 23
0.3▲30* +11
1.2250
16
1.1
▲
% Change from Same Period Last Year
18*+1
+10
1.1
31
22
+2
+4
+14-
▼
1.2
-5
14Paul, Weiss
18*
Industry Total
-1.6
19,929.836 +0.3
1.26,089.8
-0.27,671.6
100.0
30 1.4
22 1.1
15
▲1.4
231.1
2,099
2.4
36,812.3
▲
▼
15 3%
43
▲
0.79
27,986.06
▲22
38▲
1.8 +261.5
-2940,083.2
1.9
MarketDeals
3
1.3
2.3-3
48,142.539,466.8
4*41
66Cleary Gottlieb Steen & Hamilton
2017 Rank
4*
2016 Rank
21
Issuer Legal AdvisorLatham & Watkins 74
59
Sh (%)
Mayer Brown LLP
Skadden
Sullivan & Cromwell64
Davis Polk & Wardwell
Simpson Thacher & Bartlett
9
5
▲ 103,685.2
2.7
3.185,036.0▲
▲
Kirkland & Ellis
1214 10 26
152913
1
11Gibson Dunn & Crutcher
White & Case LLP
Vinson & Elkins LLPCravath, Swaine & Moore
11
Morgan Lewis & Bockius12
13
0.7
28* 0.415
Goodwin Procter LLP
▲Cooley LLP
19* +5
Sidley Austin LLP
Wilson Sonsini Goodrich & Rosati
10
Shearman & Sterling LLP
9
6
26*
17 24*16
+0.6
First Half 2017 | Global Capital Markets | Legal Advisors
4
34.3
# of Deals Proceeds
7+32
+977,293.4
0
-1.7
▲
-0
100.0 +444
26 8%
100.0
-0.7
15 3% ▲
Venable LLP 20 16 21 1.0 +2 ▲ 8,850.8 26 0.5 +0.1 ▲
† Excludes U.S. Federal Credit Agency Issuance
Eversheds Sutherland LLP 19* 33* 7 1.4 +4 +3
# ofDeals
120,116.5
2,189.5
504 100.0
▲ 401.6 57 0.3 +0.1 ▲Dechert
▲
+169
2017 Rank
▲ 100.0120,116.5▲
17* 151.2
https://www.thomsonone.com
+3
▼
1.2 -24* 6
▼-0.4
▲
-▲
9
2.3 -0.91,616.7 18 1.4 +1.4
▲-- 171.9 43 0.1
1.8
Industry Total26.9%
530.9+1
▲
Simpson Thacher & Bartlett
Ellenoff Grossman Schole & Cyruli
2 55
# of Deals per Advisor
8*
12*
10*
Manager Legal AdvisorMarket
▲% Change from Last Quarter
# of Deals
▼
Jan 1 - Jun 30
Deals Proceeds Rank
▲-4.5
▲
▼
10*
7
▲
11
8
9 ▼
67 1.4 +5
1.8
3.6
1.2
-4.05
24*-5
9
2.2-5.0
+10
▼
+0.9▼-0.1
4,358.9 8
1,399.60.2
▼37
10 3.1
5.5
-1.9
2.0 ▲2.7
0.1 0+1.3
-
▲3.8
+5.24,611.0
▲
▲
* tie
3,205.2▼1.8912*
10*Vinson & Elkins LLP 8*
1.8
Visit http://dmi.thomsonreuters.com to view archives and order custom League Tables
100.0
▼
Industry Total
12* 29*▲
▲Gibson Dunn & Crutcher 15
Proskauer Rose LLP
Fried Frank Harris Shriver & Jacobson
14*
Sullivan & Cromwell
6
17*
24*
17*Baker Botts LLP
17* -
▲14 2.8+412+3
2.4
2.2
3.7+11
6
2,767.2 12
▲
21▲ 270.6
▲ 2,165.7
7▲▲ 4,408.6
5.8
9.0
Proceeds1 86 +33
Sh (%)
4+4 7,020.6+0.8+3.5
10,846.5 +1.3
17.1+5
1.8
22,238.7
163+13 ▲
Sh (%)▼
▲▼
10.93
16,802.818.5
Change in Share Ch.
14.0
Proceeds per Advisor (US$m)
# of Deals
▲
Market
-3.421 -2.6
MarketRank
▼
26.8%
Jan 1 - Jun 30
+0.8 ▲
2016 Rank
US Equity & Equity Related (AB2)
▼ -15.0%
2
% Change from Same Period Last Year
Davis Polk & Wardwell
12 ▲911
4
57
1.2
50.4% ▲
504
-6.2%
42* 6 1.2
28
5 ▼▲
1.680.429*
-4
+0.316
Sidley Austin LLP
1.3
2.8 +2.6
+0.8
+1.4
Freshfields Bruckhaus Deringer
Cahill Gordon & Reindel
3.2 Cravath, Swaine & Moore
▲▼
# of MarketChange in
% Change from Same Period Last Year-15.0%
18
25
6
5.06*
12* 3.6
6*224 +10
Goodwin Procter LLP 5+0.2 ▲▼
213Cooley LLP
Skadden▲▼
Covington & Burling+3
8,850.8+11
15,756.9
8,826.2
3,614.3
Vinson & Elkins LLP
+0.5
-0.1
-0.111
7.4
▲
Latham & Watkins 1
7▲▲21
1
Market
7,910.7
2
Sh (%)+8
5.1
18*10*Mintz Levin Cohn Ferris Glovsky & Popeo
4.83.0
24
-3.7Share Ch.Sh (%)
6.4
+5 ▲ 3+14 +4.1
4.8
4 6.6 Latham & Watkins
Proceeds per Advisor (US$m)
15.3%▼
US Equity & Equity Related (AB2)
# of Deals per Advisor
% Change from Last Quarter
2016 Rank
Cooley LLP8,772.7
32Issuer Legal Advisor
2017 Rank
3
1 ▲
-1.8%
2 7 25
Market
▲▲ 6,089.85.0
1.1
▼+1.1 ▲
7.3
+0.8+2.9
▲▲
+6
6
5
24▲▲
7.46.6
2 -0.8
Wilson Sonsini Goodrich & Rosati 4* 8* 4.2Venable LLP 4* 4* 21 4.2
7,889.1-0Goodwin Procter LLP 6 3 19 3.8
▲+5Simpson Thacher & Bartlett 7* 4* 15 3.0
+9Skadden 7* 8* 15 3.0
2.6▲
2.44.1
Fenwick & West LLP 9 16* 14 2.8 1,329.0Davis Polk & Wardwell 10
11* 33* 12Morgan Lewis & Bockius19* 13 4,975.2 8▲+9
▲ 1,507.3 22+8 ▲ 3,779.3 10+9
+9 3,318.7 12▲Sullivan & Cromwell 11* 19* 12 2.4Fried Frank Harris Shriver & Jacobson 13* 70* 10 2.0
15* 19* 9 1.8Morrison & Foerster 13* 16* 10 2.0 1,520.0 21
-5
1.3 +0.8+5 ▲ 3,223.4 13
1.81,953.6Cravath, Swaine & Moore 17* 53* 8 ▲+6
Ropes & Gray 15* 6 ▼ 1,826.6 18
+51.6
9
% Change from Same Period Last Year% Change from Last Quarter
50.4% ▲ 26.9% ▲
+32,391.5
6,569.4
-6.2% ▼
▲
-14.9%
14
-3 ▼ 3,947.3+7
▲
2.4
▲
64.6
3.3
+8
2.7+5
26.8%-1.8%
▼
▼15.3% ▲
11
▲
+169
1.5 -1.2
-14.9%▼
4.24.4
16
▲
1.6 +1.2 ▲
17* ▲100.0
▲
6 1.2
% Change from Same Period Last Year% Change from Last Quarter
+2.5
Clifford ChanceSidley Austin LLP 17* 33* 8 1.6 +5 4,893.4
▲ 3,746.9
9 4.1 +3.4 ▲
Shearman & Sterling LLP19 1.4
▲+1.6
Baker Botts LLP 19* 13* 7 1.4 +1 2,077.4 15 1.7 -1.7 ▼
Paul, WeissWilmerHale
19* 53* 7 1.4 +519* 11* 7 1.4 0
▲-
1,654.6829.5 35 0.7 -0.4
▲▼
+0.9
4
6 80
1
83
US CAPITAL MARKETS REVIEW†
▼ 92,967.7
59,114.0
▼
-0.7
▲
▲
Davis Polk & Wardwell
Proceeds per Advisor (US$m)
First Half 2017 | Global Capital Markets | Legal Advisors
-2.4
▲
Share Ch.101,500.1
# of Deals▲
+0.3 ▲▲
MarketMarket
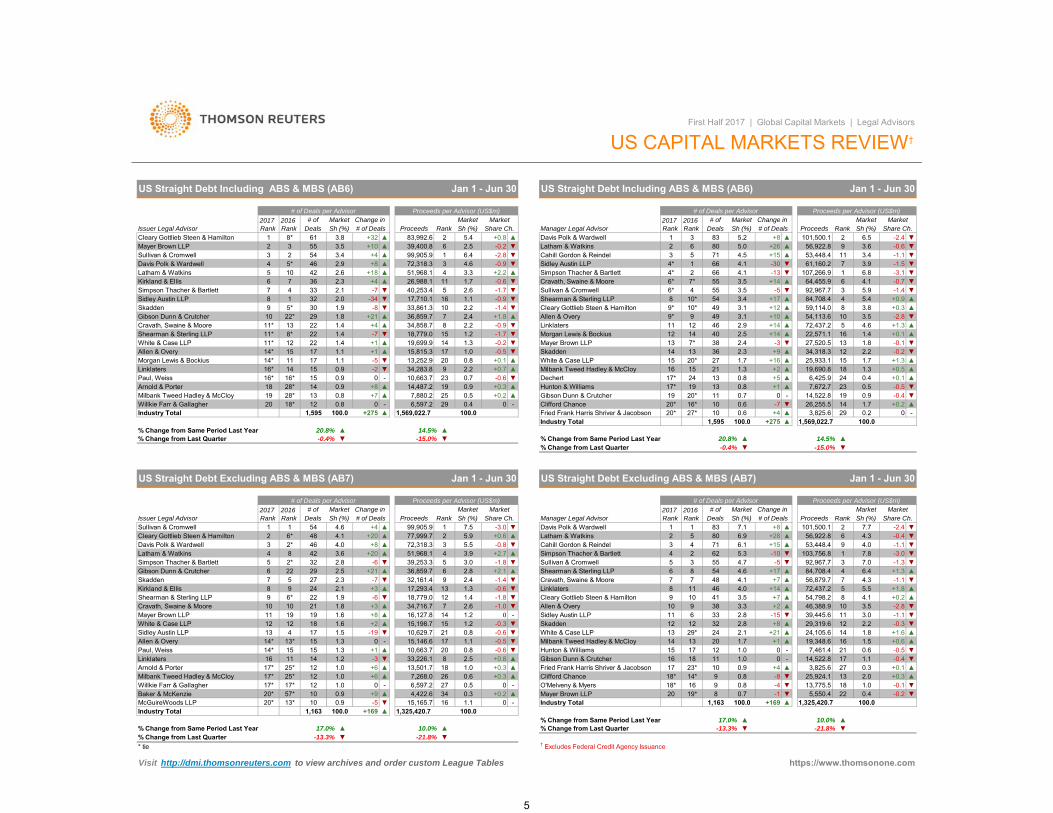
US Straight Debt Including ABS & MBS (AB6)
▲
▼
566
3
3 ▼Proceeds
▲
66+14
▲
▼
-7
▼+1.3
+0.2
+0.5
-2.8
-0.2
2
-30
3.56*
▲
-1.5
1
20 18* 12
4*
Cravath, Swaine & MooreSullivan & Cromwell
Allen & Overy
Morgan Lewis & BockiusLinklaters
Simpson Thacher & Bartlett
Cleary Gottlieb Steen & Hamilton 9*
-5
+14
3.43.1
2.99*
255
+17
3.5
46
Willkie Farr & Gallagher
1112
Skadden
6*
20*
7*
-
15Milbank Tweed Hadley & McCloy 16
Hunton & Williams 17*
Latham & Watkins
Mayer Brown LLP
71
8 54
14
4 55
40
Shearman & Sterling LLP10*
+14 ▲2.5▼-3
14
912
▲
+8
▲
+92.3
-134.14.5
-0.6 ▼3.411
5.9
3.6
▼
▼▼3.9
▼▼1 6.8
84,708.4
-3.1
▲4 5.4
64,455.9
+123.1
+16 15
49
27
16
36
26,255.5 14
7,672.7
+0.9
54,113.63.8
0.919
+1.3▲
23 0.5
1.3
+1 -0.524
0Clifford Chance
1916* 1020* ▼
▲
20*0.6
-0.4
5
1.7+2
▲ 25,933.1▲
▲
27,520.5
19,690.8
34,318.3-0.1
12
18
+0.11.8132.2
-1.4
-1.1
1.714,522.8 ▼
▲-
0.8
20*
0.7
3.58
107,266.9
Rank2
61,160.2
9
3
15
10
6.5Sh (%)
22,571.1
7
56,922.8
4.61.4
6
▲
53,448.4
+5
72,437.2
6,425.9
▲+10
4.1
▼
5.0 +26+15
5.2▲
2016 Rank
0 0.4 0
US Straight Debt Including ABS & MBS (AB6)
0.8
99,905.9
2017 Rank
Market
6.4▼▲
-2.81-0.9
▼4.6
▲
3.8
+2.2
Cahill Gordon & Reindel
▼▼
▼
2.5
72,318.3
-0.2
White & Case LLP
Sidley Austin LLP
-0.9
+0.317*
Cleary Gottlieb Steen & Hamilton
1,569,022.7
Market# of Deals
83,992.6Proceeds
6▲
3+4
Jan 1 - Jun 30
Sh (%)
1.3
38
0.819 13
2.4
10*49
7*
11
4.1
Issuer Legal Advisor
13
4*
24
Market# ofManager Legal Advisor
13
1.7
Gibson Dunn & Crutcher
Jan 1 - Jun 30
Change in # of Deals per Advisor
0.6
Deals
21
27* 10
13
▲
2 +0.8
+4
▲
Sh (%)Rank
# of Deals per Advisor2016 Rank
2017 Rank
8*
Change in # ofDeals
1Sh (%)
5.439,400.83
4 5* ▲
61 +32
3.42 3.5 +10
Sullivan & Cromwell 3 2 54Mayer Brown LLP 55
46Latham & Watkins +185 10 42 2.6
2.9 +8Davis Polk & Wardwell4 3.3▲ 51,968.1
+4 ▲Simpson Thacher & Bartlett 7 4 33
362.1
Kirkland & Ellis 6 7-7 2.6
-0.9-1.7
▼ 17,710.1540,253.4▼16 1.18
Skadden 9 5* 302.0 -34Sidley Austin LLP 1 32
10 22* 29Gibson Dunn & Crutcher10 2.2
▲ 36,859.71.8 +21▼1.9 -8 33,861.3
Cravath, Swaine & Moore 11* 13 22 ▼8 2.21.4 +4 ▲
+1▼1.4 -7Shearman & Sterling LLP 11* 8* 22 18,779.0
-0.5White & Case LLP 11* 12 22
15▲ 19,699.91.4
13,252.91.1 -5Allen & Overy 14* 15 17 1.1 +1 15,815.3
-2Morgan Lewis & Bockius 14* 11 17 ▼
0.9
0.923
Linklaters 16* 14 15 34,283.810,663.70.9 0
28* 14 ▲Paul, Weiss 16* 16* 15Arnold & Porter 18
Industry Total
28* 13
1,595 100.0 +275 ▲
14,487.2 1919 0.8
29100.0
▲+0.26,597.2
Milbank Tweed Hadley & McCloy +70.9
Proceeds per Advisor (US$m)
26,988.1 ▼11 1.7
Market
-0.6
▼+8
+1.8 ▲
▲
▼
1.0+0.1 ▲20
25
0.8+0.7
17
▲ 7,880.2-
-
0.5
2.3
34,858.77 2.4
+0.1-0.6 Dechert 0.4
Share Ch.
▲
-1.4
14 -0.2
2.20.7
▲
▼-1.7 ▼
▼
▼
1.3
Fried Frank Harris Shriver & Jacobson
1.2
▼
9
3,825.6 29 0.2 0 -
+0.3-
▼
Clifford Chance
▲14
Gibson Dunn & Crutcher▼
▼
14.5% ▲
▼
17*
7
15▲ 15,198.7
1.0
▼
▲
39,253.3
32,161.4
▲
▼
17* 6,597.2-+6
16 11
▲ 7,268.01217*
15
12Arnold & Porter 25* 18▼
+6 ▲1.214
1.6 +221
-0.6
00 0.5
+1 ▲ 10,663.7
Milbank Tweed Hadley & McCloyWillkie Farr & Gallagher 12
% Change from Same Period Last Year 20.8% ▲
1.01.0
17*25*
Sidley Austin LLPAllen & Overy 14* 13* 15
1713
+21
-1.0
▲ 36,859.7
13▼
34,716.7+318,779.0
2.6
Linklaters
White & Case LLP 12
33,226.1
1.1
-0.3
Paul, Weiss 14*+0.8
17
-6
+3
151.3
4 1.5
1.3
1.8 ▼
▼Latham & Watkins
0.8
Sullivan & Cromwell
Cleary Gottlieb Steen & Hamilton
0
Share Ch.
6
2 +0.63 5.5
▲
1.2
0.8
-
-0.6
14 1.2
▼-0.5
▼
▲+0.3
8 2.5
▲1.0
1,325,420.7
34 0.3 +0.216
% Change from Same Period Last Year
† Excludes Federal Credit Agency Issuance-21.8%
26 +0.3
10.0%
* tie
Visit http://dmi.thomsonreuters.com to view archives and order custom League Tables
▲▼
▲13,501.7
270.6 ▼
Industry Total
25,924.1
▲% Change from Last Quarter -13.3% ▼% Change from Same Period Last Year 17.0%
20-3
▼ 10,629.70 15,146.6-
-19
+8 16,127.8Mayer Brown LLP 11 19 19 1.612 18
Cravath, Swaine & Moore 10 10 211.9 -6Shearman & Sterling LLP 9 6* 22
Kirkland & Ellis 8 9 249
▲ 17,293.42.3 -72.1
Gibson Dunn & Crutcher 6 22 29Skadden
2.57 5 27
Latham & WatkinsSimpson Thacher & Bartlett 5 2* 32 2.8
4 8 42 3.6
+44.64.1
Davis Polk & Wardwell 3 2* 46 4.0 +8+20 ▲
▲▲
Sullivan & Cromwell 1 1 54Cleary Gottlieb Steen & Hamilton
+20
4899,905.9
51,968.172,318.3
4Cahill Gordon & Reindel
3.9 Simpson Thacher & Bartlett
77,999.7
+2.7
-3.0▲2 6*
1 7.5
MarketProceeds
▼Share Ch.
% Change from Last Quarter▲
1,595
▼
100.0
Davis Polk & Wardwell
2017 Rank
8380
# of2016 Rank Deals
11 7.1
+7
-562
+17
+8
7
4.76
75448
85
4.1
-0.84
▼
▼▲
1.4
2.8-1.4
-1.8
+2.1
9
Cravath, Swaine & Moore2.4
3.0
▼
▼▲
▲
Shearman & Sterling LLP
8 +14
6.4
11 46 4.0
4.0-10
3▲
55-1.8 3
42
2
▼
56.1
+28
5.3
+275
▼+15
6.9▲3 71 ▼
# of Deals
# of Deals per Advisor
-2.42
-0.4%
4.3▲ 56,922.8 6
1,569,022.7
Market
101,500.1▲ 7.7
MarketProceeds per Advisor (US$m)
▼-15.0%
100.0
Rank
▲
US Straight Debt Excluding ABS & MBS (AB7)
20.8%
Hunton & Williams
% Change from Same Period Last Year-15.0%-0.4%▲
2.1
3.3
Jan 1 - Jun 30
▼
4.6
▼-1.1
+0.2
Sh (%)
-0.4
Skadden
Fried Frank Harris Shriver & Jacobson 17
13
▼
Milbank Tweed Hadley & McCloyWhite & Case LLP
▼
11Sidley Austin LLP
12Allen & Overy
1.3
Industry Total
Linklaters
5▲
-0.6▼
# of Deals per Advisor
Deals
▼
1715
106
14 13
▲
39,445.6
Sh (%)
4.15.5
953,448.4
72,437.2▲
84,708.4
+1.8
-1.31
4.35
+1.3-1.1
7.8
4
-1.1
756,879.7
-3.07.0
103,756.892,967.7
+8
+7
-153.5
854,798.2+2
123.011
▼10▲▲
-0.4
1.8▼
+1.6
▼46,388.9 -2.8
▼+0.10.3
2.0
1.1▲
1.5 +0.6 ▲▲2117
19,348.6 16
14,522.8--0.50
▲
+21-0.329,319.6▲ 2.2
24,105.6
0.6
3,825.6▲▲
18
▲1,163
41 3.5
2432
11 1.0
▲
▲
-8
02713
+17,461.4
+4
-
90.9
Issuer Legal Advisor
▼
1.71.0
3338
2.82.8
Change in
16
18*
-13.3%
Market
0.8
# of Deals
% Change from Last Quarter
20
23*
10
14*10
12
29*1212
9
5.9
# of Market
14.5%% Change from Last Quarter
2017 Rank Manager Legal Advisor
2016 Rank Sh (%)
Jan 1 - Jun 30
Proceeds per Advisor (US$m)
US Straight Debt Excluding ABS & MBS (AB7)
Sh (%)Change in Market
Rank
-0.118 1.0
10.0% ▲
▼13,775.5
1,325,420.7
16 0.8 -4
▼ -21.8% ▼
▼
+169100.0
17.0%
100.0
https://www.thomsonone.com
Proceeds
O'Melveny & Myers 918*4,422.6
15,165.7Industry Total 1,163 100.0 +169 ▲ 100.0
▼McGuireWoods LLP+9
20* 13* 10 0.9 -5▲Baker & McKenzie 20* 57* 10 0.9
1.1 0▲-
Mayer Brown LLP 20 22 0.4 -0.2 ▼19* 8 0.7 -1 ▼ 5,550.4
5

---
12 0.7 -14 0.6 -
11 0.8 -1.115 0.4 -
▼---
607.6259.4574.9417.4
1 0.4 -11* - 1 0.4 -
1 0.4 -111* - 1 0.4 -
Davis Polk & WardwellLatham & WatkinsSidley Austin LLPSullivan & Cromwell
11* 7*
11* -13 0.6 -1.1
---▼
0.3 -9* 0.8 -11 0.8 0
---▼
222.1593.0607.6456.3
0.40.40.40.4
--0
-1
--
9*8
1111
10*10*10*10*
Latham & WatkinsMcGuireWoods LLPShearman & Sterling LLPStikeman Elliott
▼
100.0Industry Total 245 100.0 -80 ▼75,614.4 100.0
15
Industry Total 245 100.0 ▼
13.0 ▼
2.3
+0.1-3.0
▲
-8.8 ▼▼
-
75,614.4
▲
Burnet Duckworth & Palmer 7* -0.8
-80
80.8 -
0.9720.79*- 606.6
5* 2 0.8 -1- 2
Borden Ladner Gervais LLP 6 5*Davies Ward Phillips & Vineberg LLP 7*
1,055.0Norton Rose Fulbright 4* 5*
▼4 1.6 +1 15 2.0 +2
▲ 9,849.07▲
▼ 1,773.3 51.4 -1.2
McCarthy Tetrault 4* 1 5 2.0 -10▼ 1,628.4 6 2.1 0 -Torys 3 3 7 2.9 -1▲ 3,331.4 3 4.4 -1.1 ▼Osler Hoskin & Harcourt LLP 2 2 12 4.9 +3
4 18 7.4Deals Sh (%)
Canada All Debt (CAL1)
Market
+13Blake Cassels & Graydon 1
Jan 1 - Jun 30
2016 Rank
2017 Rank
MarketRank
# of Deals per Advisor Proceeds per Advisor (C$m)# of
First Half 2017 | Global Capital Markets | Legal Advisors
Proceeds2▲ 4.7 +1.7 ▲
# of Deals Sh (%) # of Deals# of
DealsManager Legal AdvisorChange in
# of Deals per AdvisorMarket Market
RankProceeds
Blake Cassels & Graydon
CANADA CAPITAL MARKETS REVIEW
Sh (%) Share Ch.Issuer Legal AdvisorMarket
Share Ch.Sh (%)2016 Rank
2.5% ▲% Change from Last Quarter9.5%
18.2%% Change from Same Period Last Year -24.6% ▼
2017 Rank
▲
Change in
3,526.2
Market
▼
Canada All Debt (CAL1) Jan 1 - Jun 30
9- -
Proceeds per Advisor (C$m)
618.4-1.1 ▼
8 0.90.8 - -
0.8 -1 606.9 10 0.8- 3 1.2 - -
- 684.51.6 --0.3 ▼
4 2.4 -5.5 ▼2.0 +2 ▲ 1,089.8 7 1.4
-2.7 ▼Davies Ward Phillips & Vineberg LLP 4* 4 5 2.0 +1 ▲ 1,759.4
2.5 -2 ▼ 2,217.2 3 2.9▲ 8,967.5 1 11.8 +3.1 ▲▲ 6,361.5 2 8.4 +3.0 ▲7.4 +7
Osler Hoskin & Harcourt LLP 2 3 8 3.3 +21 1 18
2 6
- 4
8* 5* 2
5* 5
Torys 3
Norton Rose Fulbright 4*
Goodmans 7Stikeman Elliott 6
McCarthy Tetrault
8*
-24.6%% Change from Same Period Last Year▲% Change from Last Quarter▲9.5%▼
18.2%▲2.5%
10*
Sullivan & CromwellAllen & OveryDavis Polk & Wardwell
-- 1 0.4 -
7*10*
- 1 0.4 -
---
- 2 0.8 1,841.8294.4574.9
4 2.5 -14 0.4 -12 0.7 -
---
Allen & OveryGibson Dunn & CrutcherBurnet Duckworth & Palmer
8*11*
- 2 0.8 -7* 2 0.8 0- 1 0.4 - 1.8 -
---
514.21,109.61,332.3
-▼-
1365
0.7 -1.5 -0.1
--1.6 ▼
Clark, Wilson 12* - 3 1.4 -Borden Ladner Gervais LLP 12* 10* 3 1.4 -1
-4.0 ▼Skadden 10* 6* 4 1.9 -1 ▼ 273.210* 12* 4 1.9 +1
1.315
- -3,629.8 2 17.8 -8.5
188.2▼
Sh (%)
17
Share Ch.
1,272.431.1
-▲
Goodmans 10* -
-
213 100.0 +59 100.020,205.2▲
-8.5
Baker & McKenzie
2.4
Paul, Weiss- -
79.6
+5Proceeds
1 ▲▲
Industry Total +59213
-11.1%
# of DealsMarketMarket
Proceeds per Advisor (C$m)
6,280.6 +15.4
Jan 1 - Jun 30Canada Equity & Equity-related (CAL4)
Sh (%)10.3Blake Cassels & Graydon
Issuer Legal Advisor2017 Rank
2017 Rank
Market Change in 2016 Rank
# ofDeals Deals
8.9
104
16
221*11*-
6.19*
2.8
13
6 2.8-
Stikeman ElliottCassels Brock & Blackwell LLPBorden Ladner Gervais LLP
6
5
6
2
99*Osler Hoskin & Harcourt LLP
TorysMcCarthy Tetrault
Fasken Martineau DuMoulin LLP
9
1.9 -
2.5
3
5
7*0 -
9* 4.7
-
7.5 -19
4*2.41.9
4.2 +5
7*
12*3
6.30.9 -18-
-1.7190.0
6▲+2
▲
▼
▼ 530.0
2.2 +1.8▲
-
10 2.7
12
-263
▲
+9▲ 2,385.3+6
446.4
-11.8 +6.1 ▲0.4 0
+3.5 ▲-2.3
-505.4
15.7%
5.37
▲
11
▼
% Change from Same Period Last Year -11.1%▲
Davies Ward Phillips & Vineberg LLP 10* +1 ▲ 369.64
Visit http://dmi.thomsonreuters.com to view archives and order custom League Tables https://www.thomsonone.com
16 0.9
-14.7% ▼38.3%
1.8 +0.5
100.0
181.8 17 0.9
Rank2016 RankManager Legal Advisor
▼ 182.7
Jan 1 - Jun 30
▼Share Ch.
▲▼
# of# of Deals per Advisor
Change in
▼1,063.3
4-4
14
Market
-13.1 ▼-4.1
▼ 489.31.4
20,205.2
0.9
100.0
194.0
# of Deals per Advisor
-1.4▲+115 1.0 -0.1
▼▼
1,127.3 8 5.714* 4 1.9 +2
Skadden 10* 12* 4 1.9▲
▼Torys 8* 5* 5 2.4 -2Bennett Jones 10*
Paul, Weiss 7 1* 6
11▼2.4 292.1 13
-7 16.7▼ 3,380.2 2 -1.5Burnet Duckworth & Palmer 8* 1* 5 -8
+2.7+4 ▲ 917.7 ▲9 4.610*
0 - 2,640.7 44.29
12 5.6 ▲
▼Osler Hoskin & Harcourt LLP 6 5* 7 3.3 13.3 -0.8 ▼
2.8
1.3 +1.13,066.2 3 15.0
▲+14.8
6.6 6
+8
14
259.6 14
▲+3 ▼Stikeman Elliott 3 14* 13 6.1 ▲
-8.3▲
6.9+5 ▲
Sh (%) Proceeds22.9
MarketSh (%)# of Deals
Proceeds per Advisor (C$m)Market
Canada Equity & Equity-related (CAL4)
1,396.1+11
14,622.1Rank
8.0174
1 3
Norton Rose Fulbright 5 8*Cassels Brock & Blackwell LLP
Blake Cassels & GraydonMcCarthy Tetrault
4
* tie
% Change from Last Quarter15.7%▼▲
38.3% ▲% Change from Last Quarter ▼% Change from Same Period Last Year
-14.7%
Industry Total
2
Miller ThomsonGowling WLGTroutman Sanders LLP
12*12*12*
-8*5*
333
1.41.41.4
--2-4
-▼▼
42.1125.1
53.3
322230
0.20.60.3
-+0.3-0.5
-▲▼
Dentons Canada LLPGowling WLGWildeboer Dellelce LLP
14*14*14*
16*--
333
1.41.41.4
+2--
▲--
559.044.4
121.1
83021
2.80.20.6
-4.8--
▼--
6

100 02 425 355 4
▼▼
Cravath, Swaine & Moore
Sullivan & Cromwell 10 8
▲Shearman & Sterling LLP7
▼
Proceeds per Advisor (US$m)
Share Ch.Change in
# of Deals per Advisor2017 Rank
2016 Rank Deals
MarketMarket
▲
Market
+201.865 +7
5
▲
▲
▼
-134
King & Wood Mallesons
Cleary Gottlieb Steen & Hamilton
15
Industry Total
White & Case LLP
Skadden
Sh (%)Manager Legal Advisor
Clifford Chance 5
19
72,121.0
+0.5 ▲ +54 ▲
# of Deals# of
86113
3-41
19
11
13 14
Sidley Austin LLP 8*58
12
8*
14
23.3
-29
Rank
38
6
1.212*
1.8
242
Proceeds
2.3
Sh (%)
9
8.9
56,637.2
216,263.4
▲128,643.0
-1.9
-0.6
▲-0.22.5
First Half 2017 | Global Capital Markets | Legal Advisors
All International Bonds† Jan 1 - Jun 30 All International Bonds†
INTERNATIONAL DCM AND EMEA ECM
Jan 1 - Jun 30
# of Deals per Advisor
DealsMarket Market
1.9
Market Change in Share Ch.
-1
2017 Rank
2016 Rank
# of
12*
Proceeds per Advisor (US$m)
Linklaters
Simpson Thacher & Bartlett
Issuer Legal Advisor
▼-1.8
26 0.4
Sh (%) # of Deals Proceeds Rank
+1
Sh (%)
-0.3
1.11.11.5
▲+0.1
+0.1+0.1 ▲
Latham & Watkins
Cahill Gordon & Reindel-0.5 ▼
Hogan Lovells6*
17*
16
322 4.1
Davis Polk & Wardwell
-15
+25+25
2.5
6 66
6*
1.9
4
11
6310
9
1.71.4
+1.7
69 3.02.0 ▼
3
7
▲ 5.32
▼
▼▼2.0
3.7 +0.7
-0.4
▲410 -0.8
4.7
-11 ▼
-▼
1.7
114,760.2
61,341.8-12 5
8
-1.7
1341,842.14.4
48,731.5
1.911
3,684.6 3314
44,859.3
-0.1
1.1 ▼+12
-1.2-0.3 ▼
0-0.2
0.226
▼
▼1.912-0.1
▲+0.1▼▼
15
331.01.0
1.2
-0.212,733.4 20
▲ 30,182.7
+0.6▲▲
160.622
0.7+0.4
0.5▲0.6
-0.324▼ 7,167.5
0.8▼
20,435.114,728.7
+12 ▲▼0.3
16,143.1 18
+138
Freshfields Bruckhaus Deringer22*
0.6Stikeman Elliott 19 32* 0.516
15+1.0▼
Mayer Brown LLP
20* 15
3 419
▲37,597.3
1.4 -733,615.1 17
▼
1 13.5461
63
100 0
3
47.1
0.8
▲
9 +220▲
+7
▼
-0.4
▼17
▼10.9264,494.5 -1.0+148 1Allen & Overy 1
1.6
▼
Milbank Tweed Hadley & McCloy 18
20*
▲19 0.6
Cravath, Swaine & Moore 18 18 2312Gibson Dunn & Crutcher 17 23 25 0.7
▼+14 ▲
0.7King & Wood Mallesons 19 17
+5
Kirkland & Ellis 15* 16 270.8 5Skadden 15* 13 27 37,047.3 1.5
-0.40.8 0 - 18,365.0 0.811 -0.5
20 0.5 -0.6 ▼0.8 -19 ▼ 13,085.0Sidley Austin LLP 14 7 2816 1.0Shearman & Sterling LLP 13 11* 29 -0.9 ▼0.9 -5 ▼ 23,427.68 1.615
-1.0 ▼1.0 -3 ▼ 39,643.2▲
Simpson Thacher & Bartlett 12 10 33▲ 26,129.2Freshfields Bruckhaus Deringer 11 11* 37
White & Case LLP 9 3 43
1.1 +3Mayer Brown LLP 10 14 38
7 2.1 +1.1 ▲1.410
50,973.5▼1.3 -22 ▼ 37,193.9
131.1 +8 ▲ 27,691.8
Davis Polk & Wardwell 7* 8 49+21 ▲Latham & Watkins 7* 15 49
1.4 +5 ▲ 73,879.4 6 3.15 3.5 +0.2 ▲1.5 13 ▼ 85,429.2
Anderson Mori & Tomotsune 5* 6 50 8,656.0Clifford Chance 5* 4 50
1.5
Cleary Gottlieb Steen & Hamilton 3 9 744 5 ▼1.6 -6 ▼ 110,320.5Sullivan & Cromwell 55 4.61
▲2.2 +34 ▲ 98,343.6 3 4.1 +0.698,587.3Linklaters 2 2 89 2.6 ▲
Allen & Overy 1 1 117 -1.2 ▼3.4 -12 ▼ 88,083.8 4 3.6
4047
106,336.6
90,177.3
0 - 45,967.8
▼
17* 0.4 -7-6 ▼ 2,819.0 48 0.1 -0.2
▲ 7,541.6Baker & McKenzie 20 25* 17 0.5 +9 30 0.3 +0.2 ▲▲ 100.02,425,355.4 Morgan Lewis & BockiusIndustry Total 3,419 100.0 +138 15 0.4 +7 ▲ 7,881.3 23 0.3 0 -
† Excludes Federal Credit Agency Issuance
1.5 -2.6 ▼12* 5 0.8 +2 ▲ 2,025.9
▲▲
▲▲
219.11,446.6
36 0.216 1.1
5 0.8 +45 0.8 +4
10*10*
Covington & BurlingNorton Rose Fulbright
26*26*▲
▲ 13 1.0 0 10*▼- Latham & Watkins
Clifford ChanceBredin Prat 14*
130.5 +2
51* 50.8
51* 314* 4 0.6
0.814*
100.0
100.02,425,355.4
1912
2
+0.2+1.0
13
▼
https://www.thomsonone.comVisit http://dmi.thomsonreuters.com to view archives and order custom League Tables
100.0
26
Proceeds
-4
% Change from Same Period Last Year ▲
+115 ▲
-17.8%
▲ 687.9
▲2,828.7
Deals
Jan 1 - Jun 30
MarketSh (%)
Proceeds per Advisor (US$m)
Sh (%)# of Deals
1.1 -0.8 ▼
8,385.0+6 12.5+2
▼
Clifford Chance▼
900.7-
▲
8 1.3 ▲+2
Change in
▼
▲
6
Industry Total
6
7 1.10.90.9
▲
1+5
Rank
17,277.8▲
0.7 -6.7
▲
12.4
Market
5
▲▼
+6
# of Market
9 -3
-4.5
▼
17*
-2.7 ▼
Baker & McKenzie
Freshfields Bruckhaus Deringer
Travers Smith
10
Market
4*8*44 0
11
% Change from Same Period Last Year 21.9%
+115 ▲ 138,309.5
0.2
Hogan Lovells 11* ▲
▲% Change from Last Quarter 18.4%
100.0
▲
Hogan Lovells
32.5%▲ 55.2%
▲ 408.4 35
▲
+1 1,366.71,441.0
0.3 -0.3▲
14 1.0 -0.3
17 +0.70.8
Industry Total 639
Norton Rose Fulbright ▼
Mourant OzannesNCTM
51* 3
1,033.411* 5
+1
12 1.1▲ 310.2
+2+4
-▲ 3,852.7 6 2.8Sullivan & Cromwell 7* 7 6
0.9Setterwalls0.9
Advokatfirman Vinge
+3▲ 1,479.3
7* 14* 6Davis Polk & Wardwell
830.37* 27* 6 0.9 +4
16.00.9 +4
22,094.1 17* 27* ▲6 22 0.6
877 1.1 4
▼▼
1.1-3
Linklaters5* 6
2*5*
2*4
23.6
55.8
Freshfields Bruckhaus DeringerBaker & McKenzie
▼
Market
1.4
▼Share Ch.
5.3-2.3
4*3
▼1.3 2.12,327.5-2 23 1,251.50.6805.1
1.71.49
33
4.2% ▲
+138
6.7%
1
-17.0%% Change from Same Period Last Year-17.8%
Sh (%)Sh (%)Market 2016
RankLinklaters
% Change from Last Quarter
Rank
# of Deals per Advisor
Proceeds4,081.82.5 ▲
Change in
4.2% ▲▼
Proceeds per Advisor (US$m)
3,419
# of Deals
100.0
13 2.0 +1 ▲ 4,935.0▲ 7,951.114 2.2 +3
6.7%
3.0 -4.5Manager Legal Advisor
EMEA Equity & Equity-related (AX2)
1
+1.46.13.1 +5.91.9
-1.3
▼▲
2+0.6
White & Case LLP
Allen & Overy4*
-3.1 ▼+0.4 ▲+9.5 ▲
-2.0
2017 Rank
6
34
8*
1
7
1220
4*
% Change from Last Quarter -17.0% ▼
Allen & Overy 2 2*
EMEA Equity & Equity-related (AX1)
# of Deals per Advisor
Deals16 +5White & Case LLP 1 2*
2017 Rank
2016 RankIssuer Legal Advisor
# of
Latham & Watkins 3
Jan 1 - Jun 30
20
▲17,093.4
2
12*
7*
+4
▲
+0.1 ▲▼ 9,561.9
+0.40.7
▲6.9 +1.0
% Change from Last Quarter% Change from Same Period Last Year 21.9% ▲ 55.2%
▲▲
18.4% ▲
* tie
32.5%
138,309.5
Davis Polk & Wardwell 10* 6 5 -3
Industry Total
32
Ashurst
CMS 26*4
274.5▲10*
-1
0.80.2
▼
1,548.8
+0.1
15
5 0.8
24
-4.0
0
1,027.5
0.9
Share Ch.
▼
0.5
▲▼
639 100.0
Cravath, Swaine & MooreENSafrica
+20▲-
14* 0.514* 14* 3 0.514* 51* 3 0.5 +214* - 3 0.5 -
▲-
1,258.42,912.0
284.189.3
+0.279 0.1 -
15 0.9 +0.89 2.1 +1.8
Shearman & Sterling LLP
14*14*14*
▲▲▲-
45 0.2
+28* 3 0.5 -1
SelmerSlaughter and May
8* 3 0.5 -1
▲▼▼
51* 3 0.5 324.0869.4
1,069.6
41 0.2 +0.121 0.6 -1.716 0.8 -1.2
▲▼▼
Webber WentzelBar & KarrerCleary Gottlieb Steen & HamiltonRoschierSimmons & SimmonsShearman & Sterling LLP
1516*16*16*16*16*
-16*
-26*107*
4 0.6 -3 0.5 13 0.5 -3 0.5 +23 0.5 -33 0.5 -4
-▲-▲▼▼
1,366.16,096.8
915.1116.1350.1
1,955.2
18 1.0 -7 4.4 +3.423 0.7 -49 0.1 029 0.3 -1.014 1.4 -3.7
-▲--▼▼
7

--▼-
17 0.5 -1.153 0.0 0
15 0.7 06 2.6 -
+1
▲--▲
604.62,307.6
475.221.9
+34 0.4 -
5* 4 0.4 0Milbank Tweed Hadley & McCloyCommerce & Finance Law OfficesD.S. Cheung & Co
36* 4 0.4
16* 3 0.3
-10*10*10*16*
Haiwen & Partners
100 0
10*1,421.7
1.6
100 0
1,440.9+0.4
▼
▲Kanga & Company 15* 17*
91.0
-1
Sidley Austin LLP
16* 0.4
9*
Luthra & Luthra Law Offices +2
Allen & OveryHowse Williams Bowers
Jingtian & Gongcheng4.0 2*1
10
5
Linklaters 2*+7.9
Herbert Smith Freehills
2*
▲
1014
-0.2
+0.3
3.9 +10▲
▲ 3,577.1Rank
4
▲▲
▲ 1,480.5
Manager Legal Advisor2016 Rank Proceeds
Proceeds per Advisor (US$m)
# of Deals▼+21
MarketMarket
-2.5Sh (%)
# of Deals per Advisor2017 Rank
MarketChange in Sh (%)
# ofShare Ch.
Change in Proceeds
Market# ofSh (%)Deals # of Deals
2017 Rank
▲
+0.51
+2 ▲
1.4
4,968.35*
1.1 21010
2.6▲ 5,533.41.7 -0.2
15
▲
-1.9
-+2.4
9
+2.0
19
00.2130* 0.0 0
0.92 6.423 ▲
▼1.5 -2.8
13 187.5
226*0.63110*
2.1 ▲-
820.9
2,403.0
1.41.4
12 ▲1.3
561.0
+7
▼
+11.3
9 1.0 ▼+6 5,696.5▲1.2-1
11
▼
4,070.89
935 ▲
165
1.0
100 0
15.6▼
+232
10*
JunHe LLPBeijing Kangda Law Firm 10*
14 20*20*12*Shu Jin Law Firm
Cyril Amarchand Mangaldas 15*
Handsome Attorneys at Law
Asia Equity & Equity-related (BX1)
1 44Deals
Tian Yuan Law Firm
Appleby
AllBright Law Offices
Far East United Law Firm
23
M.V. Kini & Co
Grandall Law Firm
Grandway Law Offices
Conyers Dill & Pearman
King & Wood Mallesons
Jan 1 - Jun 30
Issuer Legal Advisor4.7
Deheng Law Offices ▲
3*3* 4
Zhong Lun Law Firm6 2.7
2.5+16
2.92.9
2.33.4
1
0.62.7
11.02,290.2
▼▼
2,039.0+14 ▲-1.2
+9 8613
▲
▲▲
32
First Half 2017 | Global Capital Markets | Legal Advisors
2.89,695.527
5+6
+14 +0.4
Market
2 3627
15.6
Sh (%)2016 Rank
2614*
9
7
258
7 6
20 +11554.4
10* 5
-1814*
2.4▲
-335.2▲+7
12*17*9
10* 1312 ▲
Jia Yuan Law Offices
15*
2*
-
+3-1 16
0.0
3,037.0
16*
70
4.6
Paul Hastings LLP
Loeb & Loeb
1,299.2
▼
3
+0.2
+0.1
+0.3
6*0.9
131.1 +6
85Norton Rose Fulbright
2*+4.3
1.4+5
1,337.7249.4
+1.2
1,194.6▲
▲
106.3
2*-2
▲1.116* +81
▲25
-
0.3▼9
47
▲
-0.5
-+1
+3
30▲
+232100 0
5
10*
▲
16*9*
44
10*
Asia Equity & Equity-related (BX2)
Clifford Chance 2*
Rank
Proceeds per Advisor (US$m)Market
Share Ch.
+0.2
▼
# of Deals per Advisor
ASIA PACIFIC (EX JAPAN) CAPITAL MARKETS REVIEW
Jan 1 - Jun 30
Shardul Amarchand Mangaldas & Co- 46.2
6*5 +2.836* 0.5 +45
▲▲
935
6*
-4.1
- -
▲
▲
4 ▲
8
-
40.5
0.4-
0.5+2.1▲ 2.1
+2.60.4
1.3 +0.812
1.5
1,141.33,063.7
2.9▲-0.1
▼
-+1.01,083.3 13
2,541.0
3.584.3
41,832.9
39▲-0.1
1.2 ▲
400.91,042.9
88 490 4Industry Total
0
Industry Total
15*
1.01.6
▲
88 490 4
3 0.3 0 14 1.2 -0.33 0.3Khaitan & Co
JunHe LLP16*16*
▲-
+1 ▲▼
18 0.5 +0.2
Maples & CalderCFN LawyersHunan Qiyuan Law Firm
15* 20* 9
20* 17* 8
1.0 +420* - 8 0.9 - 0.1 -
0.9 +2
▲-▲
1,168.386.2
594.0 30 0.7 0
▲--
20 1.3 +1.2104
Grandall Law FirmP C Woo & CoS&R Associates
16* 36* 3
16* 36* 3
0.3 +216* - 3 0.3 - 0.0 -
0.3 +2
▲-▲
2,459.924.3
2,038.6 7 2.3 +1.9
▲-▲
5 2.8 +2.851
211,345.742.1%
▼
1.0
Industry Total 314
100.0
100.0
▲+0.3
4,642.8 2.2
2.1-1 ▼
7 ▲
13
▼Baker & McKenzie 13* 14* 3 1.0 +2 ▲ 1,173.3
+2.0
11
143,387.4 97
10.4
1.0▼
-1.11.6
100.0
2016 Rank
Market
Jan 1 - Jun 30
Issuer Legal Advisor1
▲
1 33
7*
-
5*
28,801.7
▲
▲+0.6
+2.0
10
▲
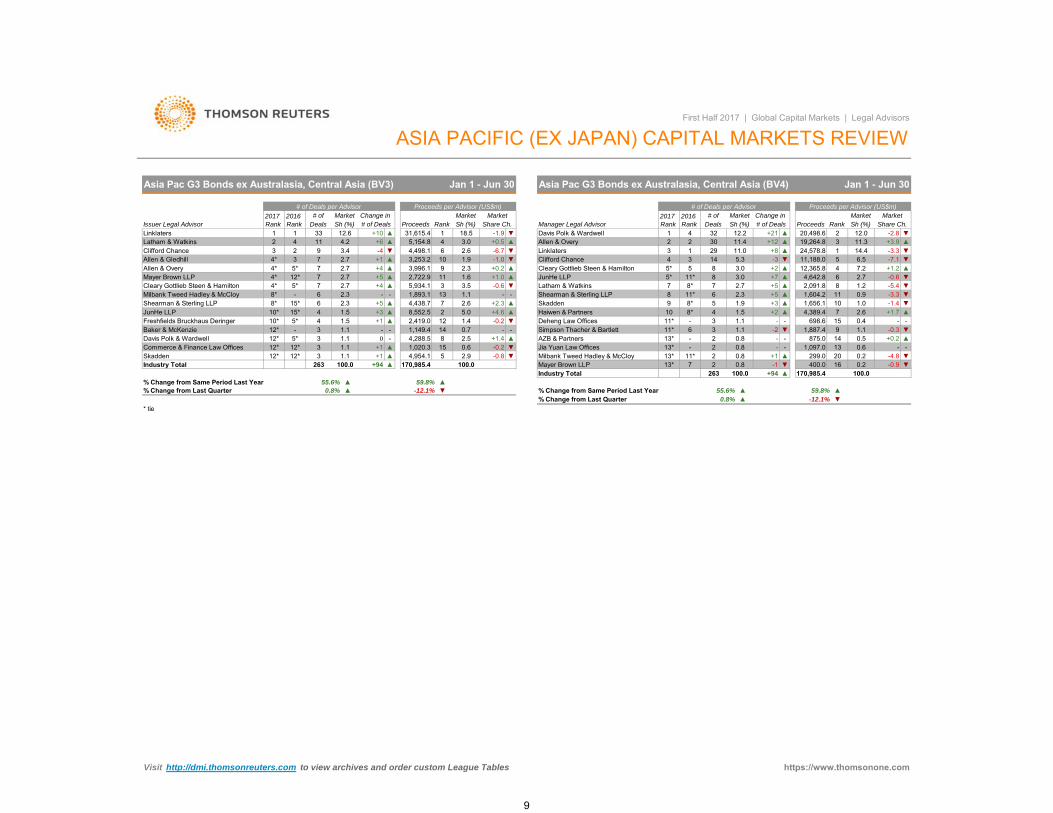
Asia Pacific G3 Bonds (BV2)
2016 Rank
29.8%
4.1
Deals # of Deals
# of Deals per AdvisorChange in 2017
Rank
3*
7*
# ofSh (%)
100.0
20*
-0.4
▲314
+72
Visit http://dmi.thomsonreuters.com to view archives and order custom League Tables
33.0%
935
▼
▲
▲
100.0
▼
+232
13
Allen & Gledhill
% Change from Same Period Last Year
20*
Linklaters
6*
+2
▼
100.0 100.0
-0.2
2
9* 1.08
42.1%
% Change from Same Period Last Year
# of
▼▲
8
35
+1
7
-
6
Change in
44.8
+232100.0 ▲935
2017 Rank
-4.3
1.2 +1.2Milbank Tweed Hadley & McCloy
▲9*
Baker & McKenzie
Clifford Chance
9*1.9
Shearman & Sterling LLP 9*5
▲
▼
-
▲
15
+4 2.8
14,377.0
7
6
Deals
1.966
+1.94,438.7
5
Share Ch.
▲
Davis Polk & Wardwell4
LinklatersAllen & Overy
+0.8
▼Manager Legal Advisor
Market
▲
33.0%-6.6%
Rank
3.4%
+9
# of Deals per Advisor
% Change from Last Quarter▲
-11.3%
11,738.0
13.6Sh (%)
▲
Market
4.8
▼
88,490.4
5
1 ▲
3
+1.2-5.8
▼
1,604.2
-1.1
4
▼
6
2
12,365.8
Proceeds
▼
0.8▲2,091.8▲
5.6
▼11*
+3.8 0.6
▲
-0.9
% Change from Same Period Last Year
* tie
▲
5*Freshfields Bruckhaus Deringer 12
2.68
11
6
▼6
8
2
4
Latham & Watkins
-9*14
Haiwen & Partners 1.39*
14*9*
4-1 ▼
- 3
29.8%
+72
+3JunHe LLP 1.3
-2.5%% Change from Same Period Last Year
--
-15.6%
2.6
▼
% Change from Last Quarter ▼
Cleary Gottlieb Steen & Hamilton+5
1.3
1.9
Simpson Thacher & Bartlett
5
Industry Total
-11.3%-6.6%
Industry Total
% Change from Last Quarter3.4%
2,006.1
Sh (%)
▲
Proceeds
Asia Pacific G3 Bonds (BV1)
Market
21,957.3
Sullivan & Cromwell
Shearman & Sterling LLP
Rank
-1.4 Cleary Gottlieb Steen & Hamilton
▲▼
8JunHe LLP
12
Sh (%)
+2
10.2
# of Deals
▲▼-4
▲▲
3
Proceeds per Advisor (US$m)Market
Sidley Austin LLP
1
2*2*▼1
2.4+21
15 -352.4
Clifford Chance
32
13*
6*▼
15*
4,389.4
10,053.8
▲
3.5
9* +4
76.8
0.9
1.6
14*2.6
11* 1.3▼
Skadden
5*
▼▲
2.22.2
9
▲5,934.1
+513
Mayer Brown LLP 5* 9*
1.9
2,892.9▼
7
1.4
9*
5.9
+2.9
MarketShare Ch.
Jan 1 - Jun 30
▲ 5,154.8
▲2
11.2+11
+0.610.2
326▲
-0.65.3
1311,183.9 -1.0
7* +611
+816
10.5
3.5-3 ▼3.2
Allen & Overy +53*2 5.1Latham & Watkins 3
▲
+5
Industry Total
1,893.1+5
-2,487.0 ▲
--
4
▲2.1
▲17
▲
-0.6
Fangda PartnersJia Yuan Law OfficesMilbank Tweed Hadley & McCloy
2.2+7
1.9
4 2 10 5,048.12.6
4
20*
-3+58
2,734.08,552.5
% Change from Last Quarter -15.6%-2.5%
211,345.7
▲Anderson Mori & TomotsuneDavis Polk & Wardwell
+0.1
9.7-6.5
▲
20,498.6
Proceeds per Advisor (US$m)
11
https://www.thomsonone.com
88,490.4
Deheng Law OfficesAZB & PartnersAnderson Mori & Tomotsune
▲
31,615.4
3,253.2 1.5
15.0
-0.2
17 0.50.6 -
15* - 2 0.6 -
---
698.6875.0987.6 -
---
19 0.3 -18 0.4 -
15* - 2 0.6 -15* -
15* 14* 2 0.6 +1
0.6 -0.5 -
--
12 0.8 -
▲
1,699.81,097.0
299.0
--▼24 0.1 -0.1
15
Commerce & Finance Law OfficesShimazaki Law FirmSkadden
14*14*14*14*14*
2+2
9* 3 1.0 09* 3 1.0 015*
15* 3 1.0 +1
3 1.0 +120* 3 1.0 ▲
▲
952.84,288.51,020.3
71.94,954.1
▲
-0.4
0.5 -0.110 2.0 +1.216 0.5 0
▼▲-▼▼
28 0.0 -0.18 2.3
Mayer Brown LLP 15* 8 2 0.6 -2 ▼ 400.0 20 0.2 -2.9 ▼
8
+94 ▲ 100.0
- 698.6 -
100.0+94100.0 ▲
8
15 0.4
-12.1%
-▲
+0.5
-1.0-3.314.4
19,264.8
-4
2016 Rank
Linklaters
Manager Legal Advisor
8*
JunHe LLP
2017 Rank
11*
5*
+4.6▲
-0.6▲
6
3 1.1
3
▲
-3.3
Share Ch.12.0
Jan 1 - Jun 30
▼
-
Share Ch.
▲
170,985.4
-0.6
▼
* tie
Industry Total
1.1
+1.0
% Change from Same Period Last Year
Freshfields Bruckhaus Deringer
Sh (%)
+1.22.7
▲
1-6.7▲
- -
1,893.1
JunHe LLP
59.8%
▼
▼
4,389.4-0.2
55.6%
▼Cleary Gottlieb Steen & Hamilton
▲12* 5*
+1
8*
-
3 11.3
5 6.5
Change in Sh (%)
ASIA PACIFIC (EX JAPAN) CAPITAL MARKETS REVIEW
Market
2
1 ▲
Davis Polk & Wardwell
-7.1
Rank
+1.4
▼
▲+0.2
-1,149.4
3
2 1143.4
4*4*
1Sh (%)
2017 Rank
72.7
5*
4* 5*4*
10*15*
-15*
12*1.5
10*
-5*
170,985.4
1.1 -4,288.5
12
100.0
0
Shearman & Sterling LLP8*
Proceeds
2.31.9
Sh (%)
▲
First Half 2017 | Global Capital Markets | Legal Advisors
Market2016 Rank
Proceeds per Advisor (US$m)
1# of Deals
24,578.82.6▲
64 3.0
▼ 3-4
+4
▼10
5,154.8
▲9
+6
11
1.5
Mayer Brown LLP
Allen & Gledhill
% Change from Last Quarter
Davis Polk & Wardwell
4
Milbank Tweed Hadley & McCloy
Baker & McKenzie 3
Industry Total
% Change from Same Period Last Year 55.6%
263
0.8%▲▲ -12.1%
2.5
▲59.8%
2,419.0
4,438.7 7
14 0.7
8,552.51.4
2.65.02
5,934.113
▲
▲20,498.6
Deals▲
10
263
+3.9▲
▲-
+3+52.3
4
66
-
▲
2,722.9▲
2.37
2.72.7 +5 ▲
3,996.17
+4
▲
97
31,615.4
4,498.13,253.2
12.6
2.7
+13
1 +104.2
Linklaters
Clifford Chance
33
2
▼-1.9 -2.8
MarketMarket# of# of Deals per Advisor Proceeds per Advisor (US$m)
Latham & Watkins
ProceedsMarket
18.5Issuer Legal Advisor Deals
Asia Pac G3 Bonds ex Australasia, Central Asia (BV4)
MarketChange in
+8
32
# of
+21
Asia Pac G3 Bonds ex Australasia, Central Asia (BV3)
Allen & Overy
Rank
# of Deals per Advisor
4# of Deals
3021 12.2
11.429
1.6Allen & Overy
3
12*
▼11.0▼Clifford Chance
Cleary Gottlieb Steen & Hamilton 5* 5 ▲4 5.314 -3
8*
3
2
3.08
7
+2
2.7
3.0
+12
Jan 1 - Jun 30
+32.3
811*
8* 5
+7
+2
3.5 ▼
+2.3▲
9-1.1
7
1.9
-
- 8Skadden
Latham & WatkinsShearman & Sterling LLP
Deheng Law Offices11*
Haiwen & Partners11*
▼7.212,365.8 4
10+1.7
▼7 2.6
1.011
-1.4▲ 1,656.1▲
▲0.8% ▲% Change from Last Quarter
▼
▼▲
+5 1,604.2-5.4
▲1.5
▼
11,188.0
0.91.2
64,642.88+5 2,091.8▲
+11.1 +1
12* 312*
1,020.34,954.1
▲▲3
Commerce & Finance Law OfficesSkadden
12*12*
1.10.8
▼▼
15 0.6 -0.25 2.9 -0.8
Simpson Thacher & BartlettAZB & PartnersJia Yuan Law OfficesMilbank Tweed Hadley & McCloy
13*13*13* +1
6 3 1.1 -2- 2 0.8 -
2
1,887.4875.0
1,097.0299.0
-- 2 0.8 -
11* 0.2 -4.8
9 1.1 -0.314 0.5 +0.2
▼▲-▼
13 0.6 -20
Mayer Brown LLP 13* 7 2 0.8 -1 ▼ 400.0 16 0.2 -0.9 ▼
Visit http://dmi.thomsonreuters.com to view archives and order custom League Tables https://www.thomsonone.com
9

18*
+24.82▼
9* 2 0.7 -111* 2 0.7 0
2 0.7 +1 ▲
Market
- 3 1.0 -- 2 0.7 -
Share Ch.
▲
100.0
9*9*
K&L GatesBennett & CoMinter EllisonMcCullough RobertsonKing & Wood MallesonsThomson Geer
% Change from Last Quarter ▲% Change from Same Period Last Year
112.9%-6.8%
9,454.0
% Change from Last Quarter
-21
% Change from Same Period Last Year▲
▼26.3%
100.0
Industry Total 288 -21 100.0▼ 9,454.0
288
100.0
2.1
Sh (%)
1.7 544.9-4
# of Deals Sh (%)
1.4
▲▼
Market
▼ -9.5%
▼
Baker & McKenzie
1▲
3.5 ▲5.8
Australia Equity & Equity-related (BY1)
2+2▼
First Half 2017 | Global Capital Markets | Legal Advisors
ProceedsMarket
▼
Industry Total
3
790.82.4Gilbert + Tobin 11 5 -7.6
Proceeds per Advisor (AU$m)
2 5 1.766* ▲
9*
4* 3 1.0 -2
Deals
Steinepreis Paganin1
# of DealsChange in
7
# of Market
-4
Market# of Deals per Advisor
Market
AUSTRALIA CAPITAL MARKETS REVIEW
Issuer Legal Advisor Sh (%)
26.6
Proceeds
12
2017 Rank
2
2016 Rank Rank
-3 ▼ 2.84
112.9% ▲
4.2
-9.5%
-
262.7
Jan 1 - Jun 30
266.2
8.40.3 +0.2
0.40.21.12.8
-3.2
0.7
26.3%-6.8% ▼ ▼
2 ▼Sh (%)
▼-
Baker & McKenzie
9*
DLA Piper LLPBellanhouse LegalClayton UtzHerbert Smith Freehills
+5 2,816.4 1
Proceeds per Advisor (AU$m)
Rank
Jan 1 - Jun 30
9*
11* 3 1.0 +1
5*
6* 3 1.0 -1
2016 Rank
41.714.9
103.5
# of Deals per Advisor
29.8
Change in
Australia Equity & Equity-related (BY2)
2017 Rank
3*Deals
10Herbert Smith Freehills
# ofManager Legal Advisor
Gilbert + TobinClayton UtzAllen & Overy
4
Share Ch.
+0.2+0.1-0.7
▼
-10.1
-2.2
-5.4
1.4 0
- 2 0.7 -
45*5*5*
6* 4 -▼▲▼--
19.0
539.624.0
101665
963.625.7
3 5.7 +3.5
15 0.2 -29 0.0 -
▼--▼
14 0.3 -
13 0.3 -0.1▲-
345*
Loeb & Loeb 5*
▲▲▼
-35 2 0.7 -23* 1 0.4 -4
22.4 +0.3
290.2226.1439.6
▼▼▼
▼▲-3 4.7 0
4 3.1 -21.45
- 1 0.4 - - 8.1 6 0.1 - -
1
4▲3
-1.5
100.0-66 ▼ 100.0
3
▼
https://www.thomsonone.com
608.4 --
0.4
67
▼-49.6%
550.0
▼
Industry Total
-
% Change from Last Quarter
1.2
46,217.4
-48.1%
* tie
% Change from Last Quarter -44.2%
Clifford Chance
▼
100.0
% Change from Same Period Last Year
Industry Total
7* -King & Wood Mallesons 5* - 3 -Baker & McKenzie
7.56.0 0
▲
4.54.5 +2
152.7+2.8
▲0
-▲
0.3-
-
6.4
MarketMarket
1.9
▼-2.2
2.9
-4.0%
6
1,337.6
-4.0%% Change from Same Period Last Year
1.35 --
- --
46,217.4
873.3
Deals2016 Rank
# of
2
Sidley Austin LLP 1+4.7 ▲
1Share Ch. # of Deals
▲Issuer Legal Advisor # of DealsSh (%)
Jan 1 - Jun 30
Sh (%)Change in
Proceeds per Advisor (US$m)
ProceedsMarket
223.5
Market
Jan 1 - Jun 30
RankProceeds10,864.8
▼2,947.23.0
Share Ch.1
7
13Manager Legal Advisor
6
2017 Rank
-44.2%
22
Australia International Bonds (BW2)
# of Deals per Advisor# of Change in 2016
Rank Deals▼
Proceeds per Advisor (US$m)
-
-6.2Sh (%)Sh (%)
9.0-1
-
19.4
-49.6%
▼
▼▼ -48.1%
▲
▼▼
67 100.0 -66 ▼
▼Simpson Thacher & BartlettSullivan & Cromwell
3*1,101.4 +0.8-0.4
Anderson Mori & TomotsuneSullivan & Cromwell
9Baker & McKenzie+3Linklaters
▲2.4
Allen & Overy
532
5* 4
213,080.6
Rank
-6 110.514.0
▼ 28.37
Market
Shimazaki Law Firm 48*3
5*
21
1 9
Australia International Bonds (BW1)
▲13.4
# of Deals per Advisor2017 Rank
Market
+1 +1.46,464.4
Visit http://dmi.thomsonreuters.com to view archives and order custom League Tables
Mayer Brown LLP 7* 8* 1 1.5 0 -0.2- 8170.0
1.5 -3Clifford ChanceHerbert Smith FreehillsFangda Partners -
Anderson Mori & TomotsuneAllen & Overy
3*5*
987.61,625.1
-▼
- 2 3.0 -3 1
6 2.1 -3 3.5 +1.8
TMI AssociatesZhong Lun Law Firm
7* - 1 1.57* 8* 1 1.5
-0
--
96.9209.0
10 0.2 -7 0.5 -0.3
-▼
Skadden
5* 5* 1 1.55* 5* 1 1.55* 1 1.55* - 1 1.55* 4 1 1.55* - 1 1.5
00--
-1-
▲▲--▼-
550.0299.8209.0
1,500.0995.0350.0
8 1.210 0.711 0.54 3.35 2.29 0.8
+0.7-0.4
--
-0.9-
▲▼--▼-
10

* tie * tie
▲
38.8
▼ -47.8% ▼% Change from Same Period Last Year
964.89.0 ▼
▲
5*6.1
Industry Total
Rank
+19
+52
2016 Rank Sh (%)Proceeds
10.46.34
▲ 153.4%
# of Deals
Nishimura & Asahi 3
▲
Proceeds per Advisor (US$m)MarketMarket
▲ 1Manager Legal Advisor
▲3,645.7
1,662.1Share Ch.
+5.63
▲1,000.8Nagashima Ohno & Tsunematsu▼ 2.9
6▼
1
-16.8
22.9 +18.9▲
7.8
+2
Jan 1 - Jun 30Samurai Bonds (JL6)
5.91
5* 4▲▲
8 +3 3
2017 Rank
# of Deals per Advisor
Deals Sh (%)Change in # of Market
Anderson Mori & Tomotsune1 2,634.7Share Ch.Deals # of Deals
10.8
2017 Rank
MarketRankSh (%) Sh (%)
3 -0.97.8+3+4 ▲8
15,921.0
39.0 -3.2▲
5
▲ 100.0
7
+1.2
-33.1%
First Half 2017 | Global Capital Markets | Legal Advisors
Japan Common Stock (JL1) Jan 1 - Jun 30
JAPAN CAPITAL MARKETS REVIEW
2016 Rank Proceeds
Proceeds per Advisor (US$m)Change in
Jan 1 - Jun 30Japan Common Stock (JL2)
Mori Hamada & Matsumoto
# of Deals per AdvisorMarket# of
Issuer Legal AdvisorMarket
216.6 +11.6
Anderson Mori & Tomotsune+84 11
9 1,433.2▲Nishimura & Asahi 3*
-1.3
15,921.0
% Change from Last Quarter
2
102 100.0 ▲
153.4%▼▲22.9%
-33.1%
100.0
% Change from Same Period Last Year 22.9%-47.8% ▼% Change from Last Quarter
Samurai Bonds (JL5)
Industry Total 102 100.0 +19
Jan 1 - Jun 30
424.4
8 1.2
0 - 6,208.2 1Nagashima Ohno & Tsunematsu 3* 1 8 7.8 ▼2.7 -0.4 ▼Sullivan & Cromwell 5* 5* 2 2.0 +1
▼ 597.7 6 3.8 -20.1Davis Polk & Wardwell 4* 2* 2 2.04* 4 2 2.0 0
-1
Skadden 6*
5.5 -0.5 ▼▼
- 881.3 5Simpson Thacher & Bartlett
405.1 7-6* 2* 1 1.0 -2 ▼ 273.4
2.5 +2.5 ▲1.7 -9.5 ▼
H M chan & Co
--
7* -1 1.0
1 1.07*
8Simpson Thacher & BartlettBaker & McKenzie - 1 1.0 -
2 22.4 +22.45* - 2 2.07* -
Davis Polk & Wardwell 1 1.0 ---
3,568.2189.3607.9
19.3
----
6 3.8 +3.89 0.1 +0.1
6*
Sullivan & CromwellSoga Law OfficeNorton Rose Fulbright
▲▲▲▲
Mori Hamada & Matsumoto
0- 1 1.0 -
6*6*
- 1 1.0 -
---
5* 1 1.0 3,171.419.319.3
2 19.9 +16.99* 0.1 +0.19* 0.1 +0.1
▲▲▲
* tie * tie
Visit http://dmi.thomsonreuters.com to view archives and order custom League Tables https://www.thomsonone.com
10.4 +10.4 ▲- 2 6.9 - - 987.6
- 104.8 6 1.1 +1.1 ▲King & Wood Mallesons 5* - 1 3.5 -
▲6,132.3 3,368.8
2 9Nagashima Ohno & Tsunematsu +3.21*▼1
# of Market Change in
1Deals
31.0Anderson Mori & Tomotsune 1Sh (%) Manager Legal AdvisorShare Ch.
1 20Issuer Legal Advisor
69.0 +3
# of Deals per Advisor Proceeds per Advisor (US$m)2017 Rank
2016 Rank
# of MarketMarketDeals Sh (%)
# of Deals per AdvisorMarket
64.3# of Deals
▲
2016 Rank
2017 Rank
-1
Change in Proceeds
+8
-7.3Sh (%)
9-12.4Proceeds
29
2Nishimura & Asahi 1*
▲ 0.9%
Proceeds per Advisor (US$m)
▲
31.06.9 - -
100.0
% Change from Last Quarter 23.1%
3*Anderson Mori & Tomotsune 3*
Sh (%)
76.1%
▲ 2,216.6 2+4▼ 1
Rank
3
% Change from Same Period Last Year 38.1% ▲
Industry Total
Share Ch.
% Change from Last Quarter
35.3
9,544.2▲
MarketMarket# of Deals
▲
100.0
23.2▼
▲
9,544.2
76.1%
2
Industry Total
23.1% ▲▲% Change from Same Period Last Year 38.1%
▲ 0.9%
Nagashima Ohno & Tsunematsu
Rank
- 4
▲ 100.0
13.8
29 100.0 +8
-
-3.5 -
- 1,521.8 ▲16.0 +16.0Clifford Chance 9.5 +9.5 - 2Baker & McKenzie
3 - 3 10.3 -4 - 2 6.9
--
902.5987.6
43
873.3 4 9.2 +9.2 ▲10.4 +10.4
▲▲
Baker & McKenzie
- 607.3 5Cleary Gottlieb Steen & Hamilton 5* - 1 6.4 +6.4 ▲
11

-
-
-
-
-
-
First Half 2017 | Global Capital Markets | Legal Advisors
Ranking Criteria Summary
Time periods for league tables will be based upon pricing/launch date.
All current data and previous year's data is as of 9:00am EST on July 14, 2017. Full credit is given to the issuer’s legal counsel andmanager’s legal counsel. All rankings exclude General Counsel. Rankings are accumulated based on number of transactions peradvisor. Rankings based on proceeds are available on product.
Tel: +632 459 1566E-mail: [email protected]
J
United States
Ian Willmott
If you would like to participate in the submission process, receive quarterly press releases, or have questions about our full league table criteria please contact:
High Yield is defined as securities with an S&P rating equal to or less than BB+ and a Moody’s rating equal to or less than Ba1. Securitiesnot rated by both agencies are assumed high yield with the exception of certain issuers (e.g., Federal Credit Agencies). Certificates ofDeposit, General Term Notes, and Split-junk rated securities (i.e., securities with an investment grade rating from one agency and a highyield rating from the other) are excluded Non-convertible preferred stock transactions are included
Standard league table exclusions: best efforts offerings, non-underwritten transactions and direct placements, rights offerings, transactionsthat mature or are callable/putable less than 360 days after settlement, CD's , Deposit Notes & Bank Notes, Federal Credit Agencytransactions (US Only), exchange offers, and offerings by closed-end funds/trusts.
Initial Public Offering league tables include only transactions where the common stock has never before traded publicly in any market.
Where applicable, all league tables include Rule 144a transactions. All league tables exclude pure private placements. Medium TermNotes programs are excluded but Medium Term Note takedowns are included. MTN takedowns from continuously offered retail programsare tracked but are not eligible for league table credit.
Salvatore ReresTel: +1 646 223 8455E-mail: [email protected]
Europe
E-mail: [email protected]: +44 (0) 207 542 4376
Asia-PacificCarina Causon-Israel
-
-
-
-
https://www.thomsonone.com
Canadian debt league tables include government debt consisting of federal, provincial, and municipal issues, corporate bonds, maples andself-funded issuance. League tables are denominated in Canadian dollars.
Federal Credit Agency issuance is excluded in all regional and global league table rankings.
E-mail: [email protected]
Canadian equity league tables include best efforts deals, private placements in public entities (PIPES), preferred shares and retailstructured products, self-funded issuance. League Tables are denominated in Canadian dollars.
JapanAki Sato
E-mail: [email protected]
Mortgage and asset-backed securities collateralizing first lien mortgages, home improvement loans, manufactured housing contracts,home equity lines of credit and second liens are subject to the classification rules detailed in the Rules for Categorizing Mortgage andAsset-backed Securities letter dated January 1, 2006.
yield rating from the other) are excluded. Non-convertible preferred stock transactions are included.
Tel: +1 416 687 7577
Tel: +813 6441 1120
CanadaGavin Penny
While Thomson Reuters has used reasonable endeavors to ensure that the information provided in this document is accurate and up to date as at the time of issue, neither Thomson Reuters nor its third partycontent providers shall be liable for any errors, inaccuracies or delays in the information, nor for any actions taken in reliance thereon, nor does it endorse any views or opinions of any third party contentprovider. Thomson Reuters disclaims all warranties, express or implied, as to the accuracy or completeness of any of the content provided, or as to the fitness of the content for any purpose to the extentpermitted by law. The content herein is not appropriate for the purposes of making a decision to carry out a transaction or trade and does not provide any form of advice (investment, tax, legal) amounting toinvestment advice, nor make any recommendations or solicitations regarding particular financial instruments, investments or products, including the buying or selling of securities. Thomson Reuters has notundertaken any liability or obligation relating to the purchase or sale of securities for or by any person in connection with this document.
© 2017 Thomson Reuters. All rights reserved.
Thomson Reuters and the Thomson Reuters logo are registered trademarks and trademarks of Thomson Reuters and its affiliated companies. Any third party name or mark herein belongs to the relevant thirdparty.
12
Thomson Reuters Solutions for the Deal Making Community
FOR STRATEGY AND PLANNING TEAMSFOR INFORMATION PROFESSIONALSSDC Platinum is the world’s foremost financial transactions database, covering new issues, M&A, syndicated loans, private equity, project finance, poison pills, and more.
Solution for:• Market Analysis & Trends (Geography, Sector, Asset Class, Deal Type, Deal Size, etc.)• Deal Origination (Debt Maturity Analysis, Company Lifecycle including Private Equity)• Pitch Creation (Firm Credentials, Representative Acquirors)• M&A Targeting (Active Strategic/Sponsor Acquirors, Target Company Screener)• Negotiation (T&C Benchmarking)
Thomson Reuters Deals Business Intelligence enables you to slice and dice our renowned Deals and Fees data to create ad hoc reports, analyze market trends, benchmark your performance and identify opportunities – all within a tool built into your workflow in Excel®, saving you valuable time and giving you a competitive edge.
Solution for:• Conducting market analysis and identifying trends• Benchmarking your performance and monitoring competitors• Targeting clients by wallet size and banking relationship• Allocating resources more effectively by evaluating and analyzing lost deals
FOR INVESTMENT BANKERS
evaluating and analyzing lost deals
Send us a sales enquiry at: financial.thomsonreuters.com/salesRead more about our products at: financial.thomsonreuters.com/products
To purchase individual Thomson reuters Deals or League Table reports, please contact our Thomson Reuters On Demand group:
Email: [email protected]
Access unique analysis for free anytime using Thomson Reuters Deals Intelligence website and receive regular updates, delivered direct to your inbox.
Go to: dmi.thomsonreuters.com/dealsintelligence
Thomson Reuters Eikon is the most intuitive and comprehensive way of staying informed. With natural-language search, you can quickly find global information,news, charts and analytics. Company and industry views provide top-level summaries, and then detailed information is just a click away. Identify new opportunities and gain deep understanding of markets, industries, companies and events.
Thomson Reuters Eikon also includes an Add-In for Microsoft® Office to help you increase your efficiency. From screening and targeting to comparables analysis, building league tables, valuing a company
and developing a client pitch book, you can do all this without leaving Microsoft Office. Search and autosuggest features in Excel make model-building easier.
Solution for:• Managing Client Relationships• Deal Origination• New Issues Pre-Marketing/Roadshows• Financial Modeling• Customized League Tables• Simple Deals screening• Valuation analysis and comparabledeal screening• On-brand pitch book creation
©2017 Thomson ReutersThomson Reuters and the Kinesis logo are trademarks of Thomson Reuters.
13