Global Investment Banking Review - Thomson...
11
FULL YEAR 2016 GLOBAL INVESTMENT BANKING REVIEW Reuters/Danish Ismail
-
Upload
truongxuyen -
Category
Documents
-
view
227 -
download
3
Transcript of Global Investment Banking Review - Thomson...

FULL YEAR 2016
GLOBAL INVESTMENT BANKING REVIEW
Reuters/Danish Ismail

JP Morgan Takes Top Spot for Global Investment Banking Fees; Top 10 Firms Register Combined Wallet Share Loss of 1.6 Points
JP Morgan topped the global investment banking league table during full year 2016 with US$5.8 billion in fees, or 6.8% of overall wallet-share. Goldman Sachs booked US$5.1 billion in fees during full year 2016 for second place, while Bank of America Merrill Lynch remained in third place from a year ago. The composition of the top ten banks remained largely unchanged, with UBS falling to 11th place, replaced by RBC Capital Markets in the 10th spot. Within the top 10, Bank of America Merrill Lynch and Deutsche Bank and Goldman Sachs saw the steepest wallet share declines with losses of 0.7 and 0.5 wallet share points, respectively.
GLOBAL INVESTMENT BANKING REVIEW
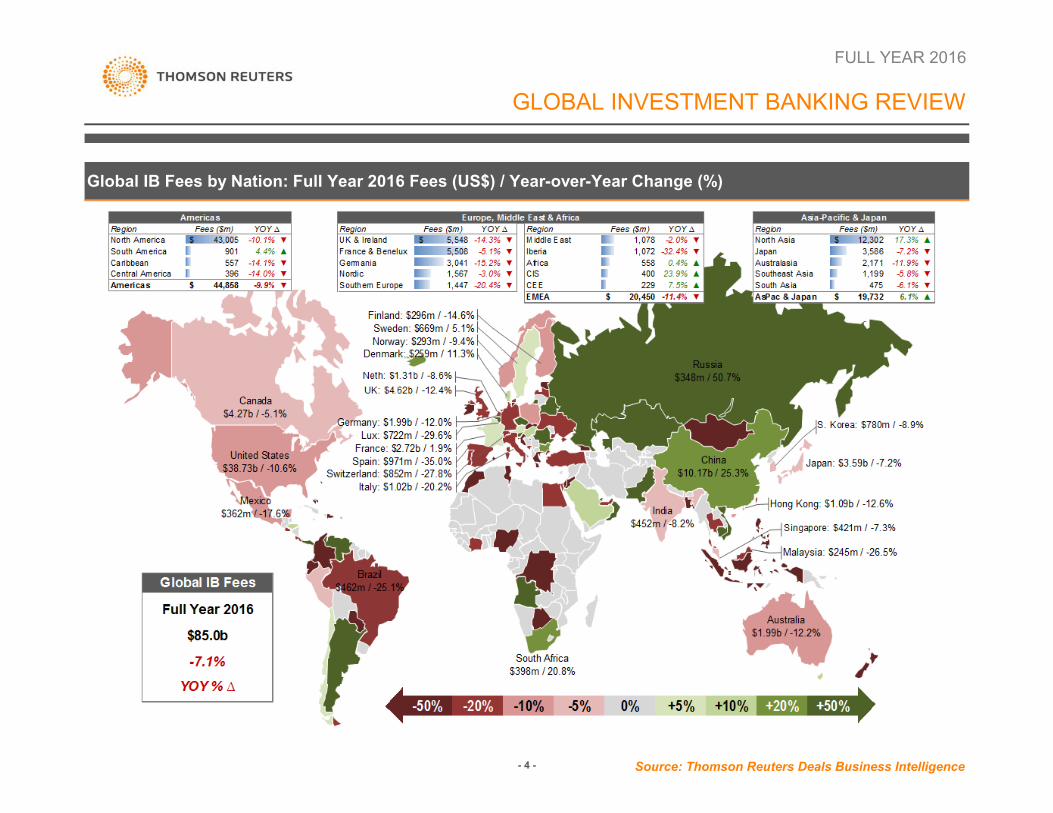
Fees for global Investment Banking services, from M&A advisory to capital markets underwriting, totaled US$85.0 billion during full year 2016, a 7% decrease over last year at this time and the slowest annual period for fees since 2013. Fees in the Americas totaled US$44.9 billion, down 10% compared to a year ago while fees in Europe decreased 12% and fees in Japan decreased 7%. Fees in Asia Pacific increased 10% compared to a year ago, while fees in Middle East/Africa decreased 3% compared to full year 2015 levels.
Global IB Fees Decline 7% l Slowest Annual Period for IB Fees since 2013 | Government & Agency Fees Up 29% l JP Morgan Takes Top Spot
FULL YEAR 2016
Global Investment Banking Fees Total US$85.0 billion; Slowest Annual Period for IB Fees since 2013; Europe Declines 12%
Government & Agency IB Fees Register 29% Increase; Healthcare and Retail Fees Post Steepest Declines
Investment banking activity in the financials, energy & power, industrials and technology sectors accounted for 58% of the global fee pool during full year 2016. JP Morgan topped the fee rankings in six sectors during the year, with double-digit wallet-share in the healthcare and telecom sectors. Fees from deal making in the government & agencies sector increased 29% compared to a year ago with JP Morgan commanding 4.5% of all fees booked in the sector during full year 2016. Healthcare and retail fees registered the steepest percentage declines this year down 34% and 24% respectively
Europe
Americas
Asia-Pacific
Japan
[email protected] Matsushima
Eddie Dunthorne
Ilya Hemlin
Janet Jin
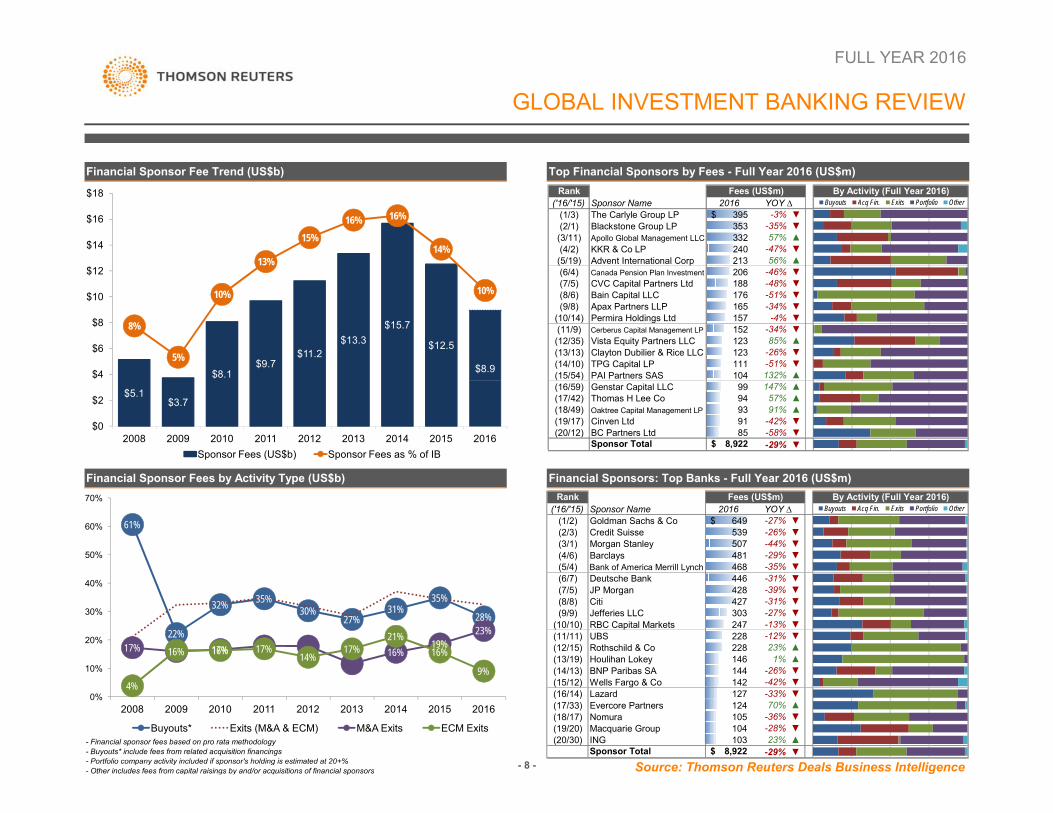
Financial Sponsor-related Fees Down 29%;Carlyle Group, Goldman Sachs Top Financial Sponsor Fee Rankings
IPOs Pull Equity Capital Markets Fees Down 23%; Debt Capital Markets Fees Up 6%, while M&A Fees Decline 3%
declines this year, down 34% and 24%, respectively. Investment banking fees generated by financial sponsors and their portfolio companies reached $8.9 billion during full year 2016, a decrease of 29% compared to 2015. Fees generated from leveraged buyouts accounted for 28% of financial sponsor-related fees during full year 2016, while ECM exits accounted for 9% and M&A exits comprised 23% of overall fees. The Carlyle Group and related entities generated $395 million in investment banking fees during the year, down 3% compared to 2015, while Goldman Sachs collected an industry-leading 7.3% of financial sponsor-related fees during full year 2016. Dragged down by a 30% decrease in fees from IPOs, equity capital markets underwriting fees totaled US$15.5 billion during full year 2016, down 23% from a year ago. Fees from debt capital markets underwriting totaled US$24.8 billion, up 6% compared to last year's tally and accounted for 29% of overall IB fees during full year 2016. M&A advisory fees totaled US$26.8 billion during the year, a decline of 3% compared to the same period last year, and accounted for 31% of the global fee pool, while fees from syndicated loans decreased 12% compared to 2015.
MEDIA CONTACT: CRITERIA SUMMARY:
All data is as of 9:00am EST on January 3, 2017 and sourced via Deals Business Intelligence
Volumes based on Thomson Reuters' industry-leading Deals content (M&A, Equity, Bonds and Loans) and Freeman Consulting's algorithm for imputing investment banking fees
Date periods referred to within based on the effective date for M&A, the issue date for Equity and Bonds and the closing date for Loans
Geographies and sectors are based on the nation of headquarters and macro industry of the deal participant's parent
Thomson Reuters Deals Intelligence, a part of Thomson Reuters' Investment Banking division, brings up to the minute market intelligence to our clients and the financial media through a variety of research reports including Daily Deals Insight, weekly Investment Banking Scorecard, monthly Deals Snapshots and our industry-leading quarterly reviews highlighting trends in M&A and Capital Markets.
- 2 - Source: Thomson Reuters Deals Business Intelligence

FULL YEAR 2016
GLOBAL INVESTMENT BANKING REVIEW
Global IB Fees by Region: Full Year 2016 (US$m)Global Investment Banking Fee Trend (US$b)
$66.4$69.9
$79.2 $76.1 $77.0$83.7
$96.3$91.5
$85.0
44,858.3$ fees-9.9% ▼
Americas -11.4% ▼20,449.7$ fees
EMEA
▲fees16,146.8$
9.6%
Asia-Pacific-7.2% ▼
3,585.6$ feesJapan
Global85,040.5$ fees
-7.1% ▼
3.1% CAGR 2008-2016
Global Quarterly Investment Banking Fees by Region (US$b)Global Investment Banking Fees by Product (US$b)
22%
27% 27%25%
31%28% 27% 26%
29%
15%
11%15%
20% 20%23% 23% 22% 21%
0%
5%
10%
15%
20%
25%
30%
35%
40%
45%
2008 2009 2010 2011 2012 2013 2014 2015 2016
Bonds Equity Loans M&A
2008 2009 2010 2011 2012 2013 2014 2015 2016
$0
$5
$10
$15
$20
$25
$30
$35
1 2 3 4 1 2 3 4 1 2 3 4 1 2 3 4 1 2 3 4 1 2 3 4 1 2 3 4 1 2 3 4 1 2 3 4 1 2 3 4 1 2 3 4 1 2 3
2005 2006 2007 2008 2009 2010 2011 2012 2013 2014 2015 2016
Japan (+69.3%)Asia-Pacific (+12.3%)EMEA (-2.6%)Americas (-7.9%)
YOY % ∆ 5.2% 13.4% -3.9% 1.1% 8.7% 15.1% -5.0% -7.1%
Q4 '16 vs. Q3 '16:Global (-0.6%)
- 3 - Source: Thomson Reuters Deals Business Intelligence
FULL YEAR 2016
GLOBAL INVESTMENT BANKING REVIEW
Global IB Fees by Nation: Full Year 2016 Fees (US$) / Year-over-Year Change (%)
- 4 - Source: Thomson Reuters Deals Business Intelligence

FULL YEAR 2016
GLOBAL INVESTMENT BANKING REVIEW
Global Investment Banking: Top Banks - Full Year 2016 (US$m)
Product Mix - Full Year 20162016 Bank Name 2016 2016
1 - = JP Morgan 5,791$ -4.7% ▼ 6.8% 0.2 ▲2 - = Goldman Sachs & Co 5,108 -14.6% ▼ 6.0% -0.5 ▼3 - = Bank of America Merrill Lynch 4,541 -17.8% ▼ 5.3% -0.7 ▼4 - = Morgan Stanley 4,488 -13.3% ▼ 5.3% -0.4 ▼5 - = Citi 3,906 -7.3% ▼ 4.6% 0.0 ▼6 1 ▲ Barclays 3,190 -2.0% ▼ 3.8% 0.2 ▲7 1 ▲ Credit Suisse 2,919 -7.9% ▼ 3.4% 0.0 ▼8 2 ▼ D t h B k 2 755 20 1% ▼ 3 2% 0 5 ▼
YOY ∆ YOY ∆YOY ∆Rank Fees (US$m) Share
Bonds Equity Loans M&A
8 -2 ▼ Deutsche Bank 2,755 -20.1% ▼ 3.2% -0.5 ▼9 - = Wells Fargo & Co 2,114 -6.0% ▼ 2.5% 0.0 ▲10 1 ▲ RBC Capital Markets 1,786 -4.0% ▼ 2.1% 0.1 ▲11 -1 ▼ UBS 1,580 -17.9% ▼ 1.9% -0.2 ▼12 - = HSBC Holdings PLC 1,483 -13.0% ▼ 1.7% -0.1 ▼13 1 ▲ Mizuho Financial Group 1,405 11.5% ▲ 1.7% 0.3 ▲14 -1 ▼ BNP Paribas SA 1,350 -14.8% ▼ 1.6% -0.1 ▼15 4 ▲ Lazard 1,081 13.5% ▲ 1.3% 0.2 ▲16 2 ▲ Sumitomo Mitsui Finl Grp Inc 975 -1.7% ▼ 1.1% 0.1 ▲17 3 ▲ Rothschild & Co 974 16.0% ▲ 1.1% 0.2 ▲18 -2 ▼ Jefferies LLC 968 -19.6% ▼ 1.1% -0.2 ▼19 -2 ▼ Mitsubishi UFJ Financial Group 964 -9.3% ▼ 1.1% 0.0 ▼20 -5 ▼ Nomura 938 -22.2% ▼ 1.1% -0.2 ▼21 - = BMO Capital Markets 737 -6.9% ▼ 0.9% 0.0 ▲22 6 ▲ Evercore Partners 717 29.9% ▲ 0.8% 0.2 ▲23 - = Societe Generale 706 -5.6% ▼ 0.8% 0.0 ▲24 -2 ▼ Credit Agricole CIB 697 -10.8% ▼ 0.8% 0.0 ▼25 1 ▲ Industrial & Comm Bank China 668 13.6% ▲ 0.8% 0.1 ▲
Global Total 85,040$ -7.1% ▼
Source: Thomson Reuters Deals Business Intelligence- 5 -

FULL YEAR 2016
GLOBAL INVESTMENT BANKING REVIEW
Global Investment Banking: Top Banks by Product/Region/Sector - Full Year 2016 (US$m)
2016 2015 Top 5 Bank #1 Bank #2 Bank #3 Bank #4 Bank #5Global IB 85,040.5$ 91,490.6$ -7.1% ▼ 28.0% JPM (6.8%) GS (6.0%) BOAML (5.3%) MS (5.3%) CITI (4.6%)
Americas 44,858.3$ 49,810.0$ -9.9% ▼ 36.8% JPM (9.4%) GS (7.8%) BOAML (7.7%) MS (6.0%) CITI (5.8%)Europe 18,796.6 21,377.4 -12.1% ▼ 23.4% JPM (5.6%) GS (5.3%) MS (4.5%) BNPP (4.1%) DB (4.0%)Asia-Pacific 16,146.8 14,735.5 9.6% ▲ 15.3% ICBC (3.6%) CITIC (3.0%) MS (3.0%) GS (2.9%) BofCH (2.9%)Japan 3,585.6 3,862.6 -7.2% ▼ 67.4% MIZUHO (20.1%) NOMURA (14.9%) SMFG (13.8%) MS (11.7%) DAIWA (7.0%)MEA 1,653.1 1,705.0 -3.0% ▼ 25.2% BARC (6.4%) CITI (5.7%) HSBC (4.8%) JPM (4.7%) BOAML (3.5%)
M&A 26,783.9$ 27,633.8$ -3.1% ▼ 31.7% GS (9.3%) MS (7.7%) JPM (7.0%) LAZ (4.0%) n/aBonds 24 806 4 23 511 1 5 5% ▲ 28 7% JPM (6 7%) BOAML (6 4%) CITI (5 9%) GS (4 8%) MS (4 8%)
Top 5 Banks by Fees & Share - Full Year 2016YOY ∆
IB Fees (US$m)
By
Reg
ion
t Bonds 24,806.4 23,511.1 5.5% ▲ 28.7% JPM (6.7%) BOAML (6.4%) CITI (5.9%) GS (4.8%) MS (4.8%)Loans 17,979.7 20,337.9 -11.6% ▼ 26.0% BOAML (7.0%) JPM (6.3%) CITI (4.4%) BARC (4.2%) DB (4.1%)Equity 15,470.4 20,007.9 -22.7% ▼ 27.6% JPM (7.2%) MS (5.8%) GS (5.2%) BOAML (4.8%) CITI (4.5%) Follow-On 9,850.3 11,983.1 -17.8% ▼ 26.9% JPM (7.2%) MS (5.4%) BOAML (5.4%) GS (5.0%) CITI (4.0%) IPO 4,299.0 6,158.5 -30.2% ▼ 25.4% MS (6.2%) JPM (5.5%) GS (5.3%) CITI (4.8%) CS (3.6%) Convertible 1,321.1 1,866.3 -29.2% ▼ 41.2% JPM (13.0%) MS (7.7%) GS (7.1%) CITI (7.0%) BOAML (6.3%)
Financials 23,381.3$ 27,227.5$ -14.1% ▼ 27.5% MS (5.9%) GS (5.8%) JPM (5.6%) CITI (5.1%) BOAML (5.1%)Energy & Power 10,443.1 9,491.1 10.0% ▲ 26.3% JPM (6.8%) GS (6.0%) BARC (4.8%) MS (4.4%) CITI (4.4%)Industrials 8,278.9 9,376.7 -11.7% ▼ 22.9% JPM (5.4%) GS (5.1%) BOAML (4.5%) MS (4.1%) CITI (3.9%)High Tech 7,574.6 6,807.7 11.3% ▲ 38.9% JPM (10.8%) GS (8.6%) MS (7.8%) BOAML (7.1%) BARC (4.5%)Materials 5,499.1 5,703.3 -3.6% ▼ 26.2% GS (6.1%) CITI (6.0%) JPM (4.9%) BARC (4.6%) MS (4.5%)Healthcare 5,498.5 8,348.5 -34.1% ▼ 35.9% JPM (11.1%) GS (6.8%) BOAML (6.4%) MS (5.9%) CITI (5.7%)Real Estate 4,502.9 4,925.9 -8.6% ▼ 26.3% BOAML (6.2%) MS (5.7%) JPM (5.5%) WF (4.7%) CITI (4.2%)Consumer Products 4,023.7 4,024.0 0.0% ▼ 30.6% BOAML (7.1%) JPM (6.8%) GS (6.4%) MS (5.7%) BARC (4.6%)Consumer Staples 3,912.9 3,165.2 23.6% ▲ 29.3% BOAML (7.2%) GS (6.3%) JPM (6.2%) LAZ (5.2%) DB (4.4%)Media & Ent 3,567.7 3,358.9 6.2% ▲ 33.2% GS (7.8%) DB (7.2%) JPM (6.8%) BOAML (6.4%) MS (4.9%)Govt & Agencies 3,542.8 2,749.7 28.8% ▲ 18.4% JPM (4.5%) CITI (4.1%) HSBC (3.7%) BOAML (3.3%) SMFG (2.8%)Retail 2,512.4 3,324.7 -24.4% ▼ 30.2% BOAML (7.4%) JPM (7.4%) GS (6.9%) WF (4.4%) CITI (4.2%)Telecom 2,302.6 2,987.6 -22.9% ▼ 35.6% JPM (11.5%) MS (6.8%) GS (6.5%) BOAML (5.6%) MIZUHO (5.2%)
*IB fees based on the period from January 01 through December 30
By
Prod
uct
By
Sect
or
- 6 - Source: Thomson Reuters Deals Business Intelligence

Global Investment Banking: Top Corporate Fee Payers (US$m)
GLOBAL INVESTMENT BANKING REVIEW
FULL YEAR 2016
IB Fees By Product (2014-2016*)Company Name Avg Ann'l 2014 2015 2016* Top 3 Bank #1 Bank #2 Bank #3GE 337$ 268$ 471$ 271$ 41.1% JPM (19.4%) CITI (12.0%) GS (9.7%)Charter Communications Inc 266 49 491 256 59.9% GS (25.3%) BOAML (19.3%) CS (15.3%)Anheuser-Busch Inbev SA/NV 251 52 234 466 35.5% LAZ (17.5%) DB (10.3%) BOAML (7.6%)Actavis PLC 206 196 421 - 54.3% JPM (27.3%) MIZUHO (16.6%) WF (10.4%)Denali Holding Inc 189 2 22 544 39.4% CITI (13.3%) JPM (13.1%) BARC (13.0%)Altice SA 183 359 189 - 42.1% JPM (18.8%) MS (13.3%) GS (10.0%)Toyota Motor Corp 176 112 274 143 64.6% NOMURA (47.3%) MUFJ (9.6%) SMFG (7.7%)Banco Santander SA 165 208 191 95 37.8% GS (17.8%) UBS (11.5%) CITI (8.5%)AT&T Inc 156 94 208 166 31 3% JPM (12 5%) LAZ (10 8%) MIZUHO (7 9%)
IB Fees - All Products (US$m) Top 3 Banks & Share (2014-2016*)Bonds Equity Loans M&A
AT&T Inc 156 94 208 166 31.3% JPM (12.5%) LAZ (10.8%) MIZUHO (7.9%)JPMorgan Chase & Co 154 195 187 79 35.9% MS (15.2%) CITI (10.8%) WF (9.9%)Western Digital Corp 146 21 - 416 42.7% BOAML (16.7%) JPM (16.2%) CS (9.8%)Monte dei Paschi di Siena SpA 142 300 123 2 34.3% UBS (12.7%) MEDIO (10.9%) GS (10.6%)Teva Pharmaceutical Industries 141 2 237 185 38.6% BARC (16.1%) GREENHILL (12.3%) CITI (10.2%)China Railway Corp 139 197 161 59 35.9% BofCH (16.5%) CITIC (9.9%) GUOTAI (9.5%)Alibaba Group Holding Ltd 133 343 14 42 48.1% MS (18.1%) GS (15.7%) DB (14.4%)HFSF 126 297 70 11 34.3% UBS (13.8%) MEDIO (10.2%) CS (10.2%)SunEdison Inc 122 84 262 21 47.0% BARC (17.9%) MS (15.0%) GS (14.2%)Verizon Communications Inc 122 209 60 96 40.7% JPM (16.8%) GUGG (14.1%) MS (9.8%)TransCanada Corp 121 31 30 303 42.2% RBC (14.4%) TD (14.2%) WF (13.6%)Bayer AG 120 118 33 208 28.2% BOAML (13.7%) CS (8.0%) JPM (6.6%)Cheniere Energy Inc 119 34 238 85 22.0% SG (8.6%) MUFJ (7.3%) MIZUHO (6.1%)Royal Dutch Shell PLC 118 102 71 181 32.2% BARC (13.8%) LAZ (10.9%) EVRC (7.5%)Deutsche Bank AG 115 264 57 25 22.1% JPM (7.5%) CMZ (7.4%) UCG (7.1%)Next Alt SARL 114 - 210 132 44.0% JPM (18.8%) BNPP (13.7%) BARC (11.5%)Citigroup Inc 114 167 78 95 20.0% GS (8.8%) WF (5.9%) BARC (5.3%)
Top 25 Fee Payers 3,976 3,705 4,333 3,880 23.0% JPM (9.1%) GS (7.3%) BOAML (6.7%)All Others 67,896 77,726 74,247 51,529 21.4% JPM (7.8%) GS (7.0%) BOAML (6.7%)
Global Total 71,872$ 81,430$ 78,580$ 55,409$ 18.9% JPM (6.9%) GS (6.1%) BOAML (5.9%)
Notes:
* 2016 volumes through December 30 - Excludes Governments & Agencies, Government Sponsored Enterprises and self funded/advisory fees
- 7 - Source: Thomson Reuters Deals Business Intelligence
FULL YEAR 2016
GLOBAL INVESTMENT BANKING REVIEW
Financial Sponsor Fee Trend (US$b) Top Financial Sponsors by Fees - Full Year 2016 (US$m)
$8.1$9.7
$11.2$13.3
$15.7
$12.5
$8.9
8%
5%
10%
13%
15%16% 16%
14%
10%
4%
6%
8%
10%
12%
14%
16%
18%
$4
$6
$8
$10
$12
$14
$16
$18 Rank By Activity (Full Year 2016)('16/'15) Sponsor Name 2016
(1/3) The Carlyle Group LP 395$ -3% ▼(2/1) Blackstone Group LP 353 -35% ▼
(3/11) Apollo Global Management LLC 332 57% ▲(4/2) KKR & Co LP 240 -47% ▼
(5/19) Advent International Corp 213 56% ▲(6/4) Canada Pension Plan Investment 206 -46% ▼(7/5) CVC Capital Partners Ltd 188 -48% ▼(8/6) Bain Capital LLC 176 -51% ▼(9/8) Apax Partners LLP 165 -34% ▼
(10/14) Permira Holdings Ltd 157 -4% ▼(11/9) Cerberus Capital Management LP 152 -34% ▼(12/35) Vista Equity Partners LLC 123 85% ▲(13/13) Clayton Dubilier & Rice LLC 123 -26% ▼(14/10) TPG Capital LP 111 -51% ▼(15/54) PAI Partners SAS 104 132% ▲
Fees (US$m)YOY ∆ Buyouts Acq Fin. Exits Portfolio Other
Financial Sponsor Fees by Activity Type (US$b) Financial Sponsors: Top Banks - Full Year 2016 (US$m)
- Financial sponsor fees based on pro rata methodology- Buyouts* include fees from related acquisition financings
Portfolio company activity included if sponsor's holding is estimated at 20+%
$5.1$3.7
0%
2%
$0
$2
2008 2009 2010 2011 2012 2013 2014 2015 2016Sponsor Fees (US$b) Sponsor Fees as % of IB
61%
22%
32% 35%30%
27%31%
35%
28%
17% 16% 17% 16%19%
23%
4%
16% 17%14%
17%21%
16%
9%
0%
10%
20%
30%
40%
50%
60%
70%
2008 2009 2010 2011 2012 2013 2014 2015 2016
Buyouts* Exits (M&A & ECM) M&A Exits ECM Exits
( )(16/59) Genstar Capital LLC 99 147% ▲(17/42) Thomas H Lee Co 94 57% ▲(18/49) Oaktree Capital Management LP 93 91% ▲(19/17) Cinven Ltd 91 -42% ▼(20/12) BC Partners Ltd 85 -58% ▼
Sponsor Total 8,922$ -29% ▼
Rank By Activity (Full Year 2016)('16/'15) Sponsor Name 2016
(1/2) Goldman Sachs & Co 649$ -27% ▼(2/3) Credit Suisse 539 -26% ▼(3/1) Morgan Stanley 507 -44% ▼(4/6) Barclays 481 -29% ▼(5/4) Bank of America Merrill Lynch 468 -35% ▼(6/7) Deutsche Bank 446 -31% ▼(7/5) JP Morgan 428 -39% ▼(8/8) Citi 427 -31% ▼(9/9) Jefferies LLC 303 -27% ▼
(10/10) RBC Capital Markets 247 -13% ▼(11/11) UBS 228 -12% ▼(12/15) Rothschild & Co 228 23% ▲(13/19) Houlihan Lokey 146 1% ▲(14/13) BNP Paribas SA 144 -26% ▼(15/12) Wells Fargo & Co 142 -42% ▼(16/14) Lazard 127 -33% ▼(17/33) Evercore Partners 124 70% ▲(18/17) Nomura 105 -36% ▼(19/20) Macquarie Group 104 -28% ▼(20/30) ING 103 23% ▲
Sponsor Total 8,922$ -29% ▼
Fees (US$m)YOY ∆ Buyouts Acq Fin. Exits Portfolio Other
- Portfolio company activity included if sponsor s holding is estimated at 20+%- Other includes fees from capital raisings by and/or acquisitions of financial sponsors - 8 - Source: Thomson Reuters Deals Business Intelligence

GLOBAL INVESTMENT BANKING REVIEW
Global Investment Banking: Top Banks by Product (US$m)
FULL YEAR 2016
Client Mix by Region Client Mix by Region2016 Bank Name 2016 2016 2016 Bank Name 2016 2016
1 - = Goldman Sachs & Co 2,499$ -14% ▼ 9.3% -1.2 ▼ 1 - = JP Morgan 1,116$ -12% ▼ 7.2% 0.9 ▲2 - = Morgan Stanley 2,076 1% ▲ 7.7% 0.3 ▲ 2 2 ▲ Morgan Stanley 905 -32% ▼ 5.8% -0.8 ▼3 - = JP Morgan 1,872 3% ▲ 7.0% 0.4 ▲ 3 2 ▲ Goldman Sachs & Co 809 -37% ▼ 5.2% -1.2 ▼4 2 ▲ Lazard 1,079 15% ▲ 4.0% 0.6 ▲ 4 -2 ▼ Bank of America Merrill Lynch 742 -28% ▼ 4.8% -0.4 ▼5 3 ▲ Rothschild & Co 973 16% ▲ 3.6% 0.6 ▲ 5 -2 ▼ Citi 691 -19% ▼ 4.5% 0.2 ▲6 -2 ▼ Bank of America Merrill Lynch 962 -30% ▼ 3.6% -1.4 ▼ 6 3 ▲ Credit Suisse 581 -26% ▼ 3.8% -0.1 ▼7 -2 ▼ Citi 950 -11% ▼ 3.5% -0.3 ▼ 7 -1 ▼ Deutsche Bank 437 -42% ▼ 2.8% -0.9 ▼8 1 ▲ Barclays 923 17% ▲ 3.4% 0.6 ▲ 8 -1 ▼ Barclays 398 -34% ▼ 2.6% -0.4 ▼9 -2 ▼ Credit Suisse 878 -5% ▼ 3.3% -0.1 ▼ 9 4 ▲ UBS 385 -45% ▼ 2.5% -1.0 ▼10 3 ▲ Evercore Partners 686 35% ▲ 2.6% 0.7 ▲ 10 1 ▲ RBC Capital Markets 330 -19% ▼ 2.1% 0.1 ▲11 -1 ▼ Deutsche Bank 587 -19% ▼ 2.2% -0.4 ▼ 11 6 ▲ Nomura 296 -50% ▼ 1.9% -1.0 ▼12 -1 ▼ Centerview Partners LLC 559 8% ▲ 2.1% 0.2 ▲ 12 17 ▲ CITIC 289 5% ▲ 1.9% 0.5 ▲
Global M&A: Top Banks - Full Year 2016 (US$m) Global Equity: Top Banks - Full Year 2016 (US$m)
YOY ∆Rank Fees Share Rank Fees Share
YOY ∆ YOY ∆ YOY ∆ YOY ∆ YOY ∆Americas EMEA Asia-Pacific Japan Americas EMEA Asia-Pacific Japan
13 -1 ▼ UBS 550 8% ▲ 2.1% 0.2 ▲ 13 -5 ▼ Wells Fargo & Co 250 -14% ▼ 1.6% 0.2 ▲14 - = Houlihan Lokey 530 5% ▲ 2.0% 0.2 ▲ 14 - = Mizuho Financial Group 218 -20% ▼ 1.4% 0.0 ▲15 - = Jefferies LLC 529 8% ▲ 2.0% 0.2 ▲ 15 13 ▲ BMO Capital Markets 214 2% ▲ 1.4% 0.3 ▲16 - = Moelis & Co 457 11% ▲ 1.7% 0.2 ▲ 16 8 ▲ Jefferies LLC 202 -39% ▼ 1.3% -0.3 ▼17 - = RBC Capital Markets 439 15% ▲ 1.6% 0.3 ▲ 17 4 ▲ TD Securities Inc 198 27% ▲ 1.3% 0.5 ▲18 3 ▲ Wells Fargo & Co 277 23% ▲ 1.0% 0.2 ▲ 18 18 ▲ China Securities Co Ltd 174 35% ▲ 1.1% 0.5 ▲19 14 ▲ Greenhill & Co, LLC 256 73% ▲ 1.0% 0.4 ▲ 19 66 ▲ GF Securities 167 53% ▲ 1.1% 0.5 ▲20 -1 ▼ BNP Paribas SA 255 -14% ▼ 1.0% -0.1 ▼ 20 2 ▲ Scotiabank 160 5% ▲ 1.0% 0.3 ▲
M&A Total 26,784$ -3% ▼ Equity Total 15,470$ -23% ▼
Client Mix by Region Client Mix by Region2016 Bank Name 2016 2016 2016 Bank Name 2016 2016
1 - = JP Morgan 1,673$ -8% ▼ 6.7% -1.0 ▼ 1 - = Bank of America Merrill Lynch 1,254$ -16% ▼ 7.0% -0.4 ▼2 - = Bank of America Merrill Lynch 1,584 -3% ▼ 6.4% -0.5 ▼ 2 - = JP Morgan 1,130 -4% ▼ 6.3% 0.5 ▲3 - = Citi 1,470 1% ▲ 5.9% -0.2 ▼ 3 1 ▲ Citi 795 -6% ▼ 4.4% 0.3 ▲4 1 ▲ Goldman Sachs & Co 1,194 -1% ▼ 4.8% -0.3 ▼ 4 2 ▲ Barclays 753 -1% ▼ 4.2% 0.5 ▲5 -1 ▼ Morgan Stanley 1,186 -9% ▼ 4.8% -0.8 ▼ 5 -2 ▼ Deutsche Bank 746 -13% ▼ 4.1% 0.0 ▼6 1 ▲ Barclays 1,116 1% ▲ 4.5% -0.2 ▼ 6 -1 ▼ Wells Fargo & Co 654 -16% ▼ 3.6% -0.2 ▼7 -1 ▼ Deutsche Bank 985 -12% ▼ 4.0% -0.8 ▼ 7 4 ▲ Credit Suisse 645 25% ▲ 3.6% 1.0 ▲8 - = Wells Fargo & Co 933 -2% ▼ 3.8% -0.3 ▼ 8 - = Goldman Sachs & Co 605 3% ▲ 3.4% 0.5 ▲9 - = Credit Suisse 816 -14% ▼ 3.3% -0.8 ▼ 9 -2 ▼ Mitsubishi UFJ Financial Group 577 -19% ▼ 3.2% -0.3 ▼10 - = HSBC Holdings PLC 746 5% ▲ 3.0% 0.0 ▼ 10 4 ▲ Mizuho Financial Group 487 6% ▲ 2.7% 0.5 ▲11 - = RBC Capital Markets 581 5% ▲ 2.3% 0.0 ▼ 11 -2 ▼ BNP Paribas SA 436 -23% ▼ 2.4% -0.4 ▼12 2 ▲ Mizuho Financial Group 556 36% ▲ 2.2% 0.5 ▲ 12 - = RBC Capital Markets 436 -16% ▼ 2.4% -0.1 ▼13 -1 ▼ BNP Paribas SA 536 2% ▲ 2.2% -0.1 ▼ 13 -3 ▼ HSBC Holdings PLC 435 -22% ▼ 2.4% -0.3 ▼14 -1 ▼ UBS 446 -3% ▼ 1.8% -0.2 ▼ 14 1 ▲ Sumitomo Mitsui Finl Grp Inc 422 -1% ▼ 2.3% 0.3 ▲15 2 ▲ Nomura 341 21% ▲ 1.4% 0.2 ▲ 15 -2 ▼ Morgan Stanley 321 -33% ▼ 1.8% -0.6 ▼16 -1 ▼ Mitsubishi UFJ Financial Group 339 11% ▲ 1.4% 0.1 ▲ 16 3 ▲ Industrial & Comm Bank China 319 9% ▲ 1.8% 0.3 ▲17 3 ▲ Sumitomo Mitsui Finl Grp Inc 327 41% ▲ 1.3% 0.3 ▲ 17 - = ING 319 -16% ▼ 1.8% -0.1 ▼18 3 ▲ TD Securities Inc 287 26% ▲ 1.2% 0.2 ▲ 18 -2 ▼ Credit Agricole CIB 297 -24% ▼ 1.6% -0.3 ▼19 -1 ▼ Societe Generale 272 5% ▲ 1.1% 0.0 ▼ 19 -1 ▼ Societe Generale 279 -7% ▼ 1.6% 0.1 ▲20 -4 ▼ Credit Agricole CIB 264 -7% ▼ 1.1% -0.1 ▼ 20 1 ▲ Bank of China Ltd 278 7% ▲ 1.5% 0.3 ▲
Bonds Total 24,806$ 6% ▲ Loans Total 17,980$ -12% ▼
YOY ∆Rank Fees Share Rank Fees Share
YOY ∆ YOY ∆ YOY ∆ YOY ∆ YOY ∆
Global Bonds: Top Banks - Full Year 2016 (US$m) Global Loans: Top Banks - Full Year 2016 (US$m)
Americas EMEA Asia-Pacific Japan Americas EMEA Asia-Pacific Japan
Source: Thomson Reuters Deals Business Intelligence- 9 -
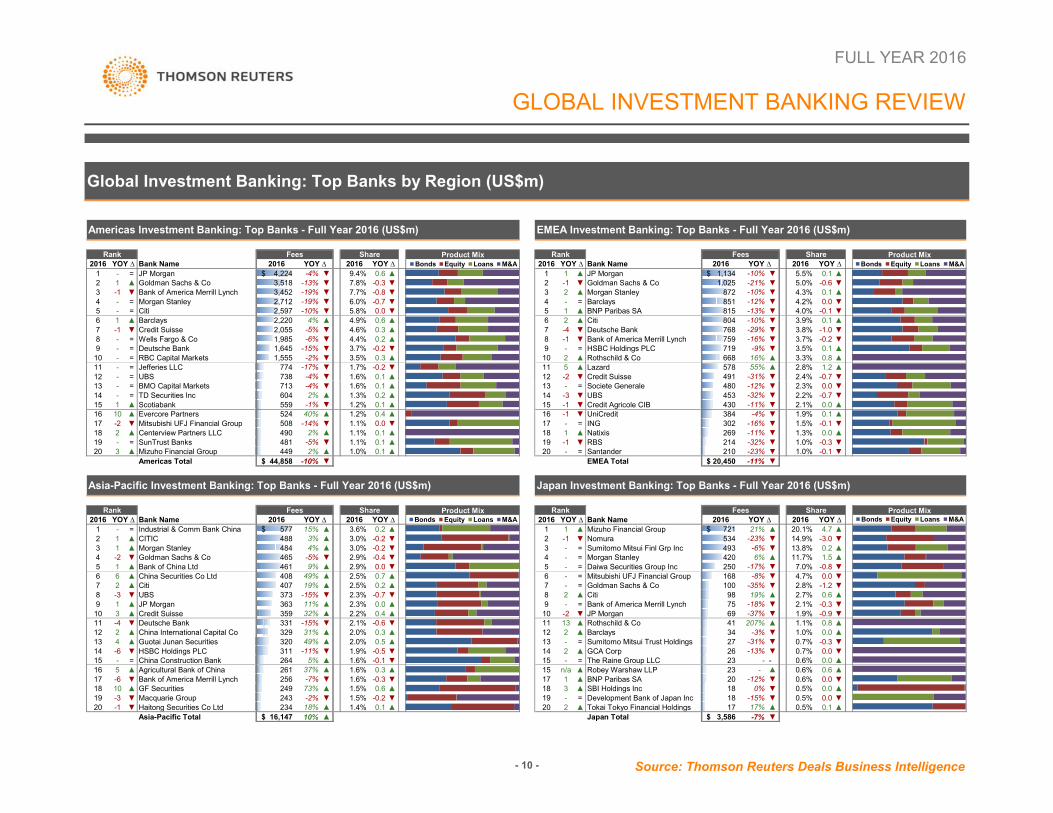
Global Investment Banking: Top Banks by Region (US$m)
FULL YEAR 2016
GLOBAL INVESTMENT BANKING REVIEW
Product Mix Product Mix2016 Bank Name 2016 2016 2016 Bank Name 2016 2016
1 - = JP Morgan 4,224$ -4% ▼ 9.4% 0.6 ▲ 1 1 ▲ JP Morgan 1,134$ -10% ▼ 5.5% 0.1 ▲2 1 ▲ Goldman Sachs & Co 3,518 -13% ▼ 7.8% -0.3 ▼ 2 -1 ▼ Goldman Sachs & Co 1,025 -21% ▼ 5.0% -0.6 ▼3 -1 ▼ Bank of America Merrill Lynch 3,452 -19% ▼ 7.7% -0.8 ▼ 3 2 ▲ Morgan Stanley 872 -10% ▼ 4.3% 0.1 ▲4 - = Morgan Stanley 2,712 -19% ▼ 6.0% -0.7 ▼ 4 - = Barclays 851 -12% ▼ 4.2% 0.0 ▼5 - = Citi 2,597 -10% ▼ 5.8% 0.0 ▼ 5 1 ▲ BNP Paribas SA 815 -13% ▼ 4.0% -0.1 ▼6 1 ▲ Barclays 2,220 4% ▲ 4.9% 0.6 ▲ 6 2 ▲ Citi 804 -10% ▼ 3.9% 0.1 ▲7 -1 ▼ Credit Suisse 2,055 -5% ▼ 4.6% 0.3 ▲ 7 -4 ▼ Deutsche Bank 768 -29% ▼ 3.8% -1.0 ▼8 - = Wells Fargo & Co 1,985 -6% ▼ 4.4% 0.2 ▲ 8 -1 ▼ Bank of America Merrill Lynch 759 -16% ▼ 3.7% -0.2 ▼9 - = Deutsche Bank 1,645 -15% ▼ 3.7% -0.2 ▼ 9 - = HSBC Holdings PLC 719 -9% ▼ 3.5% 0.1 ▲10 - = RBC Capital Markets 1,555 -2% ▼ 3.5% 0.3 ▲ 10 2 ▲ Rothschild & Co 668 16% ▲ 3.3% 0.8 ▲11 - = Jefferies LLC 774 -17% ▼ 1.7% -0.2 ▼ 11 5 ▲ Lazard 578 55% ▲ 2.8% 1.2 ▲12 - = UBS 738 -4% ▼ 1.6% 0.1 ▲ 12 -2 ▼ Credit Suisse 491 -31% ▼ 2.4% -0.7 ▼
Americas Investment Banking: Top Banks - Full Year 2016 (US$m) EMEA Investment Banking: Top Banks - Full Year 2016 (US$m)
YOY ∆Rank Fees Share Rank Fees Share
YOY ∆ YOY ∆ YOY ∆ YOY ∆ YOY ∆Bonds Equity Loans M&A Bonds Equity Loans M&A
13 - = BMO Capital Markets 713 -4% ▼ 1.6% 0.1 ▲ 13 - = Societe Generale 480 -12% ▼ 2.3% 0.0 ▼14 - = TD Securities Inc 604 2% ▲ 1.3% 0.2 ▲ 14 -3 ▼ UBS 453 -32% ▼ 2.2% -0.7 ▼15 1 ▲ Scotiabank 559 -1% ▼ 1.2% 0.1 ▲ 15 -1 ▼ Credit Agricole CIB 430 -11% ▼ 2.1% 0.0 ▲16 10 ▲ Evercore Partners 524 40% ▲ 1.2% 0.4 ▲ 16 -1 ▼ UniCredit 384 -4% ▼ 1.9% 0.1 ▲17 -2 ▼ Mitsubishi UFJ Financial Group 508 -14% ▼ 1.1% 0.0 ▼ 17 - = ING 302 -16% ▼ 1.5% -0.1 ▼18 2 ▲ Centerview Partners LLC 490 2% ▲ 1.1% 0.1 ▲ 18 1 ▲ Natixis 269 -11% ▼ 1.3% 0.0 ▲19 - = SunTrust Banks 481 -5% ▼ 1.1% 0.1 ▲ 19 -1 ▼ RBS 214 -32% ▼ 1.0% -0.3 ▼20 3 ▲ Mizuho Financial Group 449 2% ▲ 1.0% 0.1 ▲ 20 - = Santander 210 -23% ▼ 1.0% -0.1 ▼
Americas Total 44,858$ -10% ▼ EMEA Total 20,450$ -11% ▼
Product Mix Product Mix2016 Bank Name 2016 2016 2016 Bank Name 2016 2016
1 - = Industrial & Comm Bank China 577$ 15% ▲ 3.6% 0.2 ▲ 1 1 ▲ Mizuho Financial Group 721$ 21% ▲ 20.1% 4.7 ▲2 1 ▲ CITIC 488 3% ▲ 3.0% -0.2 ▼ 2 -1 ▼ Nomura 534 -23% ▼ 14.9% -3.0 ▼3 1 ▲ Morgan Stanley 484 4% ▲ 3.0% -0.2 ▼ 3 - = Sumitomo Mitsui Finl Grp Inc 493 -6% ▼ 13.8% 0.2 ▲4 -2 ▼ Goldman Sachs & Co 465 -5% ▼ 2.9% -0.4 ▼ 4 - = Morgan Stanley 420 6% ▲ 11.7% 1.5 ▲5 1 ▲ Bank of China Ltd 461 9% ▲ 2.9% 0.0 ▼ 5 - = Daiwa Securities Group Inc 250 -17% ▼ 7.0% -0.8 ▼6 6 ▲ China Securities Co Ltd 408 49% ▲ 2.5% 0.7 ▲ 6 - = Mitsubishi UFJ Financial Group 168 -8% ▼ 4.7% 0.0 ▼7 2 ▲ Citi 407 19% ▲ 2.5% 0.2 ▲ 7 - = Goldman Sachs & Co 100 -35% ▼ 2.8% -1.2 ▼8 -3 ▼ UBS 373 -15% ▼ 2.3% -0.7 ▼ 8 2 ▲ Citi 98 19% ▲ 2.7% 0.6 ▲9 1 ▲ JP Morgan 363 11% ▲ 2.3% 0.0 ▲ 9 - = Bank of America Merrill Lynch 75 -18% ▼ 2.1% -0.3 ▼10 3 ▲ Credit Suisse 359 32% ▲ 2.2% 0.4 ▲ 10 -2 ▼ JP Morgan 69 -37% ▼ 1.9% -0.9 ▼11 -4 ▼ Deutsche Bank 331 -15% ▼ 2.1% -0.6 ▼ 11 13 ▲ Rothschild & Co 41 207% ▲ 1.1% 0.8 ▲12 2 ▲ China International Capital Co 329 31% ▲ 2.0% 0.3 ▲ 12 2 ▲ Barclays 34 -3% ▼ 1.0% 0.0 ▲13 4 ▲ Guotai Junan Securities 320 49% ▲ 2.0% 0.5 ▲ 13 - = Sumitomo Mitsui Trust Holdings 27 -31% ▼ 0.7% -0.3 ▼14 -6 ▼ HSBC Holdings PLC 311 -11% ▼ 1.9% -0.5 ▼ 14 2 ▲ GCA Corp 26 -13% ▼ 0.7% 0.0 ▼15 - = China Construction Bank 264 5% ▲ 1.6% -0.1 ▼ 15 - = The Raine Group LLC 23 - - 0.6% 0.0 ▲16 5 ▲ Agricultural Bank of China 261 37% ▲ 1.6% 0.3 ▲ 15 n/a ▲ Robey Warshaw LLP 23 - ▲ 0.6% 0.6 ▲17 -6 ▼ Bank of America Merrill Lynch 256 -7% ▼ 1.6% -0.3 ▼ 17 1 ▲ BNP Paribas SA 20 -12% ▼ 0.6% 0.0 ▼18 10 ▲ GF Securities 249 73% ▲ 1.5% 0.6 ▲ 18 3 ▲ SBI Holdings Inc 18 0% ▼ 0.5% 0.0 ▲19 -3 ▼ Macquarie Group 243 -2% ▼ 1.5% -0.2 ▼ 19 - = Development Bank of Japan Inc 18 -15% ▼ 0.5% 0.0 ▼20 -1 ▼ Haitong Securities Co Ltd 234 18% ▲ 1.4% 0.1 ▲ 20 2 ▲ Tokai Tokyo Financial Holdings 17 17% ▲ 0.5% 0.1 ▲
Asia-Pacific Total 16,147$ 10% ▲ Japan Total 3,586$ -7% ▼
Japan Investment Banking: Top Banks - Full Year 2016 (US$m)Asia-Pacific Investment Banking: Top Banks - Full Year 2016 (US$m)
YOY ∆Rank Fees Share Rank Fees Share
YOY ∆ YOY ∆ YOY ∆ YOY ∆ YOY ∆Bonds Equity Loans M&A Bonds Equity Loans M&A
Source: Thomson Reuters Deals Business Intelligence- 10 -

Thomson Reuters Solutions for the Deal Making Community
FOR STRATEGY AND PLANNING TEAMSFOR INFORMATION PROFESSIONALSSDC Platinum is the world’s foremost financial transactions database, covering new issues, M&A, syndicated loans, private equity, project finance, poison pills, and more.
Solution for:• Market Analysis & Trends (Geography, Sector, Asset Class, Deal Type, Deal Size, etc.)• Deal Origination (Debt Maturity Analysis, Company Lifecycle including Private Equity)• Pitch Creation (Firm Credentials, Representative Acquirors)• M&A Targeting (Active Strategic/Sponsor Acquirors, Target Company Screener)• Negotiation (T&C Benchmarking)
Thomson Reuters Deals Business Intelligence enables you to slice and dice our renowned Deals and Fees data to create ad hoc reports, analyze market trends, benchmark your performance and identify opportunities – all within a tool built into your workflow in Excel®, saving you valuable time and giving you a competitive edge.
Solution for:• Conducting market analysis and identifying trends• Benchmarking your performance and monitoring competitors• Targeting clients by wallet size and banking relationship• Allocating resources more effectively by evaluating and analyzing lost deals
FOR INVESTMENT BANKERSand developing a client pitch book, you can do all this without leaving Microsoft Office. Search and autosuggest features in Excel make model-building easier.
Solution for:• Managing Client Relationships• Deal Origination• New Issues Pre-Marketing/Roadshows• Financial Modeling• Customized League Tables• Simple Deals screening• Valuation analysis and comparabledeal screening• On-brand pitch book creation
©2016 Thomson Reuters.
evaluating and analyzing lost deals
Send us a sales enquiry at: financial.thomsonreuters.com/salesRead more about our products at: financial.thomsonreuters.com/products
To purchase individual Thomson reuters Deals or League Table reports, please contact our Thomson Reuters On Demand group:
Web: http://financial.thomsonreuters.com/ondemandEmail: [email protected]
Access unique analysis for free anytime using Thomson Reuters Deals Intelligence website and receive regular updates, delivered direct to your inbox.
Go to: dmi.thomsonreuters.com/dealsintelligence
Thomson Reuters Eikon is the most intuitive and comprehensive way of staying informed. With natural-language search, you can quickly find global information,news, charts and analytics. Company and industry views provide top-level summaries, and then detailed information is just a click away. Identify new opportunities and gain deep understanding of markets, industries, companies and events.
Thomson Reuters Eikon also includes an Add-In for Microsoft® Office to help you increase your efficiency. From screening and targeting to comparables analysis, building league tables, valuing a company
- 11 -©2016 Thomson Reuters. Thomson Reuters and the Kinesis logo are trademarks of Thomson Reuters.