1h semi annual interim financial report as of 30 06 2013
126
SEMI-ANNUAL INTERIM FINANCIAL REPORT AS OF 30 JUNE 2013
-
Upload
archivio-documenti -
Category
Documents
-
view
230 -
download
11
description
1h semi annual interim financial report as of 30 06 2013
Transcript of 1h semi annual interim financial report as of 30 06 2013
SEMI-ANNUAL INTERIM FINANCIAL REPORT AS OF 30 JUNE 2013
CONTENTS
ADMINISTRATIVE BODIES .................................................................................................................. 3 SEMI-ANNUAL INTERIM FINANCIAL REPORT
REPORT ON OPERATIONS .......................................................................................................................... 4
1. PERFORMANCE OF THE GROUP .......................................................................................................... 8
2. PERFORMANCE OF THE PARENT COMPANY…………. ........................................................................... 11
3. RECONCILIATION OF THE PARENT COMPANY’S FINANCIAL STATEMENTS
WITH THE CONSOLIDATED FINANCIAL STATEMENTS ........................................................................ 12
4. PERFORMANCE OF THE BUSINESS SECTORS ....................................................................................... 14
5. SIGNIFICANT EVENTS SUBSEQUENT TO 30 JUNE 2013 ...................................................................... 21
6. OUTLOOK FOR OPERATIONS .............................................................................................................. 21
7. PRINCIPAL RISKS AND UNCERTAINTIES OF THE GROUP ..................................................................... 21
8. OTHER INFORMATION ........................................................................................................................ 22
CONSOLIDATED FINANCIAL STATEMENTS AS OF 30 JUNE 2013 ..................................................................... 24
1. CONSOLIDATED STATEMENTS OF FINANCIAL POSITION .................................................................... 25
2. CONSOLIDATED INCOME STATEMENT ............................................................................................... 26
3. CONSOLIDATED STATEMENT OF COMPREHENSIVE INCOME ............................................................. 27
4. CONSOLIDATED STATEMENT OF CASH FLOWS ................................................................................... 28
5. CONSOLIDATED STATEMENT OF CHANGES IN EQUITY ....................................................................... 29
6. EXPLANATORY NOTES ......................................................................................................................... 30
CERTIFICATION OF THE SEMI–ANNUAL INTERIM FINANCIAL REPORT AS OF 30 JUNE 2013
AS PER ART. 154-BIS OF D.LGS. 58/98 ........................................................................................................ 104
FINANCIAL STATEMENTS OF THE PARENT COMPANY AS OF 30 JUNE 2013 .................................................. 106 LIST OF EQUITY INVESTMENTS AS OF 30 JUNE 2013 ....................................................................................... 112 REPORT OF THE INDIPENDENT AUDITORS ...................................................................................................... 122 This Semi-annual Interim Financial Report as of 30 June 2013 was prepared in accordance with Art. 154 ter of D.Lgs. 58/1998 and in conformity with applicable international accounting standards recognized in the European Union as per EU Regulation no. 1606/2002 of the European Parliament and Council of July 19 2002, and specifically with IAS 34 –Interim Financial Reporting, and also with the measures issued in implementation of Art. 9 of D. Lgs no. 38/2005. This Semi-annual Interim Financial Report has been translated into English language solely for the convenience of international readers. In the event of any ambiguity the Italian text will prevail.

COMPAGNIE INDUSTRIALI RIUNITE
Limited-liability corporation - Share capital € 396,670,233.50 - Registered Office: Via Ciovassino, 1 – 20121 Milan - www.cirgroup.it R.E.A. n. 1950112 – Milan Company Register / Fiscal Code / VAT no. 00519120018
Company subject to management and coordination by COFIDE – Gruppo De Benedetti S.p.A. Office in Rome: Via del Tritone, 169 – 00187 Rome

ADMINISTRATIVE BODIES
BOARD OF DIRECTORS Honorary Chairman CARLO DE BENEDETTI and Director Chairman RODOLFO DE BENEDETTI Chief Executive Officer MONICA MONDARDINI and General Manager Directors MARISTELLA BOTTICINI (2) GIAMPIO BRACCHI (1) (2) FRANCO DEBENEDETTI SILVIA GIANNINI (2) FRANCO GIRARD STEFANO MICOSSI MICHAEL PISTAUER (1) CLAUDIO RECCHI (1) DOMINIQUE SENEQUIER (1) GUIDO TABELLINI (1) (3) Secretary to the Board MASSIMO SEGRE
BOARD OF STATUTORY AUDITORS Chairman PIETRO MANZONETTO Statutory Auditors LUIGI NANI RICCARDO ZINGALES Alternate Auditors LUCA VALDAMERI LUIGI MACCHIORLATTI VIGNAT PAOLA ZAMBON
INDEPENDENT AUDITORS
DELOITTE & TOUCHE S.p.A..
(1) Member of the Appointments and Compensation Committee (2) Member of the Internal Control and Risks Committee (3) Lead Independent Director
Repo
rt o
n op
erat
ions
INTERIM REPORT ON OPERATIONS
In the first half of 2013, the CIR Group had a turnover of € 2,409.6 million, in line with € 2,406.9 million in the same period of 2012.
The consolidated gross operating margin (EBITDA) amounted to € 94.7 million, compared with € 175.8 million in the first six months of last year; this reflects a loss of € 131 million due to the write-down by the subsidiary Sorgenia of its investment in Tirreno Power. EBITDA before write-downs amounted to € 225.7 million (28.4%).
The consolidated net result was a loss of € 164.9 million compared with a profit of € 0.7 million in the same period of last year. This result reflects the Sorgenia Group's write-downs for a total of € 162.4 million. Excluding them, the consolidated net result would have been a loss of € 2.5 million, broadly in line with the same period last year. The contribution made by the operating subsidiaries to consolidated net earnings was a loss of € 156.1 million; excluding the write-downs made by the Sorgenia Group, the contribution was positive for € 6.3 million compared with a loss of € 4.7 million in the corresponding period of 2012. KOS turned in a slightly better result, Sogefi, in a context of persistent weakness in the European automotive industry, maintained a result in line with the first half of 2012, Sorgenia, before writedowns, reduced its loss and Espresso reported a decline in earnings, while maintaining a positive result despite the serious crisis facing the publishing industry.
The contribution of the holding company CIR (including the operating subsidiaries) was a loss of € 8.8 million compared with a profit of € 5.4 million in the first half of 2012. This evolution is due to a lower net result from financial management, with such income down from € 13.2 million in the first half of 2012 to € 0.5 million in 2013. The operating subsidiaries are active in the following areas: energy (electricity and gas), automotive components (engine systems and suspension components), media (publishing, radio, internet and television) and health care (residential care homes, rehabilitation centres and high-tech services).
The results of each sector are summarised below.
4
Repo
rt o
n op
erat
ions
In the energy sector the Sorgenia Group had revenues of € 1,169.3 million, a 4.5% increase on the first half of 2012 (€ 1,119.3 million). The results from ordinary activities increased compared with the same period of 2012. EBITDA before writedowns, in particular, amounted to € 103.2 million compared with € 32.2 million in the first half of 2012. The increase was mainly due to the partial recovery of profit margins in the electricity sector, significantly accentuated by the results achieved in the first half on the market for dispatching services, which will be difficult to repeat. However, the company's profitability is still suffering the effect of the high cost of gas for the power plants and the cost of the long term natural gas supply contract, as well as the competition from renewable sources at peak times of day. The group's net loss of € 206.3 million was brought about almost entirely by adjustments to the value of the indirect interest in Tirreno Power and write-downs of assets in renewables and E&P. The write-down of the indirect interest in Tirreno Power also affected EBITDA, given that it is consolidated at equity. In the media sector during the first half of 2013, in a situation of serious economic recession which has heavily penalised the advertising market, the Espresso Group managed a turnover of € 369.4 million, 12% down on the first six months of 2012 because of a decline in advertising revenues due to the general market trend and, to a lesser extent, to falling circulation revenues. EBIT amounted to € 17.8 million (€ 42.1 million in the first six months 2012) and net income came to € 3.7 million compared with € 21.2 million in the first half of 2012. In the first half of 2013, despite the crisis in the auto sector in Europe, the Sogefi Group achieved stable revenues (-0.7% and +2.2% at constant exchange rates) thanks to growth in overseas markets, particularly North America, Asia and Mercosur. Thanks to a positive trend in the second quarter of 2013, the group achieved an EBITDA for the entire first half of € 71.2 million and net income of € 16.2 million, both with a increase of 3.9% compared with the first half of 2012. In the first half of 2013, the KOS Group achieved a consolidated turnover of € 186.5 million (+4.4%) and an EBITDA of € 27.4 million, compared with € 25 million in the first half of 2012. Net income was € 6.1 million compared with € 4.6 million in the same period of 2012. Bear in mind that following the Milan Court of Appeal's sentence deposited on 9 July 2011 which condemned Fininvest to pay compensation for the damages caused by bribery in the "Lodo Mondadori" case, on 26 July 2011 CIR received a total of € 564.2 million from Fininvest, including legal expenses and interest. In accordance with international accounting standards (IAS 37), this amount has not had any impact, nor will it have any impact, on the Group's income statement until the final appeal has been decided. A hearing took place on 27 June 2013 for the parties and the Attorney General to discuss the case before the Supreme Court. The case is currently pending the final decision and CIR is waiting for the sentence to be filed. This higher amount of cash, which is offset in the financial statements by an equivalent liability, does not have any effect on the Group's financial strategy, which is based on prudence and caution, at a time when financial markets are particularly complex. This amount has in fact been invested, some in the short term (cash deposits and money market funds through CIR S.p.A., some in bonds through Cir Investimenti S.p.A., a wholly-owned subsidiary). The yield on these investments is more or less in line with the statutory interest being accrued. The charts on the following pages show a breakdown by business sector of the economic and financial results of the Group, a breakdown of the contribution made by the main subsidiaries and the aggregate results of CIR, the parent company, and the other holding subsidiaries (CIR International, CIGA Luxembourg and CIR Investimenti).
5
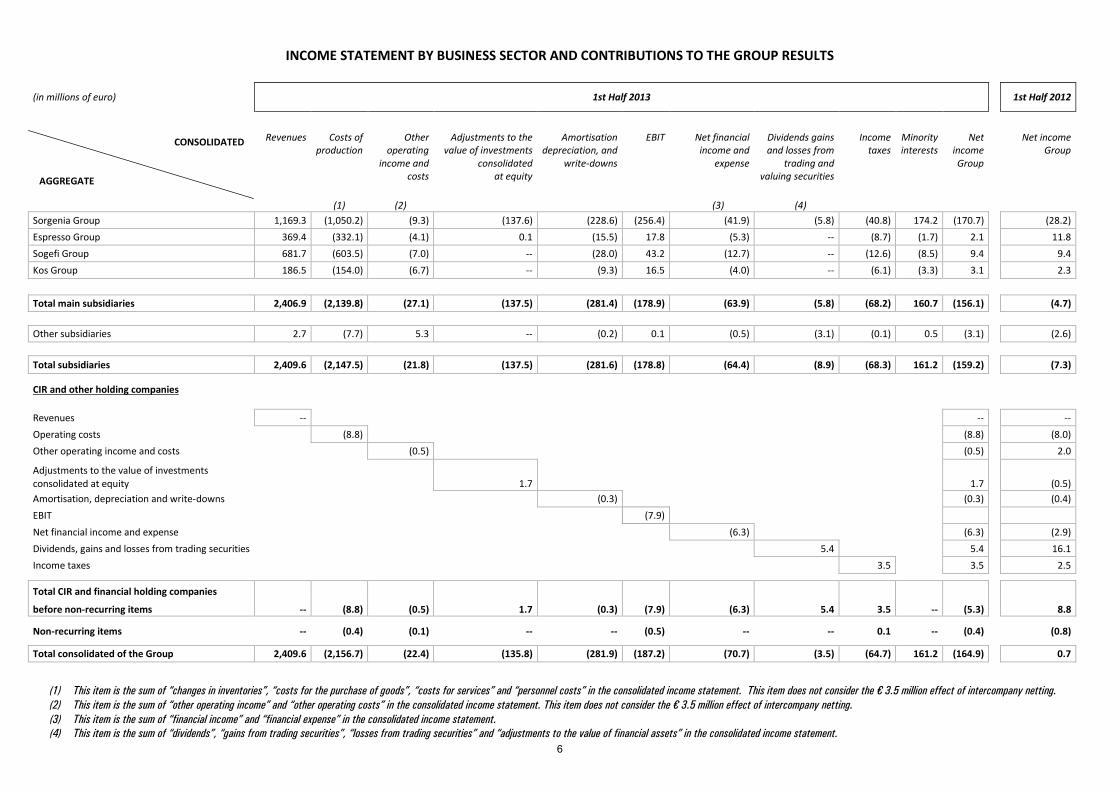
INCOME STATEMENT BY BUSINESS SECTOR AND CONTRIBUTIONS TO THE GROUP RESULTS
(in millions of euro) 1st Half 2013
1st Half 2012
Revenues Costs of production
Other operating
income and costs
Adjustments to the value of investments
consolidated at equity
Amortisation depreciation, and
write-downs
EBIT Net financial income and
expense
Dividends gains and losses from
trading and valuing securities
Income taxes
Minority interests
Net income Group
Net income Group
(1) (2)
(3) (4)
Sorgenia Group 1,169.3 (1,050.2) (9.3) (137.6) (228.6) (256.4) (41.9) (5.8) (40.8) 174.2 (170.7)
(28.2) Espresso Group 369.4 (332.1) (4.1) 0.1 (15.5) 17.8 (5.3) -- (8.7) (1.7) 2.1
11.8
Sogefi Group 681.7 (603.5) (7.0) -- (28.0) 43.2 (12.7) -- (12.6) (8.5) 9.4
9.4 Kos Group 186.5 (154.0) (6.7) -- (9.3) 16.5 (4.0) -- (6.1) (3.3) 3.1
2.3
Total main subsidiaries 2,406.9 (2,139.8) (27.1) (137.5) (281.4) (178.9) (63.9) (5.8) (68.2) 160.7 (156.1)
(4.7)
Other subsidiaries 2.7 (7.7) 5.3 -- (0.2) 0.1 (0.5) (3.1) (0.1) 0.5 (3.1)
(2.6)
Total subsidiaries 2,409.6 (2,147.5) (21.8) (137.5) (281.6) (178.8) (64.4) (8.9) (68.3) 161.2 (159.2)
(7.3)
CIR and other holding companies
Revenues --
--
--
Operating costs (8.8)
(8.8)
(8.0) Other operating income and costs
(0.5)
(0.5)
2.0
Adjustments to the value of investments
consolidated at equity
1.7 1.7
(0.5)
Amortisation, depreciation and write-downs
(0.3) (0.3)
(0.4) EBIT
(7.9)
Net financial income and expense
(6.3) (6.3)
(2.9) Dividends, gains and losses from trading securities
5.4 5.4
16.1
Income taxes
3.5 3.5
2.5
Total CIR and financial holding companies
before non-recurring items -- (8.8) (0.5) 1.7 (0.3) (7.9) (6.3) 5.4 3.5 -- (5.3) 8.8
Non-recurring items -- (0.4) (0.1) -- -- (0.5) -- -- 0.1 -- (0.4)
(0.8)
Total consolidated of the Group 2,409.6 (2,156.7) (22.4) (135.8) (281.9) (187.2) (70.7) (3.5) (64.7) 161.2 (164.9)
0.7
CONSOLIDATED AGGREGATE
(1) This item is the sum of “changes in inventories”, “costs for the purchase of goods”, “costs for services” and “personnel costs” in the consolidated income statement. This item does not consider the € 3.5 million effect of intercompany netting. (2) This item is the sum of “other operating income” and “other operating costs” in the consolidated income statement. This item does not consider the € 3.5 million effect of intercompany netting. (3) This item is the sum of “financial income” and “financial expense” in the consolidated income statement. (4) This item is the sum of “dividends”, “gains from trading securities”, “losses from trading securities” and “adjustments to the value of financial assets” in the consolidated income statement.
6

CONSOLIDATED STATEMENT OF FINANCIAL POSITION BY BUSINESS SECTOR
(in millions of euro) 30.06.2013
31.12.2012
Fixed assets Other net non-current assets
and liabilities
Net working capital Net financial position (continuing operation)
Total equity
of which
Minority interests equity
Group equity
Group equity (**)
(1) (2) (3) (4) Sorgenia Group 2,032.9 216.4 228.5 (1,806.5) (*) 671.3 328.6 342.7
502.5
Espresso Group 828.0 (210.2) 28.0 (86.1) 559.7 247.6 312.1
310.5
Sogefi Group 495.0 (44.8) 82.9 (341.1) 192.0 91.2 100.8
105.2
Kos Group 405.9 (24.6) 30.1 (173.6) 237.8 118.1 119.7
118.7
Other subsidiaries 8.7 12.2 (10.1) (10.5) 0.3 (0.1) 0.4
2.9
Total subsidiaries 3,770.5 (51.0) 359.4 (2,417.8) 1,661.1 785.4 875.7 1,039.8
CIR and otherholding companies
Fixed assets 141.0 141.0 141.0
140.0
Other net non-current assets and liabilities 183.4
183.4
183.4
185.3
Net working capital
(36.0)
(36.0)
(36.0)
(35.0)
Net financial position
47.7 47.7 47.7
33.2
Total consolidated of the Group 3,911.5 132.4 323.4 (2,370.1) 1,997.2 785.4 1,211.8
1,363.3
(*) The financial position includes cash and cash equivalents of Sorgenia Holding S.p.A. (**) Certain figures at 31 December 2012 were restated following application of the amendment to IAS 19 - Employee Benefits. (1) This item is the sum of “intangible assets”, “tangible assets”, “investment property”, “investments in companies consolidated at equity" and "other equity investments" in the consolidated statement of financial position. (2) This item is the sum of “other receivables", "securities" and "deferred taxes" under non-current assets and of "other payables", "deferred taxes", "personnel provisions" and "provisions for risks and losses" under non-current liabilities in the
consolidated statement of financial position. This item also includes the "assets held for disposal" and "liabilities associated with assets held for disposal” in the consolidated statement of financial positio. (3) This item is the sum of “inventories”, “contract work in progress”, “trade receivables” and “other receivables" under current assets, and of “trade payables”, “other payables” and “provisions for risks and losses” under current liabilities in the
consolidated statement of financial position. (4) This item is the sum of “financial receivables”, “securities”, “available-for-sale financial assets” and “cash and cash equivalents” under current assets, of “bonds” and “other borrowings” under non-current liabilities, and of “bank overdrafts”,
“bonds” and “other borrowings” under current liabilities in the consolidated statement of financial.
CONSOLIDATED AGGREGATE
7
Repo
rt o
n op
erat
ions
1. Performance of the Group
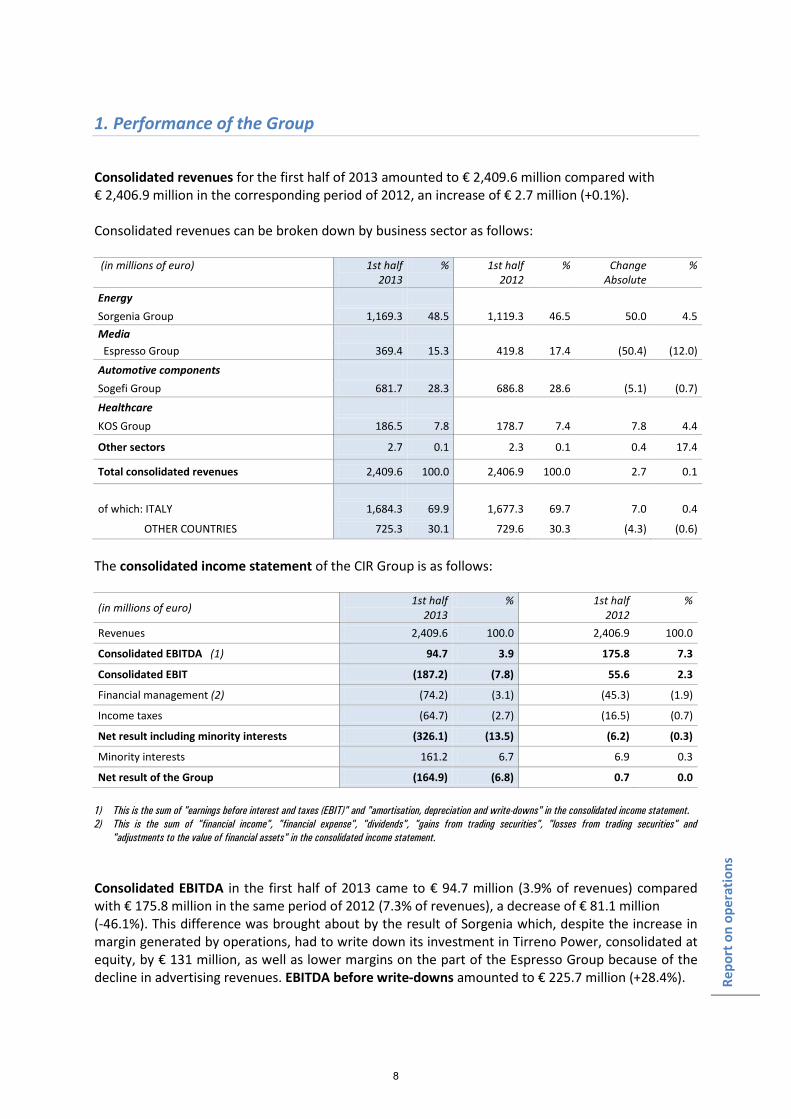
Consolidated revenues for the first half of 2013 amounted to € 2,409.6 million compared with € 2,406.9 million in the corresponding period of 2012, an increase of € 2.7 million (+0.1%). Consolidated revenues can be broken down by business sector as follows: (in millions of euro) 1st half
2013 % 1st half
2012 % Change
Absolute %
Energy
Sorgenia Group 1,169.3 48.5 1,119.3 46.5 50.0 4.5 Media Espresso Group 369.4 15.3 419.8 17.4 (50.4) (12.0)
Automotive components Sogefi Group 681.7 28.3 686.8 28.6 (5.1) (0.7)
Healthcare KOS Group 186.5 7.8 178.7 7.4 7.8 4.4
Other sectors 2.7 0.1 2.3 0.1 0.4 17.4
Total consolidated revenues 2,409.6 100.0 2,406.9 100.0 2.7 0.1
of which: ITALY 1,684.3 69.9 1,677.3 69.7 7.0 0.4
OTHER COUNTRIES 725.3 30.1 729.6 30.3 (4.3) (0.6)
The consolidated income statement of the CIR Group is as follows: (in millions of euro) 1st half
2013 % 1st half
2012 %
Revenues 2,409.6 100.0 2,406.9 100.0
Consolidated EBITDA (1) 94.7 3.9 175.8 7.3
Consolidated EBIT (187.2) (7.8) 55.6 2.3
Financial management (2) (74.2) (3.1) (45.3) (1.9)
Income taxes (64.7) (2.7) (16.5) (0.7)
Net result including minority interests (326.1) (13.5) (6.2) (0.3)
Minority interests 161.2 6.7 6.9 0.3
Net result of the Group (164.9) (6.8) 0.7 0.0 1) This is the sum of "earnings before interest and taxes (EBIT)" and "amortisation, depreciation and write-downs" in the consolidated income statement. 2) This is the sum of "financial income", "financial expense", "dividends", "gains from trading securities", "losses from trading securities" and
"adjustments to the value of financial assets" in the consolidated income statement. Consolidated EBITDA in the first half of 2013 came to € 94.7 million (3.9% of revenues) compared with € 175.8 million in the same period of 2012 (7.3% of revenues), a decrease of € 81.1 million (-46.1%). This difference was brought about by the result of Sorgenia which, despite the increase in margin generated by operations, had to write down its investment in Tirreno Power, consolidated at equity, by € 131 million, as well as lower margins on the part of the Espresso Group because of the decline in advertising revenues. EBITDA before write-downs amounted to € 225.7 million (+28.4%).
8
Repo
rt o
n op
erat
ions
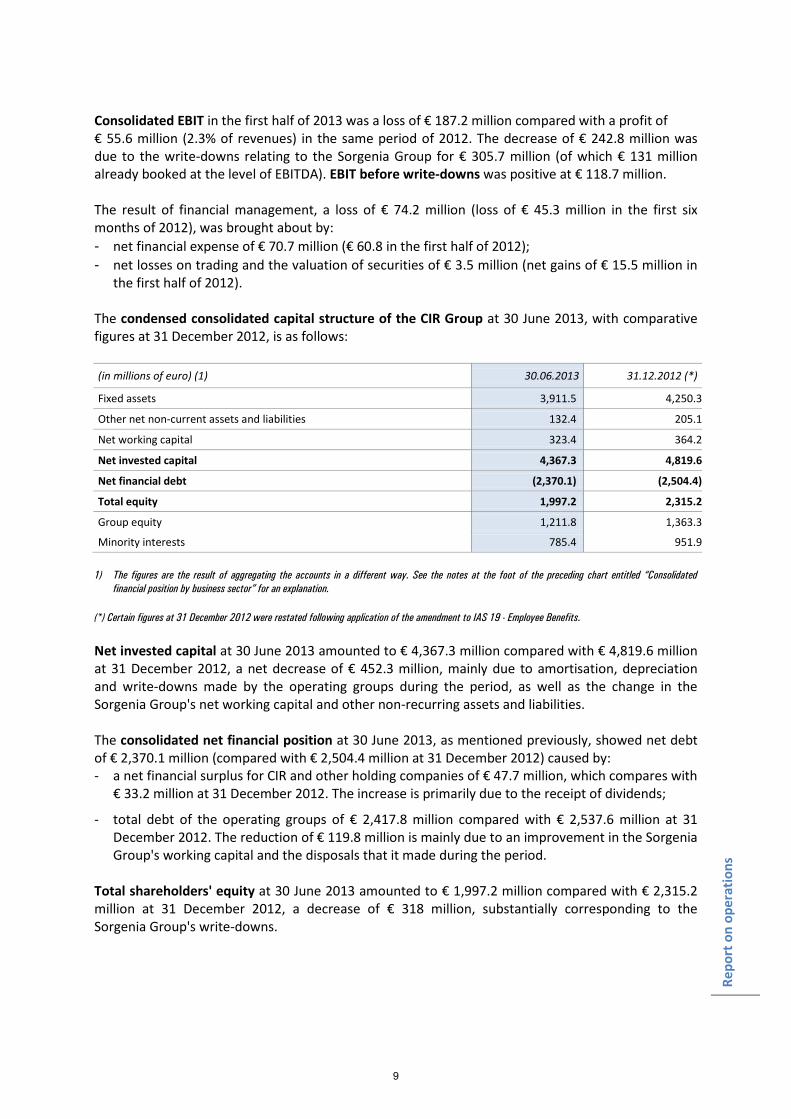
Consolidated EBIT in the first half of 2013 was a loss of € 187.2 million compared with a profit of € 55.6 million (2.3% of revenues) in the same period of 2012. The decrease of € 242.8 million was due to the write-downs relating to the Sorgenia Group for € 305.7 million (of which € 131 million already booked at the level of EBITDA). EBIT before write-downs was positive at € 118.7 million. The result of financial management, a loss of € 74.2 million (loss of € 45.3 million in the first six months of 2012), was brought about by: - net financial expense of € 70.7 million (€ 60.8 in the first half of 2012); - net losses on trading and the valuation of securities of € 3.5 million (net gains of € 15.5 million in
the first half of 2012). The condensed consolidated capital structure of the CIR Group at 30 June 2013, with comparative figures at 31 December 2012, is as follows: (in millions of euro) (1) 30.06.2013 31.12.2012 (*)
Fixed assets 3,911.5 4,250.3
Other net non-current assets and liabilities 132.4 205.1
Net working capital 323.4 364.2
Net invested capital 4,367.3 4,819.6
Net financial debt (2,370.1) (2,504.4)
Total equity 1,997.2 2,315.2
Group equity 1,211.8 1,363.3
Minority interests 785.4 951.9 1) The figures are the result of aggregating the accounts in a different way. See the notes at the foot of the preceding chart entitled “Consolidated
financial position by business sector” for an explanation. (*) Certain figures at 31 December 2012 were restated following application of the amendment to IAS 19 - Employee Benefits. Net invested capital at 30 June 2013 amounted to € 4,367.3 million compared with € 4,819.6 million at 31 December 2012, a net decrease of € 452.3 million, mainly due to amortisation, depreciation and write-downs made by the operating groups during the period, as well as the change in the Sorgenia Group's net working capital and other non-recurring assets and liabilities. The consolidated net financial position at 30 June 2013, as mentioned previously, showed net debt of € 2,370.1 million (compared with € 2,504.4 million at 31 December 2012) caused by: - a net financial surplus for CIR and other holding companies of € 47.7 million, which compares with
€ 33.2 million at 31 December 2012. The increase is primarily due to the receipt of dividends;
- total debt of the operating groups of € 2,417.8 million compared with € 2,537.6 million at 31 December 2012. The reduction of € 119.8 million is mainly due to an improvement in the Sorgenia Group's working capital and the disposals that it made during the period.
Total shareholders' equity at 30 June 2013 amounted to € 1,997.2 million compared with € 2,315.2 million at 31 December 2012, a decrease of € 318 million, substantially corresponding to the Sorgenia Group's write-downs.
9
Repo
rt o
n op
erat
ions
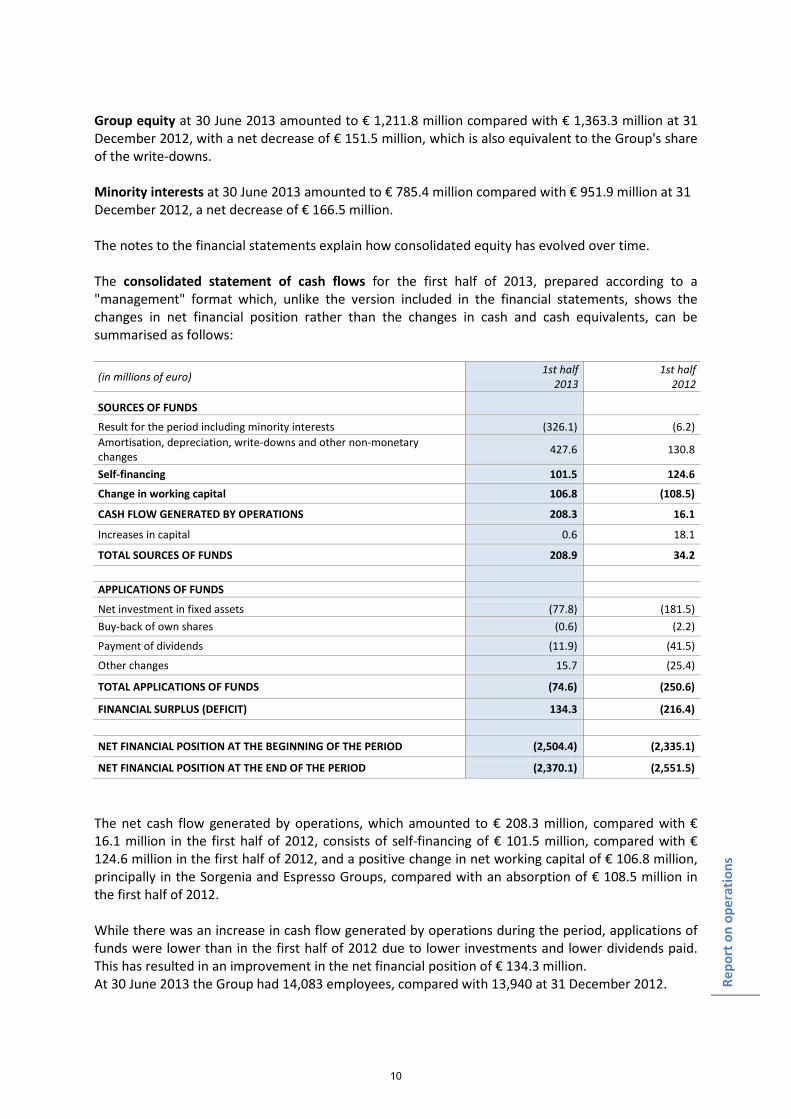
Group equity at 30 June 2013 amounted to € 1,211.8 million compared with € 1,363.3 million at 31 December 2012, with a net decrease of € 151.5 million, which is also equivalent to the Group's share of the write-downs. Minority interests at 30 June 2013 amounted to € 785.4 million compared with € 951.9 million at 31 December 2012, a net decrease of € 166.5 million. The notes to the financial statements explain how consolidated equity has evolved over time. The consolidated statement of cash flows for the first half of 2013, prepared according to a "management" format which, unlike the version included in the financial statements, shows the changes in net financial position rather than the changes in cash and cash equivalents, can be summarised as follows:
(in millions of euro) 1st half 2013
1st half 2012
SOURCES OF FUNDS
Result for the period including minority interests (326.1) (6.2) Amortisation, depreciation, write-downs and other non-monetary changes 427.6 130.8
Self-financing 101.5 124.6
Change in working capital 106.8 (108.5)
CASH FLOW GENERATED BY OPERATIONS 208.3 16.1
Increases in capital 0.6 18.1
TOTAL SOURCES OF FUNDS 208.9 34.2 APPLICATIONS OF FUNDS
Net investment in fixed assets (77.8) (181.5) Buy-back of own shares (0.6) (2.2)
Payment of dividends (11.9) (41.5)
Other changes 15.7 (25.4)
TOTAL APPLICATIONS OF FUNDS (74.6) (250.6)
FINANCIAL SURPLUS (DEFICIT) 134.3 (216.4) NET FINANCIAL POSITION AT THE BEGINNING OF THE PERIOD (2,504.4) (2,335.1)
NET FINANCIAL POSITION AT THE END OF THE PERIOD (2,370.1) (2,551.5)
The net cash flow generated by operations, which amounted to € 208.3 million, compared with € 16.1 million in the first half of 2012, consists of self-financing of € 101.5 million, compared with € 124.6 million in the first half of 2012, and a positive change in net working capital of € 106.8 million, principally in the Sorgenia and Espresso Groups, compared with an absorption of € 108.5 million in the first half of 2012. While there was an increase in cash flow generated by operations during the period, applications of funds were lower than in the first half of 2012 due to lower investments and lower dividends paid. This has resulted in an improvement in the net financial position of € 134.3 million. At 30 June 2013 the Group had 14,083 employees, compared with 13,940 at 31 December 2012.
10
Repo
rt o
n op
erat
ions
2. Performance of the Parent Company
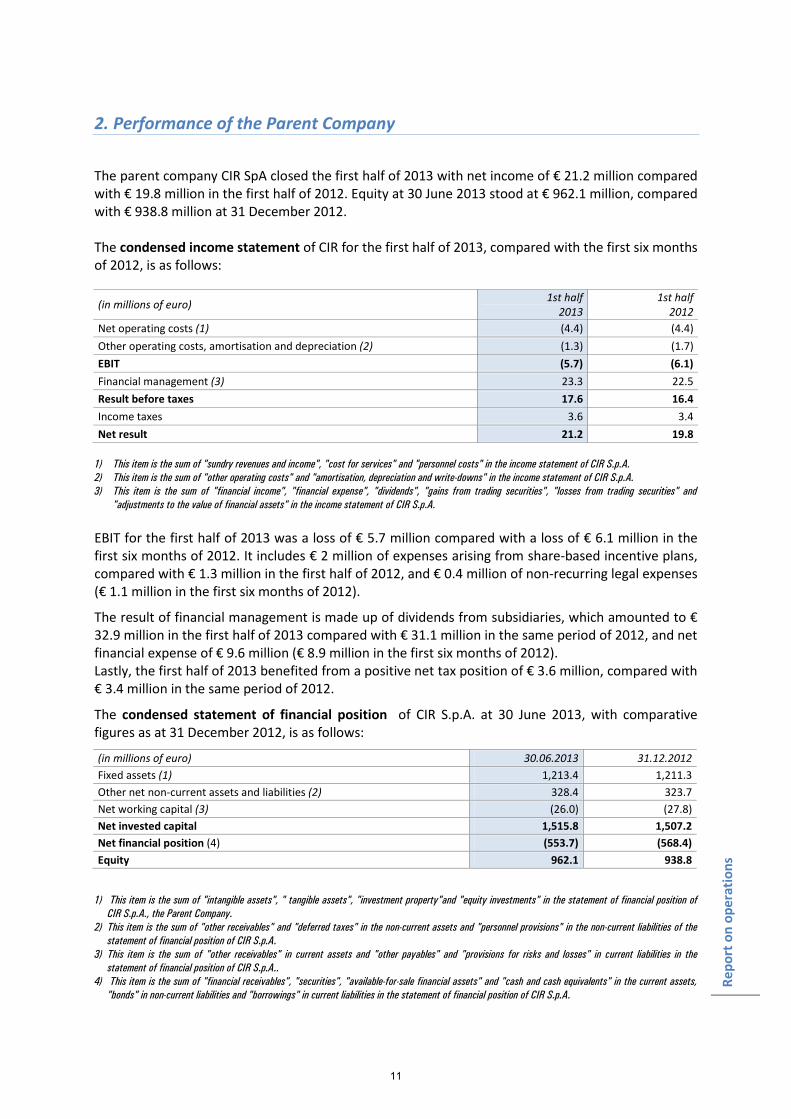
The parent company CIR SpA closed the first half of 2013 with net income of € 21.2 million compared with € 19.8 million in the first half of 2012. Equity at 30 June 2013 stood at € 962.1 million, compared with € 938.8 million at 31 December 2012. The condensed income statement of CIR for the first half of 2013, compared with the first six months of 2012, is as follows:
(in millions of euro) 1st half 2013
1st half 2012
Net operating costs (1) (4.4) (4.4) Other operating costs, amortisation and depreciation (2) (1.3) (1.7) EBIT (5.7) (6.1) Financial management (3) 23.3 22.5 Result before taxes 17.6 16.4 Income taxes 3.6 3.4 Net result 21.2 19.8
1) This item is the sum of "sundry revenues and income", "cost for services" and "personnel costs" in the income statement of CIR S.p.A. 2) This item is the sum of "other operating costs" and "amortisation, depreciation and write-downs" in the income statement of CIR S.p.A. 3) This item is the sum of "financial income", "financial expense", "dividends", "gains from trading securities", "losses from trading securities" and
"adjustments to the value of financial assets" in the income statement of CIR S.p.A. EBIT for the first half of 2013 was a loss of € 5.7 million compared with a loss of € 6.1 million in the first six months of 2012. It includes € 2 million of expenses arising from share-based incentive plans, compared with € 1.3 million in the first half of 2012, and € 0.4 million of non-recurring legal expenses (€ 1.1 million in the first six months of 2012).
The result of financial management is made up of dividends from subsidiaries, which amounted to € 32.9 million in the first half of 2013 compared with € 31.1 million in the same period of 2012, and net financial expense of € 9.6 million (€ 8.9 million in the first six months of 2012). Lastly, the first half of 2013 benefited from a positive net tax position of € 3.6 million, compared with € 3.4 million in the same period of 2012.
The condensed statement of financial position of CIR S.p.A. at 30 June 2013, with comparative figures as at 31 December 2012, is as follows:
(in millions of euro) 30.06.2013 31.12.2012 Fixed assets (1) 1,213.4 1,211.3 Other net non-current assets and liabilities (2) 328.4 323.7 Net working capital (3) (26.0) (27.8) Net invested capital 1,515.8 1,507.2 Net financial position (4) (553.7) (568.4) Equity 962.1 938.8
1) This item is the sum of "intangible assets", " tangible assets", "investment property"and "equity investments" in the statement of financial position of CIR S.p.A., the Parent Company.
2) This item is the sum of "other receivables" and "deferred taxes" in the non-current assets and "personnel provisions" in the non-current liabilities of the statement of financial position of CIR S.p.A.
3) This item is the sum of "other receivables" in current assets and "other payables" and "provisions for risks and losses" in current liabilities in the statement of financial position of CIR S.p.A..
4) This item is the sum of "financial receivables", "securities", "available-for-sale financial assets" and "cash and cash equivalents" in the current assets, "bonds" in non-current liabilities and "borrowings" in current liabilities in the statement of financial position of CIR S.p.A.
11
Repo
rt o
n op
erat
ions
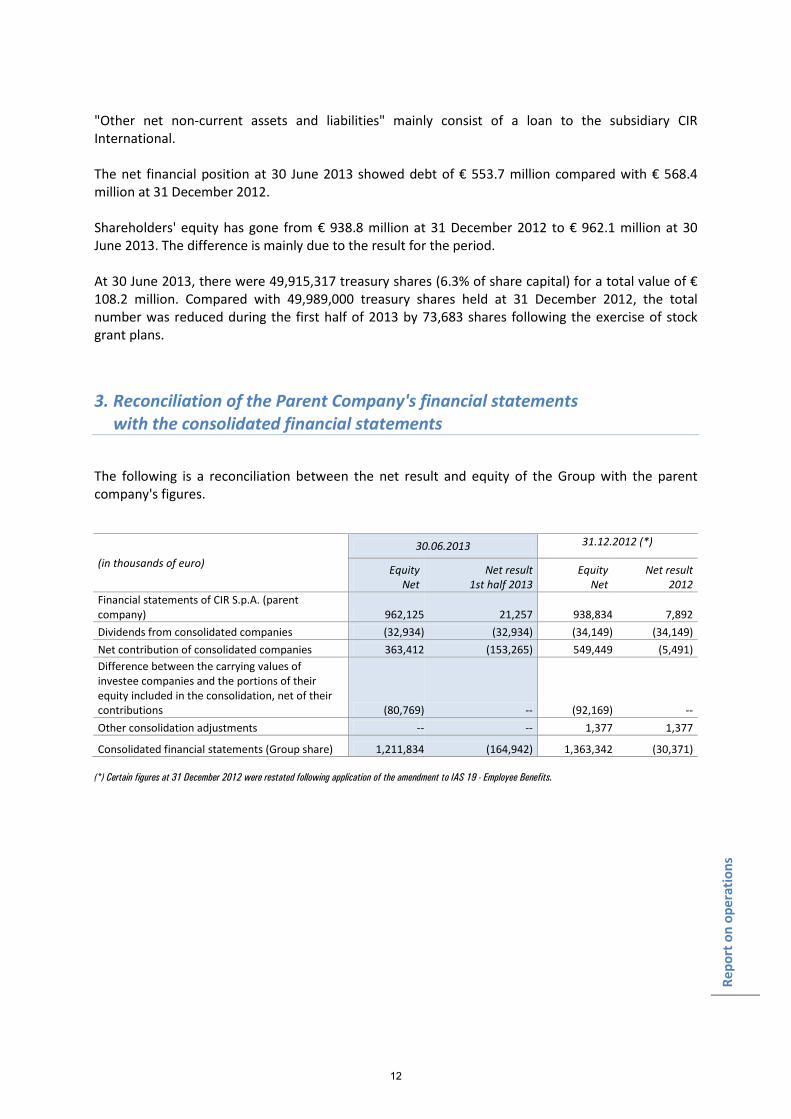
"Other net non-current assets and liabilities" mainly consist of a loan to the subsidiary CIR International. The net financial position at 30 June 2013 showed debt of € 553.7 million compared with € 568.4 million at 31 December 2012. Shareholders' equity has gone from € 938.8 million at 31 December 2012 to € 962.1 million at 30 June 2013. The difference is mainly due to the result for the period. At 30 June 2013, there were 49,915,317 treasury shares (6.3% of share capital) for a total value of € 108.2 million. Compared with 49,989,000 treasury shares held at 31 December 2012, the total number was reduced during the first half of 2013 by 73,683 shares following the exercise of stock grant plans. 3. Reconciliation of the Parent Company's financial statements
with the consolidated financial statements
The following is a reconciliation between the net result and equity of the Group with the parent company's figures.
(in thousands of euro) 30.06.2013 31.12.2012 (*)
Equity Net
Net result 1st half 2013
Equity Net
Net result 2012
Financial statements of CIR S.p.A. (parent company) 962,125 21,257 938,834 7,892 Dividends from consolidated companies (32,934) (32,934) (34,149) (34,149) Net contribution of consolidated companies 363,412 (153,265) 549,449 (5,491) Difference between the carrying values of investee companies and the portions of their equity included in the consolidation, net of their contributions (80,769) -- (92,169) -- Other consolidation adjustments -- -- 1,377 1,377
Consolidated financial statements (Group share) 1,211,834 (164,942) 1,363,342 (30,371) (*) Certain figures at 31 December 2012 were restated following application of the amendment to IAS 19 - Employee Benefits.
12
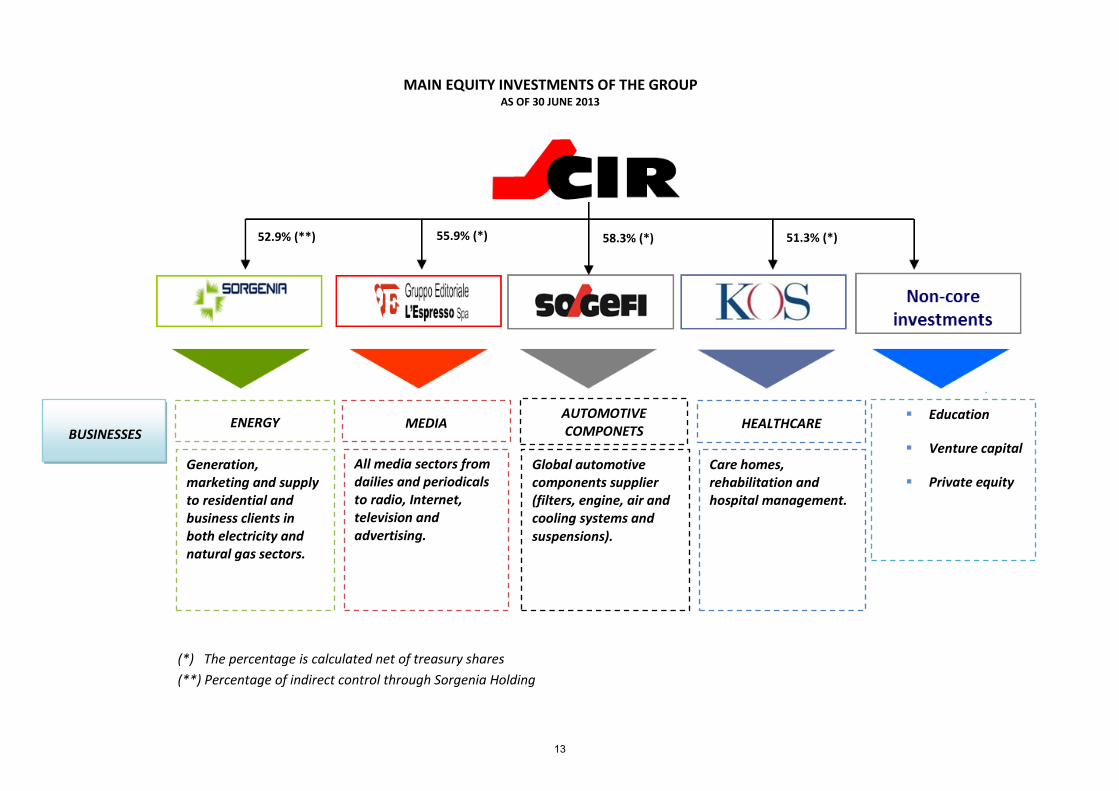
MAIN EQUITY INVESTMENTS OF THE GROUP AS OF 30 JUNE 2013
BUSINESSES
Generation, marketing and supply to residential and business clients in both electricity and natural gas sectors.
All media sectors from dailies and periodicals to radio, Internet, television and advertising.
Global automotive components supplier (filters, engine, air and cooling systems and suspensions).
Care homes, rehabilitation and hospital management.
Education
Venture capital
Private equity
MEDIA AUTOMOTIVE COMPONETS ENERGY HEALTHCARE
(*) The percentage is calculated net of treasury shares (**) Percentage of indirect control through Sorgenia Holding
52.9% (**) 55.9% (*) 51.3% (*) 58.3% (*)
13
Repo
rt o
n op
erat
ions
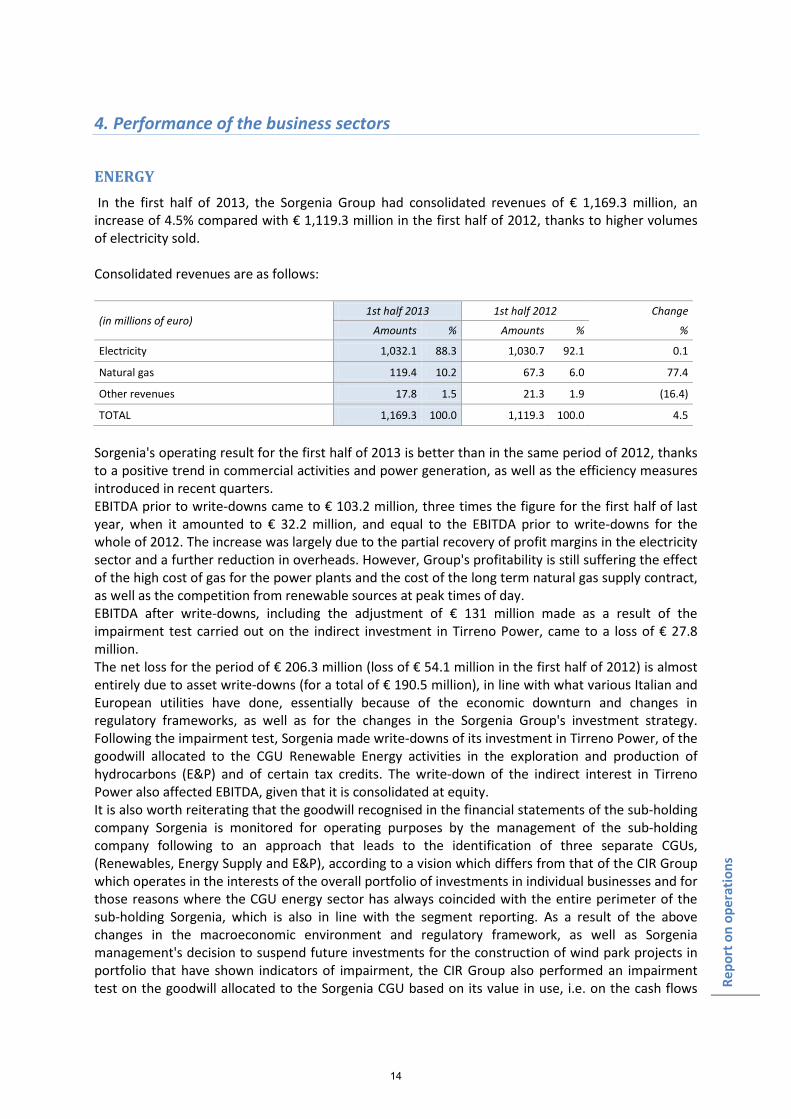
4. Performance of the business sectors
ENERGY In the first half of 2013, the Sorgenia Group had consolidated revenues of € 1,169.3 million, an increase of 4.5% compared with € 1,119.3 million in the first half of 2012, thanks to higher volumes of electricity sold. Consolidated revenues are as follows:
(in millions of euro) 1st half 2013 1st half 2012 Change
Amounts % Amounts % %
Electricity 1,032.1 88.3 1,030.7 92.1 0.1
Natural gas 119.4 10.2 67.3 6.0 77.4
Other revenues 17.8 1.5 21.3 1.9 (16.4)
TOTAL 1,169.3 100.0 1,119.3 100.0 4.5
Sorgenia's operating result for the first half of 2013 is better than in the same period of 2012, thanks to a positive trend in commercial activities and power generation, as well as the efficiency measures introduced in recent quarters. EBITDA prior to write-downs came to € 103.2 million, three times the figure for the first half of last year, when it amounted to € 32.2 million, and equal to the EBITDA prior to write-downs for the whole of 2012. The increase was largely due to the partial recovery of profit margins in the electricity sector and a further reduction in overheads. However, Group's profitability is still suffering the effect of the high cost of gas for the power plants and the cost of the long term natural gas supply contract, as well as the competition from renewable sources at peak times of day. EBITDA after write-downs, including the adjustment of € 131 million made as a result of the impairment test carried out on the indirect investment in Tirreno Power, came to a loss of € 27.8 million. The net loss for the period of € 206.3 million (loss of € 54.1 million in the first half of 2012) is almost entirely due to asset write-downs (for a total of € 190.5 million), in line with what various Italian and European utilities have done, essentially because of the economic downturn and changes in regulatory frameworks, as well as for the changes in the Sorgenia Group's investment strategy. Following the impairment test, Sorgenia made write-downs of its investment in Tirreno Power, of the goodwill allocated to the CGU Renewable Energy activities in the exploration and production of hydrocarbons (E&P) and of certain tax credits. The write-down of the indirect interest in Tirreno Power also affected EBITDA, given that it is consolidated at equity. It is also worth reiterating that the goodwill recognised in the financial statements of the sub-holding company Sorgenia is monitored for operating purposes by the management of the sub-holding company following to an approach that leads to the identification of three separate CGUs, (Renewables, Energy Supply and E&P), according to a vision which differs from that of the CIR Group which operates in the interests of the overall portfolio of investments in individual businesses and for those reasons where the CGU energy sector has always coincided with the entire perimeter of the sub-holding Sorgenia, which is also in line with the segment reporting. As a result of the above changes in the macroeconomic environment and regulatory framework, as well as Sorgenia management's decision to suspend future investments for the construction of wind park projects in portfolio that have shown indicators of impairment, the CIR Group also performed an impairment test on the goodwill allocated to the Sorgenia CGU based on its value in use, i.e. on the cash flows
14
Repo
rt o
n op
erat
ions
that are expected to be generated overall by the Sorgenia sub-holding company. As explained more fully in the notes, the outcome of this test led to the recognition of a write-down of goodwill of € 169.0 million. Consolidated EBIT (after write-downs) in the first half of 2013 was a loss of € 149.7 million compared with a negative € 28 million in the same period last year, having been affected by the fall in EBITDA, as well as write-downs as a result of impairment testing. At 30 June 2013, consolidated net debt, excluding cash flow hedges, amounted to € 1,736.4 million, down on the figure of € 1,861.6 million at 31 December 2012, thanks to the improvement in working capital and the disposals made in the photovoltaic and E&P sectors.
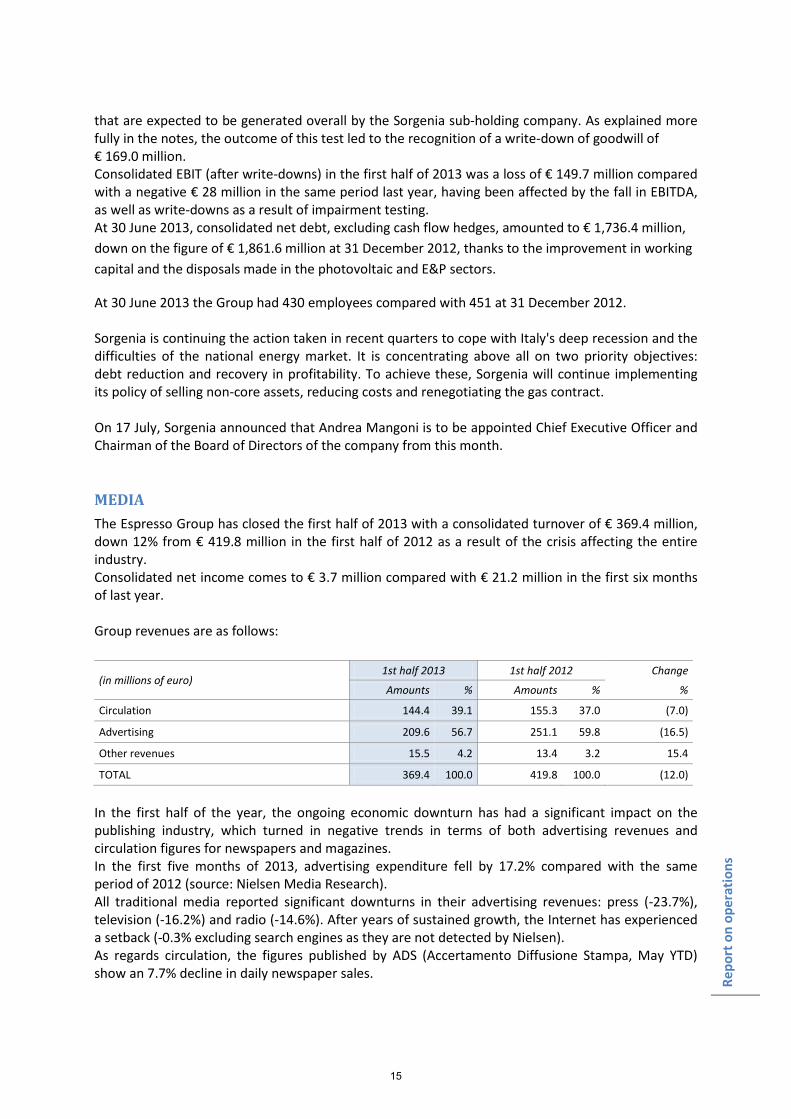
At 30 June 2013 the Group had 430 employees compared with 451 at 31 December 2012. Sorgenia is continuing the action taken in recent quarters to cope with Italy's deep recession and the difficulties of the national energy market. It is concentrating above all on two priority objectives: debt reduction and recovery in profitability. To achieve these, Sorgenia will continue implementing its policy of selling non-core assets, reducing costs and renegotiating the gas contract. On 17 July, Sorgenia announced that Andrea Mangoni is to be appointed Chief Executive Officer and Chairman of the Board of Directors of the company from this month. MEDIA The Espresso Group has closed the first half of 2013 with a consolidated turnover of € 369.4 million, down 12% from € 419.8 million in the first half of 2012 as a result of the crisis affecting the entire industry. Consolidated net income comes to € 3.7 million compared with € 21.2 million in the first six months of last year. Group revenues are as follows:
(in millions of euro) 1st half 2013 1st half 2012 Change
Amounts % Amounts % %
Circulation 144.4 39.1 155.3 37.0 (7.0)
Advertising 209.6 56.7 251.1 59.8 (16.5)
Other revenues 15.5 4.2 13.4 3.2 15.4
TOTAL 369.4 100.0 419.8 100.0 (12.0)
In the first half of the year, the ongoing economic downturn has had a significant impact on the publishing industry, which turned in negative trends in terms of both advertising revenues and circulation figures for newspapers and magazines. In the first five months of 2013, advertising expenditure fell by 17.2% compared with the same period of 2012 (source: Nielsen Media Research). All traditional media reported significant downturns in their advertising revenues: press (-23.7%), television (-16.2%) and radio (-14.6%). After years of sustained growth, the Internet has experienced a setback (-0.3% excluding search engines as they are not detected by Nielsen). As regards circulation, the figures published by ADS (Accertamento Diffusione Stampa, May YTD) show an 7.7% decline in daily newspaper sales.
15
Repo
rt o
n op
erat
ions
The Group's circulation revenues amounted to € 144.4 million, a decrease of 7% on the same period last year (€ 155.3 million), in a market that is continuing to see a significant reduction in the circulation of daily newspapers. The Group's titles performed better than the market in general. Based on the latest figures from Audipress (Survey 2013/I) and ADS (May 2013), la Repubblica is still Italy's leading newspaper in terms of average daily readership (2.8 million) and copies sold (newsstands, subscriptions and other official channels), a primacy that it also holds including subscribers to the digital version (more than 46,000 at the end of June). With reference to digital developments, if we take into consideration not only the digital version of the newspaper, but also the other digital services provided by la Repubblica, it now has more than 70,000 subscribers, an increase of 45% compared with the end of June 2012. The network of local newspapers, again according to the latest figures from Audipress, has an average daily readership of 3.1 million, while L'Espresso is in first place among newsmagazines with 2.2 million readers. Advertising revenues, which amounted to € 209.6 million, suffered a 16.5% downturn on the first half of 2012, in a market that has shrunk by 17.2%. By sector, the press reported a decrease in advertising revenues of 23.1% (-23.7% for the market) and radio also experienced a significant decline, -13.7% (-14.6% for the market). The Internet, on the other hand, saw a positive trend in advertising revenues, with an increase of 3.4%, even though the market trend is no longer positive (-0.3%). In this regard, it is worth pointing out the excellent trend in the number of visitors to the Group's websites: on average, they had 3.1 million unique daily users, an increase of 24.4% compared with the average figure in the same period of 2012 (source: Nielsen Site Census). As can be seen from the figures, in all media, the Group posted trends in advertising revenue that were slightly less negative than the market, increasing its market share as a result. Other revenues, amounting to € 15.5 million, increased by 15.4% on the first half of 2012, thanks to the growth in digital terrestrial TV bandwidth rentals to third parties. Total costs have been reduced by 7.8%: excluding digital publishing and DTT, where costs are rising to support their development, there has been a 12.8% reduction thanks to further rationalisation, especially in the industrial and administrative areas. The consolidated gross operating profit amounts to € 33.3 million versus € 60.8 million in the first half of 2012. All traditional areas of activity showed a decline in EBITDA due to the general decrease in advertising revenues; the decline is more substantial for the national press (la Repubblica and magazines), as it has suffered the largest decline in advertising; the results of local newspapers and radio stations are showing greater resilience; Lastly, the result of the digital activity has improved slightly. The consolidated operating profit came to € 17.8 million versus € 42.1 million in the same period last year. Consolidated net income comes to € 3.7 million compared with € 21.2 million in the first six months of last year. The consolidated net financial position shows net debt of € 86.1 million, a further improvement on the figure of € 108.1 million at 31 December 2012, with a financial surplus of € 22.1 million.
16

Repo
rt o
n op
erat
ions
At 30 June 2013, the Group had 2,502 employees, including those on fixed-term contracts, compared with 2,536 at 31 December 2012. The first half of 2013 has continued to see an extremely critical trend in both advertising revenues (-17%) and circulation. Moreover, at present, the monthly revenue figures are not showing any sign of a recovery. The Expresso Group overcame the crisis of 2009 with remarkable ease, thanks to a radical restructuring in 2009-2010, which by 2011 allowed it to recover its pre-crisis level of profitability with substantially reduce its debt. Faced with the second wave of crisis, which began in the last quarter of 2011 and is still underway, the group activated plans to accelerate digital development, on the one hand, and to cut costs even more, on the other. This enabled the group to mitigate the negative impacts of the crisis, turning in a profit in 2012 in a sector that is making huge losses, and the first half 2013 result is also a small profit. The outlook for 2013 is still very uncertain because of a recession that is having a very strong influence on advertising investment. As regards advertising, it is not unreasonable to think that the decline in the first half of 2013 could be mitigated during the rest of the year, considering how much they had already contracted in 2012; however, given the current state of the economy, we cannot rule out that the shortfall in early 2013 compared with the same period in 2012 could be confirmed for the entire year. AUTOMOTIVE COMPONENTSThe consolidated turnover of the Sogefi Group in the first half of 2013 amounted to € 681.7 million, substantially in line (-0.7%) with the figure of € 686.8 million in the same period of 2012 (+2.2% at constant exchange rates), due to a positive trend in revenues in the second quarter (+3.7%).
Consolidated net income amounted to € 16.2 million, 3.9% up on the € 15.6 million in the first six months of 2012.
The breakdown of the Sogefi Group's consolidated turnover by business sector is as follows:
(in millions of euro) 1st half 2013 1st half 2012 Change
Amounts % Amounts % %
Engine systems 416.7 61.1 412.9 60.1 0.9
Suspension components 266.2 39.0 275.1 40.0 (3.2)
Intercompany (1.2) (0.1) (1.2) (0.1) n.a.
TOTAL 681.7 100.0 686.8 100.0 (0.7)
Regarding the performance of the global automotive market in the first six months of 2013, the increase in new car registrations in the United States (+8% on the first six months of 2012), Brazil (+4.8%) and China (+13%) offset continued weakness in Europe (-6.6%).
During the first half, the Engine Systems Division posted revenues of € 416.7 million, while the Suspension Components Division had revenues of € 266.2 million (€ 412.9 million and € 275.1 million respectively in the same period of 2012). Both divisions contributed to revenue growth in the second quarter: the Engine Systems Division saw the biggest increase (+5.0% to € 214.8 million from € 204.6
17
Repo
rt o
n op
erat
ions
million in the second quarter of 2012), while the Suspension Components Division achieved an increase of 1.8% to € 138.3 million (€ 135.8 million in the same period of 2012).
A significant figure is the ongoing growth in North America, which with revenues of almost € 90 million in the first half (+18.4%) currently accounts for 13.1% of the Sogefi Group's total sales
(+2.1 percentage points over last year). The growth in Asia is also extremely important, with revenues up 34% on the first half of 2012. Lastly, the result achieved in the Mercosur area is very positive (+9.2%), with a trend that is 2.3 percentage points better than the market, despite an unfavourable currency effect. In Europe, the Sogefi Group posted revenues of € 443.1 million, a decrease of 6.6% compared with last year, in line with the market trend.
Consolidated EBITDA came to € 71.2 million (10.4% of revenues), up 3.9% compared with € 68.5 million (10% of revenues) in the first half of 2012.
Consolidated EBIT came to € 43.2 million (6.3% of revenues), an increase of 16.6% compared with € 37.1 million (5.4% of revenues) in the first half of 2012. Consolidated shareholders' equity at 30 June 2013, including the portion attributable to minority interests, amounted to € 192 million (€ 200.2 million at 31 December 2012).
Net debt at 30 June 2013 amounted to € 341.1 million versus € 295.8 million at 31 December 2012 and € 311.9 million at 31 March 2013. The increase during the quarter is attributable to the distribution of dividends of € 17.2 million and an increase in working capital due to business expansion in non-European countries.
The Group had 6,727 employees at 30 June 2013 (6,735 at 31 December 2012).
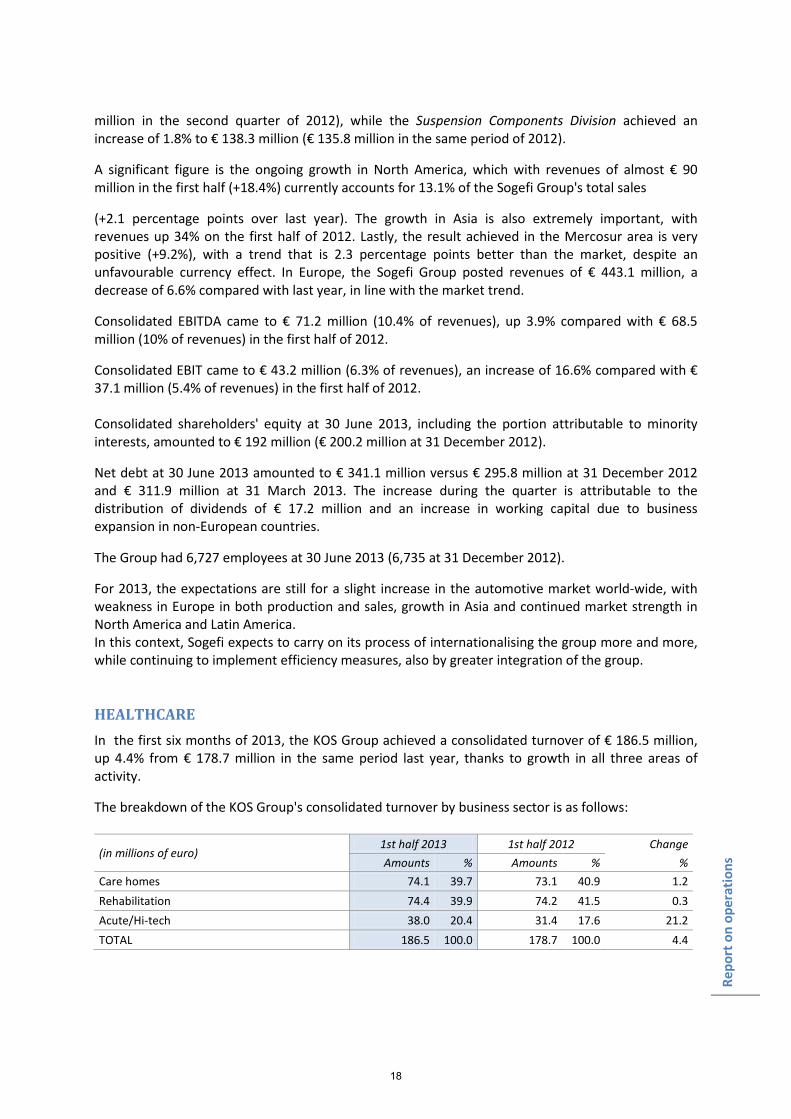
For 2013, the expectations are still for a slight increase in the automotive market world-wide, with weakness in Europe in both production and sales, growth in Asia and continued market strength in North America and Latin America. In this context, Sogefi expects to carry on its process of internationalising the group more and more, while continuing to implement efficiency measures, also by greater integration of the group. HEALTHCARE In the first six months of 2013, the KOS Group achieved a consolidated turnover of € 186.5 million, up 4.4% from € 178.7 million in the same period last year, thanks to growth in all three areas of activity.
The breakdown of the KOS Group's consolidated turnover by business sector is as follows:
(in millions of euro) 1st half 2013 1st half 2012 Change Amounts % Amounts % %
Care homes 74.1 39.7 73.1 40.9 1.2 Rehabilitation 74.4 39.9 74.2 41.5 0.3 Acute/Hi-tech 38.0 20.4 31.4 17.6 21.2 TOTAL 186.5 100.0 178.7 100.0 4.4
18
Repo
rt o
n op
erat
ions
Consolidated EBITDA (earnings before interest, taxes, depreciation and amortisation) came to € 27.4 million, (14.7% of revenues) up on € 25 million of the first six months of 2012, principally because of the change in the scope of consolidation and business developments that took place in 2012.
Consolidated EBIT came to € 16.6 million (8.9% of revenues) versus € 15.2 million (8.5% of revenues) in the same period last year, principally because of the change in the scope of consolidation.
Consolidated net income was € 6.1 million compared with € 4.6 million in the first six months of 2012.
At 30 June 2013 the KOS Group had net debt of € 173.6 million, compared with € 163.4 million at 31 December 2012. The change is mainly due to the increase in working capital and the distribution of dividends.
At 30 June 2013 consolidated equity amounted to € 233.5 million versus € 231.6 million at 31 December 2012.
The Group had 4,264 employees at 30 June 2013 compared with 4,164 at 31 December 2012.
Start-up activities continue in India where the KOS Group set up the ClearMedi Healthcare Ltd joint venture during the second half of 2011. It is held 51% by the KOS Group and 49% by a local company and provides diagnostic and therapeutic technologies to Indian hospitals on an outsourcing basis.
The KOS Group, which at 30 June 2013 was managing 64 facilities, mainly in central and northern Italy, for a total of some 5,865 beds in use, with another 900 being built, operates in three strategic business areas, in turn split into four segments:
1) Care Homes: management of residential care homes for the elderly and psychiatric care communities, with 40 nursing facilities and 9 psychiatric rehabilitation facilities, for a total of 4,230 beds in use (of which 4,034 in care homes);
2) Rehabilitation: management of hospitals and rehabilitation centres, including 14 rehabilitation facilities (with two care homes for the elderly) and 12 hospitals, for a total of 1,505 beds;
3) Hospital management: management of a hospital and hi-tech services in 25 public and private facilities.
5. Non-core investment
These are represented by venture capital, private equity and other investments. VENTURE CAPITAL AND PRIVATE EQUITY CIR Ventures is the corporate venture capital fund through which the CIR Group invests in early-stage companies in high-tech sectors. CIR Ventures' portfolio currently includes investments in four companies, three of which in the United States and one in Israel, operating in the fields of electronics and information and communication technologies (ICT). During the first half of 2013, the fund made a capital repayment of € 1.9 million following a partial divestment by one of its investees, while a
19
Repo
rt o
n op
erat
ions
permanent write-down of € 3.4 million was made on another company. As a result of these movements, the total fair value at 30 June 2013 amounted to € 6.2 million ($ 7.6 million). Through its subsidiary CIR International, the CIR Group manages a diversified portfolio of investments in private equity and venture capital funds, as well as in direct minority holdings. The overall fair value of the portfolio at 30 June 2013, based on the NAV provided by the various funds, came to € 91.4 million. New investments of € 2.3 million were made during the first half, while distributions amounted to € 11.9 million (of which € 6.2 million for capital repayments and € 5.7 million in the form of capital gains). Outstanding commitments at 30 June 2013 amounted to € 9.5 million. OTHER INVESTMENTS Through CIR International, CIR has a stake of approximately 19.5% in SEG (Swiss Education Group), one of the world's leading management training centres for the hospitality industry (restaurants, hotels, etc.), with 5,000 students from 80 different countries enrolled in its five renowned facilities in Switzerland. In the first half of 2013, the SEG Group boosted its turnover compared with the previous year and margins are improving as well. This has been possible thanks to the high number of students, especially as a result of targeted marketing efforts in Asia and, more recently, in Latin America, and the systematic steps taken by management to optimise the cost structure. Moreover, in the education and training sector, on 19 March, the CIR Group acquired, with an investment of € 6.5 million, 100% of Southlands S.r.l., an international school based in Rome with around 500 students representing over 40 different nationalities, with an expected turnover for the year ending 31 August 2013 of approximately € 6 million. The purchase of Southlands S.r.l. is part of a development project in the field of private international schools, which began with the opening of a first school in Lausanne, Switzerland (LLIS Lake Leman International School SA) in 2011. During the first quarter, Nexenti Advisory (formerly Jupiter Finance) focused its servicing functions as an asset advisor in the companies Zeus and Urania, in order to protect and ensure the strategic objectives of its stakeholders. At 30 June 2013 the net value of the CIR Group's investments in activities related to non-performing loans amounted to € 65 million.
20
Repo
rt o
n op
erat
ions
6. Significant events subsequent to 30 June 2013
The section in the report on the performance of the business sectors provides information on the main events that took place after 30 June 2013. 7. Outlook for operations
The performance of the CIR Group in the second half of 2013 will be influenced by how the macroeconomic scenario evolves, especially in the Italian economy, still suffering from a persistent recession whose intensity is hard to predict. In this scenario, all of the Group's main operating subsidiaries will continue to take action to improve operating efficiency, but without giving up their business development initiatives. Consolidated net income for the full year will again be affected by the write-downs made in the first half. 8. Principal risks and uncertainties of the Group
The main risk factors to which the CIR Group is exposed are substantially the same as those that featured in 2012. For a detailed description of these risks, please refer to the information contained in the Report of the Board of Directors which forms part of the financial statements at 31 December 2012. For the risks linked to specific circumstances, please refer to Section 4 "Performance of the business sectors”.
21

Repo
rt o
n op
erat
ions
9. Other information
TRANSACTIONS WITH GROUP COMPANIES AND RELATED PARTIES On 28 October 2010 the Company adopted the Regulations on Related Party Transactions envisaged in Consob Resolution no. 17221 of 12 March 2010, as amended by Resolution no. 17389 of 23 June 2010. This procedure can be found in the Governance section of the Company's website (www.cirgroup.it). The procedure lays down principles of conduct that the Company is required to adopt to ensure that related party transactions are handled properly. This means that it: 1. lays down the criteria and methods of identifying the Company's related parties; 2. establishes principles for identifying related party transactions; 3. governs the procedures for carrying out related party transactions; 4. establishes ways to ensure compliance with the related disclosure requirements. The Board of Directors has also appointed a Related Party Transactions Committee, establishing that its members coincide with those of the Internal Control Committee, except for the system of substitutes envisaged in the procedures.
CIR S.p.A. provided management and strategic support services to its subsidiaries and associates during the half-year, which involved administrative and financial services, the purchase and sale of financial assets and providing guarantees, among other things. Transactions with the parent company consisted of providing administrative and financial services and receiving operational support and communication services. The main concern of CIR and its counterparties in relation to these services is to ensure quality and a high level of efficiency of the services rendered, which derive from CIR's specific knowledge of the Group's business activities. Note that CIR S.p.A. has signed lease contracts with subsidiaries and executives with strategic responsibilities within the Group. The Group's related party transactions are settled at arm's length, taking into consideration the quality and the specific nature of the services provided. See paragraph 27 "Related party transactions” for further details. As regards the main transactions in equity investments, see the appropriate sections of the notes. The CIR Group did not carry out any transactions with related parties, as defined by Consob, or with entities other than related parties that could be considered transactions of an atypical or unusual nature, outwith normal business administration or such as to have a significant impact on the Group's results, assets and liabilities or financial situation.
OTHER The company CIR SpA. – Compagnie Industriali Riunite has its registered office in Via Ciovassino 1, Milan, Italy. CIR shares have been listed on the Milan Stock Exchange since 1973 (Reuters code: CIRX.MI, Bloomberg code: CIR IM). This report for the period 1 January-30 June 2013 was approved by the Board of Directors on 29 July 2013. CIR S.p.A. is subject to management and coordination by Cofide – Gruppo De Benedetti S.p.A.
22

23
CIR GROUP
CONSOLIDATED FINANCIAL STATEMENTS AS OF 30 JUNE 2013
CONSOLIDATED STATEMENT OF FINANCIAL POSITION
CONSOLIDATED INCOME STATEMENT
CONSOLIDATED STATEMENT OF COMPREHENSIVE INCOME
CONSOLIDATED STATEMENT OF CASH FLOW
CONSOLIDATED STATEMENT OF CHANGES IN EQUITY
EXPLANATORY NOTES
24
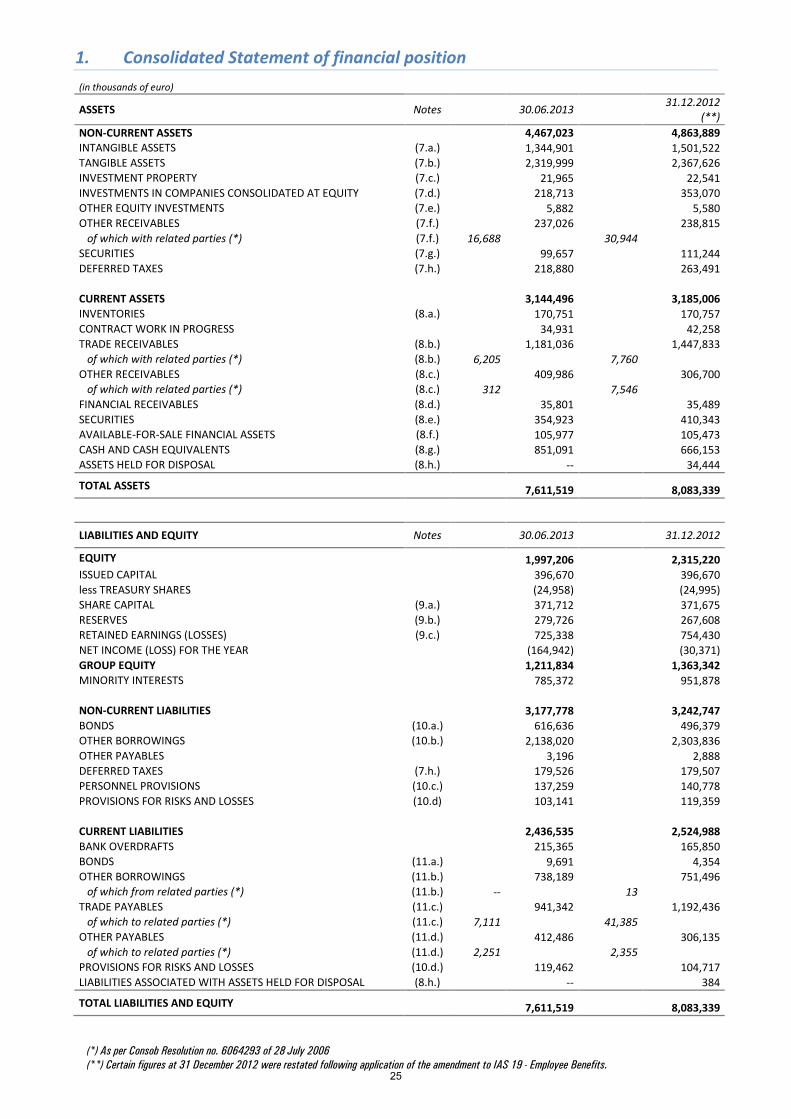
1. Consolidated Statement of financial position (in thousands of euro)
ASSETS Notes 30.06.2013 31.12.2012
(**) NON-CURRENT ASSETS 4,467,023 4,863,889 INTANGIBLE ASSETS (7.a.) 1,344,901 1,501,522 TANGIBLE ASSETS (7.b.) 2,319,999 2,367,626 INVESTMENT PROPERTY (7.c.) 21,965 22,541 INVESTMENTS IN COMPANIES CONSOLIDATED AT EQUITY (7.d.) 218,713 353,070 OTHER EQUITY INVESTMENTS (7.e.) 5,882 5,580 OTHER RECEIVABLES (7.f.) 237,026 238,815 of which with related parties (*) (7.f.) 16,688
30,944
SECURITIES (7.g.) 99,657 111,244 DEFERRED TAXES (7.h.) 218,880 263,491
CURRENT ASSETS 3,144,496 3,185,006 INVENTORIES (8.a.) 170,751 170,757 CONTRACT WORK IN PROGRESS 34,931 42,258 TRADE RECEIVABLES (8.b.) 1,181,036 1,447,833 of which with related parties (*) (8.b.) 6,205
7,760
OTHER RECEIVABLES (8.c.) 409,986 306,700 of which with related parties (*) (8.c.) 312
7,546
FINANCIAL RECEIVABLES (8.d.) 35,801 35,489 SECURITIES (8.e.) 354,923 410,343 AVAILABLE-FOR-SALE FINANCIAL ASSETS (8.f.) 105,977 105,473 CASH AND CASH EQUIVALENTS (8.g.) 851,091 666,153 ASSETS HELD FOR DISPOSAL (8.h.) -- 34,444
TOTAL ASSETS 7,611,519 8,083,339
LIABILITIES AND EQUITY Notes 30.06.2013 31.12.2012
EQUITY 1,997,206 2,315,220 ISSUED CAPITAL 396,670 396,670 less TREASURY SHARES (24,958) (24,995) SHARE CAPITAL (9.a.) 371,712 371,675 RESERVES (9.b.) 279,726 267,608 RETAINED EARNINGS (LOSSES) (9.c.) 725,338 754,430 NET INCOME (LOSS) FOR THE YEAR (164,942) (30,371) GROUP EQUITY 1,211,834 1,363,342 MINORITY INTERESTS 785,372 951,878
NON-CURRENT LIABILITIES 3,177,778 3,242,747 BONDS (10.a.) 616,636 496,379 OTHER BORROWINGS (10.b.) 2,138,020 2,303,836 OTHER PAYABLES 3,196 2,888 DEFERRED TAXES (7.h.) 179,526 179,507 PERSONNEL PROVISIONS (10.c.) 137,259 140,778 PROVISIONS FOR RISKS AND LOSSES (10.d) 103,141 119,359
CURRENT LIABILITIES 2,436,535 2,524,988 BANK OVERDRAFTS 215,365 165,850 BONDS (11.a.)
9,691
4,354
OTHER BORROWINGS (11.b.)
738,189
751,496 of which from related parties (*) (11.b.) --
13
TRADE PAYABLES (11.c.) 941,342 1,192,436 of which to related parties (*) (11.c.) 7,111
41,385
OTHER PAYABLES (11.d.) 412,486 306,135 of which to related parties (*) (11.d.) 2,251
2,355
PROVISIONS FOR RISKS AND LOSSES (10.d.) 119,462 104,717 LIABILITIES ASSOCIATED WITH ASSETS HELD FOR DISPOSAL (8.h.)
--
384
TOTAL LIABILITIES AND EQUITY 7,611,519 8,083,339
(*) As per Consob Resolution no. 6064293 of 28 July 2006 (**) Certain figures at 31 December 2012 were restated following application of the amendment to IAS 19 - Employee Benefits.
25
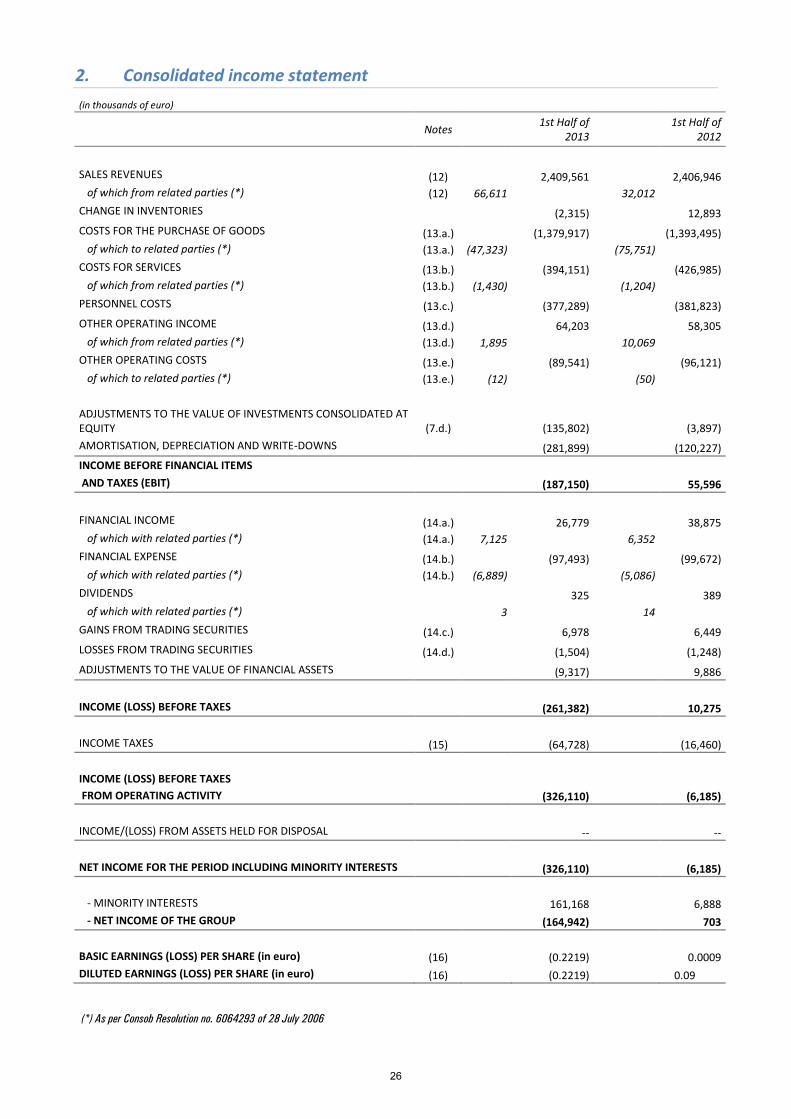
2. Consolidated income statement (in thousands of euro)
Notes 1st Half of
2013 1st Half of 2012
SALES REVENUES (12)
2,409,561
2,406,946 of which from related parties (*) (12) 66,611
32,012
CHANGE IN INVENTORIES
(2,315)
12,893 COSTS FOR THE PURCHASE OF GOODS (13.a.)
(1,379,917)
(1,393,495)
of which to related parties (*) (13.a.) (47,323)
(75,751) COSTS FOR SERVICES (13.b.)
(394,151)
(426,985)
of which from related parties (*) (13.b.) (1,430)
(1,204) PERSONNEL COSTS (13.c.)
(377,289)
(381,823)
OTHER OPERATING INCOME (13.d.)
64,203
58,305 of which from related parties (*) (13.d.) 1,895
10,069
OTHER OPERATING COSTS (13.e.)
(89,541)
(96,121) of which to related parties (*) (13.e.) (12)
(50)
ADJUSTMENTS TO THE VALUE OF INVESTMENTS CONSOLIDATED AT EQUITY (7.d.)
(135,802)
(3,897)
AMORTISATION, DEPRECIATION AND WRITE-DOWNS
(281,899)
(120,227) INCOME BEFORE FINANCIAL ITEMS AND TAXES (EBIT) (187,150) 55,596
FINANCIAL INCOME (14.a.)
26,779
38,875 of which with related parties (*) (14.a.) 7,125
6,352
FINANCIAL EXPENSE (14.b.)
(97,493)
(99,672) of which with related parties (*) (14.b.) (6,889)
(5,086)
DIVIDENDS
325
389 of which with related parties (*)
3
14
GAINS FROM TRADING SECURITIES (14.c.)
6,978
6,449 LOSSES FROM TRADING SECURITIES (14.d.)
(1,504)
(1,248)
ADJUSTMENTS TO THE VALUE OF FINANCIAL ASSETS
(9,317)
9,886
INCOME (LOSS) BEFORE TAXES (261,382) 10,275
INCOME TAXES (15)
(64,728)
(16,460)
INCOME (LOSS) BEFORE TAXES FROM OPERATING ACTIVITY (326,110) (6,185)
INCOME/(LOSS) FROM ASSETS HELD FOR DISPOSAL
--
--
NET INCOME FOR THE PERIOD INCLUDING MINORITY INTERESTS (326,110) (6,185)
- MINORITY INTERESTS
161,168
6,888 - NET INCOME OF THE GROUP (164,942) 703
BASIC EARNINGS (LOSS) PER SHARE (in euro) (16)
(0.2219)
0.0009 DILUTED EARNINGS (LOSS) PER SHARE (in euro) (16) (0.2219) 0.09
(*) As per Consob Resolution no. 6064293 of 28 July 2006
26
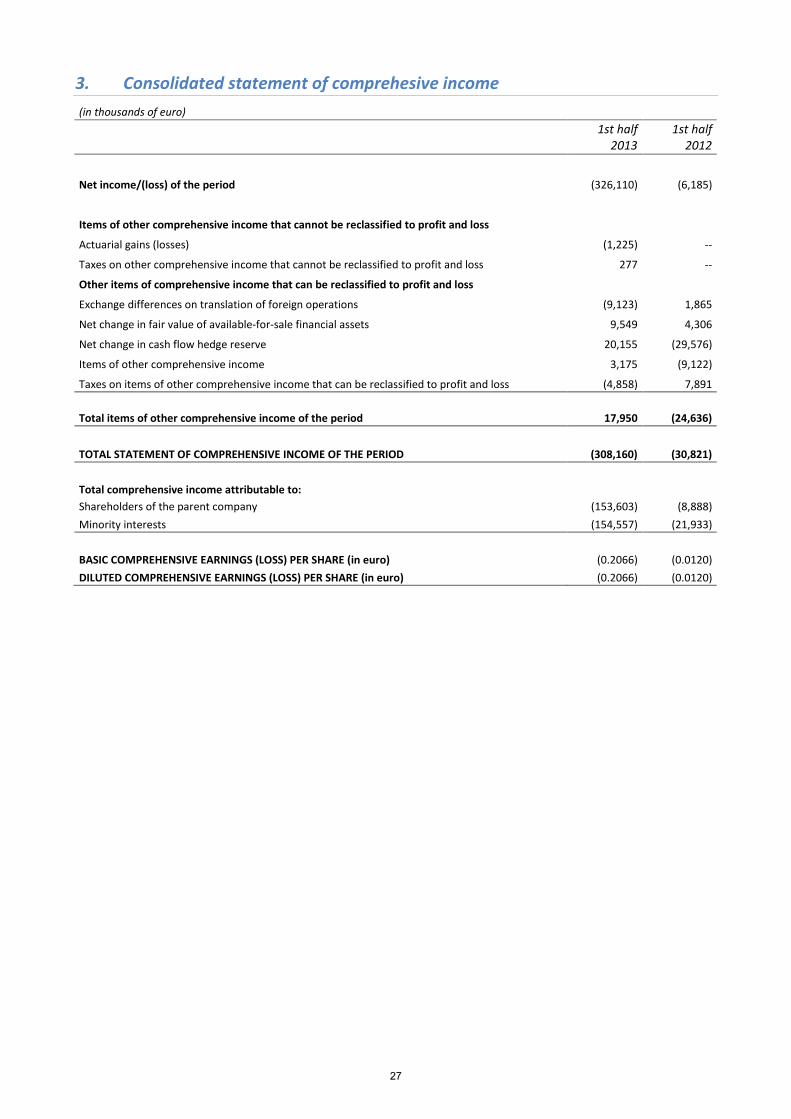
3. Consolidated statement of comprehesive income (in thousands of euro)
1st half
2013 1st half
2012
Net income/(loss) of the period (326,110) (6,185)
Items of other comprehensive income that cannot be reclassified to profit and loss Actuarial gains (losses) (1,225) --
Taxes on other comprehensive income that cannot be reclassified to profit and loss 277 --
Other items of comprehensive income that can be reclassified to profit and loss Exchange differences on translation of foreign operations (9,123) 1,865
Net change in fair value of available-for-sale financial assets 9,549 4,306
Net change in cash flow hedge reserve 20,155 (29,576)
Items of other comprehensive income 3,175 (9,122)
Taxes on items of other comprehensive income that can be reclassified to profit and loss (4,858) 7,891 Total items of other comprehensive income of the period 17,950 (24,636)
TOTAL STATEMENT OF COMPREHENSIVE INCOME OF THE PERIOD (308,160) (30,821)
Total comprehensive income attributable to: Shareholders of the parent company (153,603) (8,888)
Minority interests (154,557) (21,933)
BASIC COMPREHENSIVE EARNINGS (LOSS) PER SHARE (in euro) (0.2066) (0.0120) DILUTED COMPREHENSIVE EARNINGS (LOSS) PER SHARE (in euro) (0.2066) (0.0120)
27
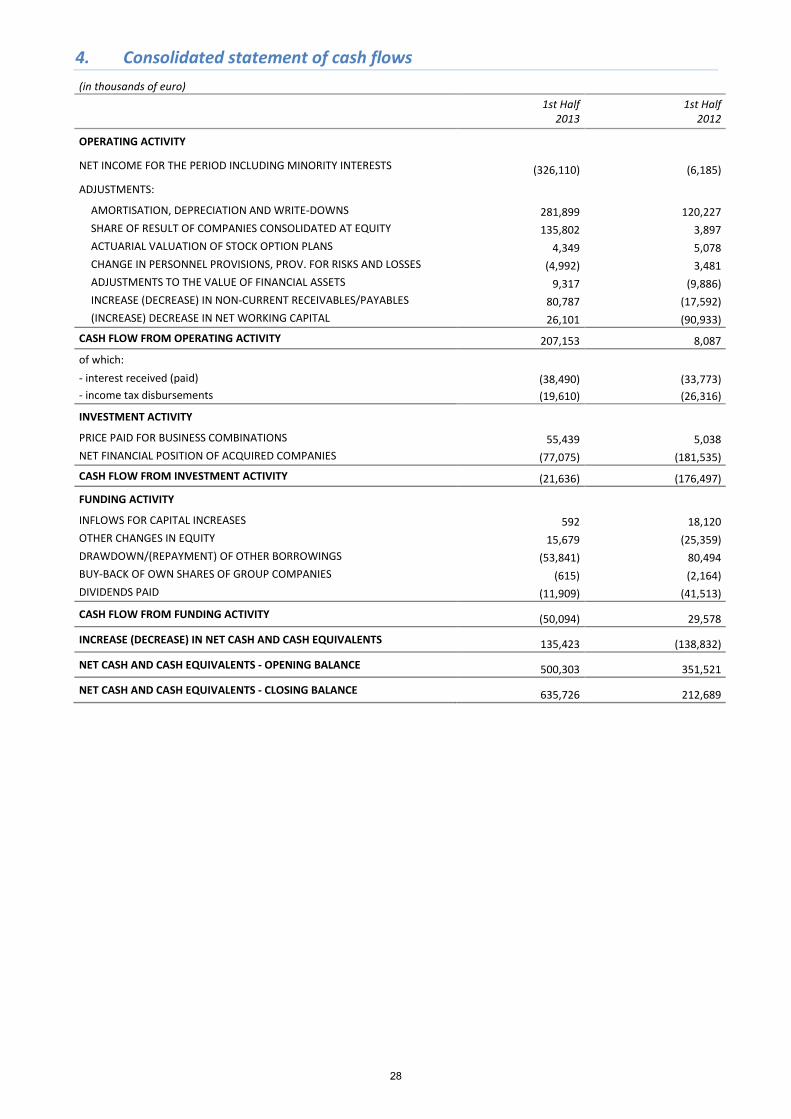
4. Consolidated statement of cash flows (in thousands of euro)
1st Half
2013 1st Half
2012
OPERATING ACTIVITY
NET INCOME FOR THE PERIOD INCLUDING MINORITY INTERESTS (326,110) (6,185)
ADJUSTMENTS:
AMORTISATION, DEPRECIATION AND WRITE-DOWNS 281,899 120,227 SHARE OF RESULT OF COMPANIES CONSOLIDATED AT EQUITY 135,802 3,897 ACTUARIAL VALUATION OF STOCK OPTION PLANS 4,349 5,078 CHANGE IN PERSONNEL PROVISIONS, PROV. FOR RISKS AND LOSSES (4,992) 3,481 ADJUSTMENTS TO THE VALUE OF FINANCIAL ASSETS 9,317 (9,886) INCREASE (DECREASE) IN NON-CURRENT RECEIVABLES/PAYABLES 80,787 (17,592) (INCREASE) DECREASE IN NET WORKING CAPITAL 26,101 (90,933)
CASH FLOW FROM OPERATING ACTIVITY 207,153 8,087 of which:
- interest received (paid) (38,490) (33,773) - income tax disbursements (19,610) (26,316)
INVESTMENT ACTIVITY
PRICE PAID FOR BUSINESS COMBINATIONS 55,439 5,038 NET FINANCIAL POSITION OF ACQUIRED COMPANIES (77,075) (181,535) CASH FLOW FROM INVESTMENT ACTIVITY (21,636) (176,497)
FUNDING ACTIVITY
INFLOWS FOR CAPITAL INCREASES 592 18,120 OTHER CHANGES IN EQUITY 15,679 (25,359) DRAWDOWN/(REPAYMENT) OF OTHER BORROWINGS (53,841) 80,494 BUY-BACK OF OWN SHARES OF GROUP COMPANIES (615) (2,164) DIVIDENDS PAID (11,909) (41,513)
CASH FLOW FROM FUNDING ACTIVITY (50,094) 29,578
INCREASE (DECREASE) IN NET CASH AND CASH EQUIVALENTS 135,423 (138,832)
NET CASH AND CASH EQUIVALENTS - OPENING BALANCE 500,303 351,521
NET CASH AND CASH EQUIVALENTS - CLOSING BALANCE 635,726 212,689
28
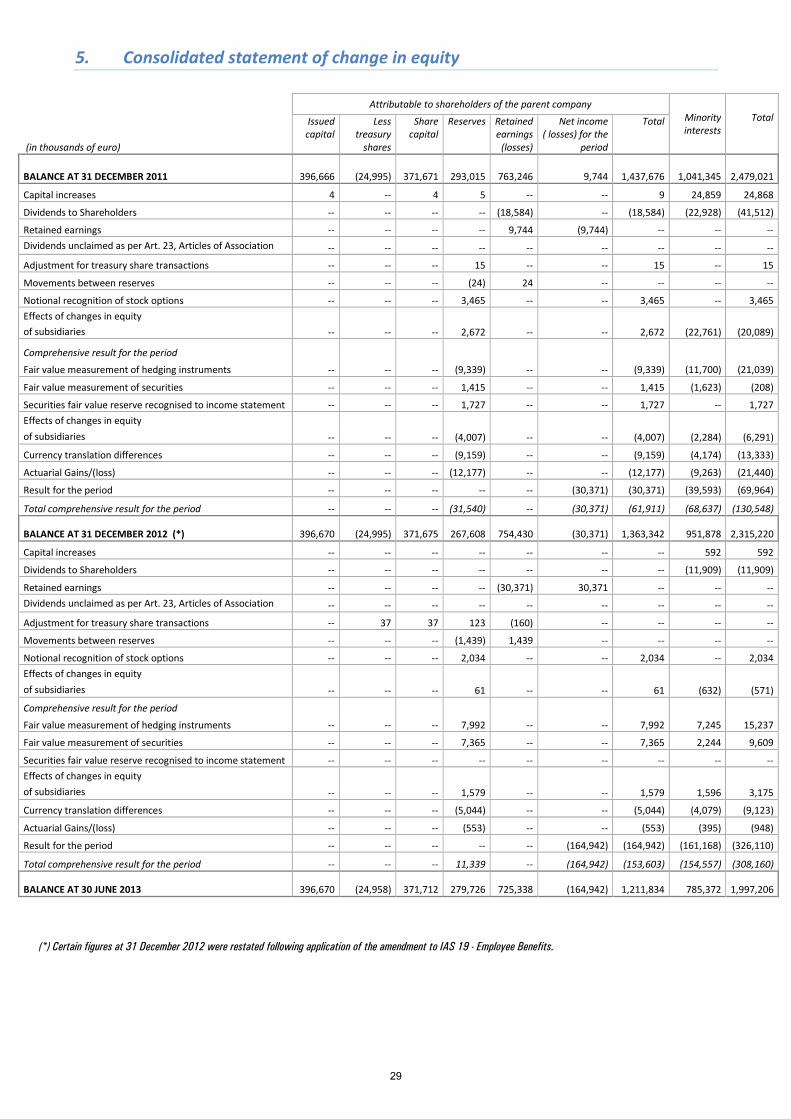
5. Consolidated statement of change in equity
Attributable to shareholders of the parent company
Minority interests
Total
(in thousands of euro)
Issued capital
Less treasury
shares
Share capital
Reserves Retained earnings
(losses)
Net income ( losses) for the
period
Total
BALANCE AT 31 DECEMBER 2011 396,666 (24,995) 371,671 293,015 763,246 9,744 1,437,676 1,041,345 2,479,021
Capital increases 4 -- 4 5 -- -- 9 24,859 24,868
Dividends to Shareholders -- -- -- -- (18,584) -- (18,584) (22,928) (41,512)
Retained earnings -- -- -- -- 9,744 (9,744) -- -- -- Dividends unclaimed as per Art. 23, Articles of Association -- -- -- -- -- -- -- -- --
Adjustment for treasury share transactions -- -- -- 15 -- -- 15 -- 15
Movements between reserves -- -- -- (24) 24 -- -- -- --
Notional recognition of stock options -- -- -- 3,465 -- -- 3,465 -- 3,465 Effects of changes in equity of subsidiaries -- -- -- 2,672 -- -- 2,672 (22,761) (20,089)
Comprehensive result for the period
Fair value measurement of hedging instruments -- -- -- (9,339) -- -- (9,339) (11,700) (21,039)
Fair value measurement of securities -- -- -- 1,415 -- -- 1,415 (1,623) (208)
Securities fair value reserve recognised to income statement -- -- -- 1,727 -- -- 1,727 -- 1,727 Effects of changes in equity of subsidiaries -- -- -- (4,007) -- -- (4,007) (2,284) (6,291)
Currency translation differences -- -- -- (9,159) -- -- (9,159) (4,174) (13,333)
Actuarial Gains/(loss) -- -- -- (12,177) -- -- (12,177) (9,263) (21,440)
Result for the period -- -- -- -- -- (30,371) (30,371) (39,593) (69,964)
Total comprehensive result for the period -- -- -- (31,540) -- (30,371) (61,911) (68,637) (130,548)
BALANCE AT 31 DECEMBER 2012 (*) 396,670 (24,995) 371,675 267,608 754,430 (30,371) 1,363,342 951,878 2,315,220
Capital increases -- -- -- -- -- -- -- 592 592
Dividends to Shareholders -- -- -- -- -- -- -- (11,909) (11,909)
Retained earnings -- -- -- -- (30,371) 30,371 -- -- -- Dividends unclaimed as per Art. 23, Articles of Association -- -- -- -- -- -- -- -- --
Adjustment for treasury share transactions -- 37 37 123 (160) -- -- -- --
Movements between reserves -- -- -- (1,439) 1,439 -- -- -- --
Notional recognition of stock options -- -- -- 2,034 -- -- 2,034 -- 2,034 Effects of changes in equity of subsidiaries -- -- -- 61 -- -- 61 (632) (571)
Comprehensive result for the period
Fair value measurement of hedging instruments -- -- -- 7,992 -- -- 7,992 7,245 15,237
Fair value measurement of securities -- -- -- 7,365 -- -- 7,365 2,244 9,609
Securities fair value reserve recognised to income statement -- -- -- -- -- -- -- -- -- Effects of changes in equity of subsidiaries -- -- -- 1,579 -- -- 1,579 1,596 3,175
Currency translation differences -- -- -- (5,044) -- -- (5,044) (4,079) (9,123)
Actuarial Gains/(loss) -- -- -- (553) -- -- (553) (395) (948)
Result for the period -- -- -- -- -- (164,942) (164,942) (161,168) (326,110)
Total comprehensive result for the period -- -- -- 11,339 -- (164,942) (153,603) (154,557) (308,160)
BALANCE AT 30 JUNE 2013 396,670 (24,958) 371,712 279,726 725,338 (164,942) 1,211,834 785,372 1,997,206
(*) Certain figures at 31 December 2012 were restated following application of the amendment to IAS 19 - Employee Benefits.
29
Cons
olid
ated
fin
anci
al s
tate
men
ts
6. Explanatory notes
1. Structure and content of the financial statements
The Group's consolidated financial statements have been prepared in accordance with the International Financial Reporting Standards issued by the International Accounting Standards Board (IASB) and endorsed by the European Community pursuant to Regulation no. 1606/2002. These interim financial statements have been prepared on a condensed basis in accordance with IAS 34 "Interim Financial Reporting”. Being condensed, they do not include all of the information required for annual reports and should be read in conjunction with the financial statements for the year ended 31 December 2012. The consolidated financial statements at 30 June 2013 include the parent company CIR S.p.A. (hereinafter “CIR”) and its subsidiaries, and were prepared using the accounts of the individual companies included in the scope of consolidation; these correspond to their separate interim financial statements or the consolidated statements of sub-groups, examined and approved by their respective boards and amended and re-stated where necessary to bring them into line with the accounting principles listed below and, where compatible, with Italian regulations. It should also be noted that some valuation processes, particularly the more complex ones such as the determination of impairment of non-current assets, are generally carried out only when preparing the annual financial statements, when all the necessary information is more likely to be available with a reasonable degree of accuracy, except in cases where there are indications of impairment that requires an immediate assessment of any permanent losses. Income taxes are recognised on the basis of the best estimate of the weighted average tax rate for the entire year. As reported in the section "Adoption of new accounting standards, interpretations and amendments", an amendment to IAS 19 Employee Benefits came into force on 1 January 2013. In accordance with the provisions of IAS 8 "Accounting policies, changes in accounting estimates and errors", retrospective application of the amendment was carried by adjusting equity at 31 December 2012. These entries led to a reduction in shareholders' equity of the Group and minority interests of € 10 million and € 7 million respectively. These financial statements have been prepared in thousands of euro, which is the Group's "functional" and "presentation" currency in accordance with IAS 21, except where indicated otherwise.
30
Cons
olid
ated
fin
anci
al s
tate
men
ts
2. Consolidation principles
2.a.Consolidation methods
All companies where the Group exercises control according to IAS 27, SIC 12 and IFRIC 2 are considered subsidiaries. More specifically, subsidiaries are all those companies and investment funds where the Group has decision-making powers in matters of financial and operating policy. Such powers are presumed to exist when the Group holds a majority of a company's voting rights, including any voting rights that are potentially exercisable without any restrictions or where it has effective control over Shareholders' Meetings, despite not having a majority of the voting rights. Subsidiaries are fully consolidated from the date on which the Group takes control and are de-consolidated when such control ceases to exist. Consolidation is on a line-by-line basis. The main criteria used when applying this method are the following: - the carrying value of each investment is eliminated against the Group's share of its equity and the
difference between the acquisition cost and net equity of investee companies is posted, where appropriate, to the asset and liability items included in the consolidation. If there is a balance left over, it is posted to income if negative or to assets as goodwill if positive. Goodwill is tested for impairment based on its recoverable value;
- significant transactions between consolidated companies are eliminated on consolidation, as are receivables and payables and unrealised profits on transactions between Group companies, net of tax;
- minority interests in equity and the net result for the period are shown separately in the consolidated statement of financial position and income statement.
Associates All companies in which the Group has a significant influence, without having control, in accordance with IAS 28, are considered associates. Significant influence is presumed to exist when the Group has between 20% and 50% of the voting rights (excluding cases of joint control). Associates are consolidated using the equity method from the date on which the Group acquires significant influence in the associate and are de-consolidated from the moment when this influence no longer exists. The main criteria used when applying the equity method are the following: - the carrying value of each investment is eliminated against the Group's share of its equity and any positive difference identified at the time of the acquisition, net of any impairment; the corresponding share of the net income or loss for the period is posted to the income statement. If the Group's portion of the associate's accumulated losses exceeds the carrying value of the investment, the investment is written off and any further losses are not recorded, unless the Group has a contractual obligation to do so; - any unrealised gains and losses generated by transactions between Group companies are eliminated, except where the losses reflect impairment of the associate's assets; - the accounting policies of associates are amended, where necessary, to bring them into line with those of the Group. Joint ventures All companies that the Group controls together with another company according to IAS 31 are considered joint ventures. Joint control is presumed to exist when the Group owns 50% of a company's voting rights.
31
Cons
olid
ated
fin
anci
al s
tate
men
ts
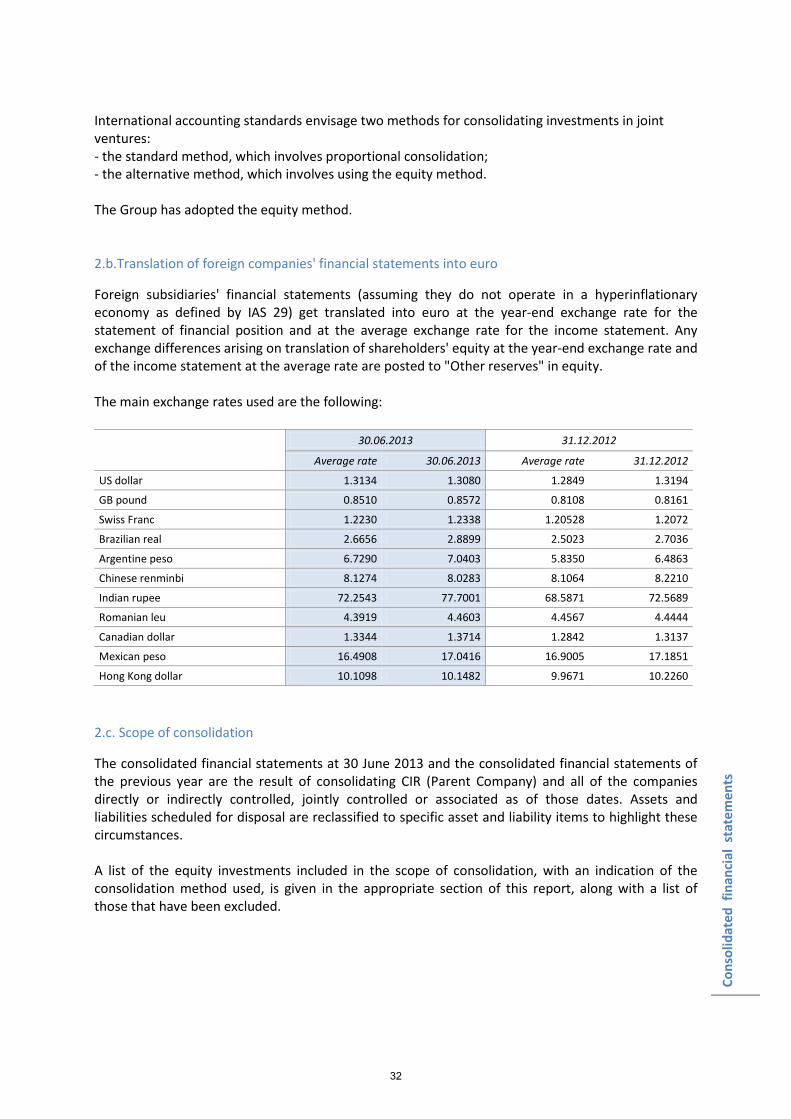
International accounting standards envisage two methods for consolidating investments in joint ventures: - the standard method, which involves proportional consolidation; - the alternative method, which involves using the equity method. The Group has adopted the equity method. 2.b.Translation of foreign companies' financial statements into euro
Foreign subsidiaries' financial statements (assuming they do not operate in a hyperinflationary economy as defined by IAS 29) get translated into euro at the year-end exchange rate for the statement of financial position and at the average exchange rate for the income statement. Any exchange differences arising on translation of shareholders' equity at the year-end exchange rate and of the income statement at the average rate are posted to "Other reserves" in equity. The main exchange rates used are the following: 30.06.2013 31.12.2012
Average rate 30.06.2013 Average rate 31.12.2012
US dollar 1.3134 1.3080 1.2849 1.3194
GB pound 0.8510 0.8572 0.8108 0.8161
Swiss Franc 1.2230 1.2338 1.20528 1.2072
Brazilian real 2.6656 2.8899 2.5023 2.7036
Argentine peso 6.7290 7.0403 5.8350 6.4863
Chinese renminbi 8.1274 8.0283 8.1064 8.2210
Indian rupee 72.2543 77.7001 68.5871 72.5689
Romanian leu 4.3919 4.4603 4.4567 4.4444
Canadian dollar 1.3344 1.3714 1.2842 1.3137
Mexican peso 16.4908 17.0416 16.9005 17.1851
Hong Kong dollar 10.1098 10.1482 9.9671 10.2260
2.c. Scope of consolidation
The consolidated financial statements at 30 June 2013 and the consolidated financial statements of the previous year are the result of consolidating CIR (Parent Company) and all of the companies directly or indirectly controlled, jointly controlled or associated as of those dates. Assets and liabilities scheduled for disposal are reclassified to specific asset and liability items to highlight these circumstances. A list of the equity investments included in the scope of consolidation, with an indication of the consolidation method used, is given in the appropriate section of this report, along with a list of those that have been excluded.
32

Cons
olid
ated
fin
anci
al s
tate
men
ts
2.d.Changes in the scope of consolidation
The main changes in the scope of consolidation compared with the previous year concern the following: ENERGY During the first half of 2013, the Group saw the following changes in its scope of consolidation as the following companies are no longer consolidated: - Sorgenia E&P Bulgaria EOOD, as the liquidation procedure was completed;
- Sorgenia USA LLC, as the company has been wound up;
- Sorgenia E&P UK Ltd, as it was sold in April 2013;
- PVP 1 Srl, as it was sold in May 2013.
The following changes in the scope of consolidation have also taken place: - Bisaccia Wind Srl, previously accounted for at cost, is now consolidated on a line-by-line basis
following acquisition of control;
- P&F Società agricola a responsabilità limitata Srl, previously accounted for under the equity method, is now measured at cost as the value of the investment has become immaterial.
During the period, the following company changed its name: - LISI BV (formerly Sorgenia Poland BV). MEDIA The scope of consolidation was changed following the acquisition on 8 February 2013 from Ibs.it (Messaggerie Italiane) of 51% of Mo-Net Srl, owner of MYmovies.it, Italian leader in the vertical market for films and cinema. AUTOMOTIVE COMPONENTS During the first half of 2013, Allevard Rejna Autosuspensions SA increased its stake in Allevard IAI Suspensions Pvt Ltd from 54.91% to 65.20%. There were no other changes in the scope of consolidation during the period. HEALTHCARE The following transactions involving a change in the scope of consolidation took place during the first half of the year: In the Rehabilitation sector (Istituto di Riabilitazione Santo Stefano S.r.l.), May saw the formalisation of the joint venture agreement signed in 2012 with Apollo Hospital Enterprise Limited, the leading Indian operator in the management of private hospitals in India and Asia. The purpose of the JV (APOKOS Rehab PVT Ltd) is to create rehabilitation centres in India, following the positive outcome of a pilot project that lasted 12 months from the start of the activity. OTHER COMPANIES CIR S.p.A. has raised its stake in LLIS Lake Leman International School SA. from 66.39% to 83.26% as a result of increases in capital. LLIS Italia Srl was set up as a wholly-owned subsidiary of LLIS Lake Leman International School SA in January 2013 and on 19 March 2013 it acquired 100% of Southlands Srl, an international school located in Rome.
33
Cons
olid
ated
fin
anci
al s
tate
men
ts
3. Accounting policies
3.a.Intangible assets (IAS 38)
Intangible assets are recognised only if they can be separately identified, if it is likely that they will generate future economic benefits and if the cost can be measured reliably. Intangible assets with a finite useful life are valued at purchase or production cost, net of amortisation and accumulated impairment. Intangible assets are initially recognised at purchase or production cost. Purchase cost is represented by the fair value of the means of payment used to purchase the asset and any additional direct cost incurred to prepare the asset for use. The purchase cost is the equivalent price in cash at the date of recognition; where payment is deferred beyond normal terms of credit, the difference compared with the cash price is recognised as interest for the whole period of deferment. Amortisation is calculated on a straight-line basis over the expected useful life of the asset and starts when the asset is ready for use. Intangible assets with an indefinite useful life are not amortised, but monitored constantly for impairment. It is mainly the Espresso Group's newspaper/magazine titles and TV/radio frequencies that are considered intangible assets with an indefinite useful life. The carrying value of intangible assets is maintained to the extent that there is evidence that this value can be recovered through use; to this end, an impairment test is carried out at least once a year to check that the intangible asset is able to generate future cash flows. Development costs are recognised as intangible assets when their cost can be measured reliably, when there is a reasonable assumption that the asset can be made available for use or for sale and that it is able to generate future benefits. Once a year or any time it appears to be justified, capitalised costs are impairment tested. Research costs are charged to the income statement as and when they are incurred. Trademarks and licences, which are initially recognised at cost, are subsequently accounted for net of amortisation and accumulated impairment. The period of amortisation is defined as the lower of the contractual duration for use of the licence and the useful life of the asset. Software licences, including associated costs, are recognised at cost and are recorded net of amortisation and any accumulated impairment. The "customer relationship" represents the value assigned during the purchase price allocation process to the customer portfolio of the Systèmes Moteurs Group at the date of acquisition of control. The "name" represents the value assigned during the purchase price allocation process to the name "Systèmes Moteurs" at the date of acquisition of control. Goodwill In the event of the acquisition of companies, the identifiable assets, liabilities and contingent liabilities acquired are recognised at their fair value as at the acquisition date. The positive difference between the acquisition cost and the Group's share of the fair value of these assets and liabilities is classified as goodwill and recorded in the statement of financial position as an intangible asset. Any negative difference ("badwill") is posted to the income statement at the time of acquisition. After initial recognition, goodwill is measured at cost less any accumulated impairment. Goodwill always refers to identified income-producing assets, whose ability to generate income and cash flow is monitored constantly for impairment. See paragraph 3.x. below (Business Combinations and Goodwill).
34
Cons
olid
ated
fin
anci
al s
tate
men
ts
3.b.Tangible assets (IAS 16)
Tangible assets are recognised at purchase price or production cost, net of accumulated depreciation. Cost includes associated expenses and any direct and indirect costs incurred at the time of acquisition and needed to make the asset ready for use. Financial charges relating to specific loans for long-term investments are capitalised up to the date when the assets become operational. When there are contractual or compulsory obligations for decommissioning, removing or clearing sites where fixed assets are installed, the value recognised also includes a discounted estimate of the costs that will be incurred for their disposal. Fixed assets are depreciated each year on a straight-line basis over the residual useful life of the assets. Land, assets under construction and advance payments are not depreciated. Land and buildings not used for corporate operating purposes are classified under a separate asset item and accounted for on the basis of IAS 40 "Investment property" (see paragraph 3.e. below). In the event of circumstances that suggest that an asset has been impaired, its carrying value is checked against its recoverable value (i.e. fair value or value in use, whichever is the higher). Fair value can be established on the basis of values expressed by an active market, recent transactions or the best information available at the time with a view to determining the potential proceeds of selling the asset. Value in use is determined by discounting the cash flows expected from using the asset, applying best estimates of its residual useful life and a rate that takes into account the implicit risk of the specific business sectors in which the Group operates. This valuation is carried out for each individual asset or for the smallest identifiable cash generating unit (CGU). If there is a negative difference between these values and the carrying value, the asset gets written down; if subsequently the reasons for the impairment no longer apply, the asset is revalued. Such write-downs and revaluations are posted to the income statement. 3.c.Government grants
Government grants are recognised when there is a reasonable degree of certainty that the recipient will comply with the conditions for the grant, whether or not there is a formal resolution awarding it; in other words, when it is highly likely that the grant will be received. Capital grants are recognised in the statement of financial position either as deferred income, which is then transferred to the income statement over the useful life of the asset being financed, thereby reducing the depreciation charge, or by deducting them directly from the asset in question. Government grants obtainable in the form of a reimbursement of expenses and costs already incurred or to provide immediate support for the recipient without there being any future costs related to the grant, are recognised as income in the period in which they can be claimed.
35
Cons
olid
ated
fin
anci
al s
tate
men
ts
3.d.Leased assets (IAS 17)
Lease contracts for assets where the lessee substantially assumes all the risks and rewards of ownership are classified as finance leases. Where such finance leases exist, the asset is recognised at the lower of its fair value and the present value of the minimum lease payments stipulated in the contracts. Total lease payments are allocated between the financial element and the capital to be reimbursed in such a way as to obtain a constant rate of interest on the outstanding debt. The residual lease payments, net of financial charges, are classified as borrowings. The interest expense is charged to the income statement over the period of the lease. Assets acquired under finance leases are depreciated to an extent consistent with the nature of the asset. Lease contracts in which the lessor substantially retains the risks and rewards of ownership, on the other hand, are classified as operating leases and payments made under such leases are charged to the income statement on a straight-line basis over the period of the lease. In the event of a sale and leaseback agreement, any difference between the selling price and the carrying value of the asset is not recognised to the income statement unless the asset itself suffers an impairment loss. 3.e.Investment property (IAS 40)
Investment property is property (land or a building, or part of a building, or both) held (by the owner or by the lessee under a finance lease) to earn rentals or for capital appreciation or both, rather than for use in the production or supply of goods or services or for administrative purposes, or for sale in the ordinary course of business. The cost of an investment property is represented by its purchase price, as well as any improvements, replacements and extraordinary maintenance. For self-constructed investment property, an estimate is made of all costs incurred up to the date on which the construction or development is finished. Until that date, IAS 16 applies. In the case of an asset held under a finance lease, the initial cost is determined according to IAS 17 as the lower of the fair value of the property and the present value of the minimum lease payments due. The Group has opted for the cost method to be applied to all investment property held. Under the cost method, the value is measured net of depreciation and any impairment losses. On disposal or when the asset is permanently withdrawn from use, all related income and expenses must be charged to the income statement. 3.f.Impairment of intangible and tangible assets (IAS 36)
At least once a year the Group verifies whether the carrying value of intangible and tangible assets (including capitalised development costs) are recoverable, in order to determine whether the assets have suffered impairment. If such evidence exists, the carrying value of the assets is reduced to its recoverable value. An intangible asset with an indefinite useful life is tested for impairment at least once a year; more frequently if there is any sign that it may have suffered a loss in value. When it is not possible to estimate the recoverable value of an individual asset, the Group estimates the recoverable value of the cash generating unit to which the asset belongs. The recoverable value of an asset is the higher of its fair value less costs to sell and its value in use. To determine the value in use of an asset, the Group calculates the present value of estimated future cash flows, applying a discount rate that is consistent with the cash flows and which reflects the
36
Cons
olid
ated
fin
anci
al s
tate
men
ts
current market assessment of the time value of money and the specific risks of the business sector. An impairment loss is recognised if the recoverable value is lower than the carrying value. If at a later date the loss on an asset (other than goodwill) no longer exists or is less than it was, the carrying value of the asset or of the cash generating unit is written up to the new estimated recoverable value, though it cannot exceed the value that it would have had if no impairment loss had been recognised. The reversal of an impairment loss is posted immediately to the income statement. 3.g.Other investments
Investments in companies where the Parent Company does not exercise a significant influence are accounted for in accordance with IAS 39, which means that they are classified as available for sale and measured at fair value, or at cost if the fair value or market price cannot be reliably estimated. 3.h.Receivables and payables (IAS 32, 39 and 21)
Receivables and payables are initially recognised at their fair value, which usually corresponds to the nominal value. Receivables are adjusted, where necessary, to their estimated realisable value. Subsequently, receivables and payables are measured at amortised cost. Receivables and payables in foreign currencies are initially accounted for at the rates of exchange in force on the transaction date. They are then adjusted to the period-end exchange rates and any exchange gains and losses are recognised to the income statement (see paragraph 3.u. below). 3.i.Securities (IAS 32 and 39)
In accordance with IAS 32 and IAS 39, investments in companies other than subsidiaries and associates are classified as available-for-sale financial assets and measured at fair value. Gains and losses resulting from fair value adjustments are recorded in a special equity reserve. In the event of impairment losses or when the assets are sold, the gains and losses previously recognised to equity are transferred to the income statement. Note that purchases and sales are recognised on the trade date. This category also includes financial assets bought or issued and then classified either as held for trading or at fair value through profit and loss according to the fair value option”. For further details of the accounting treatment of financial assets, we would refer readers to the specific note on "Financial Instruments”. 3.l.Income taxes (IAS 12)
Current taxes are provided for on the basis of a realistic estimate of taxable income under current tax regulations of the country in which the company is based, taking into account any exemptions and tax credits that may be claimed. Deferred taxes are calculated on the basis of any temporary differences (taxable or deductible) between the carrying values of assets and liabilities and their tax bases and are classified as non-current assets and liabilities. A deferred tax asset is recognised to the extent that taxable income will probably be available in the future to offset deductible temporary differences. The carrying value of deferred tax assets is subject to periodic analysis and is reduced to the extent that it is no longer probable that there will be sufficient taxable income to take advantage of the deferred tax asset.
37
Cons
olid
ated
fin
anci
al s
tate
men
ts
3.m.Inventories (IAS 2)
Inventories are shown at the lower of weighted average purchase or production cost and their estimated realisable value. 3.n.Cash and cash equivalents (IAS 32 and 39)
Cash comprises cash on hand and demand deposits. Cash equivalents are short-term, highly liquid investments that are readily convertible into cash and which have an insignificant risk of changes in value. 3.o.Equity
Ordinary shares are recorded at their nominal value. Costs directly attributable to the issuance of new shares are deducted from equity reserves, net of any related tax benefit. Treasury shares are shown separately as a deduction from reserves; any subsequent sale, reissuance or cancellation will not have any impact on the income statement, only on equity. Unrealised gains and losses on financial assets classified as “available for sale” are recognised, net of tax, under equity in the fair value reserve. The reserve is reversed to the income statement when the financial asset is realised or impairment to it is recognised. The hedging reserve is formed when fair value changes are recognised on derivatives which have been designated as "cash flow hedges" or "hedges of net investments in foreign operations" for the purposes of IAS 39). The portion of gains and losses considered "effective" is recognised to equity and is reversed to the income statement as and when the elements being hedged are in turn recognised to the income statement, or when the subsidiary is sold. When a subsidiary prepares its financial statements in a currency different from the Group's functional currency, the subsidiary's financial statements are translated and any translation differences are recognised in a special reserve. When the subsidiary is sold the reserve is reversed to the income statement, accounting for any gains or losses on the disposal. “Retained earnings (losses)” include accumulated earnings and balances transferred from other reserves when these are released from any previous limitations. This item also shows the cumulative effect of any changes in accounting principles and/or the correction of errors, which are accounted for in accordance with IAS 8. 3.p.Borrowings (IAS 32 and 39)
Loans are initially recognised at cost, represented by their fair value net of any transaction costs incurred. Subsequently, borrowings are measured at amortised cost calculated by applying the effective interest rate method, taking into consideration any issuance costs incurred and any premium or discount applied at the time the instrument is settled.
38
Cons
olid
ated
fin
anci
al s
tate
men
ts
3.q.Provisions for risks and losses (IAS 37)
Provisions for risks and losses refer to liabilities which are probable, but where the amount and/or maturity is uncertain. They are the result of past events which will cause a future cash outflow. Provisions are recognised exclusively in the presence of a current obligation to third parties, whether legal or implicit, which implies an outflow and when a reliable estimate of the amount involved can be made. The amount recognised as a provision is the best estimate of the disbursement required to settle the obligation as at the reporting date. The provisions recognised are reviewed at the close of each accounting period and adjusted to represent the best current estimate. Changes in the estimate are recognised to the income statement. When the estimated outflow relating to the obligation is expected in a time horizon longer than normal payment terms and the discount factor is significant, the provision represents the present value, discounted at a nominal risk-free rate, of the expected future outflows to settle the obligation. Contingent assets and liabilities (potential assets and liabilities, or those not recognised because no reliable estimate can be made) are not recognised. However, adequate disclosure on such items is provided. 3.r.Revenue and income (IAS 18)
Revenues from the sale of goods are recognised at the time ownership and the risks related to the goods are transferred, net of returns, discounts and rebates. Service revenues are recognised at the time the service is provided, based on its stage of completion at the reporting date. Income from dividends, interest and royalties is recognised as follows: - dividends, when the right to receive payment is established (with a balancing entry under
receivables when distribution is approved);
- interest, using the effective interest rate method (IAS 39);
- royalties, on an accrual basis, in accordance with the underlying contractual agreement. 3.s.Employee benefits (IAS 19)
Benefits to be paid to employees on termination of their employment and other long term benefits are subject to actuarial valuation. Following this methodology, liabilities recognised represent the present value of the obligation adjusted for any actuarial gains or losses not accounted for. Finance Law no. 296/2006 made important changes to employee leaving indemnity (TFR) regulations, introducing the option for workers to transfer their indemnity maturing after 1 January 2007 to selected pension schemes. Therefore, all employee leaving indemnity accrued as at 31 December 2006 for employees who exercised this option, while remaining within the sphere of defined benefit plans, was determined using actuarial methods that exclude the actuarial/financial components relating to future changes in salary. EU Regulation 475/2012 endorsed the amendments to IAS 19 - Employee Benefits, as approved by the IASB on 16 June 2011, with the aim of promoting the understanding and comparability of financial statements, particularly with reference to defined benefit plans. The most important change is the elimination of the different accounting treatments that were permitted for recording defined
39
Cons
olid
ated
fin
anci
al s
tate
men
ts
benefit plans and the consequent introduction of a single method that envisages immediate recognition in the statement of comprehensive income of any actuarial gains or losses that arise from measuring the obligation. Compared with the previous accounting treatment adopted by the Group, the main impact is the elimination of the "corridor method", with immediate recognition in the statement of comprehensive income, and therefore in equity, of changes in the value of the obligations and the plan assets. The elimination of this method had an impact on Group equity at the date of first application of the new standard, as actuarial gains and losses not previously recognised under the corridor method have now been recognised. IFRS 2 "Share-based Payment" issued in February 2005 with validity from 1 January 2005 (revised version effective 1 January 2010) requires that application should be retrospective in all cases where stock options were assigned after 7 November 2002 and where the vesting conditions of the plans had not yet matured at the effective date. In accordance with this standard, the CIR Group now measures and recognises the notional cost of stock options and stock grants to the income statement under personnel costs and apportions them throughout the vesting period of the benefit, with a balancing entry in the appropriate equity reserve. The cost of the option is determined at the award date of the plan, applying special models and multiplying by the number of options exercisable over the reference period, assessed with the aid of appropriate actuarial variables. Similarly, the cost resulting from the assignment of phantom stock options is determined in relation to the fair value of the options at the assignment date and is recognised to the income statement under personnel costs over the vesting period of the benefit; unlike for stock options and stock grants, the balancing entry is recorded under liabilities (other personnel provisions) and not in an equity reserve. Until this liability is extinguished its fair value is recalculated at each reporting date and on the date of actual disbursement and all fair value changes are recognised to the income statement. 3.t.Derivatives (IAS 32 and 39)
Derivatives are measured at fair value.
The Group uses derivatives mainly to hedge risks, in particular interest rate, foreign exchange and commodity price risks. Classification of a derivative as a hedge is formally documented, stating the effectiveness of the hedge.
For accounting purposes hedging transactions can be classified as:
- fair value hedges – where the effects of the hedge are recognised to the income statement;
- cash flow hedges – where the fair value change of the effective portion of the hedge is recognised directly to equity, while the non-effective part is recognised to the income statement.
- hedges of a net investment in a foreign operation – where the fair value change of the effective portion of the hedge is recognised directly to equity, while the non-effective part is recognised to the income statement.
Trading in derivatives with commodities as their underlying, carried on by Sorgenia as part of its normal day-to-day activities, is represented by showing the positive and negative fair values of such transactions in “Other receivables” and “Other payables” with the net result being shown in a single item in the income statement.
40
Cons
olid
ated
fin
anci
al s
tate
men
ts
3.u.Foreign currency translation (IAS 21)
The Group's functional currency is the euro and this is the currency in which its financial statements are prepared. Group companies prepare their financial statements in the currencies used in their respective countries. Transactions carried out in foreign currencies are initially recognised at the exchange rate on the date of the transaction. At the reporting date, monetary assets and liabilities denominated in foreign currencies are translated at the exchange rate prevailing on that date. Non-monetary items measured at historical cost in a foreign currency are translated using the exchange rate prevailing on the date of the transaction. Non-monetary items measured at fair value are translated using the exchange rate at the date on which the carrying values were measured. The assets and liabilities of Group companies whose functional currency is not the euro are measured as follows: assets and liabilities are translated using the exchange rate prevailing at the reporting date; costs and revenues are translated using the average exchange rate for the period. Exchange rate differences are recognised directly to a special equity reserve. Should an investment in a foreign operation be sold, the accumulated exchange rate differences recognised in the equity reserve are reversed to the income statement. 3.v.Non-current assets held for sale (IFRS 5)
A non-current asset is held for sale if its carrying value will be recovered principally through a sale rather than through its use in the business. For this condition to be satisfied the asset must be immediately saleable in its present condition and a sale must be considered highly likely. Assets or groups of discontinued assets that are classified as held for sale are valued at the lower of their carrying value and the expected realisable value, less costs to sell. Individual assets or those that form part of a group classified as held for sale are not depreciated. Presentation of these assets in the financial statements involves showing the after-tax income and losses resulting from the sale on a separate line in the income statement. Similarly, the assets and liabilities have to be shown on a separate line in the statement of financial position. 3.w.Earnings per share (IAS 33)
Basic earnings per share are determined by dividing net income attributable to the ordinary shareholders of the parent company by the weighted average number of ordinary shares in circulation during the period. Diluted earnings per share are calculated by adjusting the weighted average number of ordinary shares in circulation to take into account all potential ordinary shares, for example deriving from the possible exercise of assigned stock options that could have a dilutive effect. 3.x.Business combinations and Goodwill
Business acquisitions are recognised using the purchase and acquisition method in compliance with IFRS 3, on the basis of which the acquisition cost is equal to the fair value on the date of exchange of the assets transferred and the liabilities incurred or assumed. Any transaction costs relating to business combinations are recognised to the income statement in the period they are incurred.
41

Cons
olid
ated
fin
anci
al s
tate
men
ts
Contingent consideration is included as part of the transfer price of the net assets acquired and is measured at fair value at the acquisition date. Similarly, if the business combination agreement envisages the right to receive repayment of certain elements of the price if certain conditions are met, this right is classified as an asset by the acquirer. Any subsequent changes in this fair value are recognised as an adjustment to the original accounting treatment only if they are the result of more or better fair value information and if this takes place within twelve months of the acquisition date; all other changes must be recognised to the income statement. In the event of a step acquisition of a subsidiary, the minority interest previously held (recognised up to that point according to IAS 39 – Financial Instruments: Recognition, IAS 28 – Investments in Associates or IAS 31 – Investments in Joint Ventures) is treated as if it had been sold and repurchased at the date that control is acquired. The investment is therefore measured at its fair value on the date of “transfer” and any gains and losses resulting from this measurement are recognised to the income statement. Moreover, any amount previously recognised in equity as “Other comprehensive gains and losses”, is reclassified to the income statement following the sale of the asset to which it refers. The goodwill (or income in the case of badwill) arising on conclusion of the deal with subsequent acquisition is calculated as the sum of the price paid for the acquisition of control, the value of minority interests (measured using one of the methods permitted by the accounting standard) and the fair value of the minority interest previously held, net of the fair value of the identifiable net assets acquired. The identifiable assets, liabilities and contingent liabilities of the acquired business which meet the conditions for recognition are accounted for at their fair value on the date of acquisition. Any positive difference between the acquisition cost and the fair value of the Group's share of net assets acquired is recognised as goodwill or, if negative, charged to the income statement. After initial recognition, goodwill is measured at cost less any accumulated impairment. Goodwill always refers to identified income-producing assets, whose ability to generate income and cash flow is monitored constantly for impairment. The accounting treatment of the acquisition of any further investment in companies already controlled are considered transactions with shareholders and therefore any differences between acquisition costs and the carrying value of the minority interests acquired are recognised in Group equity. Likewise, sales of minority interests not involving loss of control do not generate gains/losses in the income statement, but rather changes in Group equity. The initial allocation to assets and liabilities as mentioned above, using the option given in IFRS 3, can be performed on a provisional basis by the end of the year in which the transaction is completed; the values provisionally assigned on initial recognition can be adjusted within twelve months of the date on which control was acquired. 3.y.Use of estimates
The preparation of financial statements and explanatory notes in accordance with IFRS requires management to make estimates and assumptions which affect the values of the assets and liabilities shown in them, as well as the disclosures made regarding contingent assets and liabilities as of the reporting date. The estimates and assumptions used are based on experience and other factors considered relevant. The actual results could differ from these estimates. Estimates and assumptions are reviewed periodically and the effects of any changes are reflected in the income statement in the period in which the amendment is made if the review only affects that period, or in subsequent periods if the amendment affects both the current and future years.
42
Cons
olid
ated
fin
anci
al s
tate
men
ts
The items mainly affected by this use of estimates are goodwill, deferred taxes, provisions for risks and losses, personnel provisions and the fair value of financial instruments, stock options, phantom stock options and stock grants. See the notes on these specific items for further details. 4.Financial instruments
Financial instruments take on a particular significance in the CIR Group's economic and financial structure. For this reason, management felt that it would be useful to devote a special section to accounting standards IAS 32 and IAS 39, to help readers understand better the financial issues involved. According to IAS 32 financial instruments are classified into four categories:
a) Financial instruments measured at fair value through profit and loss (FVTPL) in application of the fair value option: either designated as such or held for trading;
b) Investments held to maturity (HTM); c) Loans and receivables (L&R); d) Available-for-sale financial assets (AFS).
Classification depends on the intended use of the financial instrument within the context of the Company's financial management and each involves a different type of measurement for accounting purposes. Financial transactions are recognised on the basis of their value date. Financial instruments at fair value through profit and loss Financial instruments are classified as such if they satisfy one of the following conditions: - they are held for trading; - they are designated as such under the fair value option, on the assumption that the fair value can
be reliably determined. Trading generally means frequent buying and selling with the aim of generating profit on short-term price fluctuations. Derivatives are included in this category unless they are designated as hedge instruments. The initial designation of financial instruments, other than derivatives and those held for trading, as instruments at fair value through profit and loss under the fair value option is limited to those that meet the following conditions:
a) designation under the fair value option eliminates or significantly reduces an accounting mismatch;
b) a group of financial assets, financial liabilities or both are managed and their performance is measured on a fair value basis in accordance with a documented investment risk strategy, and;
c) an instrument contains an embedded derivative which meets particular conditions. The designation of an individual instrument to this category is final, it is made at the time of initial recognition and cannot be modified.
43
Cons
olid
ated
fin
anci
al s
tate
men
ts
Investments held to maturity This category includes non-derivative instruments with fixed or determinable payments and a fixed maturity, which the Company intends and is able to hold to maturity. These instruments are measured at amortised cost and constitute an exception to the general principle of measurement at fair value. Amortised cost is determined by applying the effective interest rate of the financial instrument, taking into account any discounts received or premiums paid at the time of purchase, and recognising them throughout the entire life of the instrument until its maturity. Amortised cost represents the initial recognition value of a financial instrument, net of any capital repayments and any impairment, plus or minus cumulative differences between its initial value and its value at maturity calculated using the effective interest rate method. The effective interest rate method is a way of calculating the financial charges to be assigned to a particular period. The effective interest rate is the rate that gives a correct present value to expected future cash flows until maturity, so as to obtain the net present carrying value of the financial instrument. If even only one instrument belonging to this category is sold before maturity, for a significant amount and where there is no special justification for its disposal, the so-called "tainting rule" gets applied: this requires that the whole portfolio of securities classified as Held To Maturity be reclassified and measured at fair value, after which this category cannot be used for the next two years. Loans and receivables Loans and receivables are non-derivative financial assets with fixed or determinable payments that are not quoted in an active market and which are not held for trading. The category includes trade receivables (and payables). Measurement of these instruments, except for those classified as current assets or liabilities (within twelve months), is made by applying the amortised cost method, using the effective interest rate and taking into account any discounts received or premiums paid at the time of acquisition and recognising them throughout the entire life of the instrument until its maturity. Available-for-sale financial assets This is a “residual” category which includes non-derivative financial instruments that are designated as available for sale and not included in any of the previous categories. Available-for-sale financial instruments are recognised at their fair value plus any transaction costs. Gains and losses are recognised to a separate equity item until the financial instruments are sold or suffer impairment. In such cases, the gains and losses accrued to equity up to that point are released to the income statement. Investments in financial assets can only be derecognised (i.e. eliminated from the financial statements) when the contractual rights to receive their respective financial cash flows have expired or when the financial asset is transferred to third parties together with all associated risks and benefits.
44
Cons
olid
ated
fin
anci
al s
tate
men
ts
Fair value EU Regulation 1255/2012 endorsed IFRS 13 - Fair Value Measurement. The new standard provides guidance on how to measure the fair value of financial instruments and non-financial assets and liabilities already established or permitted by other standards. In this way, a single standard brings together all the rules for the measurement of fair value, instead of being spread over different standards as they were previously, sometimes with requirements that were inconsistent with each other. Although many of the concepts of IFRS 13 are consistent with current practice, some aspects of the new standard do have any impact on CIR Group companies, the main one being the clarifications given on how to measure the risk of default when determining the fair value of derivatives. This risk includes changes in the creditworthiness of both the counterparty and the issuer.
Fair value, as defined by IFRS 13, is the price that would be received for the sale of an asset or that would be paid to transfer a liability in an regular transaction between market participants at the measurement date. The fair value of financial liabilities due and payable on demand (e.g. demand deposits) is not less than the amount payable on demand, discounted from the first date on which payment could be required. For financial instruments quoted in active markets, the fair value is determined on the basis of official prices in the principal market to which the Group has access (mark to market). A financial instrument is considered quoted in an active market if quoted prices are readily and regularly available from a quotation system, dealers, brokers, etc., and these prices represent actual and regular market transactions. If there is no quoted market price in an active market for a financial instrument taken as a whole, but there is one for some of its components, the fair value is determined on the basis of the specific market prices of its components. If there are no observable prices in an active market for an identical item owned by another operator as an asset, or if prices are not available, using other observable inputs such as quoted prices in an inactive market for the identical item owned by another operator as an asset, the Group will assess the fair value using another valuation technique, such as: - an income approach (for example, a technique that takes into account the present value of future
cash flows that a market participant would expect to receive from owning a financial liability, an equity instrument or an asset);
- a market approach (for example, using quoted prices for similar liabilities or equity instruments owned by third parties as assets);
- valuations performed using, in all or in part, inputs not taken from parameters that are observable on the market, for which use is made of estimates and assumptions developed by the evaluator (mark to model). The Group uses valuation models (mark to model) that are generally accepted and used by the market. The models include techniques based on the discounting of future cash flows and estimates of volatility (if there is an optional component); these are subject to revision from time to time in order to ensure consistency with the objectives of the valuation.
These methods use inputs based on prices set in recent transactions and/or prices/quotations for instruments that have similar characteristics in terms of risk profile. As a further guarantee of the objectivity of valuations derived from valuation models, the Group uses fair value adjustments (FVAs) to take into account the risks associated primarily with the limited liquidity of the positions, the valuation models used and counterparty risk.
45
Cons
olid
ated
fin
anci
al s
tate
men
ts
The choice between these techniques is not optional, as they have to be applied in hierarchical order: if, for example, is a price quoted in an active market is available, the other valuation techniques cannot be used. IFRS 13 provides for the classification of the instruments being measured at fair value according to the observability of the inputs used for pricing them. The fair value hierarchy has three levels:
- Level 1: the fair value of instruments classified in this level is determined based on (unadjusted) quoted prices that can be observed in active markets;
- Level 2: the fair value of instruments classified in this level is determined based on valuation models that use inputs that can be observed in active markets (other than the quoted prices included in Level 1, observable either directly or indirectly).
- Level 3: the fair value of instruments classified in this level is determined based on valuation models that primarily use inputs that can not be observed in active markets. The valuations are based on various inputs, not all directly derived from observable market parameters, and involve estimates and assumptions on the part of the evaluator.
The Group did not encounter any significant changes as a result of implementing IFRS 13
5. Accounting standards, changes in accounting estimates and errors
The criteria for making estimates and measurements are reviewed periodically, based on historical experience and other factors such as expectations of possible future events that are reasonably likely to take place. If first-time application of a standard affects the current year or the previous one, the effect is shown by indicating the change caused by any transitional rules, the nature of the change, a description of the transitional rules, which may also affect future years, and the amount of any adjustments to years prior to those being presented. If a voluntary change of a standard affects the current or previous year, the effect is shown by indicating the nature of the change, the reasons for adopting the new standard, and the amount of any adjustments to years prior to those being presented. In the event of a new standard or interpretation issued but not yet in force, an indication is given of the fact, its potential impact, the name of the standard or interpretation, the date on which it will come into force and the date of its first-time application. A change in accounting estimate involves giving an indication of the nature and impact of the change. Estimates are used mainly in the recognition of asset impairment, provisions for risks, employee benefits, taxes and other provisions and allowances. Estimates and assumptions are reviewed regularly and the effects of any such changes are reflected in the income statement. Lastly, the treatment of accounting errors involves an indication of the nature of the error and the amount of the adjustments to be made at the beginning of the first reporting period after they were discovered.
46
Cons
olid
ated
fin
anci
al s
tate
men
ts
6. Adoption of new accounting standards, interpretations and amendments
Accounting standards, amendments and interpretations of IFRS applied from 1 January 2013
The following accounting standards, amendments and interpretations were applied for the first time by the Group with effect from 1 January 2013:
On 12 May 2011, the IASB issued IFRS 13 - Fair Value Measurement, which lays down a single framework for fair value measurements that are required or permitted by other standards, and for the related disclosures to be made in the financial statements. Fair value is defined as the price that would be received on the sale of an asset (or paid on the transfer of a liability) as part of a orderly transaction between market participants at the measurement date. This standard has to be applied prospectively.
On 16 December 2011, the IASB issued amendments to IFRS 7 - Financial Instruments: Additional Disclosures (para. 13A-13F). The amendment requires information on the effects or potential effects of offsetting financial assets and liabilities on a company's statement of financial position in application of IAS 32. The disclosures have to be provided retrospectively.
On 16 June 2011, the IASB issued an amendment to IAS 1 - Presentation of Financial Statements requiring companies to group together all their components of "Other comprehensive income" (OCI) according to whether or not they can later be reclassified to the income statement. Any related taxes should be allocated on the same basis.
On 16 June 2011, the IASB issued an amendment to IAS 19 - Employee Benefits, which eliminates the option to defer the recognition of actuarial gains and losses under the corridor method, requiring that all actuarial gains and losses be recognised immediately in "Other comprehensive income" so that the full net amount of provisions for defined benefit plans (net of plan assets) must be included in the consolidated statement of financial position. The amendments also provide that changes in the defined benefit fund and plan assets between one year and the next have to be divided into three components: cost components related to work performed during the period have to be recorded in the income statement as "service costs”; net financial charges, calculated by applying an appropriate discount rate to the provision for defined benefit plans, net of plan assets, at the beginning of the year, have to be included in the income statement as such, and gains and losses arising from remeasurement of the assets and liabilities have to be included in "Other comprehensive income". In addition, the return on the assets included in net financial charges as indicated above has to be calculated on the discount rate of the liability rather than the expected return on the assets. The amendments also introduce new disclosures to be provided in the notes to the financial statements. The amendment is applicable retrospectively.
October 2011 saw the publication of IFRIC 20 Stripping Costs in the Production Phase of a
Surface Mine, which applies to the costs of waste removal that are incurred in surface mining activities during the production phase of the mine.
On 17 May 2012, the IASB published its Annual Improvements to IFRSs: 2009-2011 Cycle, which includes changes to international accounting standards as part of their annual improvement, focusing on changes that are considered necessary, but not urgent. The following are those that will lead to a change in the presentation, recognition and measurement of financial statement items, excluding those that will only involve a change in terminology or editorial
47

Cons
olid
ated
fin
anci
al s
tate
men
ts
adjustments with a minimal impact on the accounts. Then there are those that affect standards or interpretations that are not applicable to the Group: ∼ IAS 1 - Presentation of Financial Statements - Comparative information: this clarifies that if additional comparative information is provided, it has to be presented in accordance with IAS/IFRS. In addition, it clarifies that if a company changes an accounting policy or makes a retrospective adjustment or reclassification, it should also present a statement of financial position at the beginning of the comparative period (a "third statement of financial position" in the financial statements), whereas the notes do not have to include comparative disclosures also for this "third statement of financial position", apart from the specific items concerned. ∼ IAS 16 Property, plant and equipment - Classification of servicing equipment: this clarifies that servicing equipment has to be classified as property, plant and equipment if it used for more than one year, otherwise as inventory.
∼ IAS 32 Financial Instruments: Presentation - Tax effect on distributions to holders of equity instruments and transaction costs relating to equity instruments: this clarifies that the income taxes involved in these circumstances follow the rules of IAS 12.
∼ IAS 34 Interim Financial Reporting - Total assets of a reportable segment: this clarifies that total assets only have to be reported if this information is regularly provided to the chief operating decision maker of the entity and there has been a material change in the total assets of the segment compared with the previous annual report.
On 19 March 2011, the IASB published an amendment to IFRS 1 First-time Adoption of
International Financial Reporting Standards - Government Loans, which amends the reference to accounting for government loans in the transition to IFRS.
ACCOUNTING STANDARDS, AMENDMENTS AND INTERPRETATIONS (IFRS AND IFRIC) ENDORSED BY THE EUROPEAN UNION, BUT NOT YET APPLICABLE IF NOT IN ADVANCE (the Group did not make use of this faculty) On 12 May 2011, the IASB issued IFRS 10 - Consolidated Financial Statements, which will replace
SIC-12 Consolidation - Special Purpose Entities and parts of IAS 27 - Consolidated and Separate Financial Statements, which will be renamed Separate Financial Statements and govern the accounting treatment of investments in separate financial statements. The principal changes introduced by the new standard are as follows:
∼ According to IFRS 10 there is a single basic principle to consolidate all types of entities, and this principle is based on control. This change removes the perceived inconsistency between the previous IAS 27 (based on control) and SIC 12 (based on the transfer of risks and benefits); ∼ A more solid definition of control than in the past has been introduced, based on three elements: (a) power over the company acquired; (b) exposure, or rights, to variable returns from involvement with the company; (c) the ability to use this power to influence the amount of such returns;
48

Cons
olid
ated
fin
anci
al s
tate
men
ts
∼ IFRS 10 requires an investor to assess whether it has control over the company acquired by focusing on the activities that significantly affect its returns;
∼ When assessing whether control exists, the investor is required by IFRS 10 to consider only substantive rights, i.e. those that can be exercised when important decisions have to be taken regarding the company acquired;
∼ IFRS 10 provides practical guidance to assist in assessing whether control exists in complex situations, such as de facto control, potential voting rights, situations in which it is necessary to determine whether the person who has the decision-making power is acting as an agent or principal, etc. Generally speaking, the application of IFRS 10 requires a significant degree of judgement with regard to various aspects involved in its implementation. The standard is applicable retrospectively from 1 January 2014.
On 28 June 2012, the IASB published Consolidated Financial Statements, Joint Arrangements and Disclosure of Interests in Other Entities: Transition Guidance (Amendments to IFRS 10, IFRS 11 and IFRS 12). To start with, this document sets out to clarify the Board's intentions with reference to the transition rules of IFRS 10 Consolidated Financial Statements. The document explains that, for an entity with a fiscal year that coincides with the calendar year that intends to apply IFRS 10 for the first time in its financial statements for the year ended 31 December 2013, the date of initial application will be 1 January 2013. In the event that the conclusions on the scope of consolidation according to IFRS 10 at the date of initial recognition are the same as they were according to IAS 27 and SIC 12, the entity will not have any obligation. Similarly, no obligation will arise if the investment was sold during the comparative period (and as such no longer exists at the date of initial application). The document also aims to clarify how an investor might retrospectively adjust the comparative period(s) if the conclusions on the scope of consolidation according to IFRS 10 at the date of initial recognition are not the same as they were according to IAS 27 and SIC 12. In particular, when a retrospective adjustment as defined above is not feasible, an acquisition/disposal will be recorded at the beginning of the comparative period being presented, with a consequent adjustment recognised in retained earnings. In addition, the Board amended IFRS 11 Joint Arrangements and IFRS 12 Disclosure of Interests in Other Entities to provide a similar concession for the presentation or amendment of comparative information for the "immediately preceding period" (i.e. the comparative period presented in the financial statements). Another amendment has been made to IFRS 12 limiting the requirement to present comparative information for disclosures relating to non-consolidated 'structured entities' in periods prior to the date of application of IFRS 12. These amendments will apply, together with the reference standards, from periods beginning on or after 1 January 2014, unless applied in advance.
On 12 May 2011, the IASB issued IFRS 11 - Joint Arrangements, due to replace IAS 31 - Interests
in Joint Ventures and SIC-13 - Jointly Controlled Entities - Non-monetary contributions by venturers. Without prejudice to the criteria for identifying the presence of a jointly controlled entity, the new standard provides criteria for the accounting treatment of joint arrangements by focusing on the rights and obligations arising from such arrangements,
49
Cons
olid
ated
fin
anci
al s
tate
men
ts
rather than on their legal form; it also requires a single method of accounting for investments in joint ventures in the consolidated financial statements, i.e. the equity method. According to IFRS 11, the existence of a separate vehicle is not sufficient to classify a joint arrangement as a joint venture. The new standard is applicable retrospectively from 1 January 2014. Following the issuance of this standard, IAS 28 - Investments in Associates has been amended to include investments in joint ventures within its scope of application from the effective date of the standard.
On 12 May 2011, the IASB issued IFRS 12 - Disclosure of Interests in Other Entities, which is a new and comprehensive standard on the information to be provided in the consolidated financial statements on each type of investment, including those in subsidiaries, joint arrangements, associates, special purpose entities and other vehicle companies that are not consolidated. The standard is applicable retrospectively from 1 January 2014.
On 16 December 2011, the IASB issued amendments to IAS 32 - Financial Instruments:
Presentation to clarify the application of certain criteria for the offsetting of the financial assets and liabilities referred to in IAS 32. In particular, the amendments to IAS 32 state that: (i) in order to make a compensation, the right to offsetting must be legally enforceable in all circumstances, i.e. both in the ordinary course of business and in the case of insolvency, default or bankruptcy of one of the parties; and (ii) under certain conditions, the simultaneous settlement of financial assets and liabilities on a gross basis, with the consequent elimination or significant reduction of credit risks and liquidity, can be considered equivalent to net settlement. The amendments will apply retrospectively to accounting periods beginning on or after 1 January 2014. The potential impact on the Group's financial reporting as a result of applying these principles is currently being analysed. Management's opinion is that the impact will not be significant.
ACCOUNTING STANDARDS, AMENDMENTS AND INTERPRETATIONS OF IFRS NOT YET ENDORSED BY THE EUROPEAN UNION
At the date of these consolidated half-yearly financial statements, the competent bodies of the European Union had not yet completed the endorsement process necessary for the adoption of the following amendments and standards.
On 12 November 2009, the IASB published IFRS 9 - Financial Instruments: this standard was subsequently amended on 28 October 2010. The new standard, which is applicable retrospectively from 1 January 2015, represents the initial phase of a project designed to replace IAS 39. It introduces new criteria for classifying and measuring financial assets and liabilities. More specifically, the new standard uses a single approach based on how financial instruments are managed and on the characteristics of the contractual cash flows of financial assets to determine how they should be measured, replacing the various different rules envisaged in IAS 39. For financial liabilities, on the other hand, the main change concerns the accounting treatment of changes in the fair value of a financial liability designated at fair value through profit and loss, when they are due to a change in the credit rating of the said liability. According to the new standard such changes have to be recognised to "Other comprehensive income" and will no longer pass through the income statement. Phases two and three of the project on financial instruments, which relate to impairment of financial assets and hedge accounting, are still in progress.
50
Cons
olid
ated
fin
anci
al s
tate
men
ts
The IASB is also considering minor improvements to IFRS 9 for the part relating to the classification and measurement of financial assets.
On 31 October 2012 were issued amendments to IFRS 10, IFRS 12 and IAS 27 "Investment
Entities", which introduce an exception to the consolidation of subsidiaries for an investment company, except for cases where the subsidiaries provide services that relate to the investment activities of such companies. In application of these amendments, an investment company has to measure its investments in subsidiaries at fair value through profit and loss. To qualify as an investment company, an entity has to: - obtain funds from one or more investors with the purpose of providing them with
professional investment management services; - make a commitment with its investors that its corporate purpose is to invest the funds
solely with a view to obtaining returns from capital appreciation, investment income, or both;
- measure and evaluate the performance of substantially all of its investments on a fair value basis. These amendments are applicable for financial statements beginning on or after 1 January 2014, with early application permitted.
On 20 May 2013, the IFRS IC issued IFRIC 21 - Levies, which lays down the accounting treatment
of taxes or duties paid to governmental authorities (based on the laws of any particular jurisdiction), for which the entity does not receive any consideration (i.e. specific goods or services). The event that generates the obligation for the entity is typically specified in the legislation introducing the tax or duty. A liability should be recognised at the time the event that generates the obligation takes place, even if the tax or duty is calculated on a past performance (i.e. the previous year's revenues); manifestation of the past performance is a necessary condition, but not sufficient to record a liability. This Interpretation applies retrospectively for financial statements beginning on or after 1 January 2014.
On 29 May 2013, the IASB issued an amendment to IAS 36 Recoverable Amount - Disclosures for Non-Financial Assets, which limits the obligation to indicate in the disclosures the recoverable amount of assets or cash generating units (CGUs); to this end, it is worth remembering that IFRS 13 "Fair Value Measurement" amended IAS 36 by introducing a requirement to indicate in the disclosures the recoverable amount of each (group of) CGUs, to which are attributed a significant part of the net book value of goodwill or of the intangible assets with an indefinite useful life. In addition, this amendment explicitly requires companies to provide information on the discount rate used to determine an impairment loss (or reversal) when the recoverable amount (based on its fair value less costs to sell) is determined using the present value technique.
51
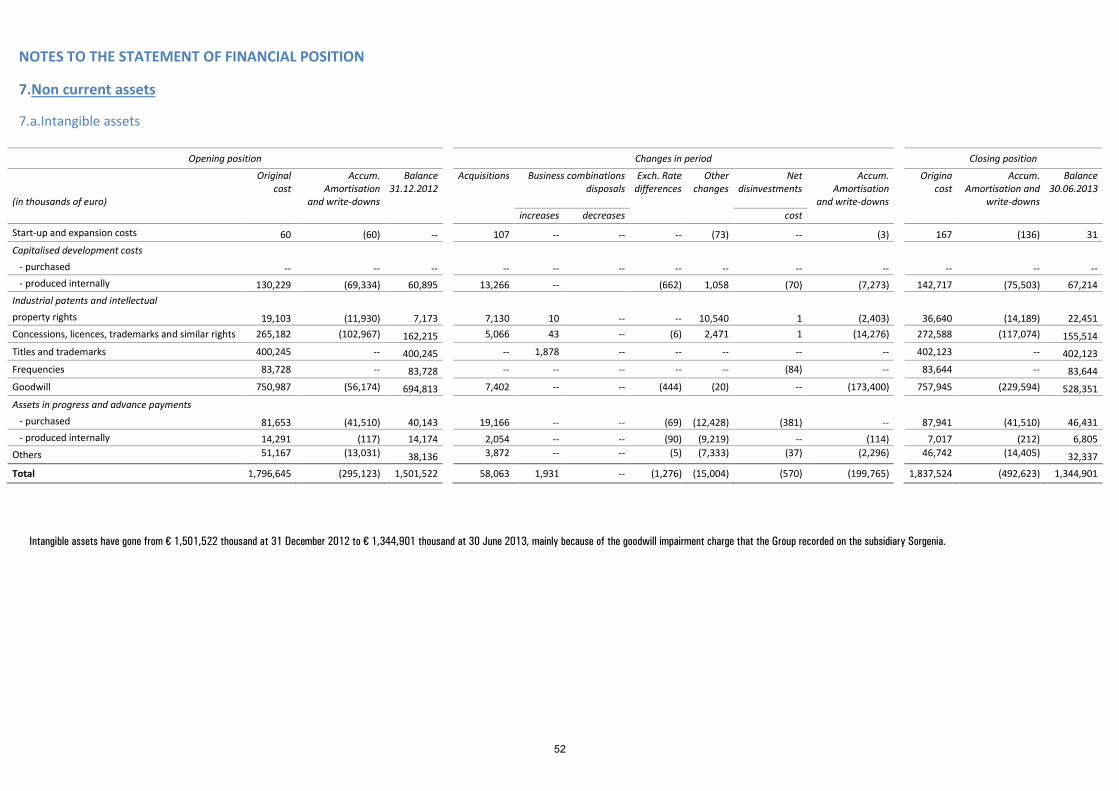
NOTES TO THE STATEMENT OF FINANCIAL POSITION
7. Non current assets
7.a.Intangible assets
Opening position
Changes in period Closing position
(in thousands of euro)
Original cost
Accum. Amortisation
and write-downs
Balance 31.12.2012
Acquisitions Business combinations disposals
Exch. Rate differences
Other changes
Net disinvestments
Accum. Amortisation
and write-downs
Origina cost
Accum. Amortisation and
write-downs
Balance 30.06.2013
increases decreases cost
Start-up and expansion costs 60 (60) --
107 -- -- -- (73) -- (3)
167 (136) 31 Capitalised development costs
- purchased -- -- --
-- -- -- -- -- -- --
-- -- -- - produced internally 130,229 (69,334) 60,895
13,266 -- (662) 1,058 (70) (7,273)
142,717 (75,503) 67,214
Industrial patents and intellectual property rights 19,103 (11,930) 7,173
7,130 10 -- -- 10,540 1 (2,403)
36,640 (14,189) 22,451
Concessions, licences, trademarks and similar rights 265,182 (102,967) 162,215 5,066 43 -- (6) 2,471 1 (14,276) 272,588 (117,074) 155,514 Titles and trademarks 400,245 -- 400,245 -- 1,878 -- -- -- -- -- 402,123 -- 402,123 Frequencies 83,728 -- 83,728 -- -- -- -- -- (84) -- 83,644 -- 83,644 Goodwill 750,987 (56,174) 694,813 7,402 -- -- (444) (20) -- (173,400) 757,945 (229,594) 528,351 Assets in progress and advance payments - purchased 81,653 (41,510) 40,143
19,166 -- -- (69) (12,428) (381) --
87,941 (41,510) 46,431
- produced internally 14,291 (117) 14,174
2,054 -- -- (90) (9,219) -- (114)
7,017 (212) 6,805 Others 51,167 (13,031) 38,136 3,872 -- -- (5) (7,333) (37) (2,296) 46,742 (14,405) 32,337 Total 1,796,645 (295,123) 1,501,522 58,063 1,931 -- (1,276) (15,004) (570) (199,765) 1,837,524 (492,623) 1,344,901
Intangible assets have gone from € 1,501,522 thousand at 31 December 2012 to € 1,344,901 thousand at 30 June 2013, mainly because of the goodwill impairment charge that the Group recorded on the subsidiary Sorgenia.
52
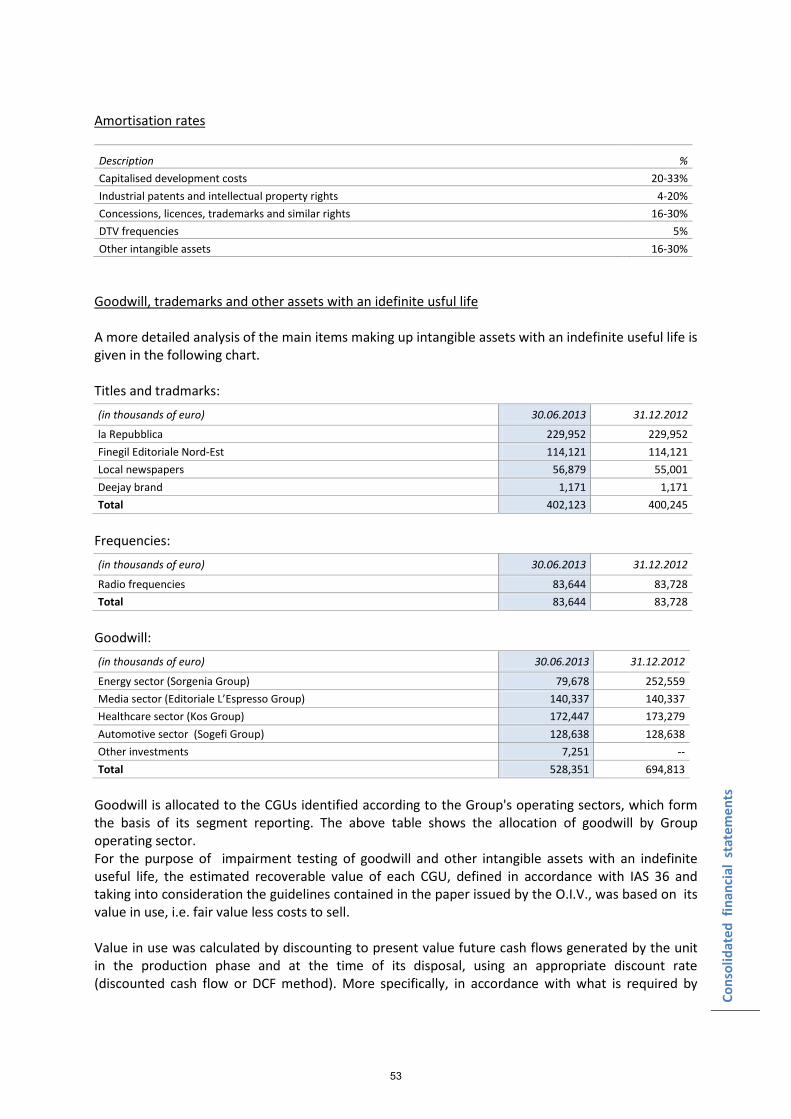
Cons
olid
ated
fin
anci
al s
tate
men
ts
Amortisation rates
Description % Capitalised development costs 20-33% Industrial patents and intellectual property rights 4-20% Concessions, licences, trademarks and similar rights 16-30% DTV frequencies 5% Other intangible assets 16-30%
Goodwill, trademarks and other assets with an idefinite usful life A more detailed analysis of the main items making up intangible assets with an indefinite useful life is given in the following chart. Titles and tradmarks: (in thousands of euro) 30.06.2013 31.12.2012
la Repubblica 229,952 229,952 Finegil Editoriale Nord-Est 114,121 114,121 Local newspapers 56,879 55,001 Deejay brand 1,171 1,171 Total 402,123 400,245
Frequencies: (in thousands of euro) 30.06.2013 31.12.2012
Radio frequencies 83,644 83,728 Total 83,644 83,728
Goodwill: (in thousands of euro) 30.06.2013 31.12.2012
Energy sector (Sorgenia Group) 79,678 252,559 Media sector (Editoriale L’Espresso Group) 140,337 140,337 Healthcare sector (Kos Group) 172,447 173,279 Automotive sector (Sogefi Group) 128,638 128,638 Other investments 7,251 -- Total 528,351 694,813
Goodwill is allocated to the CGUs identified according to the Group's operating sectors, which form the basis of its segment reporting. The above table shows the allocation of goodwill by Group operating sector. For the purpose of impairment testing of goodwill and other intangible assets with an indefinite useful life, the estimated recoverable value of each CGU, defined in accordance with IAS 36 and taking into consideration the guidelines contained in the paper issued by the O.I.V., was based on its value in use, i.e. fair value less costs to sell. Value in use was calculated by discounting to present value future cash flows generated by the unit in the production phase and at the time of its disposal, using an appropriate discount rate (discounted cash flow or DCF method). More specifically, in accordance with what is required by
53
Cons
olid
ated
fin
anci
al s
tate
men
ts
international accounting standards, to test the value, cash flows were considered without taking into account inflows and outflows generated by financial management or any cash flows relating to tax management. The cash flows to be discounted are therefore distinctive, unlevered operating cash flows (as they refer to individual units). The cash flows of the single operating units were extrapolated from the budgets and forecasts made by management. These plans were then processed on the basis of economic trends recorded in previous years and using the forecasts made by leading analysts on the outlook for the respective markets and more in general on the evolution of each business sector. To give a fair estimate of a CGU's value in use, we had to assess its expected future cash flows, expected changes in the amount and timing of these flows, the discount rate to be used and any other risk factors affecting the unit. In order to determine the discount rate to be used, we calculated the weighted average cost of capital (WACC) invested at sector level, regardless of the financial structure of the individual company or subgroup. More specifically, the discount rate used for the Media sector was determined gross of tax (pre-tax WACC), whereas for the other sectors the after-tax WACC was used, thereby expressing future cash flows on a consistent basis in these cases. The fair value less costs to sell of an asset or group of assets (e.g. a CGU) is best expressed in the price established by a "binding sale agreement in an arm's length transaction", net of any direct disposal costs. If this information was not available, the fair value net of costs to sell was determined in relation to the following trading prices, in order of importance: - the current price traded on an active market;
- prices for similar transactions executed previously;
- the estimated price based on information obtained by the company. For estimating the recoverable value of each asset the higher of fair value less costs to sell and value in use was used. For a detailed description of the impairment test, please refer to the annual report for the year ended 31 December 2012, which confirmed the validity of the amounts recorded. As required by IAS 36, goodwill must be tested for impairment at least once a year, except in cases where there are indications that require an immediate assessment of possible impairment losses. At 30 June 2013, in light of the trends in sales and margins of the CGUs during the first half of 2013, also in relation with their respective plans, there were no indications that suggested that the impairment test was no longer valid, nor that the amounts booked to the Media, Healthcare and Automotive sectors were no longer reasonable. As regards the Energy CGU, the CIR Group has identified certain elements that could indicate potential losses, particularly in relation to: - External factors resulting from changes in the macroeconomic environment and a number of new
regulations that involve the energy sector. In particular, the persistence of a negative trend in the energy scenario that emerged during the second quarter has led to a decline in the expected profits of CCGT plants and an overall return on Italian wind parks that is lower than in the past. In particular, the introduction of Decree Law 69 of 21 June 2013 has expanded the scope of the Robin Hood Tax to companies with a turnover of less than 3 million euro (from 10 million euro) and taxable income of less than 300 thousand euro (from 1 million euro) and the emergence of a new energy scenario that foresees total remuneration for Italian wind parks that is lower than in the past and lower margins for CCGT plants;
54
Cons
olid
ated
fin
anci
al s
tate
men
ts
- internal factors related to Sorgenia's decision to suspend future investments for the implementation of projects in portfolio involving authorised Italian wind power projects and those with a positive environmental impact assessment (EIA), especially in light of the new energy scenarios.
In this context, it was considered necessary to carry out a new impairment test, subjecting to stress the 2013-2017 Strategic Plan approved by the Directors of the sub-holding company Sorgenia in March 2013 and used for impairment testing at 31 December 2012. The forecasts of future cash flows derived from the 2013-2017 Strategic Plan of the Sorgenia Group considered the time horizon of the plants' residual life, estimated at 25 years for CCGT and 20 years for wind power plants and photovoltaic systems, as already used in the impairment test at 31 December 2012, but updated to reflect a different market scenario, more conservative than in the past, changes in tax laws and the decision to suspend investment in the above wind projects. Furthermore, for the purposes of estimating the cash flows generated by the Exploration & Production sector, reference was made to their fair value less cost to sell, given the probability that the value of such assets will be measured by selling them. The main assumptions used in drawing up the Plan, in addition to those already mentioned in connection with the useful life of the plants, are represented by: - the macroeconomic forecasts for the Single National Price, split between peak and off-peak hours,
the dynamics of which reflect the trend in market scenarios for oil commodities and assumed to be rising over the period of the plan;
- forecasts of each plant's operating hours;
- the amount and duration of incentive pricing systems in line with the forecasts of current regulations;
- estimates for the price of natural gas, which foresee a price reduction assumed to be in line with recent spot market prices; the price of natural gas is estimated in dollars and converted into euro on the basis of a EUR/USD exchange rate that is expected to remain constant over the period of the plan;
- estimates of revenues from ancillary services related to the thermoelectric market (e.g. dispatching); note, however, that no assumptions have been made for additional remuneration mechanisms of the plants provided by the regulatory system (e.g. capacity payments);
- estimated operating costs, the price of green certificates and CO2 quotas expected to decline over the period of the plan;
- an estimate of the investments which primarily include maintenance of the facilities, as well as the amount of decommissioning and site restoration costs;
- forecasts about the business that assume that the customer base in the "business" market segment will be maintained.
- the estimated effect of inflation over the period of the plan, equal to 2%.
The cash flows determined in this way were then discounted using the weighted average cost of capital after tax (after-tax WACC) at 30 June 2013. The WACC applied, net of tax, took into account the specific nature of the various initiatives included in the sub-holding company Sorgenia; the parameters used for to determine the discount rate were identified by looking separately at the various activities that generate cash flows and the geographical area involved. In particular, the
55

Cons
olid
ated
fin
anci
al s
tate
men
ts
WACC was set at 6% (5.9% in 2012) for the cash flows from renewable plants and at 7.25% (6.6% in 2012) for the cash flows from CCGT plants. The impairment test performed in the manner described above is therefore reflected in a value in use for the Sorgenia Group that is lower than the carrying amount, so the CIR Group decided to write down the goodwill allocated to the CGU by Euro 169.0 million. To complete the picture, note that the further decrease in goodwill of € 3.8 million reflects the impact of the sale of the subsidiary Sorgenia UK Ltd which was finalised during the first half of the year.
56
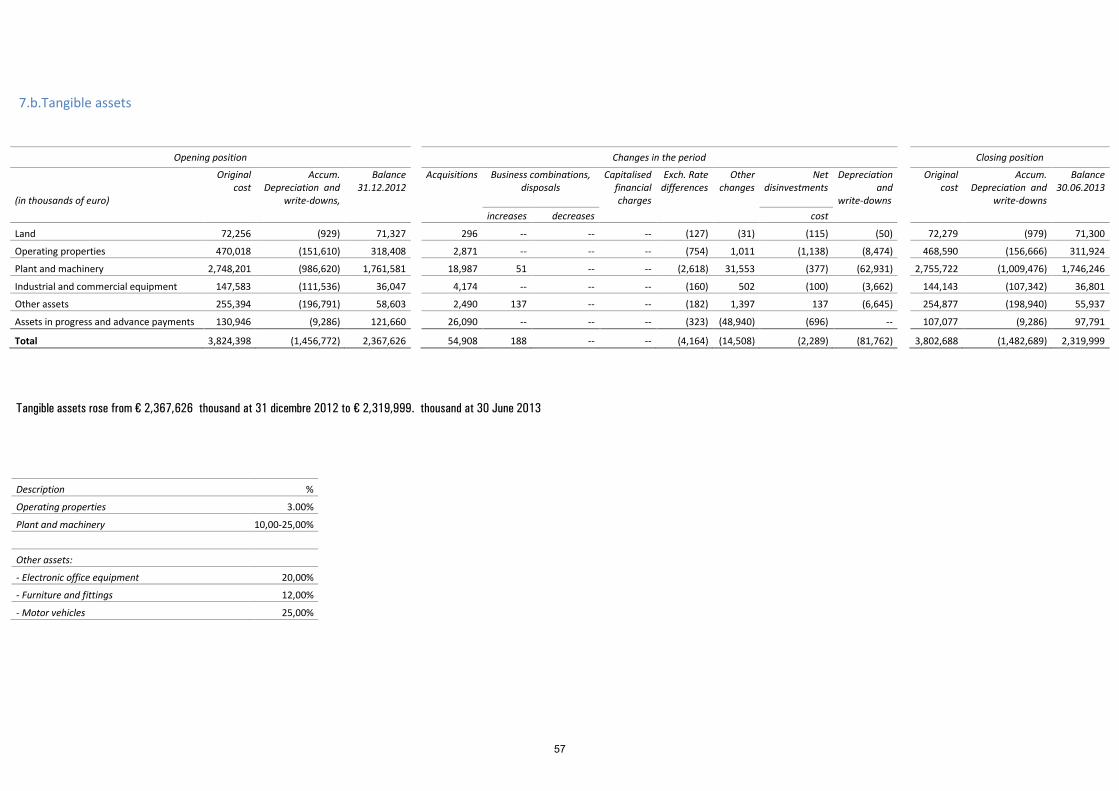
7.b.Tangible assets
Opening position Changes in the period Closing position
(in thousands of euro)
Original cost
Accum. Depreciation and
write-downs,
Balance 31.12.2012
Acquisitions Business combinations, disposals
Capitalised financial charges
Exch. Rate differences
Other changes
Net disinvestments
Depreciation and
write-downs
Original cost
Accum. Depreciation and
write-downs
Balance 30.06.2013
increases decreases
cost
Land 72,256 (929) 71,327
296 -- -- -- (127) (31) (115) (50)
72,279 (979) 71,300
Operating properties 470,018 (151,610) 318,408
2,871 -- -- -- (754) 1,011 (1,138) (8,474)
468,590 (156,666) 311,924
Plant and machinery 2,748,201 (986,620) 1,761,581
18,987 51 -- -- (2,618) 31,553 (377) (62,931)
2,755,722 (1,009,476) 1,746,246
Industrial and commercial equipment 147,583 (111,536) 36,047
4,174 -- -- -- (160) 502 (100) (3,662)
144,143 (107,342) 36,801
Other assets 255,394 (196,791) 58,603
2,490 137 -- -- (182) 1,397 137 (6,645)
254,877 (198,940) 55,937
Assets in progress and advance payments 130,946 (9,286) 121,660
26,090 -- -- -- (323) (48,940) (696) --
107,077 (9,286) 97,791
Total 3,824,398 (1,456,772) 2,367,626
54,908 188 -- -- (4,164) (14,508) (2,289) (81,762)
3,802,688 (1,482,689) 2,319,999
Description %
Operating properties 3.00%
Plant and machinery 10,00-25,00%
Other assets:
- Electronic office equipment 20,00%
- Furniture and fittings 12,00%
- Motor vehicles 25,00%
Tangible assets rose from € 2,367,626 thousand at 31 dicembre 2012 to € 2,319,999. thousand at 30 June 2013
57

7.c.Investment property
Description %
Buildings 3.00%
Opening position Changes in the period Closing position
Original cost
Accum. Depreciation and write-downs
Net Balance 31.12.2012
Acquisitions Business combinations, disposals
Capitalised financial charges
Exch. Rate differences
Other changes
Net disinvestments
Depreciation and write-downs
Original cost
Accum. Depreciation and write-downs
Balance 30.06.2013
(in thousands of euro) increases decreases
cost
Properties 28,604 (6,063) 22,541
-- -- -- -- -- 1 (205) (372)
28,399 (6,434) 21,965
Total 28,604 (6,063) 22,541
-- -- -- -- -- 1 (205) (372)
28,399 (6,434) 21,965
Investment property decreased from € 22,541 thousand at 31 December 2012 to € 21,965 thousand at 30 June 2013. The market value is significantly highter than the carrying amount.
58
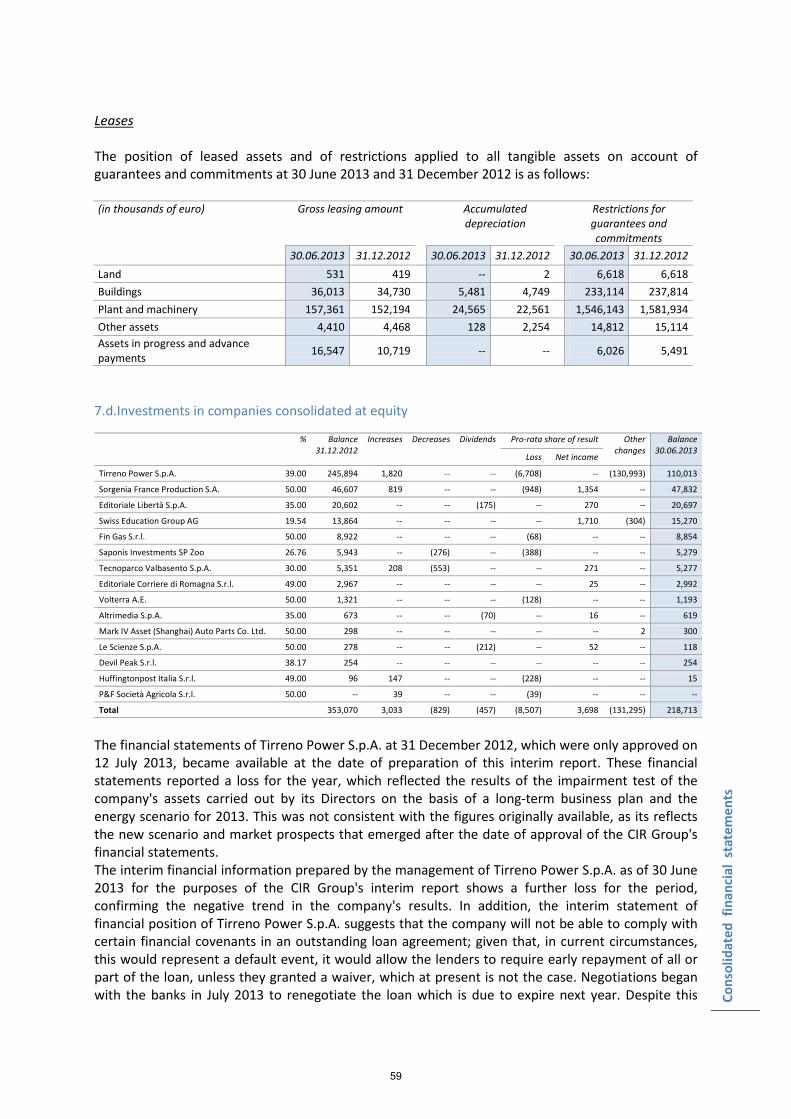
Cons
olid
ated
fin
anci
al s
tate
men
ts
Leases The position of leased assets and of restrictions applied to all tangible assets on account of guarantees and commitments at 30 June 2013 and 31 December 2012 is as follows: (in thousands of euro) Gross leasing amount Accumulated
depreciation Restrictions for
guarantees and commitments
30.06.2013 31.12.2012 30.06.2013 31.12.2012 30.06.2013 31.12.2012 Land 531 419 -- 2 6,618 6,618 Buildings 36,013 34,730 5,481 4,749 233,114 237,814 Plant and machinery 157,361 152,194 24,565 22,561 1,546,143 1,581,934 Other assets 4,410 4,468 128 2,254 14,812 15,114 Assets in progress and advance payments 16,547 10,719 -- -- 6,026 5,491
7.d.Investments in companies consolidated at equity
% Balance 31.12.2012
Increases Decreases Dividends Pro-rata share of result Other changes
Balance 30.06.2013
Loss Net income
Tirreno Power S.p.A. 39.00 245,894 1,820 -- -- (6,708) -- (130,993) 110,013
Sorgenia France Production S.A. 50.00 46,607 819 -- -- (948) 1,354 -- 47,832
Editoriale Libertà S.p.A. 35.00 20,602 -- -- (175) -- 270 -- 20,697
Swiss Education Group AG 19.54 13,864 -- -- -- -- 1,710 (304) 15,270
Fin Gas S.r.l. 50.00 8,922 -- -- -- (68) -- -- 8,854
Saponis Investments SP Zoo 26.76 5,943 -- (276) -- (388) -- -- 5,279
Tecnoparco Valbasento S.p.A. 30.00 5,351 208 (553) -- -- 271 -- 5,277
Editoriale Corriere di Romagna S.r.l. 49.00 2,967 -- -- -- -- 25 -- 2,992
Volterra A.E. 50.00 1,321 -- -- -- (128) -- -- 1,193
Altrimedia S.p.A. 35.00 673 -- -- (70) -- 16 -- 619
Mark IV Asset (Shanghai) Auto Parts Co. Ltd. 50.00 298 -- -- -- -- -- 2 300
Le Scienze S.p.A. 50.00 278 -- -- (212) -- 52 -- 118
Devil Peak S.r.l. 38.17 254 -- -- -- -- -- -- 254
Huffingtonpost Italia S.r.l. 49.00 96 147 -- -- (228) -- -- 15
P&F Società Agricola S.r.l. 50.00 -- 39 -- -- (39) -- -- --
Total 353,070 3,033 (829) (457) (8,507) 3,698 (131,295) 218,713
The financial statements of Tirreno Power S.p.A. at 31 December 2012, which were only approved on 12 July 2013, became available at the date of preparation of this interim report. These financial statements reported a loss for the year, which reflected the results of the impairment test of the company's assets carried out by its Directors on the basis of a long-term business plan and the energy scenario for 2013. This was not consistent with the figures originally available, as its reflects the new scenario and market prospects that emerged after the date of approval of the CIR Group's financial statements. The interim financial information prepared by the management of Tirreno Power S.p.A. as of 30 June 2013 for the purposes of the CIR Group's interim report shows a further loss for the period, confirming the negative trend in the company's results. In addition, the interim statement of financial position of Tirreno Power S.p.A. suggests that the company will not be able to comply with certain financial covenants in an outstanding loan agreement; given that, in current circumstances, this would represent a default event, it would allow the lenders to require early repayment of all or part of the loan, unless they granted a waiver, which at present is not the case. Negotiations began with the banks in July 2013 to renegotiate the loan which is due to expire next year. Despite this
59
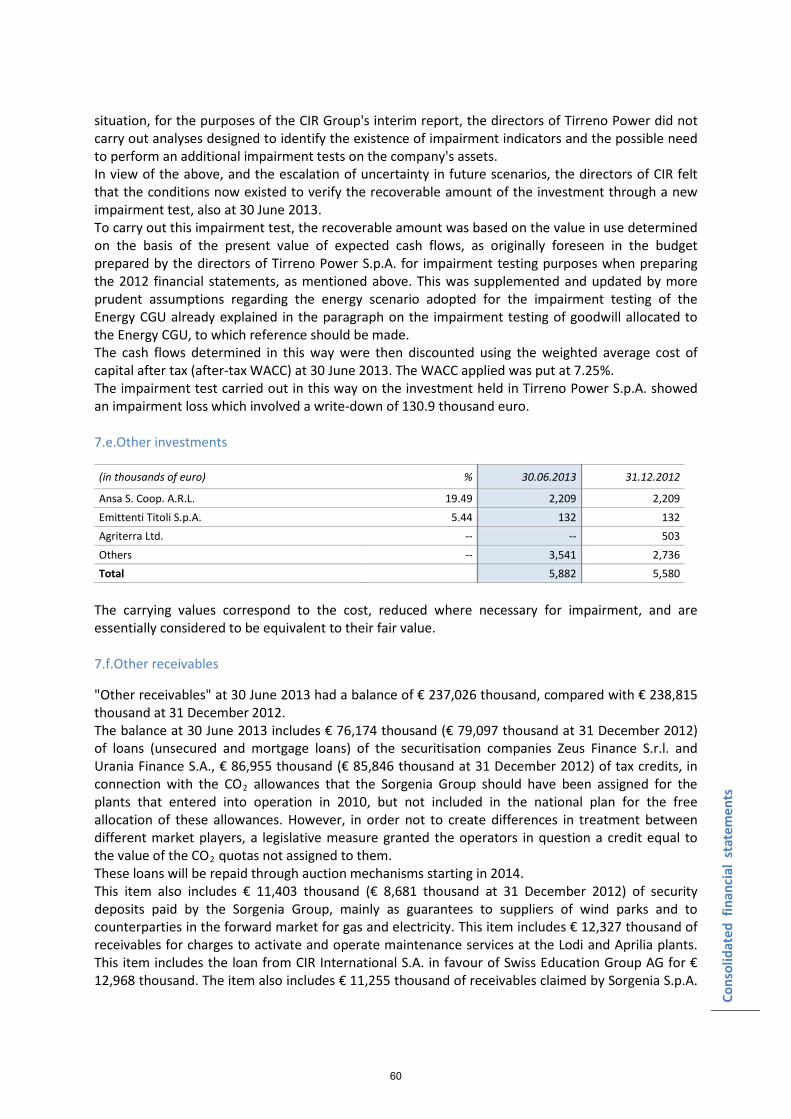
Cons
olid
ated
fin
anci
al s
tate
men
ts
situation, for the purposes of the CIR Group's interim report, the directors of Tirreno Power did not carry out analyses designed to identify the existence of impairment indicators and the possible need to perform an additional impairment tests on the company's assets. In view of the above, and the escalation of uncertainty in future scenarios, the directors of CIR felt that the conditions now existed to verify the recoverable amount of the investment through a new impairment test, also at 30 June 2013. To carry out this impairment test, the recoverable amount was based on the value in use determined on the basis of the present value of expected cash flows, as originally foreseen in the budget prepared by the directors of Tirreno Power S.p.A. for impairment testing purposes when preparing the 2012 financial statements, as mentioned above. This was supplemented and updated by more prudent assumptions regarding the energy scenario adopted for the impairment testing of the Energy CGU already explained in the paragraph on the impairment testing of goodwill allocated to the Energy CGU, to which reference should be made. The cash flows determined in this way were then discounted using the weighted average cost of capital after tax (after-tax WACC) at 30 June 2013. The WACC applied was put at 7.25%. The impairment test carried out in this way on the investment held in Tirreno Power S.p.A. showed an impairment loss which involved a write-down of 130.9 thousand euro. 7.e.Other investments
(in thousands of euro) % 30.06.2013 31.12.2012
Ansa S. Coop. A.R.L. 19.49 2,209 2,209 Emittenti Titoli S.p.A. 5.44 132 132 Agriterra Ltd. -- -- 503 Others -- 3,541 2,736 Total 5,882 5,580
The carrying values correspond to the cost, reduced where necessary for impairment, and are essentially considered to be equivalent to their fair value. 7.f.Other receivables
"Other receivables" at 30 June 2013 had a balance of € 237,026 thousand, compared with € 238,815 thousand at 31 December 2012. The balance at 30 June 2013 includes € 76,174 thousand (€ 79,097 thousand at 31 December 2012) of loans (unsecured and mortgage loans) of the securitisation companies Zeus Finance S.r.l. and Urania Finance S.A., € 86,955 thousand (€ 85,846 thousand at 31 December 2012) of tax credits, in connection with the CO2 allowances that the Sorgenia Group should have been assigned for the plants that entered into operation in 2010, but not included in the national plan for the free allocation of these allowances. However, in order not to create differences in treatment between different market players, a legislative measure granted the operators in question a credit equal to the value of the CO2 quotas not assigned to them. These loans will be repaid through auction mechanisms starting in 2014. This item also includes € 11,403 thousand (€ 8,681 thousand at 31 December 2012) of security deposits paid by the Sorgenia Group, mainly as guarantees to suppliers of wind parks and to counterparties in the forward market for gas and electricity. This item includes € 12,327 thousand of receivables for charges to activate and operate maintenance services at the Lodi and Aprilia plants. This item includes the loan from CIR International S.A. in favour of Swiss Education Group AG for € 12,968 thousand. The item also includes € 11,255 thousand of receivables claimed by Sorgenia S.p.A.
60
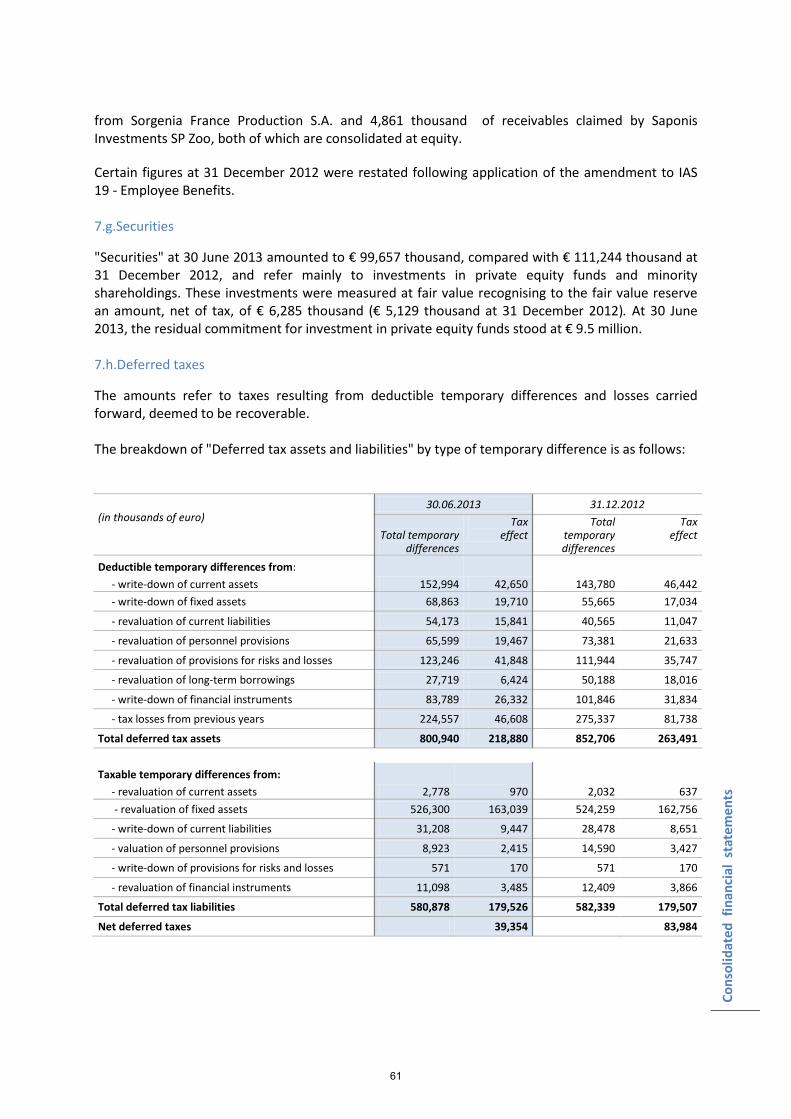
Cons
olid
ated
fin
anci
al s
tate
men
ts
from Sorgenia France Production S.A. and 4,861 thousand of receivables claimed by Saponis Investments SP Zoo, both of which are consolidated at equity. Certain figures at 31 December 2012 were restated following application of the amendment to IAS 19 - Employee Benefits. 7.g.Securities
"Securities" at 30 June 2013 amounted to € 99,657 thousand, compared with € 111,244 thousand at 31 December 2012, and refer mainly to investments in private equity funds and minority shareholdings. These investments were measured at fair value recognising to the fair value reserve an amount, net of tax, of € 6,285 thousand (€ 5,129 thousand at 31 December 2012). At 30 June 2013, the residual commitment for investment in private equity funds stood at € 9.5 million. 7.h.Deferred taxes
The amounts refer to taxes resulting from deductible temporary differences and losses carried forward, deemed to be recoverable. The breakdown of "Deferred tax assets and liabilities" by type of temporary difference is as follows:
(in thousands of euro)
30.06.2013 31.12.2012
Total temporary differences
Tax effect
Total temporary differences
Tax effect
Deductible temporary differences from: - write-down of current assets 152,994 42,650 143,780 46,442 - write-down of fixed assets 68,863 19,710 55,665 17,034
- revaluation of current liabilities 54,173 15,841 40,565 11,047
- revaluation of personnel provisions 65,599 19,467 73,381 21,633
- revaluation of provisions for risks and losses 123,246 41,848 111,944 35,747
- revaluation of long-term borrowings 27,719 6,424 50,188 18,016
- write-down of financial instruments 83,789 26,332 101,846 31,834
- tax losses from previous years 224,557 46,608 275,337 81,738
Total deferred tax assets 800,940 218,880 852,706 263,491
Taxable temporary differences from: - revaluation of current assets 2,778 970 2,032 637 - revaluation of fixed assets 526,300 163,039 524,259 162,756
- write-down of current liabilities 31,208 9,447 28,478 8,651
- valuation of personnel provisions 8,923 2,415 14,590 3,427
- write-down of provisions for risks and losses 571 170 571 170
- revaluation of financial instruments 11,098 3,485 12,409 3,866
Total deferred tax liabilities 580,878 179,526 582,339 179,507
Net deferred taxes 39,354 83,984
61
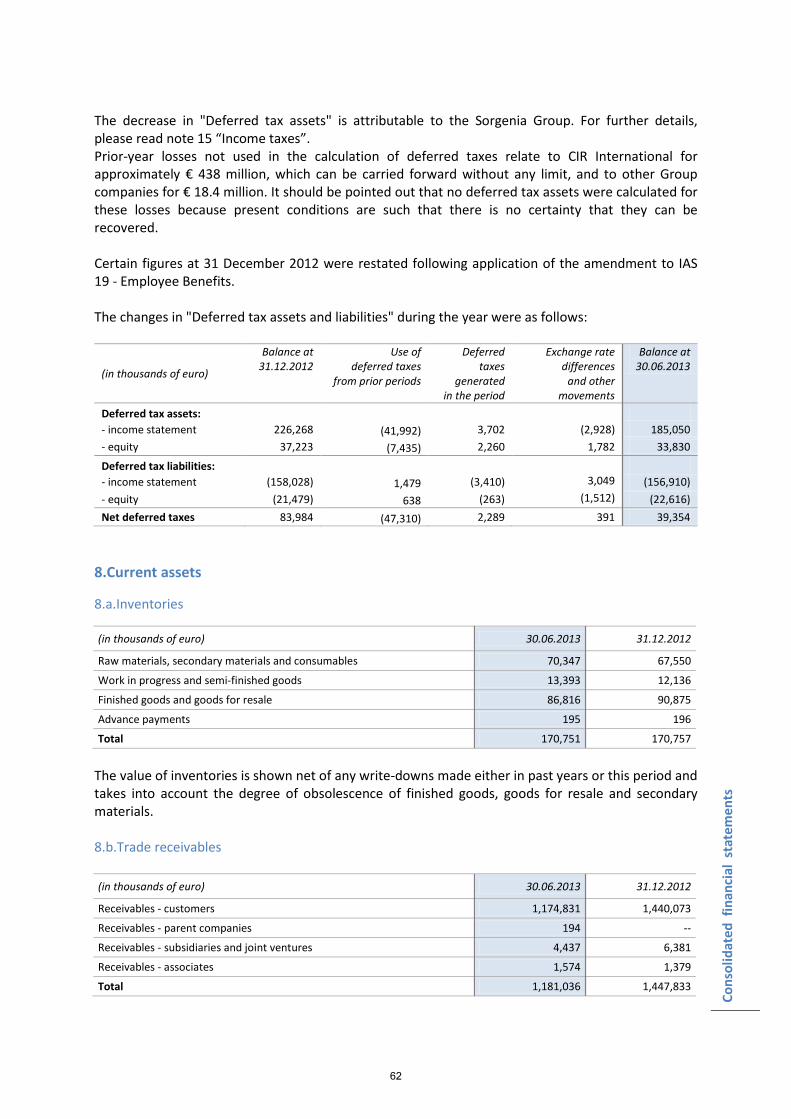
Cons
olid
ated
fin
anci
al s
tate
men
ts
The decrease in "Deferred tax assets" is attributable to the Sorgenia Group. For further details, please read note 15 “Income taxes”. Prior-year losses not used in the calculation of deferred taxes relate to CIR International for approximately € 438 million, which can be carried forward without any limit, and to other Group companies for € 18.4 million. It should be pointed out that no deferred tax assets were calculated for these losses because present conditions are such that there is no certainty that they can be recovered. Certain figures at 31 December 2012 were restated following application of the amendment to IAS 19 - Employee Benefits. The changes in "Deferred tax assets and liabilities" during the year were as follows:
(in thousands of euro)
Balance at 31.12.2012
Use of deferred taxes
from prior periods
Deferred taxes
generated in the period
Exchange rate differences
and other movements
Balance at 30.06.2013
Deferred tax assets: - income statement 226,268 (41,992) 3,702 (2,928) 185,050 - equity 37,223 (7,435) 2,260 1,782 33,830
Deferred tax liabilities: - income statement (158,028) 1,479 (3,410) 3,049 (156,910) - equity (21,479) 638 (263) (1,512) (22,616) Net deferred taxes 83,984 (47,310) 2,289 391 39,354
8.Current assets
8.a.Inventories
(in thousands of euro) 30.06.2013 31.12.2012
Raw materials, secondary materials and consumables 70,347 67,550
Work in progress and semi-finished goods 13,393 12,136
Finished goods and goods for resale 86,816 90,875
Advance payments 195 196
Total 170,751 170,757
The value of inventories is shown net of any write-downs made either in past years or this period and takes into account the degree of obsolescence of finished goods, goods for resale and secondary materials. 8.b.Trade receivables (in thousands of euro) 30.06.2013 31.12.2012
Receivables - customers 1,174,831 1,440,073
Receivables - parent companies 194 --
Receivables - subsidiaries and joint ventures 4,437 6,381
Receivables - associates 1,574 1,379
Total 1,181,036 1,447,833
62
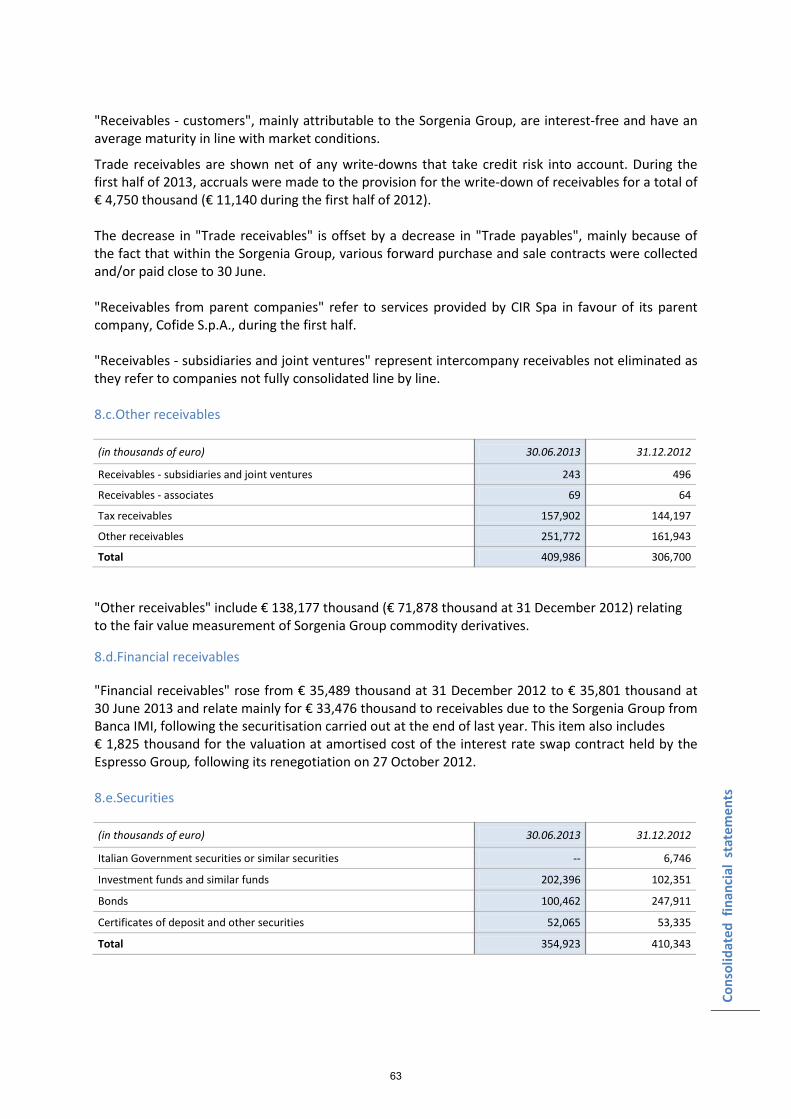
Cons
olid
ated
fin
anci
al s
tate
men
ts
"Receivables - customers", mainly attributable to the Sorgenia Group, are interest-free and have an average maturity in line with market conditions.
Trade receivables are shown net of any write-downs that take credit risk into account. During the first half of 2013, accruals were made to the provision for the write-down of receivables for a total of € 4,750 thousand (€ 11,140 during the first half of 2012). The decrease in "Trade receivables" is offset by a decrease in "Trade payables", mainly because of the fact that within the Sorgenia Group, various forward purchase and sale contracts were collected and/or paid close to 30 June. "Receivables from parent companies" refer to services provided by CIR Spa in favour of its parent company, Cofide S.p.A., during the first half. "Receivables - subsidiaries and joint ventures" represent intercompany receivables not eliminated as they refer to companies not fully consolidated line by line. 8.c.Other receivables
(in thousands of euro) 30.06.2013 31.12.2012
Receivables - subsidiaries and joint ventures 243 496
Receivables - associates 69 64
Tax receivables 157,902 144,197
Other receivables 251,772 161,943
Total 409,986 306,700
"Other receivables" include € 138,177 thousand (€ 71,878 thousand at 31 December 2012) relating to the fair value measurement of Sorgenia Group commodity derivatives.
8.d.Financial receivables
"Financial receivables" rose from € 35,489 thousand at 31 December 2012 to € 35,801 thousand at 30 June 2013 and relate mainly for € 33,476 thousand to receivables due to the Sorgenia Group from Banca IMI, following the securitisation carried out at the end of last year. This item also includes € 1,825 thousand for the valuation at amortised cost of the interest rate swap contract held by the Espresso Group, following its renegotiation on 27 October 2012. 8.e.Securities
(in thousands of euro) 30.06.2013 31.12.2012
Italian Government securities or similar securities -- 6,746
Investment funds and similar funds 202,396 102,351
Bonds 100,462 247,911
Certificates of deposit and other securities 52,065 53,335
Total 354,923 410,343
63

Cons
olid
ated
fin
anci
al s
tate
men
ts
The decrease in this item is due to a different strategy for investing cash, which mainly consisted of short-term bank deposits. The fair value measurement of "Securities" led to a positive adjustment to the income statement of € 1.2 million. 8.f.Available-for-sale financial assets
This item totals € 105,977 thousand and refers for € 90,208 thousand to shares in hedge funds and redeemable shares in asset management companies held by CIR International S.A.. The degree of liquidity of the investment is a function of the time required for the redemption of the funds, which normally varies from one to three months. The fair value measurement of these funds involved a total value adjustment of € 20,725 thousand (€ 14,425 thousand at 31 December 2012). The item also includes € 15,769 thousand of bonds held by the Espresso Group with maturities between 14 June 2014 and 7 October 2014. The positive effect of the change in these securities on the Group's share of CIR's equity, net of tax, came to € 45 thousand. 8.g.Cash and cash equivalents
They rose from € 666,153 thousand at 31 December 2012 to € 851,091 thousand at 30 June 2013. A breakdown of the changes is given in the statement of cash flows. 8.h.Assets and liabilities held for disposal
The balance at 31 December 2012 related to assets of the Sorgenia Groups held for disposal. The disposals were completed during the period. 9. Equity
9.a.Share capital
The share capital at 30 June 2013 amounts to € 396,670,233.50, the same as at 31 December 2012, and is made up of 793,340,467 shares with a nominal value of € 0.50 each. At 30 June 2013 the Company held 49,915,317 treasury shares (6.29% of the share capital) for a value of € 108,180 thousand, compared with 49,989,000 treasury shares (6.30% of the share capital) for a value of € 108,340 thousand at 31 December 2012. In application of IAS 32, treasury shares held by the Parent Company are deducted from total equity. The share capital is fully subscribed and paid up. None of the shares are subject to any rights, privileges or limitations on the distribution of dividends, with the exception of treasury shares. Note that for a period of five years from 30 April 2009 the Board of Directors was authorised to increase the share capital once or more by a maximum of € 500 million (nominal value) and for a further maximum of € 20 million (nominal value) in favour of employees of the Company, its subsidiaries and parent companies. Regarding stock option plans and stock grants, at 30 June 2013 there were 47,861,732 options outstanding, corresponding to an equivalent number of shares. The "Stock option and stock grant reserve" refers to the notional value of the incentives assigned to employees and approved after 7 November 2002.
64
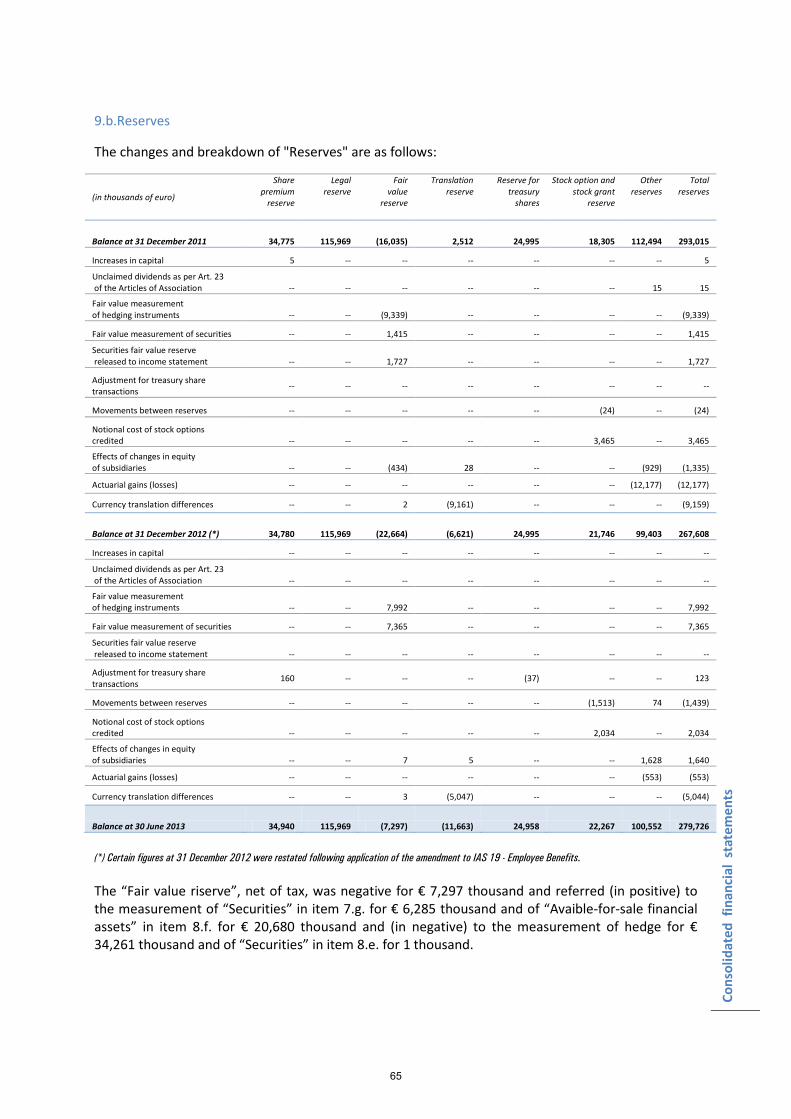
Cons
olid
ated
fin
anci
al s
tate
men
ts
9.b.Reserves
The changes and breakdown of "Reserves" are as follows:
(in thousands of euro)
Share premium
reserve
Legal reserve
Fair value
reserve
Translation reserve
Reserve for treasury
shares
Stock option and stock grant
reserve
Other reserves
Total reserves
Balance at 31 December 2011 34,775 115,969 (16,035) 2,512 24,995 18,305 112,494 293,015
Increases in capital 5 -- -- -- -- -- -- 5
Unclaimed dividends as per Art. 23 of the Articles of Association -- -- -- -- -- -- 15 15
Fair value measurement of hedging instruments -- -- (9,339) -- -- -- -- (9,339)
Fair value measurement of securities -- -- 1,415 -- -- -- -- 1,415
Securities fair value reserve released to income statement -- -- 1,727 -- -- -- -- 1,727
Adjustment for treasury share transactions -- -- -- -- -- -- -- --
Movements between reserves -- -- -- -- -- (24) -- (24)
Notional cost of stock options credited -- -- -- -- -- 3,465 -- 3,465
Effects of changes in equity of subsidiaries -- -- (434) 28 -- -- (929) (1,335)
Actuarial gains (losses) -- -- -- -- -- -- (12,177) (12,177)
Currency translation differences -- -- 2 (9,161) -- -- -- (9,159)
Balance at 31 December 2012 (*) 34,780 115,969 (22,664) (6,621) 24,995 21,746 99,403 267,608
Increases in capital -- -- -- -- -- -- -- --
Unclaimed dividends as per Art. 23 of the Articles of Association -- -- -- -- -- -- -- --
Fair value measurement of hedging instruments -- -- 7,992 -- -- -- -- 7,992
Fair value measurement of securities -- -- 7,365 -- -- -- -- 7,365
Securities fair value reserve released to income statement -- -- -- -- -- -- -- --
Adjustment for treasury share transactions 160 -- -- -- (37) -- -- 123
Movements between reserves -- -- -- -- -- (1,513) 74 (1,439)
Notional cost of stock options credited -- -- -- -- -- 2,034 -- 2,034
Effects of changes in equity of subsidiaries -- -- 7 5 -- -- 1,628 1,640
Actuarial gains (losses) -- -- -- -- -- -- (553) (553)
Currency translation differences -- -- 3 (5,047) -- -- -- (5,044)
Balance at 30 June 2013 34,940 115,969 (7,297) (11,663) 24,958 22,267 100,552 279,726
(*) Certain figures at 31 December 2012 were restated following application of the amendment to IAS 19 - Employee Benefits. The “Fair value riserve”, net of tax, was negative for € 7,297 thousand and referred (in positive) to the measurement of “Securities” in item 7.g. for € 6,285 thousand and of “Avaible-for-sale financial assets” in item 8.f. for € 20,680 thousand and (in negative) to the measurement of hedge for € 34,261 thousand and of “Securities” in item 8.e. for 1 thousand.
65

Cons
olid
ated
fin
anci
al s
tate
men
ts
The "Translation reserve" had a negative balance of € 11,663 thousand at 30 June 2013 with the following breakdown:
(in thousands of euro) 31.12.2012 (*) Increases Decreases 30.06.2013
Sogefi Group (4,040) -- (4,156) (8,196)
KOS Group 3 -- (37) (34)
CIR Ventures (2,224) 110 -- (2,114)
CIR International (1,887) -- (11) (1,898)
Sorgenia Group 1,429 -- (944) 485
Others 98 -- (4) 94
Total (6,621) 110 (5,152) (11,663)
(*) Certain figures at 31 December 2012 were restated following application of the amendment to IAS 19 - Employee Benefits. “Other reserves” are made up as follows: (in thousands of euro)
Reserve for capital increases 3
Statutory reserve 148
Reserve for the difference between the carrying values of investee companies and the respective portions of consolidated equity 100,401 Total 100,552
The changes in treasury shares during the year were as follows: (in thousands of euro) Number of shares Value
Balance at 31 December 2012 49,989,000 108,340
Decreases (73,683) (160)
Balance at 30 June 2013 49,915,317 108,180
9.c. Retained earnings (losses)
The changes in Retained earnings (losses) are shown in the "Statement of Changes in Equity”.
66
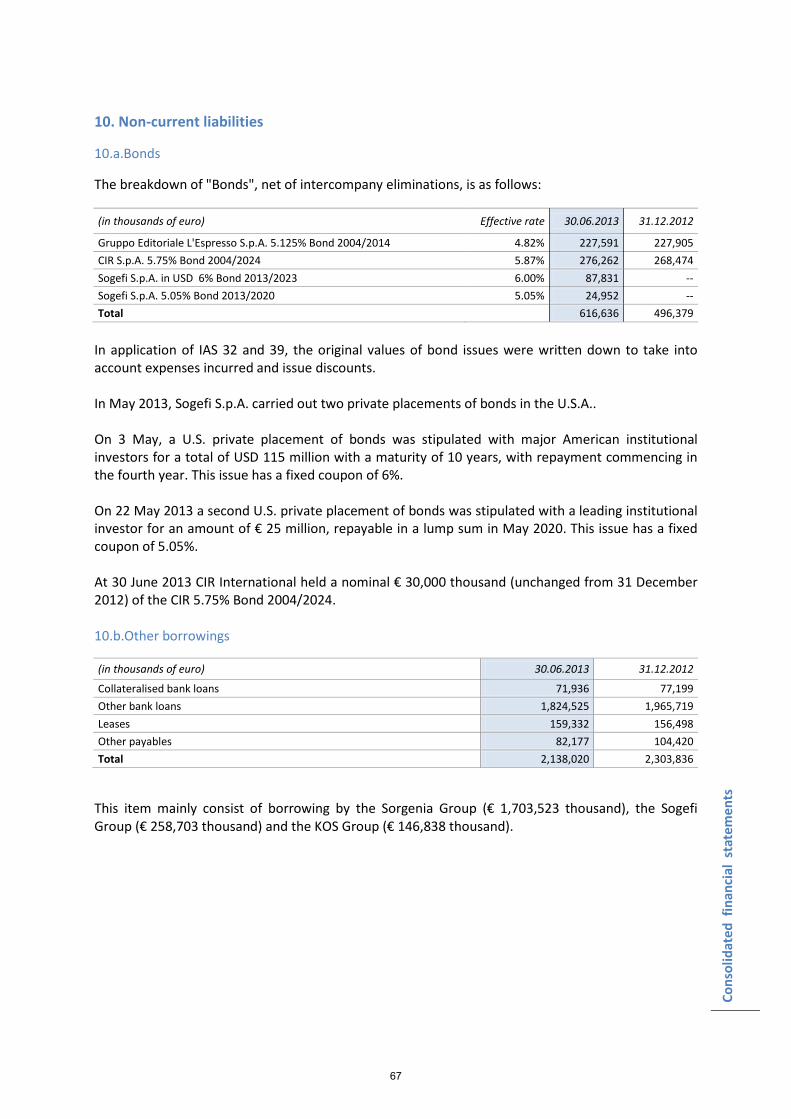
Cons
olid
ated
fin
anci
al s
tate
men
ts
10. Non-current liabilities
10.a.Bonds
The breakdown of "Bonds", net of intercompany eliminations, is as follows:
(in thousands of euro) Effective rate 30.06.2013 31.12.2012
Gruppo Editoriale L'Espresso S.p.A. 5.125% Bond 2004/2014 4.82% 227,591 227,905 CIR S.p.A. 5.75% Bond 2004/2024 5.87% 276,262 268,474 Sogefi S.p.A. in USD 6% Bond 2013/2023 6.00% 87,831 -- Sogefi S.p.A. 5.05% Bond 2013/2020 5.05% 24,952 -- Total 616,636 496,379
In application of IAS 32 and 39, the original values of bond issues were written down to take into account expenses incurred and issue discounts. In May 2013, Sogefi S.p.A. carried out two private placements of bonds in the U.S.A.. On 3 May, a U.S. private placement of bonds was stipulated with major American institutional investors for a total of USD 115 million with a maturity of 10 years, with repayment commencing in the fourth year. This issue has a fixed coupon of 6%. On 22 May 2013 a second U.S. private placement of bonds was stipulated with a leading institutional investor for an amount of € 25 million, repayable in a lump sum in May 2020. This issue has a fixed coupon of 5.05%. At 30 June 2013 CIR International held a nominal € 30,000 thousand (unchanged from 31 December 2012) of the CIR 5.75% Bond 2004/2024. 10.b.Other borrowings
(in thousands of euro) 30.06.2013 31.12.2012
Collateralised bank loans 71,936 77,199 Other bank loans 1,824,525 1,965,719 Leases 159,332 156,498 Other payables 82,177 104,420 Total 2,138,020 2,303,836
This item mainly consist of borrowing by the Sorgenia Group (€ 1,703,523 thousand), the Sogefi Group (€ 258,703 thousand) and the KOS Group (€ 146,838 thousand).
67
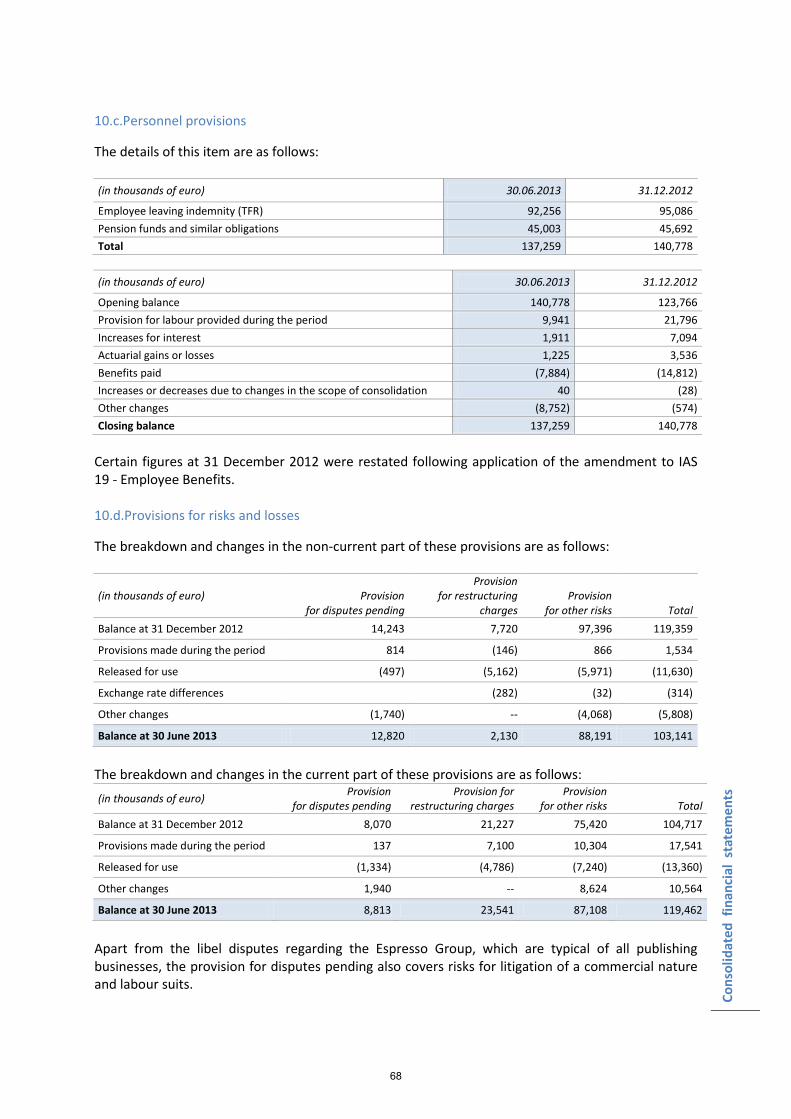
Cons
olid
ated
fin
anci
al s
tate
men
ts
10.c.Personnel provisions
The details of this item are as follows: (in thousands of euro) 30.06.2013 31.12.2012
Employee leaving indemnity (TFR) 92,256 95,086 Pension funds and similar obligations 45,003 45,692 Total 137,259 140,778
(in thousands of euro) 30.06.2013 31.12.2012
Opening balance 140,778 123,766 Provision for labour provided during the period 9,941 21,796 Increases for interest 1,911 7,094 Actuarial gains or losses 1,225 3,536 Benefits paid (7,884) (14,812) Increases or decreases due to changes in the scope of consolidation 40 (28) Other changes (8,752) (574) Closing balance 137,259 140,778
Certain figures at 31 December 2012 were restated following application of the amendment to IAS 19 - Employee Benefits. 10.d.Provisions for risks and losses
The breakdown and changes in the non-current part of these provisions are as follows:
(in thousands of euro) Provision for disputes pending
Provision for restructuring
charges Provision
for other risks Total Balance at 31 December 2012 14,243 7,720 97,396 119,359
Provisions made during the period 814 (146) 866 1,534
Released for use (497) (5,162) (5,971) (11,630)
Exchange rate differences (282) (32) (314)
Other changes (1,740) -- (4,068) (5,808)
Balance at 30 June 2013 12,820 2,130 88,191 103,141
The breakdown and changes in the current part of these provisions are as follows:
(in thousands of euro) Provision for disputes pending
Provision for restructuring charges
Provision for other risks Total
Balance at 31 December 2012 8,070 21,227 75,420 104,717
Provisions made during the period 137 7,100 10,304 17,541
Released for use (1,334) (4,786) (7,240) (13,360)
Other changes 1,940 -- 8,624 10,564
Balance at 30 June 2013 8,813 23,541 87,108 119,462
Apart from the libel disputes regarding the Espresso Group, which are typical of all publishing businesses, the provision for disputes pending also covers risks for litigation of a commercial nature and labour suits.
68
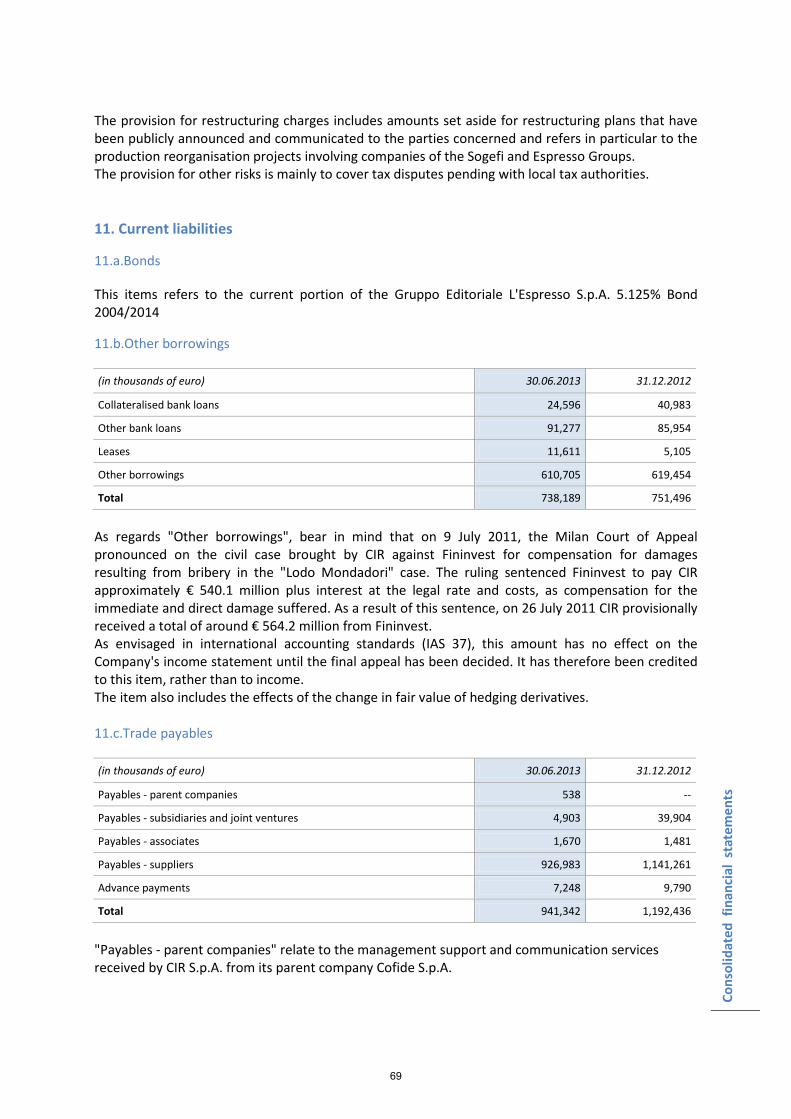
Cons
olid
ated
fin
anci
al s
tate
men
ts
The provision for restructuring charges includes amounts set aside for restructuring plans that have been publicly announced and communicated to the parties concerned and refers in particular to the production reorganisation projects involving companies of the Sogefi and Espresso Groups. The provision for other risks is mainly to cover tax disputes pending with local tax authorities. 11. Current liabilities
11.a.Bonds
This items refers to the current portion of the Gruppo Editoriale L'Espresso S.p.A. 5.125% Bond 2004/2014
11.b.Other borrowings
(in thousands of euro) 30.06.2013 31.12.2012
Collateralised bank loans 24,596 40,983
Other bank loans 91,277 85,954
Leases 11,611 5,105
Other borrowings 610,705 619,454
Total 738,189 751,496
As regards "Other borrowings", bear in mind that on 9 July 2011, the Milan Court of Appeal pronounced on the civil case brought by CIR against Fininvest for compensation for damages resulting from bribery in the "Lodo Mondadori" case. The ruling sentenced Fininvest to pay CIR approximately € 540.1 million plus interest at the legal rate and costs, as compensation for the immediate and direct damage suffered. As a result of this sentence, on 26 July 2011 CIR provisionally received a total of around € 564.2 million from Fininvest. As envisaged in international accounting standards (IAS 37), this amount has no effect on the Company's income statement until the final appeal has been decided. It has therefore been credited to this item, rather than to income. The item also includes the effects of the change in fair value of hedging derivatives. 11.c.Trade payables
(in thousands of euro) 30.06.2013 31.12.2012
Payables - parent companies 538 --
Payables - subsidiaries and joint ventures 4,903 39,904
Payables - associates 1,670 1,481
Payables - suppliers 926,983 1,141,261
Advance payments 7,248 9,790
Total 941,342 1,192,436
"Payables - parent companies" relate to the management support and communication services received by CIR S.p.A. from its parent company Cofide S.p.A.
69
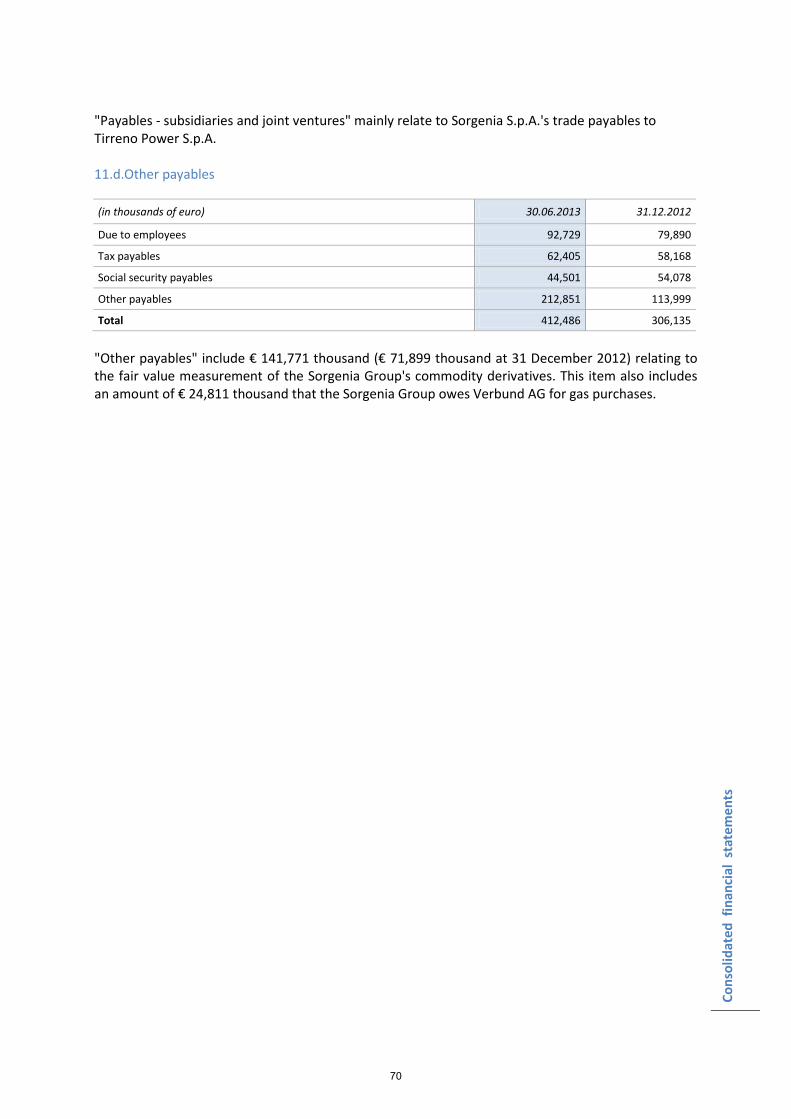
Cons
olid
ated
fin
anci
al s
tate
men
ts
"Payables - subsidiaries and joint ventures" mainly relate to Sorgenia S.p.A.'s trade payables to Tirreno Power S.p.A. 11.d.Other payables
(in thousands of euro) 30.06.2013 31.12.2012
Due to employees 92,729 79,890
Tax payables 62,405 58,168
Social security payables 44,501 54,078
Other payables 212,851 113,999
Total 412,486 306,135
"Other payables" include € 141,771 thousand (€ 71,899 thousand at 31 December 2012) relating to the fair value measurement of the Sorgenia Group's commodity derivatives. This item also includes an amount of € 24,811 thousand that the Sorgenia Group owes Verbund AG for gas purchases.
70
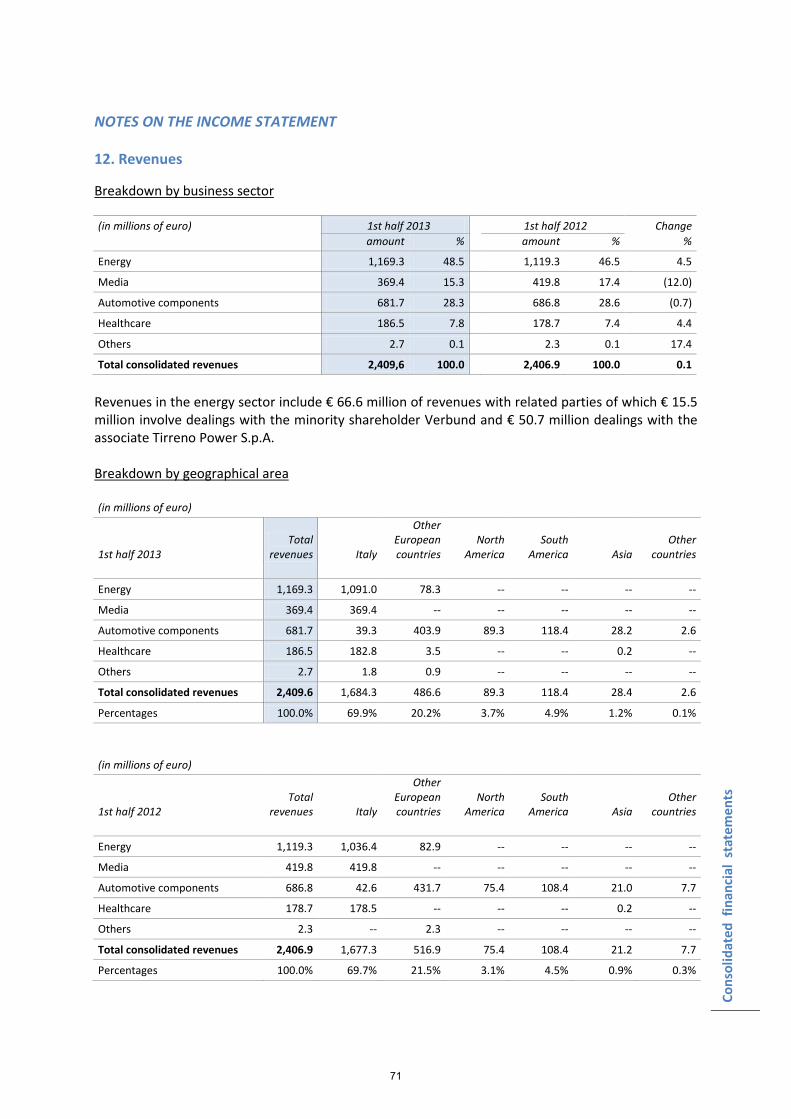
Cons
olid
ated
fin
anci
al s
tate
men
ts
NOTES ON THE INCOME STATEMENT 12. Revenues
Breakdown by business sector
(in millions of euro) 1st half 2013 1st half 2012 Change amount % amount % %
Energy 1,169.3 48.5 1,119.3 46.5 4.5
Media 369.4 15.3 419.8 17.4 (12.0)
Automotive components 681.7 28.3 686.8 28.6 (0.7)
Healthcare 186.5 7.8 178.7 7.4 4.4
Others 2.7 0.1 2.3 0.1 17.4
Total consolidated revenues 2,409,6 100.0 2,406.9 100.0 0.1
Revenues in the energy sector include € 66.6 million of revenues with related parties of which € 15.5 million involve dealings with the minority shareholder Verbund and € 50.7 million dealings with the associate Tirreno Power S.p.A. Breakdown by geographical area (in millions of euro)
1st half 2013 Total
revenues Italy
Other European countries
North America
South America Asia
Other countries
Energy 1,169.3 1,091.0 78.3 -- -- -- --
Media 369.4 369.4 -- -- -- -- --
Automotive components 681.7 39.3 403.9 89.3 118.4 28.2 2.6
Healthcare 186.5 182.8 3.5 -- -- 0.2 --
Others 2.7 1.8 0.9 -- -- -- --
Total consolidated revenues 2,409.6 1,684.3 486.6 89.3 118.4 28.4 2.6
Percentages 100.0% 69.9% 20.2% 3.7% 4.9% 1.2% 0.1%
(in millions of euro)
1st half 2012 Total
revenues Italy
Other European countries
North America
South America Asia
Other countries
Energy 1,119.3 1,036.4 82.9 -- -- -- --
Media 419.8 419.8 -- -- -- -- --
Automotive components 686.8 42.6 431.7 75.4 108.4 21.0 7.7
Healthcare 178.7 178.5 -- -- -- 0.2 --
Others 2.3 -- 2.3 -- -- -- --
Total consolidated revenues 2,406.9 1,677.3 516.9 75.4 108.4 21.2 7.7
Percentages 100.0% 69.7% 21.5% 3.1% 4.5% 0.9% 0.3%
71

Cons
olid
ated
fin
anci
al s
tate
men
ts
The types of products marketed by the Group and the nature of its business sectors mean that revenue flows are reasonably linear throughout the year and are not subject to any particular cyclical phenomena on a like-for-like basis. 13. Operating costs and income
13.a.Costs for the purchase of goods
Costs for the purchase of goods increased from € 1,393,495 thousand in the first half of 2012 to € 1,379,917 thousand in the same period of 2013. These costs include € 47.3 million paid to related parties of which € 46.9 million attributable to dealings with Tirreno Power S.p.A., an associate.
13.b.Costs for services
This item went from € 426,985 thousand in the first half of 2012 to € 394,151 thousand in the first half of 2013, as can be seen from the following breakdown:
(in thousands of euro) 1st half 2013
1st half 2012
Services from the Parent Company 538 556
Technical and professional consulting 52,116 55,003
Distribution and transport costs 21,007 21,064
Outsourcing 27,466 32,836
Other expenses 293,024 317,526
Total 394,151 426,985
13.c. Personnel costs
Personnel costs amounted to € 377,289 thousand in the first half of 2013 (€ 381,823 thousand in the first half of 2012) and are as follows:
(in thousands of euro) 1st half 2013
1st half 2012
Salaries and wages 264,697 269,395
Social security contributions 85,566 87,466
Employee leaving indemnity 9,754 9,785
Pensions and similar benefits 187 1,078
Valuation of stock option plans 4,349 5,078
Other costs 12,736 9,021
Total 377,289 381,823
The average number of employees of the Group in the first half of 2013 was 13,946 (14,089 in the first half of 2012).
72
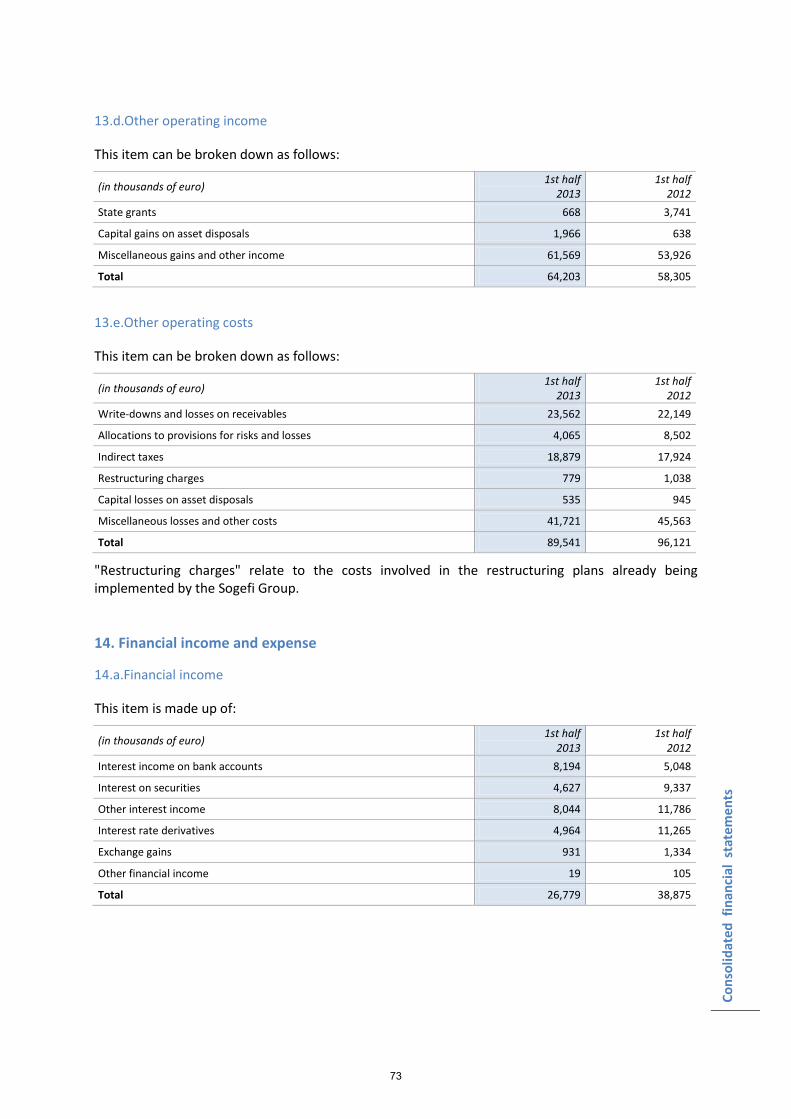
Cons
olid
ated
fin
anci
al s
tate
men
ts
13.d.Other operating income
This item can be broken down as follows:
(in thousands of euro) 1st half 2013
1st half 2012
State grants 668 3,741
Capital gains on asset disposals 1,966 638
Miscellaneous gains and other income 61,569 53,926
Total 64,203 58,305
13.e.Other operating costs
This item can be broken down as follows:
(in thousands of euro) 1st half 2013
1st half 2012
Write-downs and losses on receivables 23,562 22,149
Allocations to provisions for risks and losses 4,065 8,502
Indirect taxes 18,879 17,924
Restructuring charges 779 1,038
Capital losses on asset disposals 535 945
Miscellaneous losses and other costs 41,721 45,563
Total 89,541 96,121
"Restructuring charges" relate to the costs involved in the restructuring plans already being implemented by the Sogefi Group. 14. Financial income and expense
14.a.Financial income
This item is made up of:
(in thousands of euro) 1st half 2013
1st half 2012
Interest income on bank accounts 8,194 5,048
Interest on securities 4,627 9,337
Other interest income 8,044 11,786
Interest rate derivatives 4,964 11,265
Exchange gains 931 1,334
Other financial income 19 105
Total 26,779 38,875
73
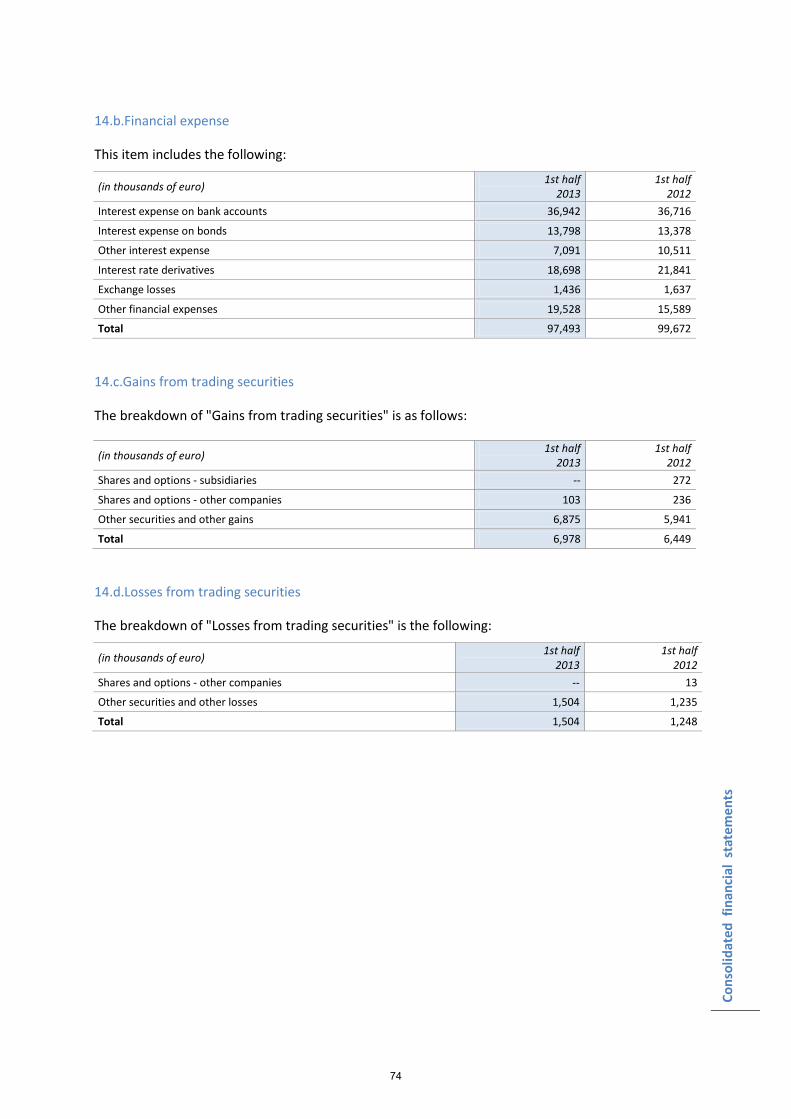
Cons
olid
ated
fin
anci
al s
tate
men
ts
14.b.Financial expense
This item includes the following:
(in thousands of euro) 1st half 2013
1st half 2012
Interest expense on bank accounts 36,942 36,716
Interest expense on bonds 13,798 13,378
Other interest expense 7,091 10,511
Interest rate derivatives 18,698 21,841
Exchange losses 1,436 1,637
Other financial expenses 19,528 15,589
Total 97,493 99,672
14.c.Gains from trading securities
The breakdown of "Gains from trading securities" is as follows:
(in thousands of euro) 1st half 2013
1st half 2012
Shares and options - subsidiaries -- 272
Shares and options - other companies 103 236
Other securities and other gains 6,875 5,941
Total 6,978 6,449
14.d.Losses from trading securities
The breakdown of "Losses from trading securities" is the following:
(in thousands of euro) 1st half 2013
1st half 2012
Shares and options - other companies -- 13
Other securities and other losses 1,504 1,235
Total 1,504 1,248
74
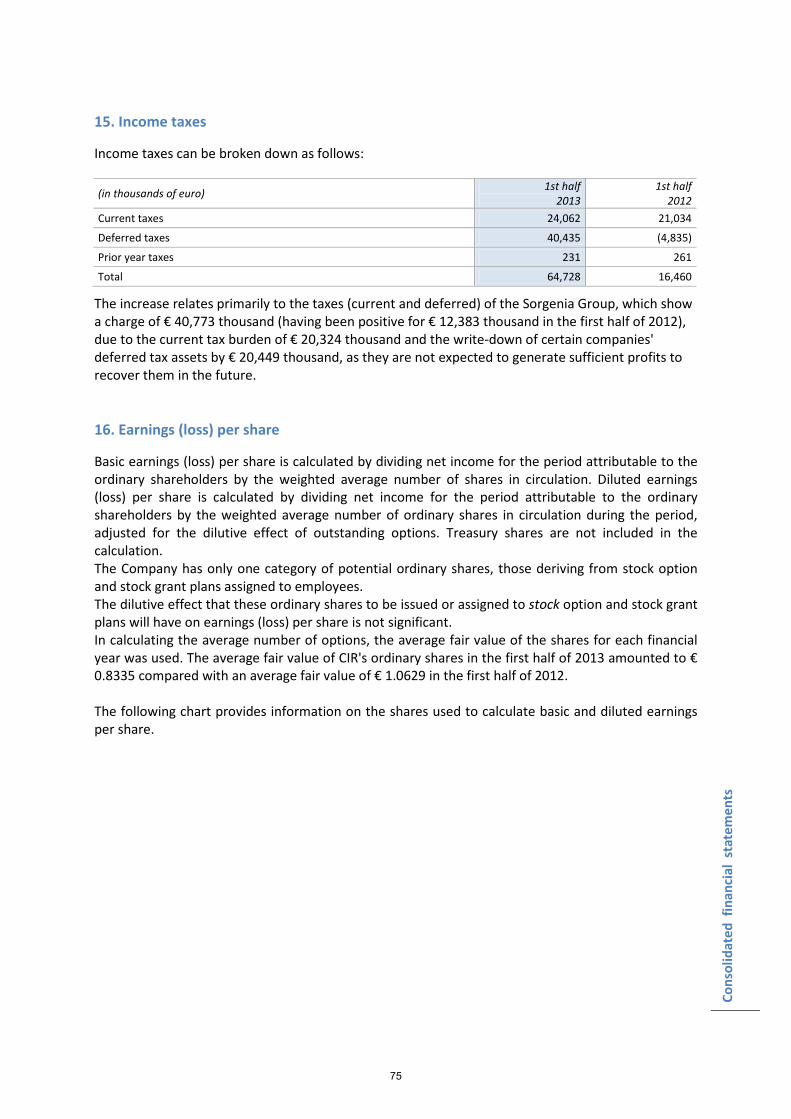
Cons
olid
ated
fin
anci
al s
tate
men
ts
15. Income taxes
Income taxes can be broken down as follows:
(in thousands of euro) 1st half 2013
1st half 2012
Current taxes 24,062 21,034
Deferred taxes 40,435 (4,835)
Prior year taxes 231 261
Total 64,728 16,460
The increase relates primarily to the taxes (current and deferred) of the Sorgenia Group, which show a charge of € 40,773 thousand (having been positive for € 12,383 thousand in the first half of 2012), due to the current tax burden of € 20,324 thousand and the write-down of certain companies' deferred tax assets by € 20,449 thousand, as they are not expected to generate sufficient profits to recover them in the future. 16. Earnings (loss) per share
Basic earnings (loss) per share is calculated by dividing net income for the period attributable to the ordinary shareholders by the weighted average number of shares in circulation. Diluted earnings (loss) per share is calculated by dividing net income for the period attributable to the ordinary shareholders by the weighted average number of ordinary shares in circulation during the period, adjusted for the dilutive effect of outstanding options. Treasury shares are not included in the calculation. The Company has only one category of potential ordinary shares, those deriving from stock option and stock grant plans assigned to employees. The dilutive effect that these ordinary shares to be issued or assigned to stock option and stock grant plans will have on earnings (loss) per share is not significant. In calculating the average number of options, the average fair value of the shares for each financial year was used. The average fair value of CIR's ordinary shares in the first half of 2013 amounted to € 0.8335 compared with an average fair value of € 1.0629 in the first half of 2012. The following chart provides information on the shares used to calculate basic and diluted earnings per share.
75
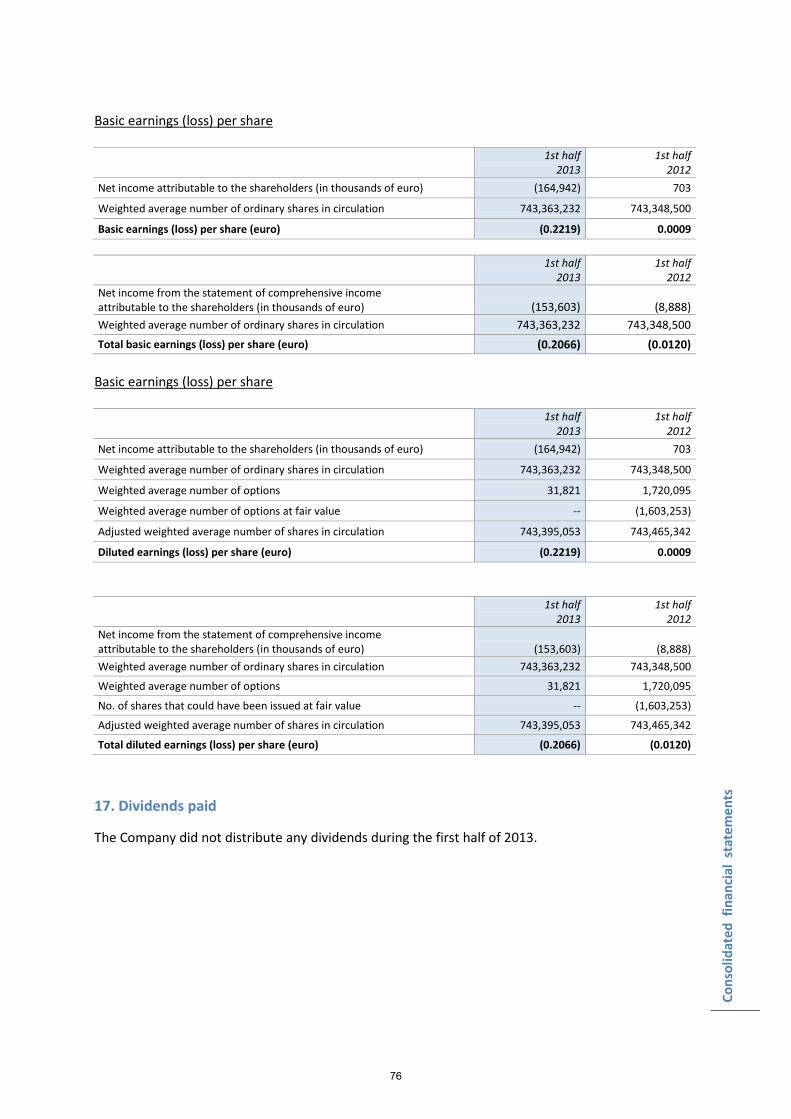
Cons
olid
ated
fin
anci
al s
tate
men
ts
Basic earnings (loss) per share
1st half 2013
1st half 2012
Net income attributable to the shareholders (in thousands of euro) (164,942) 703
Weighted average number of ordinary shares in circulation 743,363,232 743,348,500
Basic earnings (loss) per share (euro) (0.2219) 0.0009
1st half 2013
1st half 2012
Net income from the statement of comprehensive income attributable to the shareholders (in thousands of euro) (153,603) (8,888) Weighted average number of ordinary shares in circulation 743,363,232 743,348,500 Total basic earnings (loss) per share (euro) (0.2066) (0.0120)
Basic earnings (loss) per share
1st half 2013
1st half 2012
Net income attributable to the shareholders (in thousands of euro) (164,942) 703
Weighted average number of ordinary shares in circulation 743,363,232 743,348,500
Weighted average number of options 31,821 1,720,095
Weighted average number of options at fair value -- (1,603,253)
Adjusted weighted average number of shares in circulation 743,395,053 743,465,342
Diluted earnings (loss) per share (euro) (0.2219) 0.0009
1st half 2013
1st half 2012
Net income from the statement of comprehensive income attributable to the shareholders (in thousands of euro) (153,603) (8,888) Weighted average number of ordinary shares in circulation 743,363,232 743,348,500
Weighted average number of options 31,821 1,720,095
No. of shares that could have been issued at fair value -- (1,603,253)
Adjusted weighted average number of shares in circulation 743,395,053 743,465,342
Total diluted earnings (loss) per share (euro) (0.2066) (0.0120)
17. Dividends paid
The Company did not distribute any dividends during the first half of 2013.
76
Cons
olid
ated
fin
anci
al s
tate
men
ts
18. Financial risk management: additional disclosures
The CIR Group operates in various industry and service sectors, both nationally and internationally, so its business is exposed to various kinds of financial risk, including market risk (exchange rate risk and price risk), credit risk, liquidity risk and interest rate risk. The Group uses hedging derivatives to minimise certain types of risks. Risk management is carried out by the central finance and treasury function on the basis of policies approved by top management and communicated to the subsidiaries on 25 July 2003. 18.a.Market risk
Foreign currency risk As the Group operates internationally, Sogefi in particular, it is exposed to the risk that fluctuations in exchange rates could affect the fair value of some of its assets and liabilities. The Sogefi Group produces and sells mainly in the Euro Area, but it is subject to foreign currency risk, especially versus the GB pound, Brazilian real, US dollar, Argentine peso, Chinese renminbi and Canadian dollar. The Sorgenia Group is exposed to the risk of fluctuations in exchange rates when purchasing fuel, which tends to be priced in USD. Sorgenia uses forward contracts to reduce the risk of fluctuations in the EUR/USD exchange rate. As explained in the note on price risk, in certain cases it hedges the purchase and sale formulae directly as the price partly depends on the EUR/USD exchange rate. By fixing its formulae in euro, the exchange rate risk is also indirectly hedged. Regarding the exchange rate risk of translating the financial statements of international subsidiaries, the operating companies generally have a degree of convergence between their sourcing costs and their sales revenues and this kind of risk is also limited by the fact that the companies operate in their local currencies, are active in their own domestic markets and abroad and, if necessary, can arrange funding locally. Price risk
Through the Sorgenia Group's activity in the energy sector, the Group is exposed to the risk of energy commodity price fluctuations when purchasing fuels for its power plants and when buying and selling gas and electricity (where contracts stipulate specific indexing to baskets of fuels). Moreover, as almost all of the commodities in question are priced in USD, the Group is also exposed to fluctuations in the EUR/USD exchange rate. As mentioned previously, Sorgenia continually monitors this exposure by breaking down its contractual formulae into the underlying risk factors and managing these exposures according to a two-step procedure. The first step involves the negotiation of gas and electricity purchase agreements and the definition of pricing policies. Control over prices on both the purchase and sale sides enables the Group to guarantee a high level of natural hedging, minimising the impact on margins of the factors of uncertainty mentioned above, not only at business line level, but also at consolidated portfolio level. After this has been done, the second step involves monitoring residual net exposures. Sorgenia trades derivatives with leading banks in order to minimise counterparty risk. The derivatives in question are traded over the counter (OTC) directly with the counterparties and are mainly fixed vs. floating swaps or vice versa for commodity price hedges, and outright forwards and forwards plus for foreign currency risk hedges. Since 2008, given the greater liquidity achieved by derivatives markets, in order to reduce basis risk on hedges as much as possible, the Group has been negotiating contracts with its financial counterparties where the underlying is the whole formula for the purchase or sale of natural gas or
77
Cons
olid
ated
fin
anci
al s
tate
men
ts
electricity. These hedges make it possible to eliminate changes in costs and revenues caused by the elements of commodity risk and exchange rate risk by trading a single contract. Since 2010, commodity derivative contracts are managed according to the IAS 39 rules on hedge accounting, as they are entered into exclusively for hedging purposes; the effects of changes in their fair value are therefore recognised directly to a special equity reserve (cash flow hedge reserve). If the effectiveness test shows that the hedges are ineffective to some degree, the ineffective part is recognised immediately to the income statement. The fair value of derivative contracts is calculated using forward market prices at the reporting date, if the underlying commodities are traded on markets with a forward pricing structure. Otherwise, the fair value is calculated using internal models based on observable market data and information provided by recognised and reliable third-party sources. As regards the classifications envisaged in IFRS 13, based on three levels according to the method and the inputs used to determine fair value, it should be pointed out that the financial instruments used for managing commodity risk belong to level 2 of the fair value hierarchy. The valuation techniques for derivatives outstanding at 30 June 2013 are the same as those used the previous year. For commodities, the maturity of the contracts is generally less than 18 months. However, in certain exceptional cases hedges with longer maturities have been entered into with end customers for fixed price contracts or contracts with particular kinds of options. At 30 June there were open positions in liquid fuel derivatives with maturities in 2013. As in previous years, the Sorgenia Group minimised its exposure to the risk of changes in commodity prices deriving from financial instruments through increased opportunities for defining sales formulae consistent with its sourcing formulae and hedging strategies implemented by trading financial contracts and thanks to the new use of more structured instruments with a short-term horizon. Commodity derivatives are, in fact, entered into only for hedging purposes, so changes in the results of commodity derivative positions are offset by changes in the results of the underlying physical positions, with an impact on the income statement that is limited essentially to basis risk in all cases where there is a discrepancy between the commodities involved in the underlying physical contracts and the liquid commodities traded on the markets, both regulated and OTC, on which the derivatives are based. The Sorgenia Group has been involved in speculative trading since 2010. This activity, which involves transactions on the power, commodities and foreign exchange markets, is segregated in a separate portfolio. This portfolio, which is monitored on a daily basis by a specific corporate unit, has strict VaR and stop-loss limits to reduce risk. Operations began in this area in 2010 with a daily VaR of 95%. The average percentage use of the daily VaR limit during the first half of 2013 was 31%, closing at 30 June with a value of around € 180 thousand, whereas to date the stop-loss has never been activated. In order to calculate VaR reliably, the Risk Management Department of Sorgenia S.p.A. has developed a mixed benchmark-simulation approach that generates price scenarios in line with parameters based on historical observations. Value at Risk is calculated daily with a confidence level of 95%. VaR is a function of statistical price distribution and market returns, as well as of serial correlations of the various products and markets 18.b. Credit risk
Credit risk can be valued both in commercial terms by customer type, contractual terms and sales concentration, and in financial terms by type of counterparty used in financial transactions. There is no significant concentration of credit risk within the Group. Some time ago adequate policies were put in place to ensure that sales are made to customers of good standing. The counterparties for derivative products and cash transactions are exclusively
78
Cons
olid
ated
fin
anci
al s
tate
men
ts
financial institutions with a high credit rating. The Group has policies that limit credit exposure to individual financial institutions. Credit risk can vary depending on the business sector concerned. In the energy sector, for example, credit risk exposure is assessed using internal processes with the help of companies with sector expertise in credit facility assessment and allocation, as well as in debt collection. The size of the customer base and its diversification substantially eliminate the risk of credit concentration. In the “Automotive Components” sector there is no excessive concentration of credit risk since the Original Equipment and After-market distribution channels with which it operates are car manufacturers or large purchasing groups without any particular concentration of risk. The “Media” sector does not have any significant areas of credit risk and in any event the Group adopts operating procedures that prevent the sale of products or services to customers without an adequate credit profile or collateral. The “Healthcare” sector does not present any concentration of credit risk because credit exposure is spread over a large number of customers and counterparties, especially in the residential care homes sector. The hospital sector, however, has a higher concentration of risk because most counterparties are local health authorities. Since 2006 the CIR Group has been acquiring and managing non-performing loans and has put in place procedures for measuring and establishing the fair value of its portfolios 18.c. Liquidity risk
Prudent management of liquidity risk implies maintaining sufficient liquidity and negotiable securities and ensuring an adequate supply of credit facilities to ensure adequate funding. The Group systematically meets its maturities and commitments, and such conduct enables it to operate on the market with the necessary flexibility and reliability to maintain a correct balance between funding and deployment of its financial resources. The companies heading up the four main business sectors manage their own liquidity risk directly and independently. Tight control is exercised over the net financial position and its movements in the short, medium and long term. In general, the CIR Group follows an extremely prudent financial policy using mainly medium/long-term funding structures. Treasury management is centralised for the operating groups. 18.d. Interest rate risk (fair value and cash flow)
Interest rate risk depends on fluctuations in market rates, which can cause changes in the fair value of cash flows of financial assets or liabilities. Interest rate risk mainly concerns long-term bonds issued at a fixed rate, which exposes the Group to the risk of fluctuations in their fair value as interest rates change. In line with the Group's risk management policies, the Parent Company and the subsidiaries have entered into various IRS contracts over the years in order to hedge interest rate risk on their bond issues and bank borrowings.
79
Cons
olid
ated
fin
anci
al s
tate
men
ts
18.e. Derivatives
Derivatives are measured at fair value. For accounting purposes hedging transactions can be classified as: - fair value hedges, if they are subject to price changes in the market value of the underlying asset or
liability;
- cash flow hedges, if they are entered into against the risk of changes in cash flows from an existing asset and liability, or from a future transaction.
- hedges of net investments in foreign operations, if they are entered into to protect against foreign currency risk from the translation of subsidiaries’ equity denominated in a currency other than the Group’s functional currency.
For derivatives classified as fair value hedges, gains and losses resulting from both the determination of their market value and the adjustment to fair value of the element underlying the hedge are recognised to the income statement. For instruments classified as cash flow hedges (interest rate swaps), gains and losses from marking them to market are recognised directly to equity for the part which “effectively” hedges the underlying risk, while any “non-effective” part is recognised to the income statement. For instruments classified as hedges of a net investment in a foreign operation, gains and losses from marking them to market are recognised directly to equity for the part which “effectively” hedges the underlying risk, while any “non-effective” part is recognised to the income statement. On initial recognition under hedge accounting, derivatives are accompanied by an effective hedging relationship which designates the individual derivative as a hedge and specifies its effectiveness parameters in relation to the financial instrument being hedged. Hedge effectiveness is tested at regular intervals, with the effective part of the relationship being recognised to equity and the ineffective part, if any, to the income statement. More specifically, the hedge is considered effective when the change in fair value or in the cash flows of the instrument being hedged is "almost entirely" offset by the change in fair value or cash flows of the hedging instrument, and when the results achieved are in a range of 80%-125%. The Group also enters into derivative financial instruments for hedging purposes, as part of the optimisation of investment management. 18.f. Capital ratios Management modulates the use of leverage to guarantee solidity and flexibility in the capital structure of CIR and its financial holding companies, measuring the ratio of funding sources to investment activity. Leverage is calculated as the ratio between net debt (represented by the bonds issued net of cash and cash equivalents and investments in liquid financial instruments, according to parameters agreed with the rating agency) and total investments measured at fair value (including equity investments and residual investments in financial instruments). Management’s objective is to maintain a solid and flexible financial structure to keep this ratio below a certain level. Currently, it stands at 11%. 18.g.Borrowing conditions Some of the Group's borrowing agreements contain special clauses which, in the event of failure to comply with certain economic and financial covenants, give the lending banks an option to claim
80
Cons
olid
ated
fin
anci
al s
tate
men
ts
immediate repayment if the company involved does not immediately remedy the infringement of such covenants as required under the terms and conditions of the agreements. At 30 June 2013 all the contractual clauses relating to medium and long term financial liabilities were fully complied with by the Group. Below is a summary of the main covenants relating to the borrowings of the operating sub-holding companies outstanding at period end. Sogefi Group
Sogefi S.p.A., the sub-holding company of the Group’s automotive operations, has undertaken to comply with a series of covenants, which are summarised below: - syndicated loan of € 200 million: ratio of consolidated net financial position to consolidated
normalised EBITDA of less than or equal to 3.5; ratio of consolidated normalised EBITDA to consolidated net financial expenses of not less than 4;
- loan of € 100 million: ratio of consolidated net financial position to consolidated normalised EBITDA of less than than 4;
- loan of € 60 million: ratio of consolidated net financial position to consolidated normalised EBITDA of less than or equal to 3.5;
- loans for a total of € 115 million; ratio of consolidated net financial position to consolidated normalised EBITDA of less than or equal to 3.5; ratio of consolidated normalised EBITDA to consolidated net financial expenses of not less than 4;
- bond of USD 115 million; ratio of consolidated net financial position to consolidated normalised EBITDA of less than or equal to 3.5; ratio of consolidated normalised EBITDA to consolidated net financial expenses of not less than 4;
- bond of € 25 million; ratio of consolidated net financial position to consolidated normalised EBITDA of less than or equal to 3.5; ratio of consolidated normalised EBITDA to consolidated net financial expenses of not less than 4.
At 30 June 2013, these covenants were all respected. Sorgenia Group
The Sorgenia Group, through a number of its subsidiaries, has undertaken to respect financial covenants in relation to loans for the construction of power plants and wind farms. These covenants measure the relationship between operating cash flow net of tax and the cost of servicing debt, given by the sum of the principal and interest payments made during the reference period (known as the "Debt Service Coverage Ratio" or DSCR). The main contractual agreements in connection with the DSCR concern: - the distribution of dividends: possible only if the ratios mentioned in the covenants exceed the
thresholds laid down in the contract; or
- the extent to which the project is able to repay the debt: if the ratios mentioned in the covenants are lower than the minimum thresholds, the banks can ask the company to implement a series of remedies established in the contract.
The measurement of these covenant ratios is carried out either half-yearly or annually, as laid down in the contract, calculated as of 30 June and/or 31 December each year. We confirm that at 30 June 2013 all covenants have been respected.
81
Cons
olid
ated
fin
anci
al s
tate
men
ts
KOS Group The Kos Group has undertaken to comply with the following covenants relating to some of its loans: - a revolving line of credit obtained by KOS, the sub-holding company, with a residual balance of € 16
million at 30 June 2013: ratio of consolidated net financial position to consolidated shareholders' equity of less than 2.5;
- syndicated loan with a balance at 30 June 2013 of € 18.9 million obtained by Residenze Anni Azzurri S.r.l.: ratio of net financial position to EBITDA of less than 3.88 and ratio of consolidated net financial position to consolidated equity of less than 2.19;
- syndicated loan for a balance at 30 June 2013 of € 28.7 million obtained by Istituto di Riabilitazione Santo Stefano S.r.l.: ratio of net financial position to EBITDA of less than 5.4 and ratio of consolidated net financial position to consolidated shareholders' equity of less than 1.4 and a Debt Service Coverage Ratio of more than 1;
- a loan obtained by Medipass S.p.A. with a residual balance of € 3.9 million at 30 June 2013: ratio of net financial position to EBITDA of less than 3.3 and ratio of consolidated net financial position to consolidated shareholders' equity of less than 3.2 and a Debt Service Coverage Ratio of more than 1.
18.h.Measurement of financial assets and liabilities and fair value hierarchy Measurement of financial assets and liabilities and fair value hierarchy The fair value of financial assets and liabilities is calculated as follows: - the fair value of financial assets and liabilities with standard terms and conditions listed on an
active market is measured on the basis of prices published on the active market;
- the fair value of other financial assets and liabilities (except for derivatives) is measured using commonly accepted valuation techniques based on analytical models using discounted cash flows, which as variables use prices observable in recent market transactions and broker listed prices for similar instruments.
- the fair value of derivatives that are listed on an active market is measured on the basis of market prices; if no prices are published, different approaches are used according to the type of instrument.
In particular, for the measurement of certain investments in bond instruments with no regular market, i.e. where there is an insufficient number of frequent transactions with a bid-ask spread and a sufficiently limited volatility, the fair value of these instruments is measured principally on the basis of prices supplied by leading international brokers at the company's request. These prices are then validated by comparing them with market prices, even if limited in number, or with prices that are observable for other instruments with similar characteristics. In measuring investments in private equity funds, fair value is determined on the basis of the NAV communicated by the fund administrators at the reporting date. Where such information is not available at the reporting date, the last official communication is used, though it must not be more than three months old at the reporting date and, if necessary, validated against more recent information made available to investors by the fund administrators. The fair value of the derivatives was calculated using forward curves for interest rates and exchange rates at 30 June 2013, also taking a credit valuation adjustment/debit valuation adjustment into consideration (the latter is a novelty in the method of preparation of assessments compared with 31 December 2012). The fair values of derivatives are classified as Level 2 on the basis of a hierarchy that reflects the significance of the inputs used in determining the fair value.
82
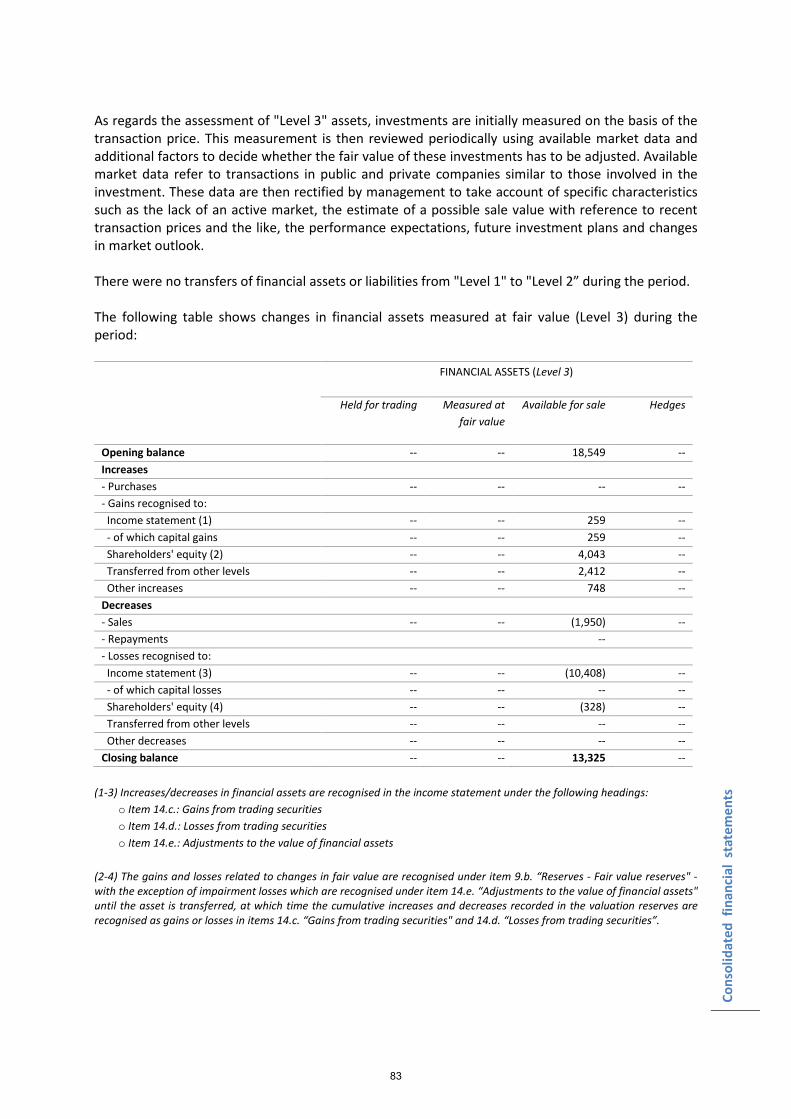
Cons
olid
ated
fin
anci
al s
tate
men
ts
As regards the assessment of "Level 3" assets, investments are initially measured on the basis of the transaction price. This measurement is then reviewed periodically using available market data and additional factors to decide whether the fair value of these investments has to be adjusted. Available market data refer to transactions in public and private companies similar to those involved in the investment. These data are then rectified by management to take account of specific characteristics such as the lack of an active market, the estimate of a possible sale value with reference to recent transaction prices and the like, the performance expectations, future investment plans and changes in market outlook. There were no transfers of financial assets or liabilities from "Level 1" to "Level 2” during the period. The following table shows changes in financial assets measured at fair value (Level 3) during the period:
FINANCIAL ASSETS (Level 3)
Held for trading Measured at fair value
Available for sale Hedges
Opening balance -- -- 18,549 -- Increases - Purchases -- -- -- -- - Gains recognised to: Income statement (1) -- -- 259 -- - of which capital gains -- -- 259 -- Shareholders' equity (2) -- -- 4,043 -- Transferred from other levels -- -- 2,412 -- Other increases -- -- 748 -- Decreases - Sales -- -- (1,950) -- - Repayments -- - Losses recognised to: Income statement (3) -- -- (10,408) -- - of which capital losses -- -- -- -- Shareholders' equity (4) -- -- (328) -- Transferred from other levels -- -- -- -- Other decreases -- -- -- -- Closing balance -- -- 13,325 --
(1-3) Increases/decreases in financial assets are recognised in the income statement under the following headings:
o Item 14.c.: Gains from trading securities o Item 14.d.: Losses from trading securities o Item 14.e.: Adjustments to the value of financial assets
(2-4) The gains and losses related to changes in fair value are recognised under item 9.b. “Reserves - Fair value reserves" - with the exception of impairment losses which are recognised under item 14.e. “Adjustments to the value of financial assets" until the asset is transferred, at which time the cumulative increases and decreases recorded in the valuation reserves are recognised as gains or losses in items 14.c. “Gains from trading securities" and 14.d. “Losses from trading securities”.
83
Cons
olid
ated
fin
anci
al s
tate
men
ts
19. Guarantees and commitments
At 30 June 2013 the position of guarantees and commitments was the following:
CIR AND FINANCIAL HOLDING COMPANIES For the incentive plans for directors and employees, CIR has a joint commitment with Verbund to buy back any shares of Sorgenia S.p.A. resulting from the exercise of options by employees who are beneficiaries of stock option plans outstanding as of 30 June 2013. Other guarantees and commitments of CIR are as follows: - commitments for private equity fund investments by CIR International for € 9.5 million; Sorgenia Group
1. Guarantees given
As collateral for loans obtained by subsidiaries, shares representing the capital of the borrowing companies have been pledged in favour of the lending banks for a total of € 456,720 thousand (€ 455,320 thousand at 31 December 2012). The parent company Sorgenia has issued guarantees for € 183,050 thousand to the suppliers of the subsidiary Sorgenia Trading S.p.A. to cover any failure on the part of the subsidiary to meet its obligations. Guarantees have also been issued for € 141,479 thousand for Group VAT credits to be refunded.
2.Sureties
Within the Group, sureties have been granted to third parties for a total of € 366,387 thousand (€ 329,255 at 31 December 2012). They are mainly bonds issued to guarantee payment in connection with the purchase and transport of electricity and gas. This category also includes sureties requested for the construction of power plants and for land purchases.
3. Commitments
The commitments outstanding at the reporting date refer mainly to guarantees issued by Sorgenia S.p.A. in favour of the banks that have lent Sorgenia Power S.p.A. € 195,800 thousand for the Termoli power plant and € 660,000 thousand for the Aprilia and Bertonico-Turano Lodigiano power plants. Sorgenia S.p.A. has taken a commitment, in proportion to its share of the capital, with the bank that is financing GICA to provide it with the necessary financial resources to fulfil its obligations towards the bank. Originally, this amount was € 7.5 million, which has decreased over time to € 135 thousand euro; Sorgenia S.p.A. also has a financial commitment to the subsidiary Noventi Ventures Ltd II for a total of USD 30 million, of which USD 24 million has already been paid in, leaving a residual commitment of € 4,582 thousand; Sorgenia E&P Colombia BV and Sorgenia International BV have taken a commitment for € 7,882 thousand for the investments in the Cerrero and Balay licences, as well as the Polish shale gas licence. Sorgenia E&P UK Ltd and MPX Energy Ltd have taken a commitment for € 10,475 thousand in connection with the investment in the 25th Bidding Round licences.
84

Cons
olid
ated
fin
anci
al s
tate
men
ts
For natural gas purchases and sales only, the supply contract includes the standard take or pay clause which makes it compulsory for the buyer to pay for any shortfall in the amount withdrawn compared with the annual minimum envisaged in the contract. CIR has issued a guarantee to cover this clause. As a result of leasing transactions carried out by Sorgenia Minervino S.p.A., Sorgenia San Gregorio Magno, Sorgenia Castelnuovo di Conza and Sorgenia Campagna, a commitment has been taken not to relinquish direct and/or indirect control over the investments held in the companies that have entered into these leases. Sorgenia S.p.A. has also undertaken to guarantee a debt service coverage ratio established by the company with which the lease contract has been stipulated by Sorgenia San Gregorio Magno, Sorgenia Castelnuovo di Conza and Sorgenia Campagna, under which it agrees to refinance or recapitalise the subsidiary.
Espresso Group
Apart from liens on printing plants and rotary presses given to banks to cover loans taken out in 2005, at 30 June 2013 the Group had outstanding commitments of € 4,034 thousand in relation to contracts for the purchase of plant and other printing equipment (€ 369 thousand), mainly for La Repubblica, for the Livorno divisions and L'Editoriale La Nuova Sardegna. Guarantees given amount to € 3,665 thousand and relate mainly to guarantees given by the Parent Company and the subsidiaries Elemedia and A. Manzoni & C., Finegil Editoriale, Rete A and Seta for the lease of their respective premises, as well as the Parent Company's obligation to pay the Tax Authorities to guarantee excess credit positions created in the last three years. Sogefi Group
1. Operating leases
For accounting purposes, leases and rental contracts are classified as operating leases when the following conditions apply: - a significant part of the risks and benefits of ownership are retained by the lessor;
- there are no bargain purchase options for the asset at the end of the lease;
- the duration of the contract does not cover most of the useful life of the asset being leased or rented.
Instalment payments for operating leases are booked to the income statement in line with the underlying contracts. The main operating leases outstanding at 30 June 2013 refer to the following subsidiaries: - Shanghai (Suzhou) Auto Parts Co. Ltd for the lease of two production sites located in Wujiang, for
which the contract terminates in March 2033. At 30 June 2013 the residual instalments amount to € 13,966 thousand, of which € 564 thousand due within one year. The Group has not given any form of guarantee on this contract;
- Allevard Federn GmbH for the lease of the Volklingen production site. The contract expires in May 2020. The residual instalments at 30 June 2013 amount to € 2,656 thousand, of which € 366 thousand due within one year. The Group has not given any form of guarantee on this contract;
85
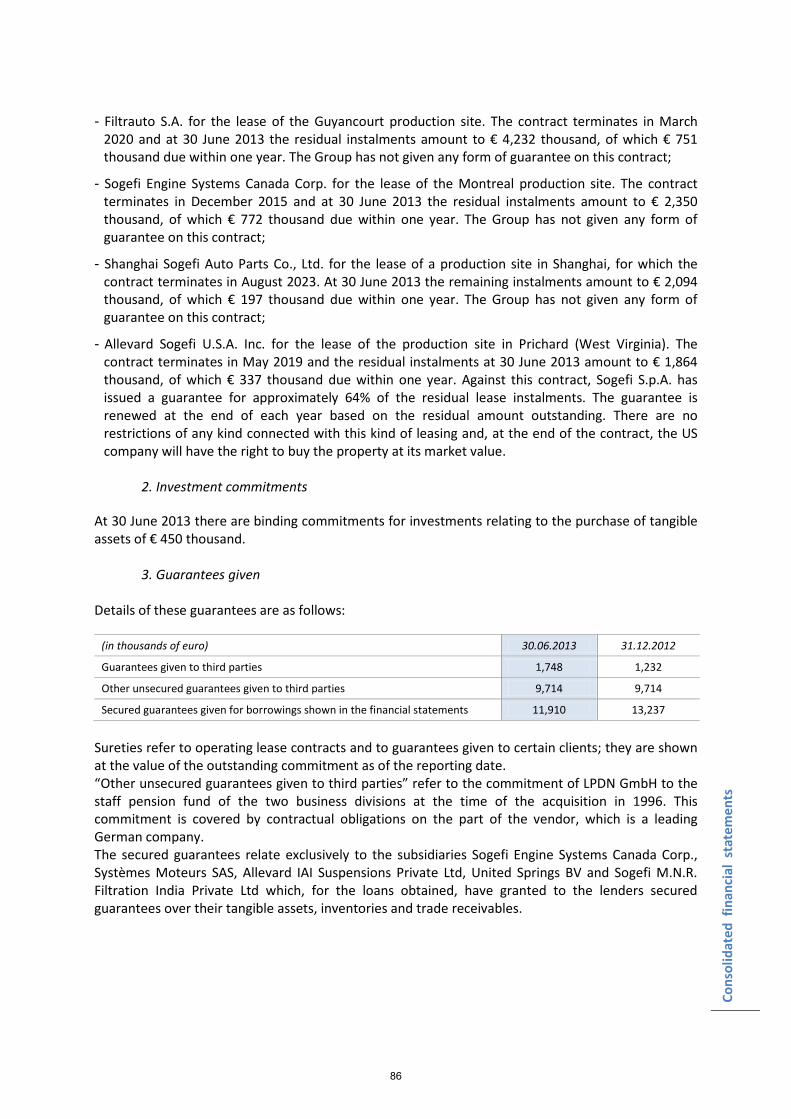
Cons
olid
ated
fin
anci
al s
tate
men
ts
- Filtrauto S.A. for the lease of the Guyancourt production site. The contract terminates in March 2020 and at 30 June 2013 the residual instalments amount to € 4,232 thousand, of which € 751 thousand due within one year. The Group has not given any form of guarantee on this contract;
- Sogefi Engine Systems Canada Corp. for the lease of the Montreal production site. The contract terminates in December 2015 and at 30 June 2013 the residual instalments amount to € 2,350 thousand, of which € 772 thousand due within one year. The Group has not given any form of guarantee on this contract;
- Shanghai Sogefi Auto Parts Co., Ltd. for the lease of a production site in Shanghai, for which the contract terminates in August 2023. At 30 June 2013 the remaining instalments amount to € 2,094 thousand, of which € 197 thousand due within one year. The Group has not given any form of guarantee on this contract;
- Allevard Sogefi U.S.A. Inc. for the lease of the production site in Prichard (West Virginia). The contract terminates in May 2019 and the residual instalments at 30 June 2013 amount to € 1,864 thousand, of which € 337 thousand due within one year. Against this contract, Sogefi S.p.A. has issued a guarantee for approximately 64% of the residual lease instalments. The guarantee is renewed at the end of each year based on the residual amount outstanding. There are no restrictions of any kind connected with this kind of leasing and, at the end of the contract, the US company will have the right to buy the property at its market value.
2. Investment commitments
At 30 June 2013 there are binding commitments for investments relating to the purchase of tangible assets of € 450 thousand.
3. Guarantees given Details of these guarantees are as follows:
(in thousands of euro) 30.06.2013 31.12.2012
Guarantees given to third parties 1,748 1,232
Other unsecured guarantees given to third parties 9,714 9,714
Secured guarantees given for borrowings shown in the financial statements 11,910 13,237
Sureties refer to operating lease contracts and to guarantees given to certain clients; they are shown at the value of the outstanding commitment as of the reporting date. “Other unsecured guarantees given to third parties” refer to the commitment of LPDN GmbH to the staff pension fund of the two business divisions at the time of the acquisition in 1996. This commitment is covered by contractual obligations on the part of the vendor, which is a leading German company. The secured guarantees relate exclusively to the subsidiaries Sogefi Engine Systems Canada Corp., Systèmes Moteurs SAS, Allevard IAI Suspensions Private Ltd, United Springs BV and Sogefi M.N.R. Filtration India Private Ltd which, for the loans obtained, have granted to the lenders secured guarantees over their tangible assets, inventories and trade receivables.
86

Cons
olid
ated
fin
anci
al s
tate
men
ts
4. Other risks At 30 June 2013 the Sogefi Group held assets belonging to third parties on its premises for € 6,805 thousand. KOS Group
The following is a breakdown of the bank guarantees and other sureties given by KOS S.p.A. for a total of € 2,422 thousand: - a guarantee in favour of the Municipality of Sanremo as a security deposit for urbanisation works,
for € 226 thousand;
- a guarantee on behalf of Residenze Anni Azzurri S.r.l. for the lease of Santegidio S.r.l. (Scarnafigi), for € 100 thousand;
- a guarantee on behalf of Residenze Anni Azzurri S.r.l. for the Rivarolo property lease, for € 75 thousand;
- a guarantee on behalf of Residenze Anni Azzurri S.r.l. for the Rivarolo business unit lease, for € 35 thousand;
- a guarantee on behalf of Residenze Anni Azzurri S.r.l. for the care home due to be built in Montanaro to guarantee signing of the future lease agreement for € 550 thousand;
- a guarantee on behalf of Residenze Anni Azzurri S.r.l. for the Peveragno property lease, for € 235 thousand;
- a guarantee on behalf of Residenze Anni Azzurri S.r.l. for the Dorzano property lease, for € 121 thousand;
- a guarantee on behalf of Residenze Anni Azzurri S.r.l. for the Dormelletto property lease, for € 200 thousand;
- a guarantee on behalf of Residenze Anni Azzurri S.r.l. for a property lease, for € 180 thousand;
- an omnibus guarantee on behalf of Medipass S.p.A. in its relations with the Venice Health Authority, for € 700 thousand;
Bank guarantees given by other Group companies for € 9,511 thousand, with the following
breakdown: - a guarantee given by Residenze Anni Azzurri S.r.l. to guarantee care home lease payments, for €
8,374 thousand;
- a guarantee given by Residenze Anni Azzurri S.r.l. in favour of HSS Real Estate S.p.A. to guarantee the security deposit policy for urbanisation works regarding the care home to be built in the Municipality of Monza, for € 184 thousand;
- guarantee policies issued by Ospedale di Suzzara in favour of F.lli Montecchi, for € 953 thousand. At 30 June 2013, other commitments and risks amounted to € 6,124 thousand, mainly related to: - assets on free loan for € 2,292 thousand;
- commitments relating to the refurbishment of the Suzzara hospital, for contracts already signed at 31 December 2012, for € 76 thousand;
87
Cons
olid
ated
fin
anci
al s
tate
men
ts
- contractual commitments for technology upgrades to equipment, where necessary, for approximately € 692 thousand. Given the current status of the contracts, there is no reason to consider this commitment probable;
- counter-guarantee commitments for the successful completion of structural works for € 2,891 thousand.
- third-party commitments to sell for € 173 thousand. The Group carries on its business activities in premises, some of which are owned, others rented. Lease contracts vary in duration from 3 to 9 years and are generally renewable. Of the 40 care homes for the elderly in operation at the reporting date, 7 are owned, while 10 of the 22 functional and psychiatric rehabilitation facilities are owned (including two residential care homes for the elderly). The other facilities (day hospitals, psychiatric treatment communities, diagnostics departments) are generally leased. 20. Information on the business sector
The business sectors coincide with the groups of companies that CIR S.p.A. controls. These are: - the Sorgenia Group: energy;
- the Espresso Group: media;
- the Sogefi Group: automotive components;
- the Kos Group: healthcare. From a geographical point of view, with the exception of the Sogefi Group, business is conducted almost exclusively in Italy. Income statement and balance sheet information by business segment is provided in the Report on Operations, whereas details of revenues by geographical area (secondary sector) can be found in Note 12. 21. Joint ventures
The main joint ventures at 30 June 2013 were Tirreno Power and Sorgenia France Production. International accounting standards currently in force envisage two methods for consolidating investments in joint ventures:
-the standard method, which involves proportional consolidation; -the alternative method, which involves using the equity method. The Group has adopted the equity method for the sake of consistency with accounts presented to date.
88
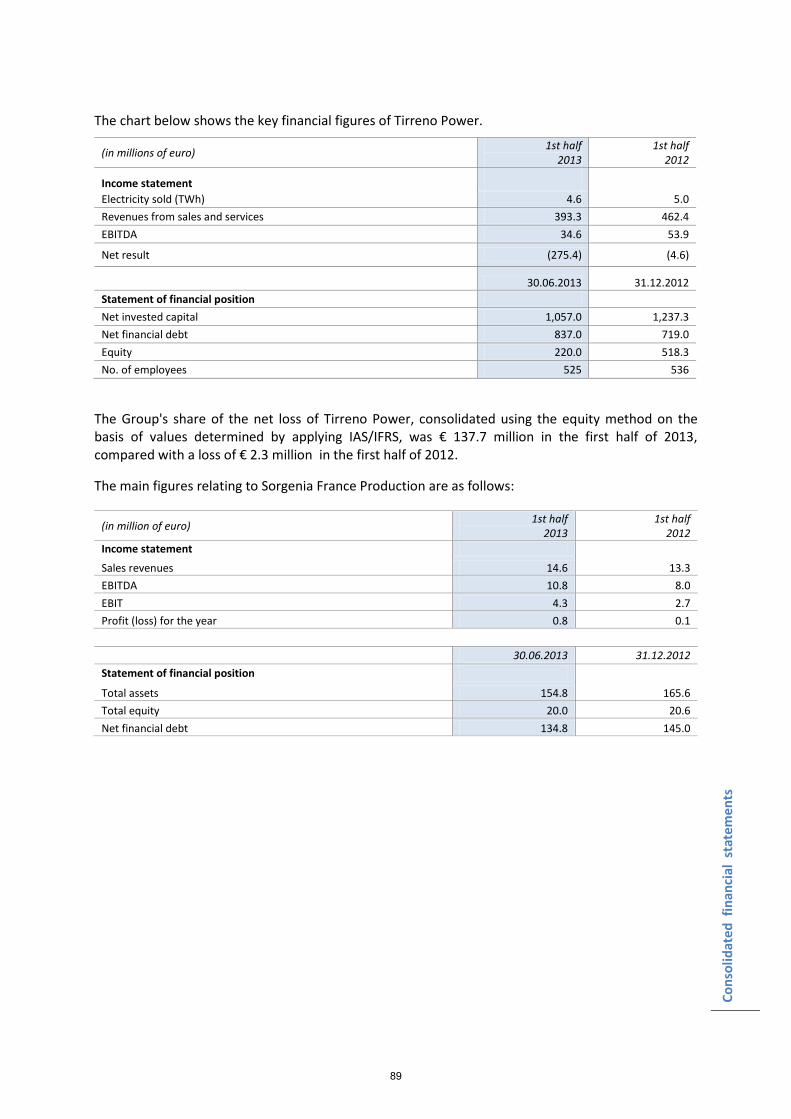
Cons
olid
ated
fin
anci
al s
tate
men
ts
The chart below shows the key financial figures of Tirreno Power.
(in millions of euro) 1st half 2013
1st half 2012
Income statement
Electricity sold (TWh) 4.6 5.0 Revenues from sales and services 393.3 462.4 EBITDA 34.6 53.9
Net result (275.4) (4.6)
30.06.2013 31.12.2012 Statement of financial position Net invested capital 1,057.0 1,237.3 Net financial debt 837.0 719.0 Equity 220.0 518.3 No. of employees 525 536
The Group's share of the net loss of Tirreno Power, consolidated using the equity method on the basis of values determined by applying IAS/IFRS, was € 137.7 million in the first half of 2013, compared with a loss of € 2.3 million in the first half of 2012.
The main figures relating to Sorgenia France Production are as follows:
(in million of euro) 1st half 2013
1st half 2012
Income statement
Sales revenues 14.6 13.3 EBITDA 10.8 8.0 EBIT 4.3 2.7 Profit (loss) for the year 0.8 0.1
30.06.2013 31.12.2012 Statement of financial position
Total assets 154.8 165.6 Total equity 20.0 20.6 Net financial debt 134.8 145.0
89

Cons
olid
ated
fin
anci
al s
tate
men
ts
22. Net financial position
The net financial position is analysed as follows:
(in thousands of euro) 30.06.2013 31.12.2012
A. Cash and bank deposits 851,091 666,153
B. Other cash equivalents 105,977 105,473
C. Securities held for trading 354,923 410,343
D. Cash and cash equivalents (A) + (B) + (C) 1,311,991 1,181,969
E. Current financial receivables 35,801 35,489
F. Current bank payables (*) (331,238) (292,787)
G. Bonds (9,691) (4,354)
H. Current portion of non-current debt (622,316) (624,546)
I. Other current borrowings -- (13)
J. Current financial debt (F) + (G) + (H) + (I) (963,245) (921,700)
K. Current net financial position (J) + (E) + (D) 384,547 295,758
L. Non-current bank borrowings (**) (1,896,511) (2,042,918)
M. Bonds (616,636) (496,379)
N. Other non-current payables (**) (241,509) (260,918)
O. Non-current financial debt (L) + (M) + (N) (2,754,656) (2,800,215)
P. Net financial position (K) + (O) (2,370,109) (2,504,457)
(*) 115,873 thousand (€ 331,238- € 215,365) is classified in the Statement of Financial Position under “Other borrowings”. (**) Classified under “Other borrowings” – Non-current liabilities
90
Cons
olid
ated
fin
anci
al s
tate
men
ts
23. Legal disputes
Certain Group companies have legal disputes pending, against which their Boards have set aside risk provisions for amounts that are considered appropriate, taking into account the opinion of their consultants regarding the likelihood that significant liabilities will actually occur. In particular, the Rome Regional Tax Commission filed its judgment no. 64/9/12 on 18 May 2012, on its resumption, with regard to the investigations into 1991 IRPEG and ILOR; these investigations gave rise to the following main findings: - the Tax Authorities challenged the tax benefits resulting from the reorganisation of the Editoriale
L’Espresso Group that followed the break-up of the Mondadori Group (in particular, the benefits arising from the merger of Editoriale La Repubblica SpA with Cartiera di Ascoli SpA, which then adopted its name);
- they also challenged the benefits relating to transactions involving beneficial interests in shares with foreign entities, especially those relating to the tax credit on dividends and related withholding taxes, as well as the accrued interest.
As regards the beneficial interest in shares, the Group has been making provisions since 2008, considering that, according to the evolution of the related jurisprudence, the additional taxes assessed and related interest charged were to be considered a "probable risk" (the provisions did not only involve 1991, but also the next three tax years, for which the Tax Authorities challenged the same types of benefits), unlike the penalties for which the risk was considered "possible". On the first matter, which only concerns 1991, the risk has always been considered "remote", in light of the technical evaluation of items in dispute and the outcome of the various levels of justice. Bear in mind that: - the facts were first being evaluated by the criminal court for alleged tax fraud and the proceedings
were concluded with a judgment of nonsuit by the GUP (the magistrate who presides over the preliminary hearing). This was definitively confirmed by the Court of Appeal on 9 December 1999, fully acquitting all of the directors and statutory auditors;
- the tax assessments of first and second instance were both favourable to the Group, in 1998 and 2000 respectively; subsequently, in 2007 the Supreme Court cancelled the judgment of second instance, referring it to the Regional Tax Commission, though it only decided on procedural matters without affecting the merits of the case in any way.
With this judgment, the Regional Tax Commission upheld the position of the Tax Authorities in relation to the most important item in dispute from an economic point of view, which concerned the corporate restructuring, whereas it dismissed the contestation concerning the beneficial interests. Re-evaluating the situation as of 31 December 2012, this judgment indicates a maximum amount at risk of € 357.3 million (of which additional taxes assessed of € 121.4 million, interest of € 114.4 million and penalties of € 121.4 million): this value comes from the fact that the Tax Authorities did not just deny the tax benefits (deemed not due) based on the higher values recorded on allocation of the "cancellation deficit" as part of the merger process, but - unexpectedly - demanded the immediate and full liability to taxation of this deficit as being devoid of any income value, treating it as though it were a capital gain that had been "realized".
91
Cons
olid
ated
fin
anci
al s
tate
men
ts
On 27 June 2012 the Company filed an appeal against the judgment of second degree with the Supreme Court and on 28 June 2012 it applied to the Rome Regional Tax Commission for a suspension of the effects of the judgment pursuant to article 373 of the Code of Civil Procedure; the application has been accepted by the Rome Regional Tax Commission by order filed on 19 July 2012. Being well aware of the fiscal and statutory legitimacy of the transactions being challenged by the Tax Authorities, also on the basis of technical evaluations obtained from independent professionals, the Group has confirmed its assessment of the degree of risk involved in the treatment of beneficial interests in shares as regards taxes and penalties (even if it has been successful on this point, for procedural reasons, before the Regional Tax Commission). However, as a result of the recent and established positions of the Supreme Court, the same level of risk has been extended to the penalties, and for the corporate restructuring operations, where the Group has been unsuccessful, the risk is described as merely "possible". For matters relating to the beneficial interests in shares, up to 31 December 2011 the Group had set aside an amount of € 30.5 million (to cover the risks related to the amortisation of the cost incurred for the purchase of the beneficial interest, the tax credit on the dividends, the withholding taxes incurred and the related accrued interest), with reference to all four tax periods assessed. Following a recent ruling of the European Court of Justice, with a judgment dated 24 April 2012, the Supreme Court has declared extinct the lawsuit that saw the CIR Group opposed to the Tax Authorities in relation to the dispute about beneficial interests for the year 1992; as a result, no amount is due to the Tax Authorities for that purpose. The provision previously set aside in relation to 1992, € 7,970 thousand, was therefore released. As mentioned previously, following the recent judgments of the Supreme Court, the Group has decided to extend the degree of probable risk also to the penalties applied to the beneficial interest transactions, setting aside a provision of € 11,523 thousand, which, together with the amount of € 347 thousand to take account of accrued interest, results in a total risk provision at 31 December 2012 of € 34,178 thousand.
It should be remembered that on 9 July 2011, the Milan Court of Appeal pronounced on the civil case brought by CIR against Fininvest for compensation for damages resulting from bribery in the "Lodo Mondadori" case. The ruling sentenced Fininvest to pay CIR approximately € 540.1 million plus interest at the legal rate and costs from 3 October 2009, as compensation for the immediate and direct damage suffered. As a result of this sentence, on 26 July 2011 CIR received a total of around € 564.2 million from Fininvest, including legal costs and interest. Under international accounting standards (IAS 37), this amount will not have any impact on the Group's income statement until the appeal of last resort has been decided.
A hearing took place on 27 June 2013 for the parties and the Attorney General to discuss the case before the Supreme Court. The case is currently pending the final decision and CIR is waiting for the sentence to be filed.
92

Cons
olid
ated
fina
ncia
l sta
tem
ents
24.Disclosures regarding share-based incentive plans
24.a. Stock option plans for employees as of 30 June 2013 (CIR)
The following chart shows the stock option plans of the Parent Company CIR S.p.A:
93

STOCK OPTION PLANS OUTSTANDING AS OF 30 JUNE 2013
No.of Weighted No.of Weighted No.of Weighted No.of Weighted No.of Average Average No.of Weighted
options average options average options average options average options strike duration options average
strike price strike price strike price strike price price (years) strike price
Stock Option Plan 5 September 2003 112,500 1.13 -- -- -- -- -- -- 112,500 1.13 0.67 112,500 1.13
Stock Option Plan 12 March 2004 384,100 1.60 -- -- -- -- (12,000) 1.60 372,100 1.60 1.25 372,100 1.60
Stock Option Plan 6 September 2004 1,480,200 1.56 -- -- -- -- (48,000) 1.56 1,432,200 1.56 1.67 1,432,200 1.56
Stock Option Plan 11 March 2005 3,414,200 2.34 -- -- -- -- (400,000) 2.34 3,014,200 2.34 2.25 3,014,200 2.34
Stock Option Plan 6 September 2005 2,425,000 2.49 -- -- -- -- (300,000) 2.49 2,125,000 2.49 2.67 2,125,000 2.49
Stock Option Plan 2006 - 1st tranche 2,475,000 2.50 -- -- -- -- (300,000) 2.50 2,175,000 2.50 3.51 2,175,000 2.50
Stock Option Plan 2006 - 2nd tranche 2,475,000 2.47 -- -- -- -- (300,000) 2.47 2,175,000 2.47 4.00 2,175,000 2.47
Extraordinary Stock Option Plan 1st tranche 3,470,000 3.0877 -- -- -- -- (420,000) 3.0877 3,050,000 3.0877 4.25 3,050,000 3.0877
Extraordinary Stock Option Plan 2nd tranche 3,470,000 2.7344 -- -- -- -- (420,000) 2.7344 3,050,000 2.7344 4.75 3,050,000 2.7344
Extraordinary Stock Option Plan 3rd tranche 3,488,000 1.6806 -- -- -- -- (378,000) 1.6806 3,110,000 1.6806 5.25 3,110,000 1.6806
Extraordinary Stock Option Plan 4th tranche 2,494,600 1.0718 -- -- -- -- (50,400) 1.0718 2,444,200 1.0718 5.75 2,444,200 1.0718
Stock Option Plan 1st tranche 2009 2,709,400 0.9907 -- -- -- -- (50,400) 0.9907 2,659,000 0.9907 6.25 2,659,000 0.9907
Stock Option Plan 2nd tranche 2009 3,386,800 1.5449 -- -- -- -- (226,800) 1.5449 3,160,000 1.5449 6.67 2,844,000 1.5449
Stock Option Plan 1st tranche 2010 3,486,400 1.6208 -- -- -- -- (176,400) 1.6208 3,310,000 1.6208 7.26 2,581,800 1.6208
Stock Option Plan 2nd tranche 2010 3,436,000 1.4982 -- -- -- -- (126,000) 1.4982 3,310,000 1.4982 7.67 2,184,600 1.4982
Total 38,707,200 1.9850 -- -- -- -- (3,208,000) 2.2686 35,499,200 1.9593 4.98 33,329,600 1.9862
STOCK GRANT PLANS AS OF 30 JUNE 2013
Number Value Number Value Number Weighted Number Weighted Number Value Average Number Value
Units Units Units average Units average Units duration Units
strike price strike price (years)
Stock Grant Plan 2011 2,942,400 1.6391 2,557 0.8754 (73,683) 1.7474 -- -- 2,871,274 1.6391 7.84 82,349 1.7474
Stock Grant Plan 2012 5,456,332 1.0263 -- -- -- -- -- -- 5,456,332 1.0263 8.83 -- --
Stock Grant Plan 2013 -- -- 4,034,926 0.6450 -- -- -- -- 4,034,926 0.6450 9.84 -- --
Total 8,398,732 1.2410 4,037,483 0.6451 (73,683) 1.7474 -- -- 12,362,532 1.04418 8.93 82,349 1.7474
Options exercisable
at the end of period
Options in circulation
at start of period
Options assigned
during the period
Options expiring
in the period
Units in circulation
during the period in the period at the end of period
Options exercised
during the period
Options in circulation
at the end of period
at the end of periodat start of period during the period
Units exercisableUnits in circulation Units assigned Units exercised Units expiring
94
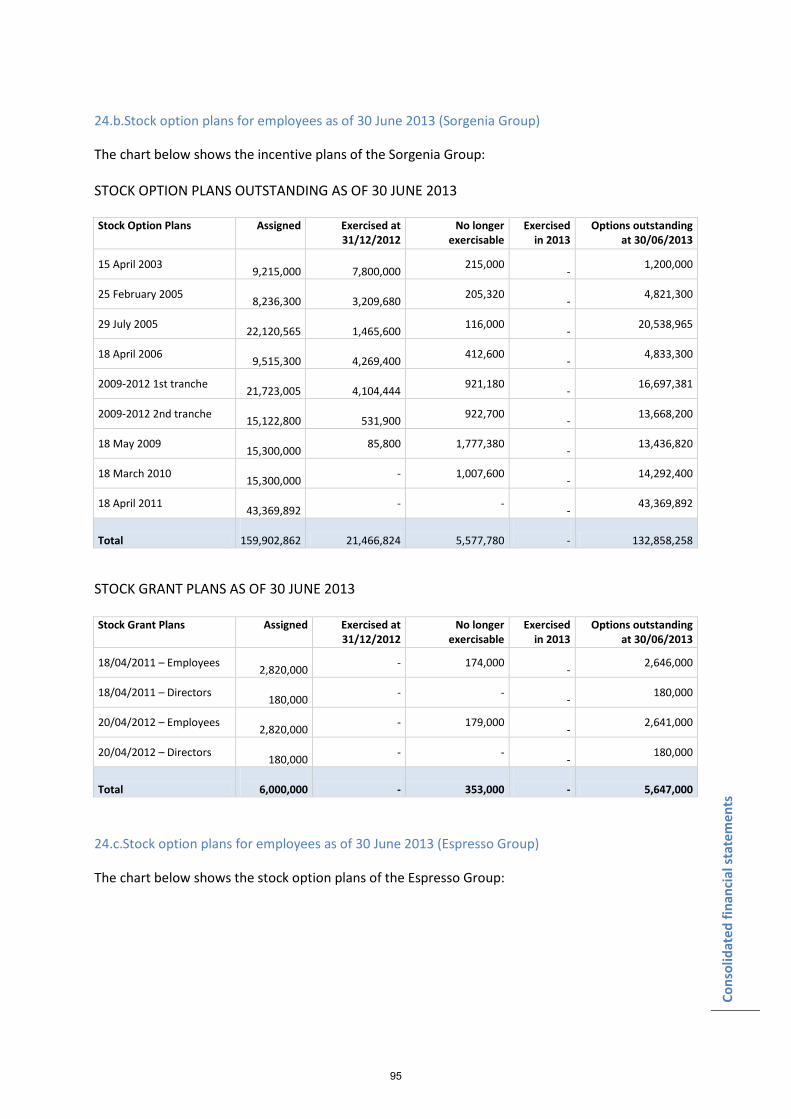
Cons
olid
ated
fina
ncia
l sta
tem
ents
24.b.Stock option plans for employees as of 30 June 2013 (Sorgenia Group)
The chart below shows the incentive plans of the Sorgenia Group: STOCK OPTION PLANS OUTSTANDING AS OF 30 JUNE 2013 Stock Option Plans Assigned Exercised at
31/12/2012 No longer
exercisable Exercised
in 2013 Options outstanding
at 30/06/2013
15 April 2003 9,215,000
7,800,000 215,000
- 1,200,000
25 February 2005 8,236,300
3,209,680 205,320
- 4,821,300
29 July 2005 22,120,565
1,465,600 116,000
- 20,538,965
18 April 2006 9,515,300
4,269,400 412,600
- 4,833,300
2009-2012 1st tranche 21,723,005
4,104,444 921,180
- 16,697,381
2009-2012 2nd tranche 15,122,800
531,900 922,700
- 13,668,200
18 May 2009 15,300,000 85,800 1,777,380
- 13,436,820
18 March 2010 15,300,000 - 1,007,600
- 14,292,400
18 April 2011 43,369,892 - -
- 43,369,892
Total
159,902,862 21,466,824 5,577,780
- 132,858,258 STOCK GRANT PLANS AS OF 30 JUNE 2013 Stock Grant Plans Assigned Exercised at
31/12/2012 No longer
exercisable Exercised
in 2013 Options outstanding
at 30/06/2013
18/04/2011 – Employees 2,820,000 - 174,000
- 2,646,000
18/04/2011 – Directors 180,000 - -
- 180,000
20/04/2012 – Employees 2,820,000 - 179,000
- 2,641,000
20/04/2012 – Directors 180,000 - -
- 180,000
Total
6,000,000 - 353,000
- 5,647,000 24.c.Stock option plans for employees as of 30 June 2013 (Espresso Group)
The chart below shows the stock option plans of the Espresso Group:
95
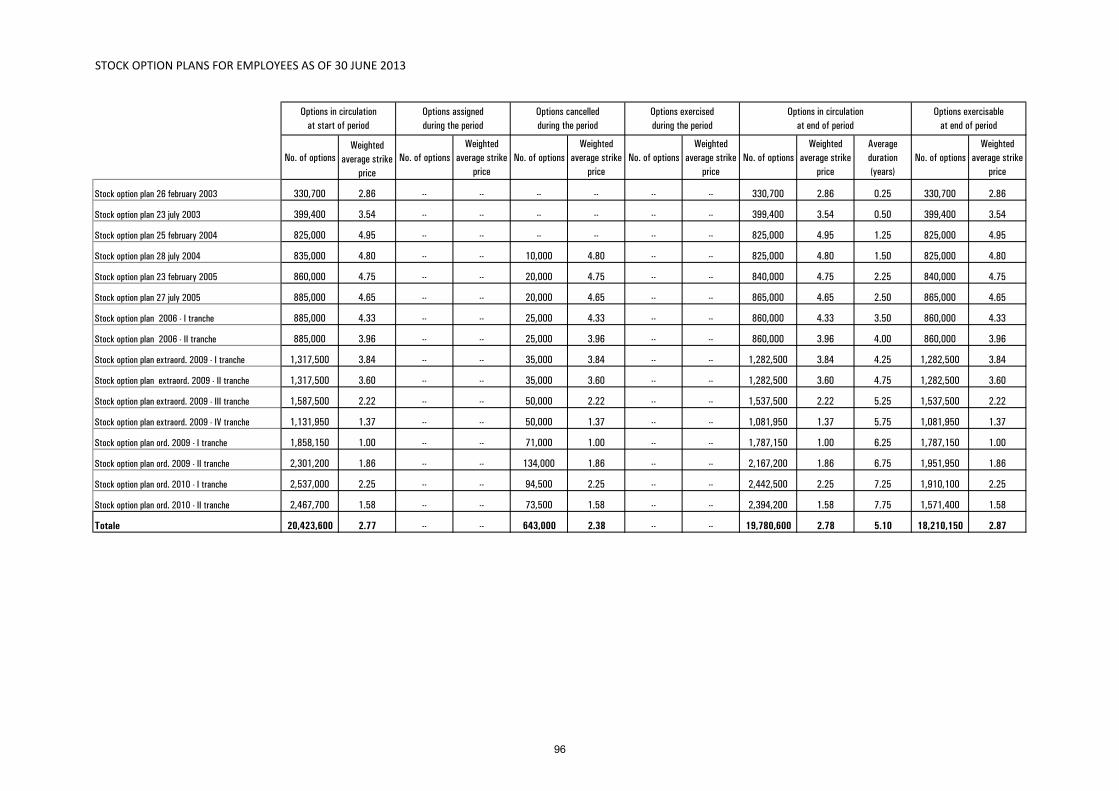
STOCK OPTION PLANS FOR EMPLOYEES AS OF 30 JUNE 2013
No. of options
Weighted
average strike
price
No. of options
Weighted
average strike
price
No. of options
Weighted
average strike
price
No. of options
Weighted
average strike
price
No. of options
Weighted
average strike
price
Average
duration
(years)
No. of options
Weighted
average strike
price
Stock option plan 26 february 2003 330,700 2.86 -- -- -- -- -- -- 330,700 2.86 0.25 330,700 2.86
Stock option plan 23 july 2003 399,400 3.54 -- -- -- -- -- -- 399,400 3.54 0.50 399,400 3.54
Stock option plan 25 february 2004 825,000 4.95 -- -- -- -- -- -- 825,000 4.95 1.25 825,000 4.95
Stock option plan 28 july 2004 835,000 4.80 -- -- 10,000 4.80 -- -- 825,000 4.80 1.50 825,000 4.80
Stock option plan 23 february 2005 860,000 4.75 -- -- 20,000 4.75 -- -- 840,000 4.75 2.25 840,000 4.75
Stock option plan 27 july 2005 885,000 4.65 -- -- 20,000 4.65 -- -- 865,000 4.65 2.50 865,000 4.65
Stock option plan 2006 - I tranche 885,000 4.33 -- -- 25,000 4.33 -- -- 860,000 4.33 3.50 860,000 4.33
Stock option plan 2006 - II tranche 885,000 3.96 -- -- 25,000 3.96 -- -- 860,000 3.96 4.00 860,000 3.96
Stock option plan extraord. 2009 - I tranche 1,317,500 3.84 -- -- 35,000 3.84 -- -- 1,282,500 3.84 4.25 1,282,500 3.84
Stock option plan extraord. 2009 - II tranche 1,317,500 3.60 -- -- 35,000 3.60 -- -- 1,282,500 3.60 4.75 1,282,500 3.60
Stock option plan extraord. 2009 - III tranche 1,587,500 2.22 -- -- 50,000 2.22 -- -- 1,537,500 2.22 5.25 1,537,500 2.22
Stock option plan extraord. 2009 - IV tranche 1,131,950 1.37 -- -- 50,000 1.37 -- -- 1,081,950 1.37 5.75 1,081,950 1.37
Stock option plan ord. 2009 - I tranche 1,858,150 1.00 -- -- 71,000 1.00 -- -- 1,787,150 1.00 6.25 1,787,150 1.00
Stock option plan ord. 2009 - II tranche 2,301,200 1.86 -- -- 134,000 1.86 -- -- 2,167,200 1.86 6.75 1,951,950 1.86
Stock option plan ord. 2010 - I tranche 2,537,000 2.25 -- -- 94,500 2.25 -- -- 2,442,500 2.25 7.25 1,910,100 2.25
Stock option plan ord. 2010 - II tranche 2,467,700 1.58 -- -- 73,500 1.58 -- -- 2,394,200 1.58 7.75 1,571,400 1.58
Totale 20,423,600 2.77 -- -- 643,000 2.38 -- -- 19,780,600 2.78 5.10 18,210,150 2.87
Options exercisable
at end of period
Options in circulation
at start of period
Options assigned
during the period
Options cancelled
during the period
Options exercised
during the period
Options in circulation
at end of period
96

STOCK GRANT FOR EMPLOYEES AS OF 30 JUNE 2013
STOCK GRANT 2011 No. of UnitsValue at the
beginningNo. of Units
Value at the
beginningNo. of Units
Weighted
average strike
price
No. of Units
Weighted
average strike
price
No. of Units
Weighted
average strike
price
No. of Units
Weighted
average strike
price
Time-based Units 626,250 1.81 49 1.81 12,500 1.81 10,391 1.81 603,408 1.81 -- --
Performance-based Units 626,250 1.81 -- -- 13,750 1.81 -- -- 612,500 1.81 -- --
STOCK GRANT 2012 No. of UnitsValue at the
beginningNo. of Units
Value at the
beginningNo. of Units
Weighted
average strike
price
No. of Units
Weighted
average strike
price
No. of Units
Weighted
average strike
price
No. of Units
Weighted
average strike
price
Time-based Units 878,750 0.98 -- -- 10,000 0.98 -- -- 868,750 0.98 -- --
Performance-based Units 878,750 0.98 -- -- 10,000 0.98 -- -- 868,750 0.98 -- --
STOCK GRANT 2013 No. of UnitsValue at the
beginningNo. of Units
Value at the
beginningNo. of Units
Weighted
average strike
price
No. of Units
Weighted
average strike
price
No. of Units
Weighted
average strike
price
No. of Units
Weighted
average strike
price
Time-based Units -- -- 697,500 0.83 -- -- -- -- 697,500 0.98 -- --
Performance-based Units -- -- 697,500 0.83 -- -- -- -- 697,500 0.98 -- --
Units in circulation
at start of period
Units assigned
during the period
Units cancelled
during the period
Units exercised
during the period
Units in circulation
at end of period
Units exercisable
at end of period
Units in circulation
at start of period
Units assigned
during the period
Units cancelled
during the period
Units exercised
during the period
Units in circulation
at end of period
Units exercisable
at end of period
Units exercisable
at end of period
Units in circulation
at end of period
Units in circulation
at start of period
Units assigned
during the period
Units cancelled
during the period
Units exercised
during the period
97
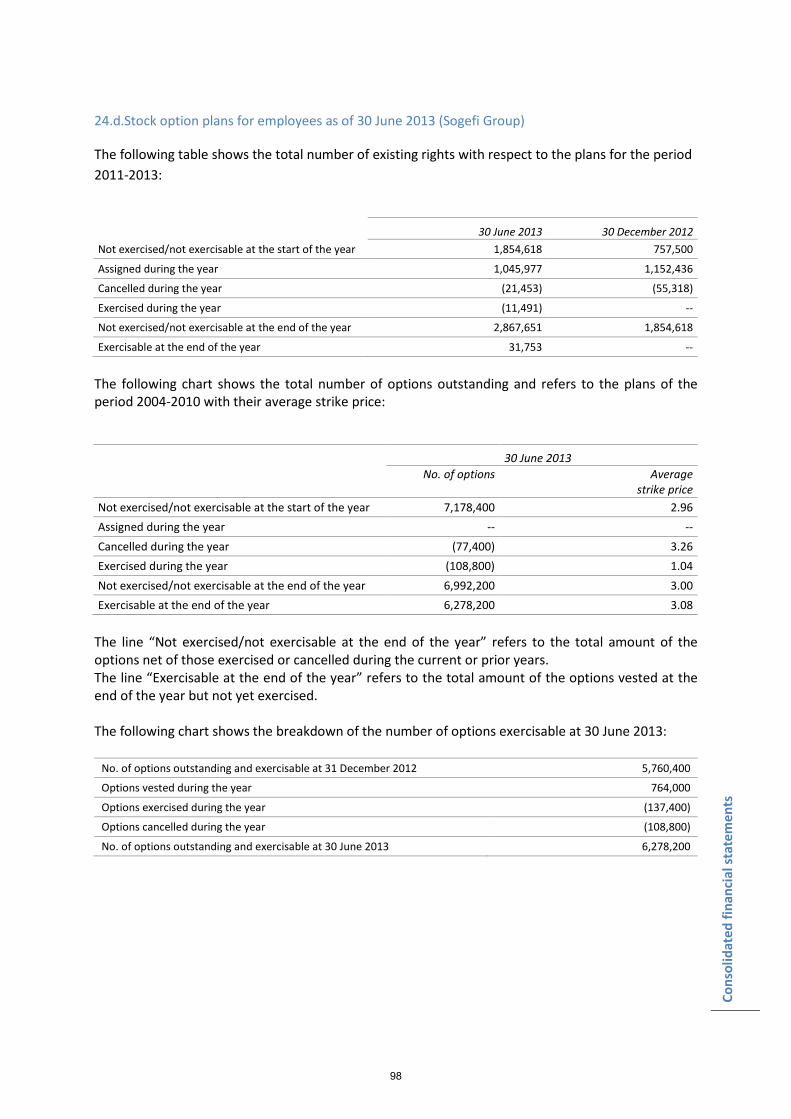
Cons
olid
ated
fina
ncia
l sta
tem
ents
24.d.Stock option plans for employees as of 30 June 2013 (Sogefi Group)
The following table shows the total number of existing rights with respect to the plans for the period 2011-2013:
30 June 2013 30 December 2012 Not exercised/not exercisable at the start of the year 1,854,618 757,500
Assigned during the year 1,045,977 1,152,436
Cancelled during the year (21,453) (55,318)
Exercised during the year (11,491) --
Not exercised/not exercisable at the end of the year 2,867,651 1,854,618
Exercisable at the end of the year 31,753 --
The following chart shows the total number of options outstanding and refers to the plans of the period 2004-2010 with their average strike price: 30 June 2013
No. of options Average strike price
Not exercised/not exercisable at the start of the year 7,178,400 2.96 Assigned during the year -- -- Cancelled during the year (77,400) 3.26 Exercised during the year (108,800) 1.04 Not exercised/not exercisable at the end of the year 6,992,200 3.00 Exercisable at the end of the year 6,278,200 3.08
The line “Not exercised/not exercisable at the end of the year” refers to the total amount of the options net of those exercised or cancelled during the current or prior years. The line “Exercisable at the end of the year” refers to the total amount of the options vested at the end of the year but not yet exercised. The following chart shows the breakdown of the number of options exercisable at 30 June 2013:
No. of options outstanding and exercisable at 31 December 2012 5,760,400
Options vested during the year 764,000
Options exercised during the year (137,400)
Options cancelled during the year (108,800)
No. of options outstanding and exercisable at 30 June 2013 6,278,200
98
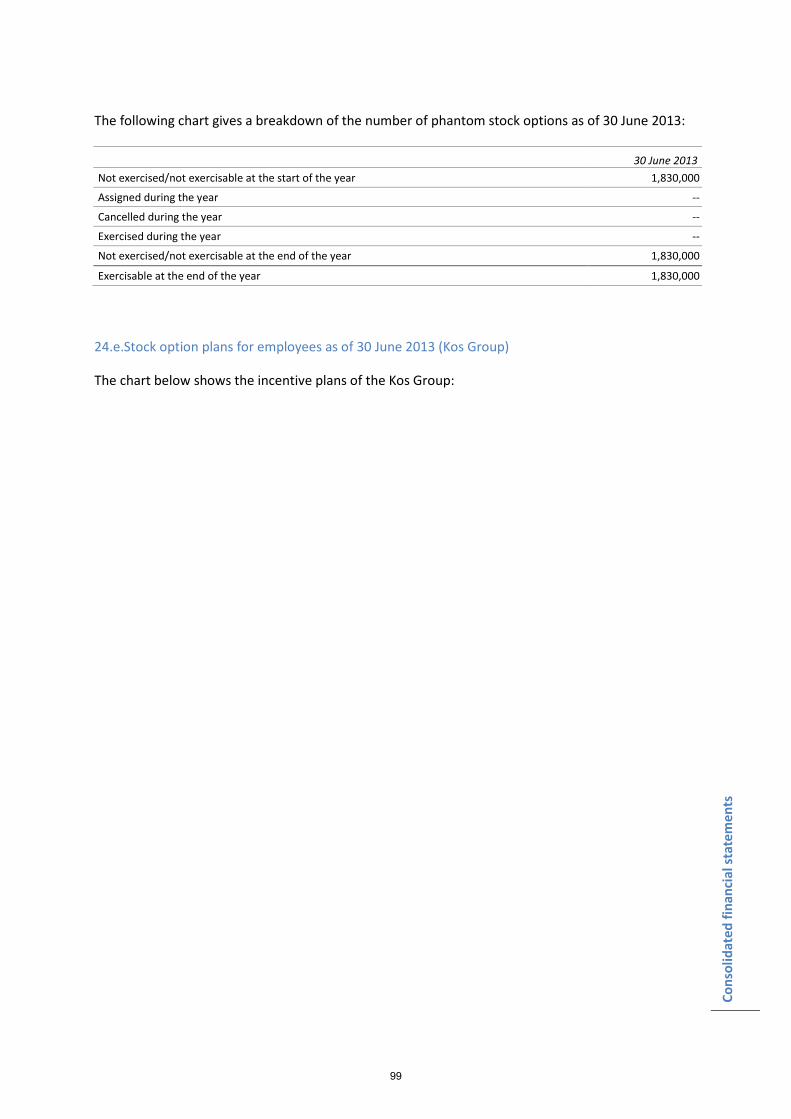
Cons
olid
ated
fina
ncia
l sta
tem
ents
The following chart gives a breakdown of the number of phantom stock options as of 30 June 2013: 30 June 2013 Not exercised/not exercisable at the start of the year 1,830,000
Assigned during the year --
Cancelled during the year --
Exercised during the year --
Not exercised/not exercisable at the end of the year 1,830,000
Exercisable at the end of the year 1,830,000
24.e.Stock option plans for employees as of 30 June 2013 (Kos Group)
The chart below shows the incentive plans of the Kos Group:
99
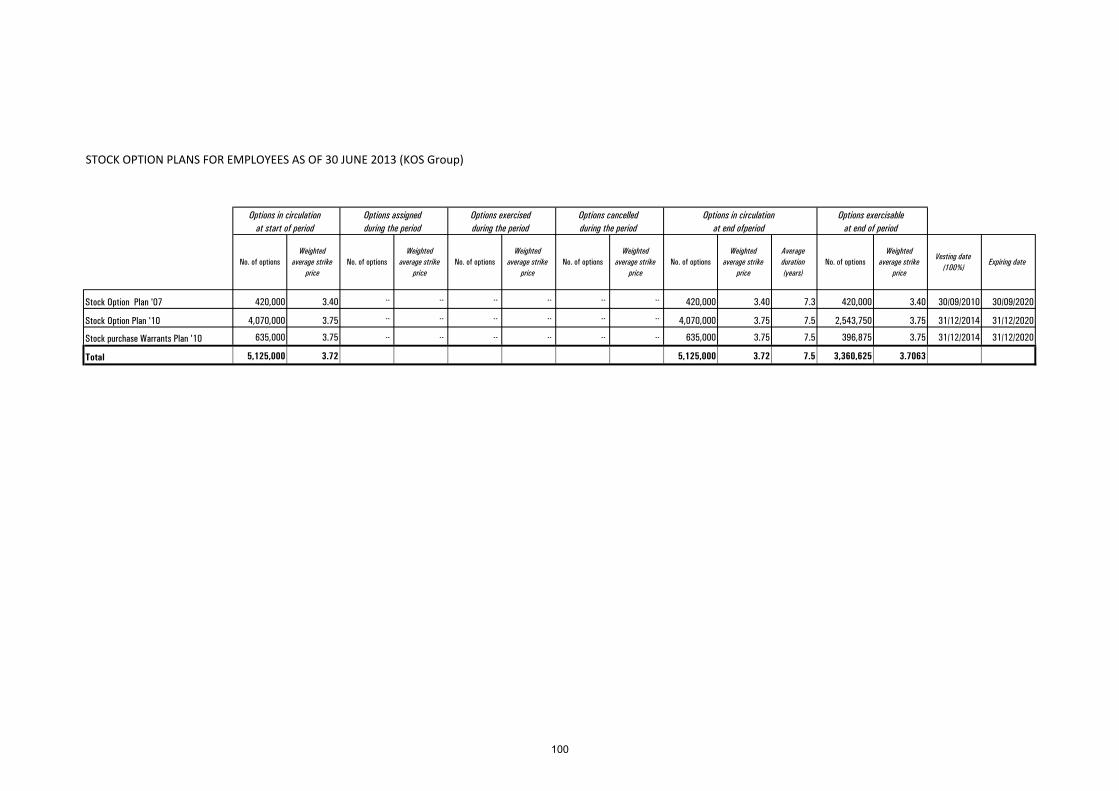
STOCK OPTION PLANS FOR EMPLOYEES AS OF 30 JUNE 2013 (KOS Group)
Stock Option Plan '07 420,000 3.40 -- -- -- -- -- -- 420,000 3.40 7.3 420,000 3.40 30/09/2010 30/09/2020
Stock Option Plan '10 4,070,000 3.75 -- -- -- -- -- -- 4,070,000 3.75 7.5 2,543,750 3.75 31/12/2014 31/12/2020
Stock purchase Warrants Plan '10 635,000 3.75 -- -- -- -- -- -- 635,000 3.75 7.5 396,875 3.75 31/12/2014 31/12/2020
Total 5,125,000 3.72 5,125,000 3.72 7.5 3,360,625 3.7063
Weighted
average strike
price
Vesting date
(100%)Expiring dateNo. of options
Weighted
average strike
price
No. of options
Weighted
average strike
price
Average
duration
(years)
No. of optionsNo. of options
Weighted
average strike
price
No. of options
Weighted
average strike
price
No. of options
Weighted
average strike
price
Options in circulation
at start of period
Options assigned
during the period
Options exercised
during the period
Options cancelled
during the period
Options in circulation
at end ofperiod
Options exercisable
at end of period
100
Cons
olid
ated
fina
ncia
l sta
tem
ents
25. Subsequent events
Regarding subsequent events, please refer to the appropriate paragraph of the interim report on operations. Note that the interim report, of which the interim financial statements at 30 June 2012 form an integral part, was approved by the Board of Directors on 29 July 2013. 26. Significant non-recurring events and atypical and/or unusual transactions
No non-recurring items have been included in the operating result for the period. Nor have any atypical and/or unusual transactions taken place.
27.Related party transactions
Information regarding the impact that related party transactions have on the financial and equity situation and on the result for the period are provided in the comment on the individual items of the financial statements. The section "Other information" in the interim report on operations shows the various types of transactions with related parties, whereas the amounts involved are shown in the notes. The following chart gives a summary of transactions with related parties:
101
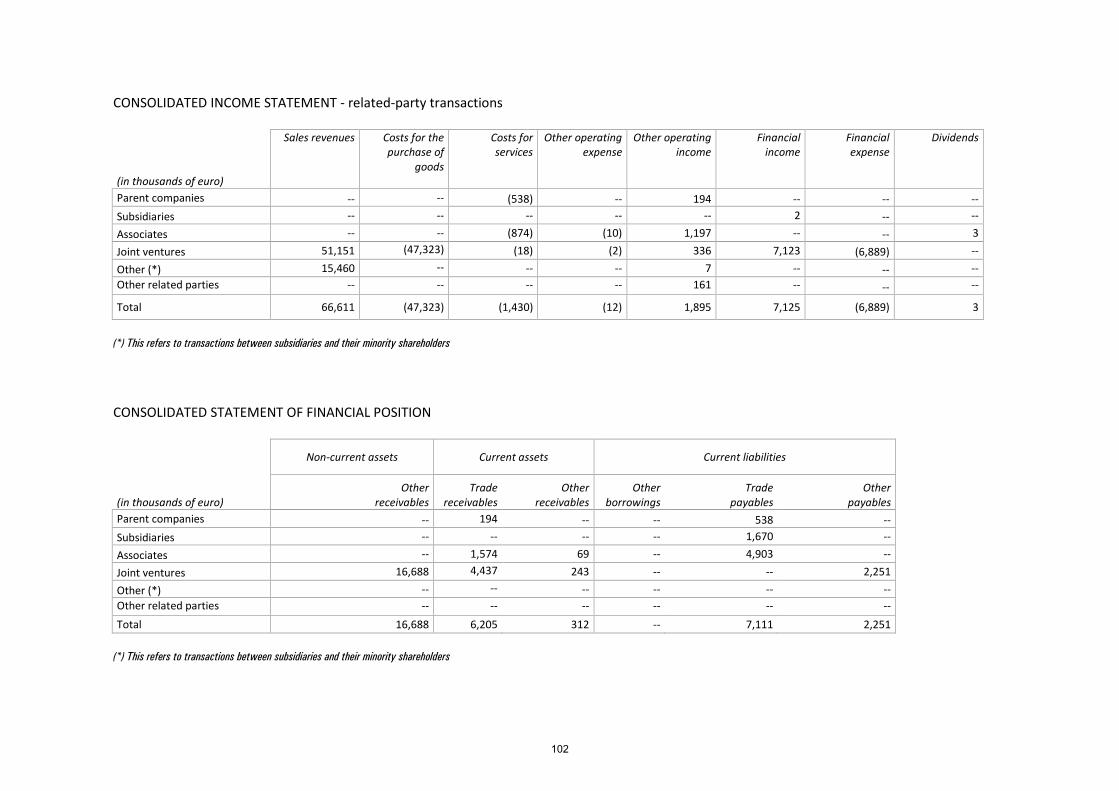
CONSOLIDATED INCOME STATEMENT - related-party transactions
(in thousands of euro)
Sales revenues
Costs for the purchase of
goods
Costs for services
Other operating expense
Other operating income
Financial income
Financial expense
Dividends
Parent companies -- -- (538) -- 194 -- -- -- Subsidiaries -- -- -- -- -- 2 -- -- Associates -- -- (874) (10) 1,197 -- -- 3 Joint ventures 51,151 (47,323) (18) (2) 336 7,123 (6,889) -- Other (*) 15,460 -- -- -- 7 -- -- -- Other related parties -- -- -- -- 161 -- -- --
Total 66,611 (47,323) (1,430) (12) 1,895 7,125 (6,889) 3
(*) This refers to transactions between subsidiaries and their minority shareholders CONSOLIDATED STATEMENT OF FINANCIAL POSITION
Non-current assets Current assets Current liabilities
(in thousands of euro)
Other receivables
Trade receivables
Other receivables
Other borrowings
Trade payables
Other payables
Parent companies -- 194 -- -- 538 -- Subsidiaries -- -- -- -- 1,670 -- Associates -- 1,574 69 -- 4,903 -- Joint ventures 16,688 4,437 243 -- -- 2,251 Other (*) -- -- -- -- -- -- Other related parties -- -- -- -- -- -- Total 16,688 6,205 312 -- 7,111 2,251
(*) This refers to transactions between subsidiaries and their minority shareholders
102
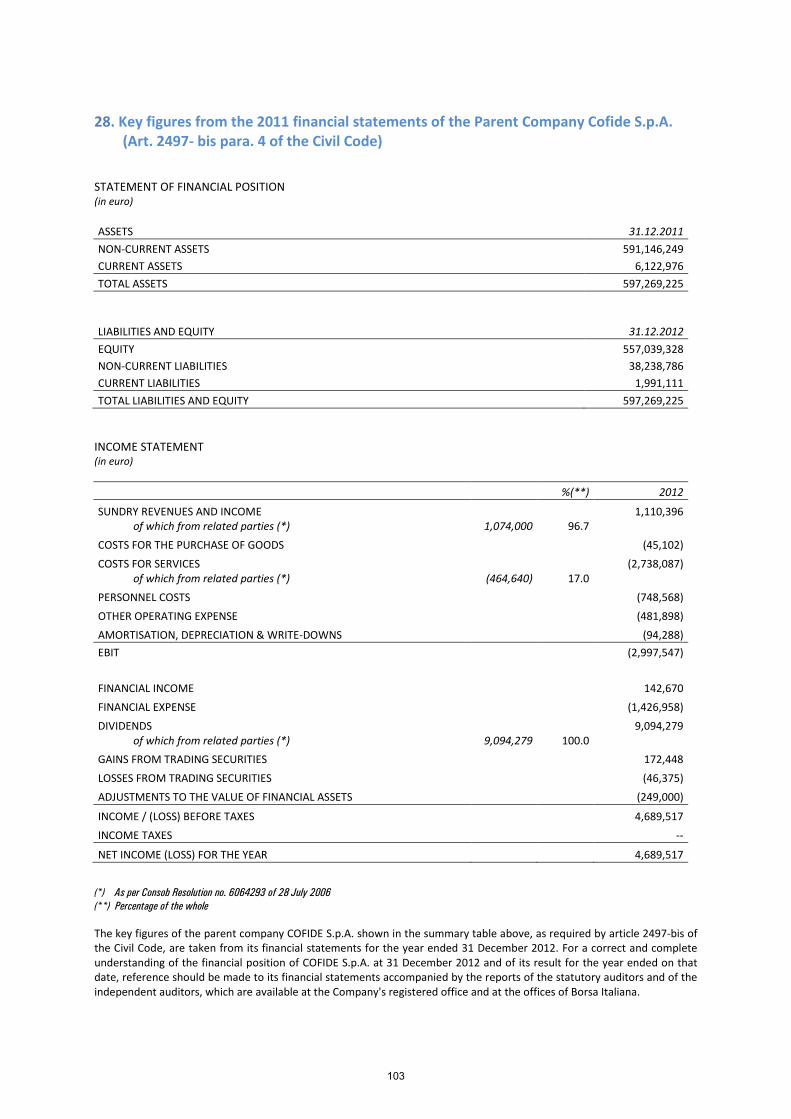
28. Key figures from the 2011 financial statements of the Parent Company Cofide S.p.A. (Art. 2497- bis para. 4 of the Civil Code)
STATEMENT OF FINANCIAL POSITION (in euro) ASSETS 31.12.2011 NON-CURRENT ASSETS 591,146,249 CURRENT ASSETS 6,122,976 TOTAL ASSETS 597,269,225 LIABILITIES AND EQUITY 31.12.2012 EQUITY 557,039,328 NON-CURRENT LIABILITIES 38,238,786 CURRENT LIABILITIES 1,991,111 TOTAL LIABILITIES AND EQUITY 597,269,225
INCOME STATEMENT (in euro)
%(**) 2012
SUNDRY REVENUES AND INCOME 1,110,396 of which from related parties (*) 1,074,000 96.7 COSTS FOR THE PURCHASE OF GOODS (45,102) COSTS FOR SERVICES (2,738,087) of which from related parties (*) (464,640) 17.0 PERSONNEL COSTS (748,568) OTHER OPERATING EXPENSE (481,898) AMORTISATION, DEPRECIATION & WRITE-DOWNS (94,288) EBIT (2,997,547) FINANCIAL INCOME 142,670 FINANCIAL EXPENSE (1,426,958) DIVIDENDS 9,094,279 of which from related parties (*) 9,094,279 100.0 GAINS FROM TRADING SECURITIES 172,448 LOSSES FROM TRADING SECURITIES (46,375) ADJUSTMENTS TO THE VALUE OF FINANCIAL ASSETS (249,000)
INCOME / (LOSS) BEFORE TAXES 4,689,517 INCOME TAXES --
NET INCOME (LOSS) FOR THE YEAR 4,689,517
(*) As per Consob Resolution no. 6064293 of 28 July 2006 (**) Percentage of the whole The key figures of the parent company COFIDE S.p.A. shown in the summary table above, as required by article 2497-bis of the Civil Code, are taken from its financial statements for the year ended 31 December 2012. For a correct and complete understanding of the financial position of COFIDE S.p.A. at 31 December 2012 and of its result for the year ended on that date, reference should be made to its financial statements accompanied by the reports of the statutory auditors and of the independent auditors, which are available at the Company's registered office and at the offices of Borsa Italiana.
103
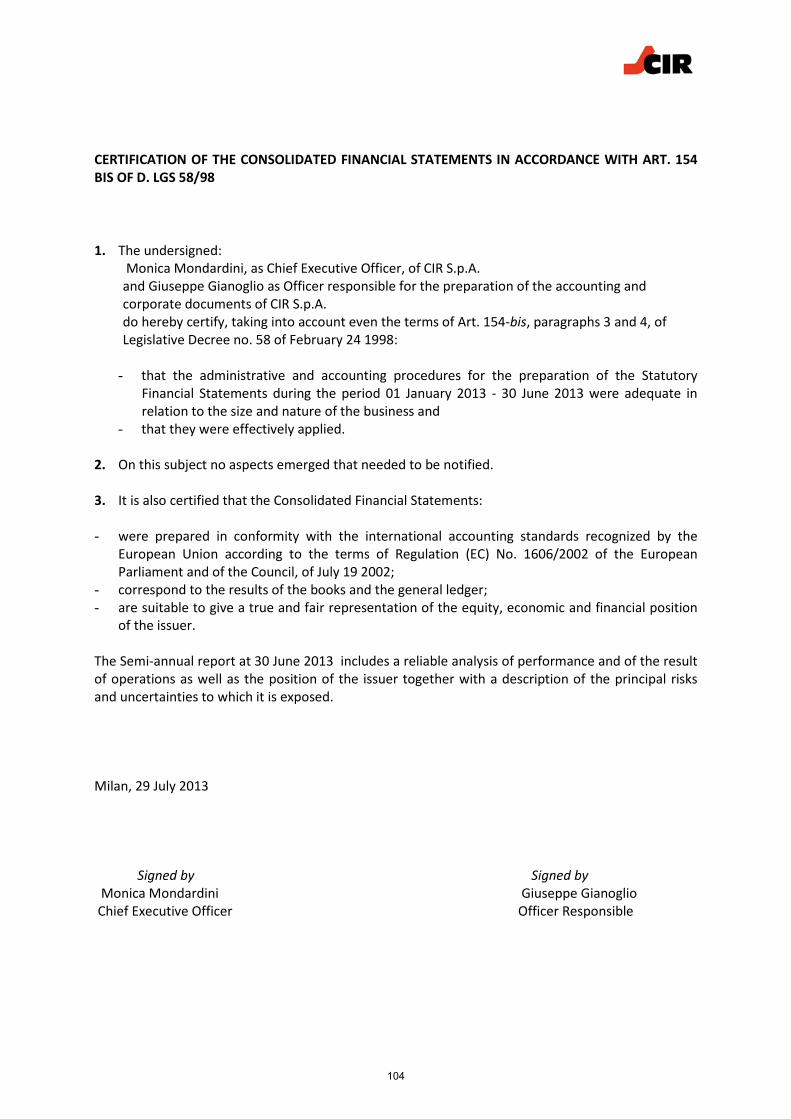
CERTIFICATION OF THE CONSOLIDATED FINANCIAL STATEMENTS IN ACCORDANCE WITH ART. 154 BIS OF D. LGS 58/98 1. The undersigned:
Monica Mondardini, as Chief Executive Officer, of CIR S.p.A. and Giuseppe Gianoglio as Officer responsible for the preparation of the accounting and corporate documents of CIR S.p.A. do hereby certify, taking into account even the terms of Art. 154-bis, paragraphs 3 and 4, of Legislative Decree no. 58 of February 24 1998:
- that the administrative and accounting procedures for the preparation of the Statutory
Financial Statements during the period 01 January 2013 - 30 June 2013 were adequate in relation to the size and nature of the business and
- that they were effectively applied. 2. On this subject no aspects emerged that needed to be notified. 3. It is also certified that the Consolidated Financial Statements: - were prepared in conformity with the international accounting standards recognized by the
European Union according to the terms of Regulation (EC) No. 1606/2002 of the European Parliament and of the Council, of July 19 2002;
- correspond to the results of the books and the general ledger; - are suitable to give a true and fair representation of the equity, economic and financial position
of the issuer.
The Semi-annual report at 30 June 2013 includes a reliable analysis of performance and of the result of operations as well as the position of the issuer together with a description of the principal risks and uncertainties to which it is exposed. Milan, 29 July 2013 Signed by Signed by Monica Mondardini Giuseppe Gianoglio Chief Executive Officer Officer Responsible
104

105

CIR GROUP
FINANCIAL STATEMENTS OF THE PARENT COMPANY AS OF 30 JUNE 2013
STATEMENT OF FINANCIAL POSITION
INCOME STATEMENT
STATEMENT OF COMPREHENSIVE INCOME
STATEMENT OF CASH FLOWS
STATEMENT OF CHANGES IN EQUITY
106
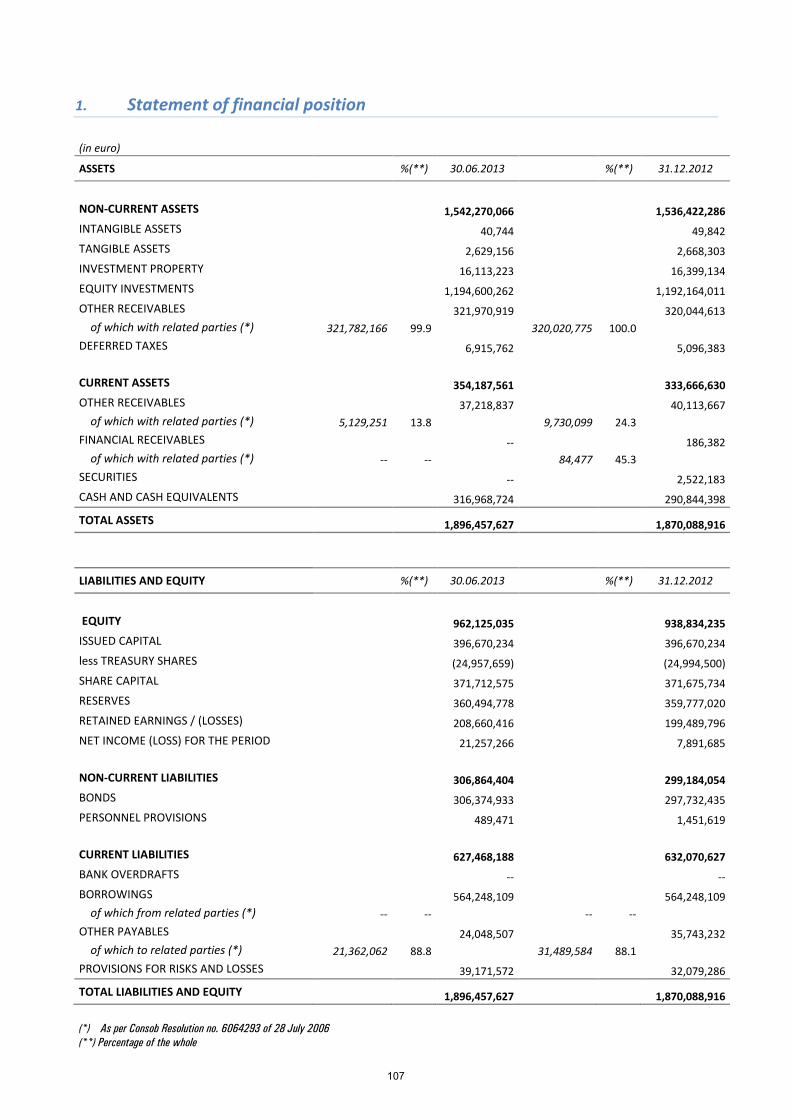
1. Statement of financial position
(in euro)
ASSETS %(**) 30.06.2013 %(**) 31.12.2012
NON-CURRENT ASSETS 1,542,270,066 1,536,422,286 INTANGIBLE ASSETS
40,744
49,842
TANGIBLE ASSETS
2,629,156
2,668,303 INVESTMENT PROPERTY
16,113,223
16,399,134
EQUITY INVESTMENTS
1,194,600,262
1,192,164,011 OTHER RECEIVABLES
321,970,919
320,044,613
of which with related parties (*) 321,782,166 99.9
320,020,775 100.0 DEFERRED TAXES
6,915,762
5,096,383
CURRENT ASSETS
354,187,561
333,666,630 OTHER RECEIVABLES
37,218,837
40,113,667
of which with related parties (*) 5,129,251 13.8
9,730,099 24.3 FINANCIAL RECEIVABLES
--
186,382
of which with related parties (*) -- --
84,477 45.3 SECURITIES
--
2,522,183
CASH AND CASH EQUIVALENTS
316,968,724
290,844,398
TOTAL ASSETS 1,896,457,627 1,870,088,916
LIABILITIES AND EQUITY %(**) 30.06.2013 %(**) 31.12.2012
EQUITY
962,125,035
938,834,235
ISSUED CAPITAL
396,670,234
396,670,234 less TREASURY SHARES
(24,957,659)
(24,994,500)
SHARE CAPITAL
371,712,575
371,675,734 RESERVES
360,494,778
359,777,020
RETAINED EARNINGS / (LOSSES)
208,660,416
199,489,796 NET INCOME (LOSS) FOR THE PERIOD
21,257,266
7,891,685
NON-CURRENT LIABILITIES
306,864,404
299,184,054 BONDS
306,374,933
297,732,435
PERSONNEL PROVISIONS
489,471
1,451,619
CURRENT LIABILITIES
627,468,188
632,070,627 BANK OVERDRAFTS
--
--
BORROWINGS
564,248,109
564,248,109 of which from related parties (*) -- --
-- --
OTHER PAYABLES
24,048,507
35,743,232 of which to related parties (*) 21,362,062 88.8
31,489,584 88.1
PROVISIONS FOR RISKS AND LOSSES
39,171,572
32,079,286
TOTAL LIABILITIES AND EQUITY 1,896,457,627 1,870,088,916 (*) As per Consob Resolution no. 6064293 of 28 July 2006 (**) Percentage of the whole
107
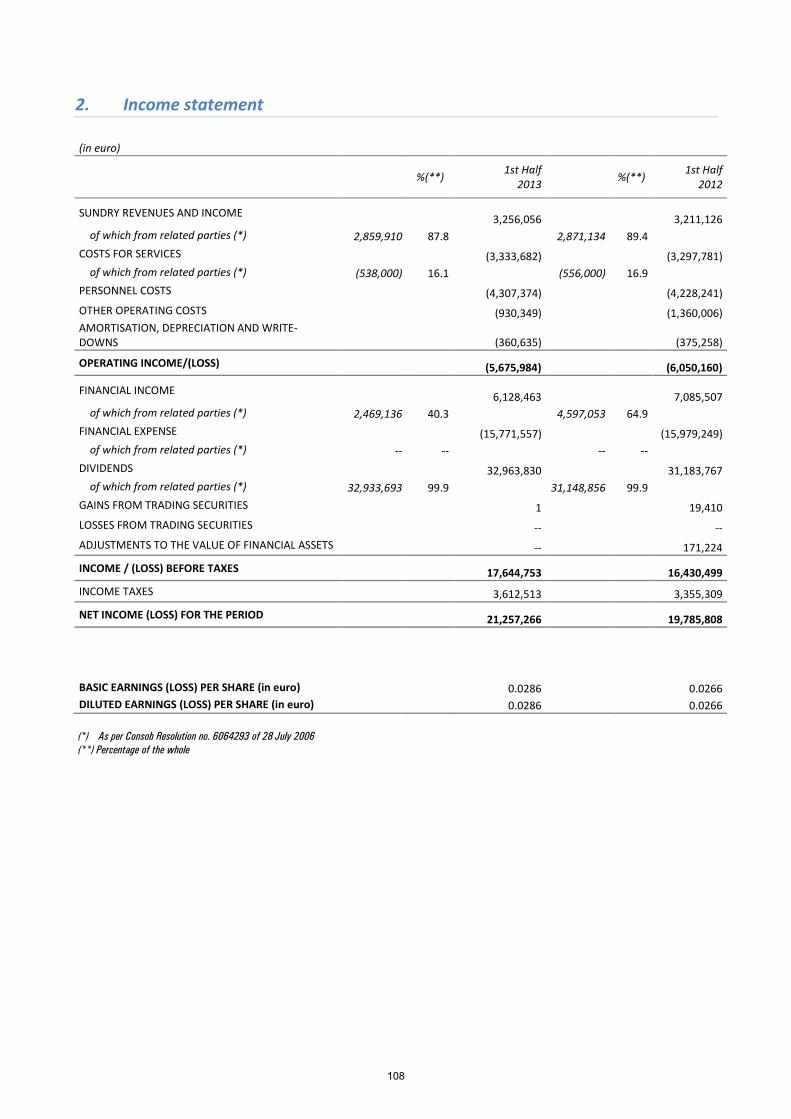
2. Income statement (in euro)
%(**) 1st Half
2013 %(**) 1st Half 2012
SUNDRY REVENUES AND INCOME
3,256,056
3,211,126
of which from related parties (*) 2,859,910 87.8
2,871,134 89.4 COSTS FOR SERVICES
(3,333,682)
(3,297,781)
of which from related parties (*) (538,000) 16.1
(556,000) 16.9 PERSONNEL COSTS
(4,307,374)
(4,228,241)
OTHER OPERATING COSTS
(930,349)
(1,360,006) AMORTISATION, DEPRECIATION AND WRITE-DOWNS
(360,635)
(375,258)
OPERATING INCOME/(LOSS) (5,675,984) (6,050,160)
FINANCIAL INCOME
6,128,463
7,085,507
of which from related parties (*) 2,469,136 40.3
4,597,053 64.9 FINANCIAL EXPENSE
(15,771,557)
(15,979,249)
of which from related parties (*) -- --
-- -- DIVIDENDS
32,963,830
31,183,767
of which from related parties (*) 32,933,693 99.9
31,148,856 99.9 GAINS FROM TRADING SECURITIES
1
19,410
LOSSES FROM TRADING SECURITIES
--
-- ADJUSTMENTS TO THE VALUE OF FINANCIAL ASSETS
--
171,224
INCOME / (LOSS) BEFORE TAXES 17,644,753 16,430,499 INCOME TAXES 3,612,513 3,355,309
NET INCOME (LOSS) FOR THE PERIOD 21,257,266 19,785,808
BASIC EARNINGS (LOSS) PER SHARE (in euro)
0.0286
0.0266
DILUTED EARNINGS (LOSS) PER SHARE (in euro) 0.0286 0.0266 (*) As per Consob Resolution no. 6064293 of 28 July 2006 (**) Percentage of the whole
108
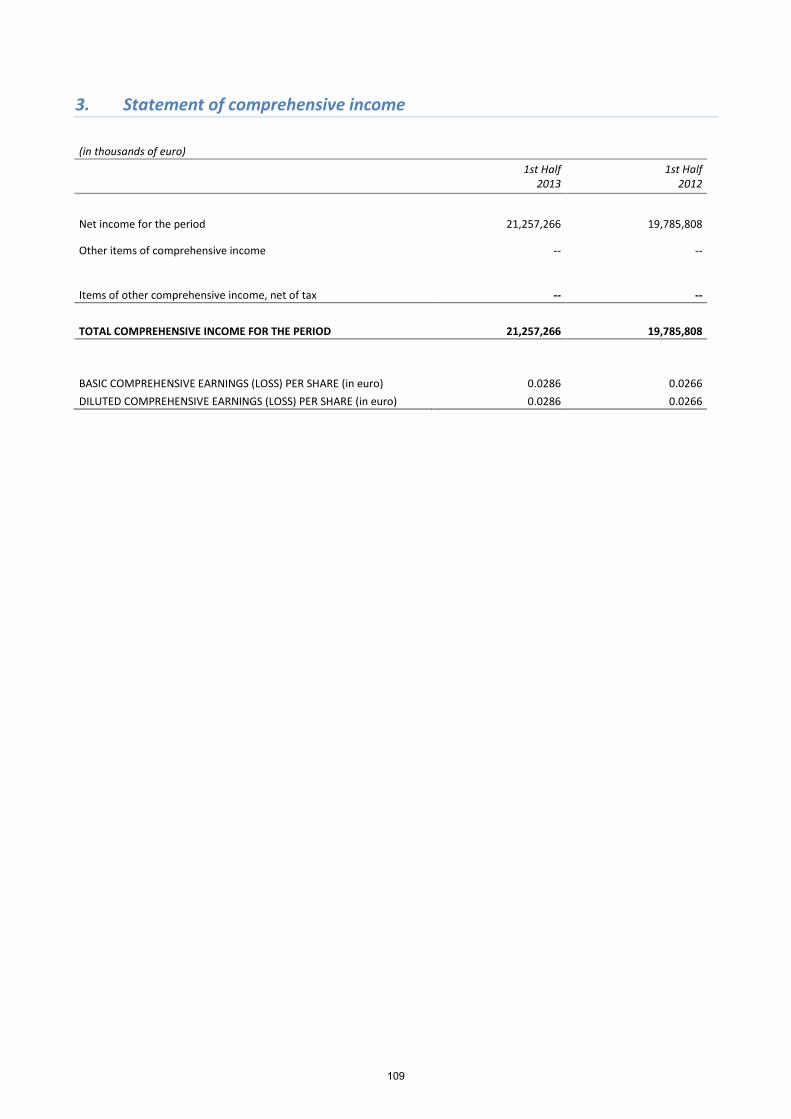
3. Statement of comprehensive income (in thousands of euro)
1st Half
2013 1st Half
2012
Net income for the period 21,257,266 19,785,808
Other items of comprehensive income -- --
Items of other comprehensive income, net of tax -- -- TOTAL COMPREHENSIVE INCOME FOR THE PERIOD 21,257,266 19,785,808
BASIC COMPREHENSIVE EARNINGS (LOSS) PER SHARE (in euro) 0.0286 0.0266 DILUTED COMPREHENSIVE EARNINGS (LOSS) PER SHARE (in euro) 0.0286 0.0266
109

4. Statement of cash flows (in euro)
1st Half
2013 1st Half
2012
OPERATING ACTIVITY
NET INCOME (LOSS) FOR THE YEAR
21,257,266
19,785,808
ADJUSTMENTS: AMORTISATION, DEPRECIATION AND WRITE-DOWNS
360,635
375,258 LOSSES / (GAINS) ON SALE OF INVESTMENTS AND CURRENT SECURITIES (1)
(19,410)
ACTUARIAL VALUATION OF STOCK OPTION PLANS
2,033,534
1,310,807 PROVISIONS FOR EMPLOYEE LEAVING INDEMNITY
138,658
133,074
ADJUSTMENTS TO THE VALUE OF FINANCIAL ASSETS
--
(171,224) (INCREASE) DECREASE IN NET WORKING CAPITAL
5,325,586
9,299,386
of which with related parties (2,903,674) 16,912,917
CASH FLOW FROM OPERATING ACTIVITY
29,115,678
30,713,699
of which:
- interest received (paid)
3,736,292
2,568,210 - dividends received
32,963,830
31,183,767
- income tax inflows (disbursements)* 240,352 11,180,590
INVESTMENT ACTIVITY (PURCHASE)/SALE OF CURRENT SECURITIES
2,522,184
(519,482)
(PURCHASE)/SALE OF FIXED ASSETS
(2,462,730)
(70,748)
CASH FLOW FROM INVESTMENT ACTIVITY 59,454 (590,230)
FUNDING ACTIVITY
DIVIDENDS PAID
--
(18,583,910)
REPAYMENT/(DISBURSEMENT) OF LOANS TO SUBSIDIARIES
(1,950,000)
5,000,000
INFLOWS FOR CAPITAL INCREASES
--
8,917
OTHER CHANGES
(1,100,806)
(275,461)
CASH FLOW FROM FUNDING ACTIVITY (3,050,806) (13,850,454)
INCREASE (REDUCTION) IN NET CASH & CASH EQUIVALENTS 26,124,326 16,273,015
NET CASH & CASH EQUIVALENTS - OPENING BALANCE 290,844,398 137,288,854
NET CASH & CASH EQUIVALENTS - CLOSING BALANCE 316,968,724 153,561,869
* The amounts refer to current tax assets received from taking part in tax consolidation
110
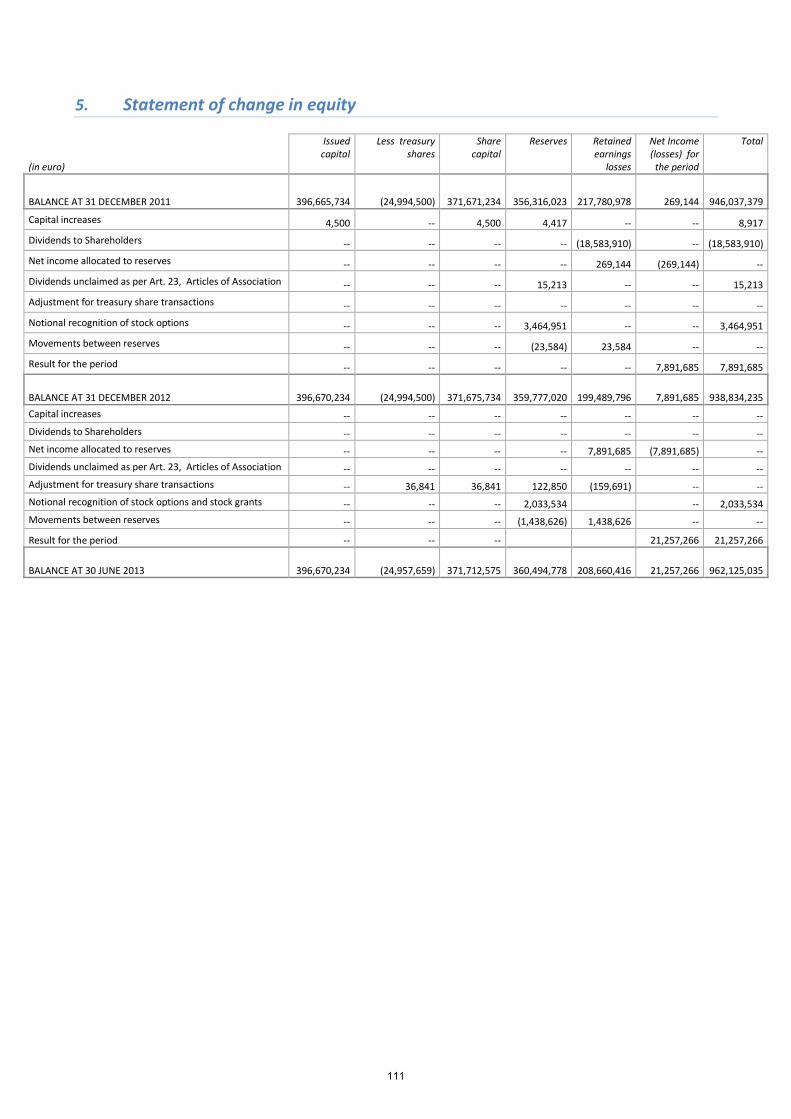
5. Statement of change in equity
(in euro)
Issued capital
Less treasury shares
Share capital
Reserves Retained earnings
losses
Net Income (losses) for the period
Total
BALANCE AT 31 DECEMBER 2011 396,665,734 (24,994,500) 371,671,234 356,316,023 217,780,978 269,144 946,037,379
Capital increases 4,500 -- 4,500 4,417 -- -- 8,917
Dividends to Shareholders -- -- -- -- (18,583,910) -- (18,583,910)
Net income allocated to reserves -- -- -- -- 269,144 (269,144) --
Dividends unclaimed as per Art. 23, Articles of Association -- -- -- 15,213 -- -- 15,213
Adjustment for treasury share transactions -- -- -- -- -- -- --
Notional recognition of stock options -- -- -- 3,464,951 -- -- 3,464,951
Movements between reserves -- -- -- (23,584) 23,584 -- --
Result for the period -- -- -- -- -- 7,891,685 7,891,685
BALANCE AT 31 DECEMBER 2012 396,670,234 (24,994,500) 371,675,734 359,777,020 199,489,796 7,891,685 938,834,235 Capital increases -- -- -- -- -- -- -- Dividends to Shareholders -- -- -- -- -- -- -- Net income allocated to reserves -- -- -- -- 7,891,685 (7,891,685) -- Dividends unclaimed as per Art. 23, Articles of Association -- -- -- -- -- -- -- Adjustment for treasury share transactions -- 36,841 36,841 122,850 (159,691) -- -- Notional recognition of stock options and stock grants -- -- -- 2,033,534 -- 2,033,534 Movements between reserves -- -- -- (1,438,626) 1,438,626 -- --
Result for the period -- -- -- 21,257,266 21,257,266
BALANCE AT 30 JUNE 2013 396,670,234 (24,957,659) 371,712,575 360,494,778 208,660,416 21,257,266 962,125,035
111

LIST OF EQUITY INVESTMENTS AS OF 30 JUNE 2013
Persuant to Art. 38.2 Italian Legislative Decree 127/91
112
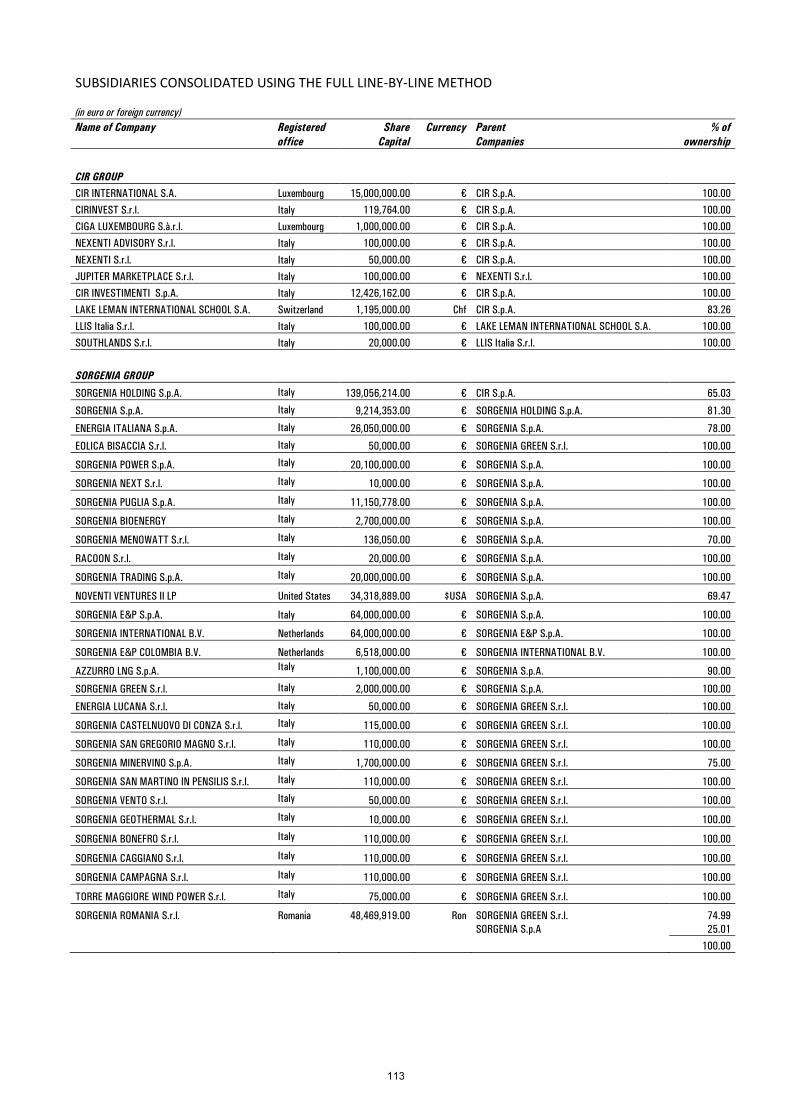
SUBSIDIARIES CONSOLIDATED USING THE FULL LINE-BY-LINE METHOD (in euro or foreign currency) Name of Company Registered
office Share
Capital Currency Parent
Companies % of
ownership
CIR GROUP CIR INTERNATIONAL S.A. Luxembourg 15,000,000.00 € CIR S.p.A. 100.00 CIRINVEST S.r.l. Italy 119,764.00 € CIR S.p.A. 100.00 CIGA LUXEMBOURG S.à.r.l. Luxembourg 1,000,000.00 € CIR S.p.A. 100.00 NEXENTI ADVISORY S.r.l. Italy 100,000.00 € CIR S.p.A. 100.00
NEXENTI S.r.l. Italy 50,000.00 € CIR S.p.A. 100.00 JUPITER MARKETPLACE S.r.l. Italy 100,000.00 € NEXENTI S.r.l. 100.00 CIR INVESTIMENTI S.p.A. Italy 12,426,162.00 € CIR S.p.A. 100.00 LAKE LEMAN INTERNATIONAL SCHOOL S.A. Switzerland 1,195,000.00 Chf CIR S.p.A. 83.26 LLIS Italia S.r.l. Italy 100,000.00 € LAKE LEMAN INTERNATIONAL SCHOOL S.A. 100.00 SOUTHLANDS S.r.l. Italy 20,000.00 € LLIS Italia S.r.l. 100.00
SORGENIA GROUP
SORGENIA HOLDING S.p.A. Italy 139,056,214.00 € CIR S.p.A. 65.03
SORGENIA S.p.A. Italy 9,214,353.00 € SORGENIA HOLDING S.p.A. 81.30
ENERGIA ITALIANA S.p.A. Italy 26,050,000.00 € SORGENIA S.p.A. 78.00
EOLICA BISACCIA S.r.l. Italy 50,000.00 € SORGENIA GREEN S.r.l. 100.00
SORGENIA POWER S.p.A. Italy 20,100,000.00 € SORGENIA S.p.A. 100.00
SORGENIA NEXT S.r.l. Italy 10,000.00 € SORGENIA S.p.A. 100.00
SORGENIA PUGLIA S.p.A. Italy 11,150,778.00 € SORGENIA S.p.A. 100.00
SORGENIA BIOENERGY Italy 2,700,000.00 € SORGENIA S.p.A. 100.00
SORGENIA MENOWATT S.r.l. Italy 136,050.00 € SORGENIA S.p.A. 70.00
RACOON S.r.l. Italy 20,000.00 € SORGENIA S.p.A. 100.00
SORGENIA TRADING S.p.A. Italy 20,000,000.00 € SORGENIA S.p.A. 100.00
NOVENTI VENTURES II LP United States 34,318,889.00 $USA SORGENIA S.p.A. 69.47
SORGENIA E&P S.p.A. Italy 64,000,000.00 € SORGENIA S.p.A. 100.00
SORGENIA INTERNATIONAL B.V. Netherlands 64,000,000.00 € SORGENIA E&P S.p.A. 100.00
SORGENIA E&P COLOMBIA B.V. Netherlands 6,518,000.00 € SORGENIA INTERNATIONAL B.V. 100.00
AZZURRO LNG S.p.A. Italy 1,100,000.00 € SORGENIA S.p.A. 90.00
SORGENIA GREEN S.r.l. Italy 2,000,000.00 € SORGENIA S.p.A. 100.00
ENERGIA LUCANA S.r.l. Italy 50,000.00 € SORGENIA GREEN S.r.l. 100.00
SORGENIA CASTELNUOVO DI CONZA S.r.l. Italy 115,000.00 € SORGENIA GREEN S.r.l. 100.00
SORGENIA SAN GREGORIO MAGNO S.r.l. Italy 110,000.00 € SORGENIA GREEN S.r.l. 100.00
SORGENIA MINERVINO S.p.A. Italy 1,700,000.00 € SORGENIA GREEN S.r.l. 75.00
SORGENIA SAN MARTINO IN PENSILIS S.r.l. Italy 110,000.00 € SORGENIA GREEN S.r.l. 100.00
SORGENIA VENTO S.r.l. Italy 50,000.00 € SORGENIA GREEN S.r.l. 100.00
SORGENIA GEOTHERMAL S.r.l. Italy 10,000.00 € SORGENIA GREEN S.r.l. 100.00
SORGENIA BONEFRO S.r.l. Italy 110,000.00 € SORGENIA GREEN S.r.l. 100.00
SORGENIA CAGGIANO S.r.l. Italy 110,000.00 € SORGENIA GREEN S.r.l. 100.00
SORGENIA CAMPAGNA S.r.l. Italy 110,000.00 € SORGENIA GREEN S.r.l. 100.00
TORRE MAGGIORE WIND POWER S.r.l. Italy 75,000.00 € SORGENIA GREEN S.r.l. 100.00
SORGENIA ROMANIA S.r.l. Romania 48,469,919.00 Ron SORGENIA GREEN S.r.l. 74.99 SORGENIA S.p.A 25.01
100.00
113
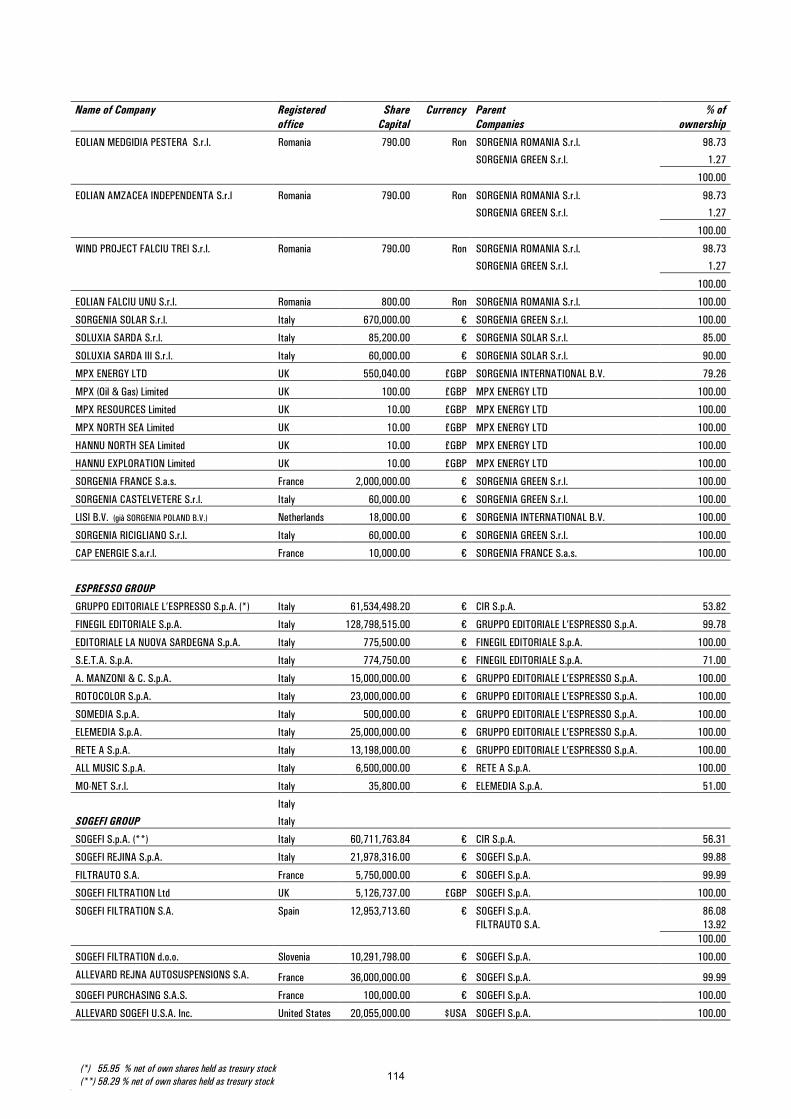
Name of Company Registered
office Share
Capital Currency Parent
Companies % of
ownership
EOLIAN MEDGIDIA PESTERA S.r.l. Romania 790.00 Ron SORGENIA ROMANIA S.r.l. 98.73
SORGENIA GREEN S.r.l. 1.27
100.00
EOLIAN AMZACEA INDEPENDENTA S.r.l Romania 790.00 Ron SORGENIA ROMANIA S.r.l. 98.73
SORGENIA GREEN S.r.l. 1.27
100.00
WIND PROJECT FALCIU TREI S.r.l. Romania 790.00 Ron SORGENIA ROMANIA S.r.l. 98.73
SORGENIA GREEN S.r.l. 1.27
100.00
EOLIAN FALCIU UNU S.r.l. Romania 800.00 Ron SORGENIA ROMANIA S.r.l. 100.00
SORGENIA SOLAR S.r.l. Italy 670,000.00 € SORGENIA GREEN S.r.l. 100.00
SOLUXIA SARDA S.r.l. Italy 85,200.00 € SORGENIA SOLAR S.r.l. 85.00
SOLUXIA SARDA III S.r.l. Italy 60,000.00 € SORGENIA SOLAR S.r.l. 90.00
MPX ENERGY LTD UK 550,040.00 £GBP SORGENIA INTERNATIONAL B.V. 79.26
MPX (Oil & Gas) Limited UK 100.00 £GBP MPX ENERGY LTD 100.00
MPX RESOURCES Limited UK 10.00 £GBP MPX ENERGY LTD 100.00
MPX NORTH SEA Limited UK 10.00 £GBP MPX ENERGY LTD 100.00
HANNU NORTH SEA Limited UK 10.00 £GBP MPX ENERGY LTD 100.00
HANNU EXPLORATION Limited UK 10.00 £GBP MPX ENERGY LTD 100.00
SORGENIA FRANCE S.a.s. France 2,000,000.00 € SORGENIA GREEN S.r.l. 100.00
SORGENIA CASTELVETERE S.r.l. Italy 60,000.00 € SORGENIA GREEN S.r.l. 100.00
LISI B.V. (già SORGENIA POLAND B.V.) Netherlands 18,000.00 € SORGENIA INTERNATIONAL B.V. 100.00
SORGENIA RICIGLIANO S.r.l. Italy 60,000.00 € SORGENIA GREEN S.r.l. 100.00
CAP ENERGIE S.a.r.l. France 10,000.00 € SORGENIA FRANCE S.a.s. 100.00
ESPRESSO GROUP
GRUPPO EDITORIALE L’ESPRESSO S.p.A. (*) Italy 61,534,498.20 € CIR S.p.A. 53.82
FINEGIL EDITORIALE S.p.A. Italy 128,798,515.00 € GRUPPO EDITORIALE L’ESPRESSO S.p.A. 99.78
EDITORIALE LA NUOVA SARDEGNA S.p.A. Italy 775,500.00 € FINEGIL EDITORIALE S.p.A. 100.00
S.E.T.A. S.p.A. Italy 774,750.00 € FINEGIL EDITORIALE S.p.A. 71.00
A. MANZONI & C. S.p.A. Italy 15,000,000.00 € GRUPPO EDITORIALE L’ESPRESSO S.p.A. 100.00
ROTOCOLOR S.p.A. Italy 23,000,000.00 € GRUPPO EDITORIALE L’ESPRESSO S.p.A. 100.00
SOMEDIA S.p.A. Italy 500,000.00 € GRUPPO EDITORIALE L’ESPRESSO S.p.A. 100.00
ELEMEDIA S.p.A. Italy 25,000,000.00 € GRUPPO EDITORIALE L’ESPRESSO S.p.A. 100.00
RETE A S.p.A. Italy 13,198,000.00 € GRUPPO EDITORIALE L’ESPRESSO S.p.A. 100.00
ALL MUSIC S.p.A. Italy 6,500,000.00 € RETE A S.p.A. 100.00
MO-NET S.r.l. Italy 35,800.00 € ELEMEDIA S.p.A. 51.00
Italy
SOGEFI GROUP Italy
SOGEFI S.p.A. (**) Italy 60,711,763.84 € CIR S.p.A. 56.31
SOGEFI REJINA S.p.A. Italy 21,978,316.00 € SOGEFI S.p.A. 99.88
FILTRAUTO S.A. France 5,750,000.00 € SOGEFI S.p.A. 99.99
SOGEFI FILTRATION Ltd UK 5,126,737.00 £GBP SOGEFI S.p.A. 100.00
SOGEFI FILTRATION S.A. Spain 12,953,713.60 € SOGEFI S.p.A. 86.08 FILTRAUTO S.A. 13.92 100.00
SOGEFI FILTRATION d.o.o. Slovenia 10,291,798.00 € SOGEFI S.p.A. 100.00
ALLEVARD REJNA AUTOSUSPENSIONS S.A. France 36,000,000.00 € SOGEFI S.p.A. 99.99
SOGEFI PURCHASING S.A.S. France 100,000.00 € SOGEFI S.p.A. 100.00
ALLEVARD SOGEFI U.S.A. Inc. United States 20,055,000.00 $USA SOGEFI S.p.A. 100.00
(*) 55.95 % net of own shares held as tresury stock (**) 58.29 % net of own shares held as tresury stock 114
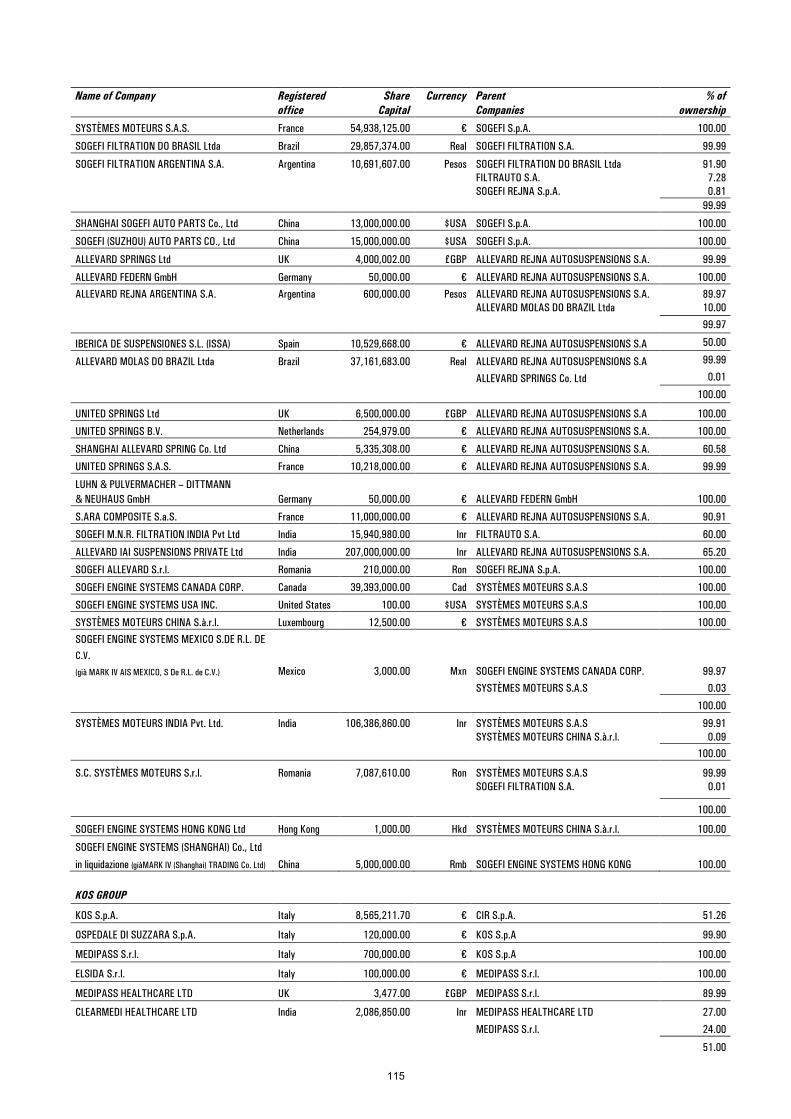
Name of Company Registered
office Share
Capital Currency Parent
Companies % of
ownership
SYSTÈMES MOTEURS S.A.S. France 54,938,125.00 € SOGEFI S.p.A. 100.00
SOGEFI FILTRATION DO BRASIL Ltda Brazil 29,857,374.00 Real SOGEFI FILTRATION S.A. 99.99
SOGEFI FILTRATION ARGENTINA S.A. Argentina 10,691,607.00 Pesos SOGEFI FILTRATION DO BRASIL Ltda 91.90 FILTRAUTO S.A. 7.28 SOGEFI REJNA S.p.A. 0.81 99.99
SHANGHAI SOGEFI AUTO PARTS Co., Ltd China 13,000,000.00 $USA SOGEFI S.p.A. 100.00
SOGEFI (SUZHOU) AUTO PARTS CO., Ltd China 15,000,000.00 $USA SOGEFI S.p.A. 100.00
ALLEVARD SPRINGS Ltd UK 4,000,002.00 £GBP ALLEVARD REJNA AUTOSUSPENSIONS S.A. 99.99
ALLEVARD FEDERN GmbH Germany 50,000.00 € ALLEVARD REJNA AUTOSUSPENSIONS S.A. 100.00
ALLEVARD REJNA ARGENTINA S.A. Argentina 600,000.00 Pesos ALLEVARD REJNA AUTOSUSPENSIONS S.A. 89.97 ALLEVARD MOLAS DO BRAZIL Ltda 10.00
99.97
IBERICA DE SUSPENSIONES S.L. (ISSA) Spain 10,529,668.00 € ALLEVARD REJNA AUTOSUSPENSIONS S.A 50.00
ALLEVARD MOLAS DO BRAZIL Ltda Brazil 37,161,683.00 Real ALLEVARD REJNA AUTOSUSPENSIONS S.A 99.99
ALLEVARD SPRINGS Co. Ltd 0.01
100.00
UNITED SPRINGS Ltd UK 6,500,000.00 £GBP ALLEVARD REJNA AUTOSUSPENSIONS S.A 100.00
UNITED SPRINGS B.V. Netherlands 254,979.00 € ALLEVARD REJNA AUTOSUSPENSIONS S.A. 100.00
SHANGHAI ALLEVARD SPRING Co. Ltd China 5,335,308.00 € ALLEVARD REJNA AUTOSUSPENSIONS S.A. 60.58
UNITED SPRINGS S.A.S. France 10,218,000.00 € ALLEVARD REJNA AUTOSUSPENSIONS S.A. 99.99
LUHN & PULVERMACHER – DITTMANN & NEUHAUS GmbH Germany 50,000.00 € ALLEVARD FEDERN GmbH 100.00
S.ARA COMPOSITE S.a.S. France 11,000,000.00 € ALLEVARD REJNA AUTOSUSPENSIONS S.A. 90.91
SOGEFI M.N.R. FILTRATION INDIA Pvt Ltd India 15,940,980.00 Inr FILTRAUTO S.A. 60.00
ALLEVARD IAI SUSPENSIONS PRIVATE Ltd India 207,000,000.00 Inr ALLEVARD REJNA AUTOSUSPENSIONS S.A. 65.20
SOGEFI ALLEVARD S.r.l. Romania 210,000.00 Ron SOGEFI REJNA S.p.A. 100.00
SOGEFI ENGINE SYSTEMS CANADA CORP. Canada 39,393,000.00 Cad SYSTÈMES MOTEURS S.A.S 100.00
SOGEFI ENGINE SYSTEMS USA INC. United States 100.00 $USA SYSTÈMES MOTEURS S.A.S 100.00
SYSTÈMES MOTEURS CHINA S.à.r.l. Luxembourg 12,500.00 € SYSTÈMES MOTEURS S.A.S 100.00
SOGEFI ENGINE SYSTEMS MEXICO S.DE R.L. DE
C.V.
(già MARK IV AIS MEXICO, S De R.L. de C.V.) Mexico 3,000.00 Mxn SOGEFI ENGINE SYSTEMS CANADA CORP. 99.97
SYSTÈMES MOTEURS S.A.S 0.03
100.00
SYSTÈMES MOTEURS INDIA Pvt. Ltd. India 106,386,860.00 Inr SYSTÈMES MOTEURS S.A.S 99.91 SYSTÈMES MOTEURS CHINA S.à.r.l. 0.09 100.00
S.C. SYSTÈMES MOTEURS S.r.l. Romania 7,087,610.00 Ron SYSTÈMES MOTEURS S.A.S 99.99
SOGEFI FILTRATION S.A. 0.01
100.00
SOGEFI ENGINE SYSTEMS HONG KONG Ltd Hong Kong 1,000.00 Hkd SYSTÈMES MOTEURS CHINA S.à.r.l. 100.00
SOGEFI ENGINE SYSTEMS (SHANGHAI) Co., Ltd
in liquidazione (giàMARK IV (Shanghai) TRADING Co. Ltd) China 5,000,000.00 Rmb SOGEFI ENGINE SYSTEMS HONG KONG 100.00
KOS GROUP
KOS S.p.A. Italy 8,565,211.70 € CIR S.p.A. 51.26
OSPEDALE DI SUZZARA S.p.A. Italy 120,000.00 € KOS S.p.A 99.90
MEDIPASS S.r.l. Italy 700,000.00 € KOS S.p.A 100.00
ELSIDA S.r.l. Italy 100,000.00 € MEDIPASS S.r.l. 100.00
MEDIPASS HEALTHCARE LTD UK 3,477.00 £GBP MEDIPASS S.r.l. 89.99
CLEARMEDI HEALTHCARE LTD India 2,086,850.00 Inr MEDIPASS HEALTHCARE LTD 27.00
MEDIPASS S.r.l. 24.00
51.00
115
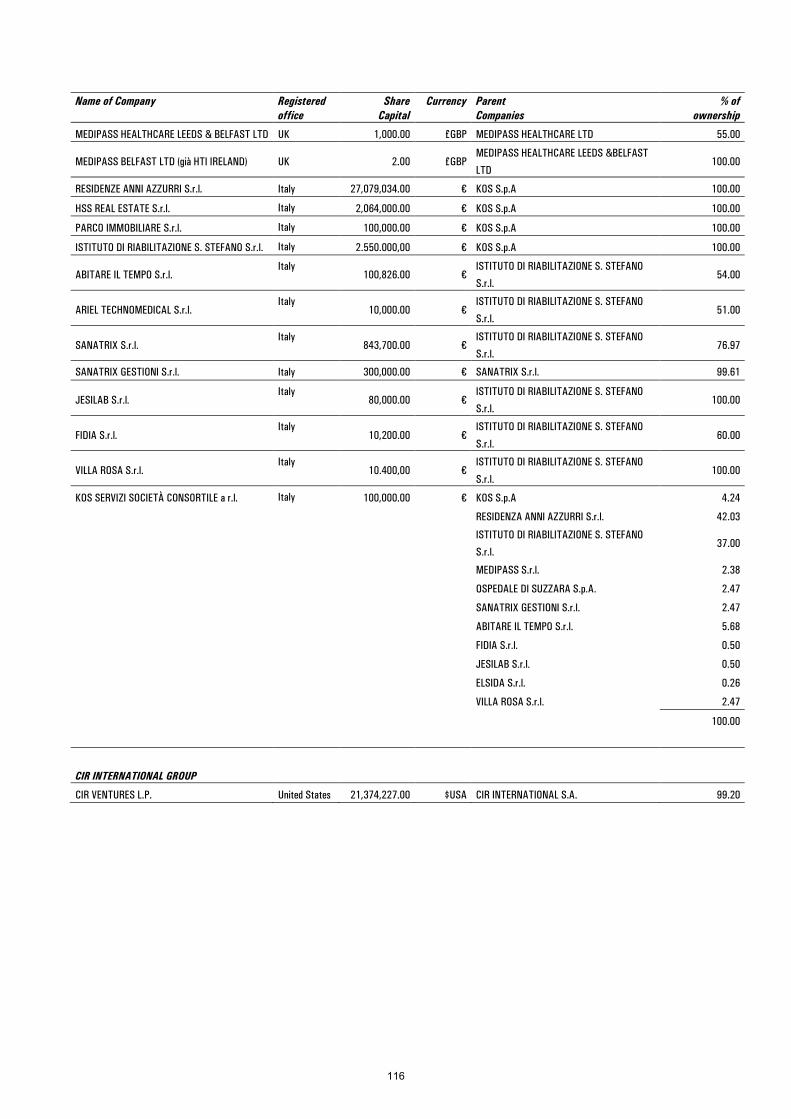
Name of Company Registered
office Share
Capital Currency Parent
Companies % of
ownership
MEDIPASS HEALTHCARE LEEDS & BELFAST LTD UK 1,000.00 £GBP MEDIPASS HEALTHCARE LTD 55.00
MEDIPASS BELFAST LTD (già HTI IRELAND) UK 2.00 £GBP MEDIPASS HEALTHCARE LEEDS &BELFAST
LTD 100.00
RESIDENZE ANNI AZZURRI S.r.l. Italy 27,079,034.00 € KOS S.p.A 100.00
HSS REAL ESTATE S.r.l. Italy 2,064,000.00 € KOS S.p.A 100.00
PARCO IMMOBILIARE S.r.l. Italy 100,000.00 € KOS S.p.A 100.00
ISTITUTO DI RIABILITAZIONE S. STEFANO S.r.l. Italy 2.550.000,00 € KOS S.p.A 100.00
ABITARE IL TEMPO S.r.l. Italy
100,826.00 € ISTITUTO DI RIABILITAZIONE S. STEFANO
S.r.l. 54.00
ARIEL TECHNOMEDICAL S.r.l. Italy
10,000.00 € ISTITUTO DI RIABILITAZIONE S. STEFANO
S.r.l. 51.00
SANATRIX S.r.l. Italy
843,700.00 € ISTITUTO DI RIABILITAZIONE S. STEFANO
S.r.l. 76.97
SANATRIX GESTIONI S.r.l. Italy 300,000.00 € SANATRIX S.r.l. 99.61
JESILAB S.r.l. Italy
80,000.00 € ISTITUTO DI RIABILITAZIONE S. STEFANO
S.r.l. 100.00
FIDIA S.r.l. Italy
10,200.00 € ISTITUTO DI RIABILITAZIONE S. STEFANO
S.r.l. 60.00
VILLA ROSA S.r.l. Italy
10.400,00 € ISTITUTO DI RIABILITAZIONE S. STEFANO
S.r.l. 100.00
KOS SERVIZI SOCIETÀ CONSORTILE a r.l. Italy 100,000.00 € KOS S.p.A 4.24
RESIDENZA ANNI AZZURRI S.r.l. 42.03
ISTITUTO DI RIABILITAZIONE S. STEFANO
S.r.l. 37.00
MEDIPASS S.r.l. 2.38
OSPEDALE DI SUZZARA S.p.A. 2.47
SANATRIX GESTIONI S.r.l. 2.47
ABITARE IL TEMPO S.r.l. 5.68
FIDIA S.r.l. 0.50
JESILAB S.r.l. 0.50
ELSIDA S.r.l. 0.26
VILLA ROSA S.r.l. 2.47
100.00
CIR INTERNATIONAL GROUP
CIR VENTURES L.P. United States 21,374,227.00 $USA CIR INTERNATIONAL S.A. 99.20
116

INVESTMENTS IN JOINT VENTURES AND ASSOCIATES CONSOLIDATED USING THE EQUITY METHOD
(in euro or currency) Name of Company Registered
office Share
Capital Currency Parent
Companies % of
ownership
CIR GROUP DEVIL PEAK S.r.l. Italy 65,990.00 € NEXENTI S.r.l. 38.17
SORGENIA GROUP
TIRRENO POWER S.p.A. Italy 91,130,000.00 € ENERGIA ITALIANA S.p.A. 50.00
GICA S.A. Switzerland 4,000,000.00 Chf SORGENIA S.p.A. 25.00
TECNOPARCO VALBASENTO S.p.A. Italy 945,000.00 € SORGENIA S.p.A. 30.00
FIN GAS S.r.l. Italy 10,000.00 € SORGENIA S.p.A. 50.00
LNG MED GAS TERMINAL S.r.l. Italy 27,440,655.00 € FIN GAS S.r.l 70.00
SORGENIA FRANCE PRODUCTION S.a.s. France 10,602,360.00 € SORGENIA FRANCE S.a.s. 50.00
PARC ÉOLIEN DE LA VOIE SACRÉE S.a.s. France 74,000.00 € SORGENIA FRANCE PRODUCTION S.a.s.. 24.86
PARC ÉOLIEN D’EPENSE S.a.s. France 802,000.00 € SORGENIA FRANCE PRODUCTION S.a.s. 25.00
SAPONIS INVESTMENTS SP ZOO Poland 532,500.00 Zt (PLN) LISI B.V. (Già SORGENIA POLAND B.V.) 26.76
VOLTERRA A.E. Greece 3,609,402.00 € SORGENIA GREEN S.r.l. 50.00
SOCIÉTÉ FRANÇAISE DES ALIZÉS S.a.r.l. France 580,125.00 € SORGENIA FRANCE PRODUCTION S.a.s. 100.00
PARC ÉOLIEN DE SAINT CRÉPIN S.a.s. France 1,657,000.00 € SORGENIA FRANCE PRODUCTION S.a.s. 100.00
PARC ÉOLIEN DE L’ARGONNE S.a.s. France 2,179,000.00 € SORGENIA FRANCE PRODUCTION S.a.s. 100.00
PARC ÉOLIEN DE CÔTE DE CHAMPAGNE SUD S.a.s. France 120,300.00 € SORGENIA FRANCE PRODUCTION S.a.s. 100.00
PARC ÉOLIEN DE CÔTE DE CHAMPAGNE S.a.s. France 871,600.00 € SORGENIA FRANCE PRODUCTION S.a.s. 100.00
PARC ÉOLIEN DE BERNAY ST MARTIN S.a.s. France 1,493,700.00 € SORGENIA FRANCE PRODUCTION S.a.s. 100.00
HOLDING DES PARCS ÉOLIENS DE LA VOIE SACRÉE
S.a.s. France 9,757,000.00 € SORGENIA FRANCE PRODUCTION S.a.s.. 100.00
PARC ÉOLIEN DE LONGEVILLE SUR MER S.a.s. France 37,000.00 € SORGENIA FRANCE PRODUCTION S.a.s. 100.00
PARC ÉOLIEN DE L’ORME CHAMPAGNE S.a.s. France 37,000.00 € SORGENIA FRANCE PRODUCTION S.a.s. 100.00
PARC ÉOLIENS DU NORD PAS-DE-CALAIS S.a.s. France 400,000.00 € SORGENIA FRANCE PRODUCTION S.a.s. 100.00
PARC ÉOLIEN DE BOUILLANCOURT EN SÉRY S.a.s. France 53,700.00 € SORGENIA FRANCE PRODUCTION S.a.s. 100.00
PARC ÉOLIEN DE LEFFINCOURT S.a.s. France 4,537,000.00 € SORGENIA FRANCE PRODUCTION S.a.s. 100.00
PARC D’AULNAY L’AÎTRE S.a.s. France 37,000.00 € SORGENIA FRANCE PRODUCTION S.a.s. 100.00
PARC ÉOLIEN DE BUSSY LE REPOS S.a.s. France 10,000.00 € SORGENIA FRANCE PRODUCTION S.a.s. 100.00
PARC ÉOLIEN DE LA TIERACHE S.a.s. France 10,000.00 € SORGENIA FRANCE PRODUCTION S.a.s. 100.00
PARC ÉOLIEN DE PLAINCHAMP S.a.s. France 3,037,000.00 € SORGENIA FRANCE PRODUCTION S.a.s. 100.00
PARC ÉOLIEN DE BLOMBAY L’ECHELLE S.a.s. France 5,000.00 € SORGENIA FRANCE PRODUCTION S.a.s. 100.00
PARC ÉOLIEN DE LA VALLE DU DON S.a.s. France 5,000.00 € SORGENIA FRANCE PRODUCTION S.a.s. 100.00
PARC ÉOLIEN DE SOURCE DE L’HERBISSONNE S.a.s. France 10,000.00 € SORGENIA FRANCE PRODUCTION S.a.s. 100.00
PARC ÉOLIEN DE SEUIL MONT LAURENT S.a.s. France 10,000.00 € SORGENIA FRANCE PRODUCTION S.a.s.. 100.00
PARC ÉOLIEN DE MAURECHAMPS S.a.s.
France
1,117,000.00 € HOLDING DES PARCS ÉOLIENS
DE LA VOIE SACRÉE S.a.s. 100.00
PARC ÉOLIEN DE RAIVAL S.a.s. France
1,117,000.00 € HOLDING DES PARCS ÉOLIENS DE LA VOIE SACRÉE S.a.s. 100.00
PARC ÉOLIEN DE LA VALETTE S.a.s. France
1,117,000.00 € HOLDING DES PARCS ÉOLIENS DE LA VOIE SACRÉE S.a.s. 100.00
PARC ÉOLIEN DE VILLER S.a.s. France
577,000.00 € HOLDING DES PARCS ÉOLIENS DE LA VOIE SACRÉE S.a.s. 100.00
TIRRENO SOLAR S.r.l. Italy 100,000.00 € TIRRENO POWER S.p.A. 100.00
ILIOFANIA A.E. Greece 300,000.00 € VOLTERRA A.E. 100.00
117
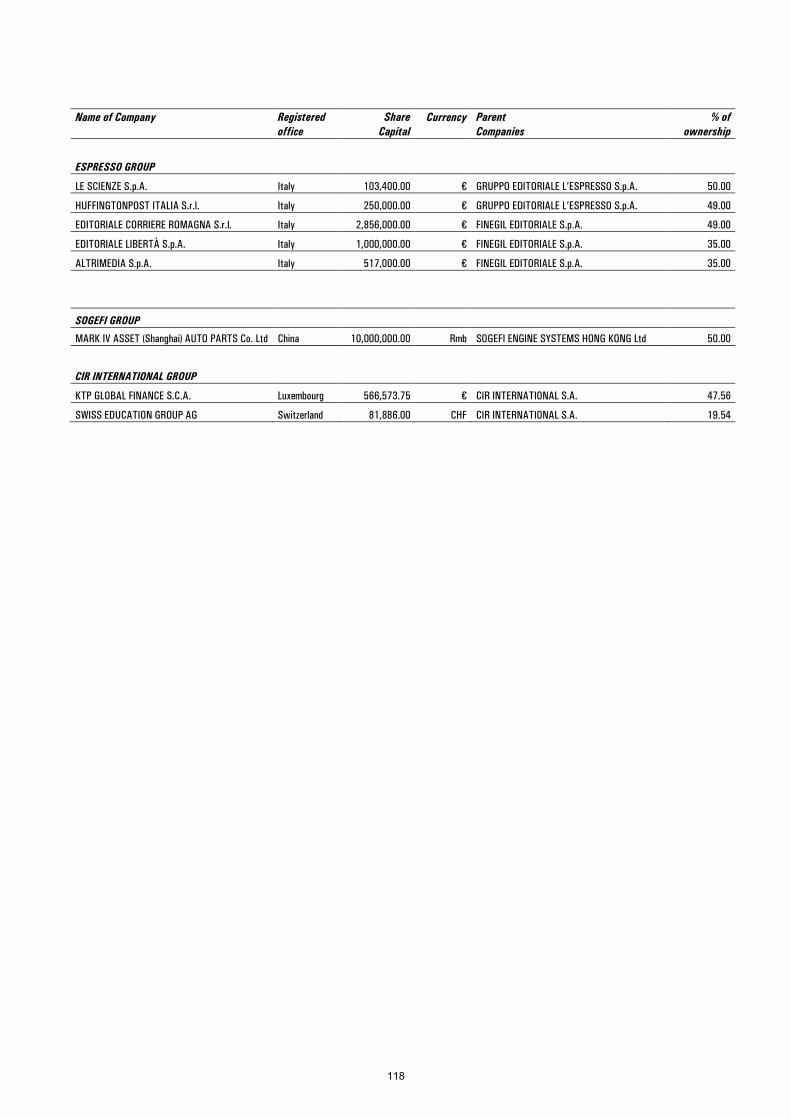
Name of Company Registered
office Share
Capital Currency Parent
Companies % of
ownership
ESPRESSO GROUP
LE SCIENZE S.p.A. Italy 103,400.00 € GRUPPO EDITORIALE L’ESPRESSO S.p.A. 50.00
HUFFINGTONPOST ITALIA S.r.l. Italy 250,000.00 € GRUPPO EDITORIALE L’ESPRESSO S.p.A. 49.00
EDITORIALE CORRIERE ROMAGNA S.r.l. Italy 2,856,000.00 € FINEGIL EDITORIALE S.p.A. 49.00
EDITORIALE LIBERTÀ S.p.A. Italy 1,000,000.00 € FINEGIL EDITORIALE S.p.A. 35.00
ALTRIMEDIA S.p.A. Italy 517,000.00 € FINEGIL EDITORIALE S.p.A. 35.00
SOGEFI GROUP
MARK IV ASSET (Shanghai) AUTO PARTS Co. Ltd China 10,000,000.00 Rmb SOGEFI ENGINE SYSTEMS HONG KONG Ltd 50.00
CIR INTERNATIONAL GROUP
KTP GLOBAL FINANCE S.C.A. Luxembourg 566,573.75 € CIR INTERNATIONAL S.A. 47.56
SWISS EDUCATION GROUP AG Switzerland 81,886.00 CHF CIR INTERNATIONAL S.A. 19.54
118
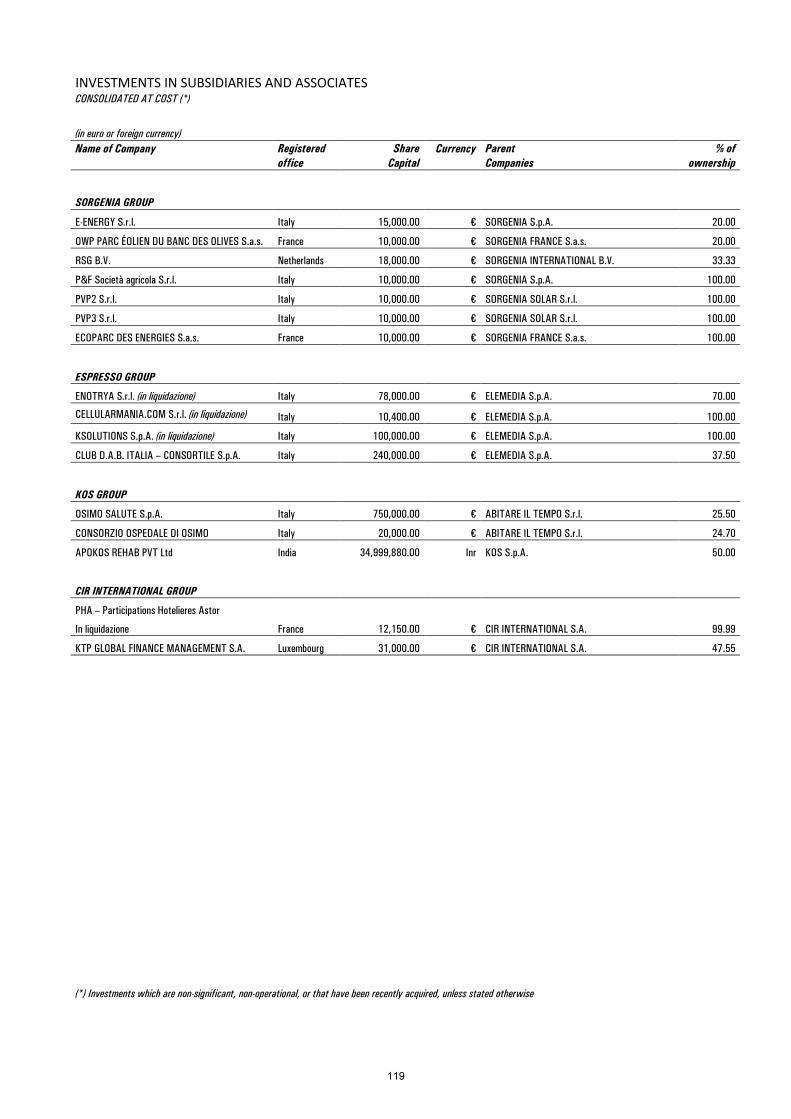
INVESTMENTS IN SUBSIDIARIES AND ASSOCIATES CONSOLIDATED AT COST (*)
(in euro or foreign currency) Name of Company Registered
office Share
Capital Currency Parent
Companies % of
ownership
SORGENIA GROUP
E-ENERGY S.r.l. Italy 15,000.00 € SORGENIA S.p.A. 20.00
OWP PARC ÉOLIEN DU BANC DES OLIVES S.a.s. France 10,000.00 € SORGENIA FRANCE S.a.s. 20.00
RSG B.V. Netherlands 18,000.00 € SORGENIA INTERNATIONAL B.V. 33.33
P&F Società agricola S.r.l. Italy 10,000.00 € SORGENIA S.p.A. 100.00
PVP2 S.r.l. Italy 10,000.00 € SORGENIA SOLAR S.r.l. 100.00
PVP3 S.r.l. Italy 10,000.00 € SORGENIA SOLAR S.r.l. 100.00
ECOPARC DES ENERGIES S.a.s. France 10,000.00 € SORGENIA FRANCE S.a.s. 100.00
ESPRESSO GROUP
ENOTRYA S.r.l. (in liquidazione) Italy 78,000.00 € ELEMEDIA S.p.A. 70.00
CELLULARMANIA.COM S.r.l. (in liquidazione) Italy 10,400.00 € ELEMEDIA S.p.A. 100.00
KSOLUTIONS S.p.A. (in liquidazione) Italy 100,000.00 € ELEMEDIA S.p.A. 100.00
CLUB D.A.B. ITALIA – CONSORTILE S.p.A. Italy 240,000.00 € ELEMEDIA S.p.A. 37.50
KOS GROUP
OSIMO SALUTE S.p.A. Italy 750,000.00 € ABITARE IL TEMPO S.r.l. 25.50
CONSORZIO OSPEDALE DI OSIMO Italy 20,000.00 € ABITARE IL TEMPO S.r.l. 24.70
APOKOS REHAB PVT Ltd India 34,999,880.00 Inr KOS S.p.A. 50.00
CIR INTERNATIONAL GROUP
PHA – Participations Hotelieres Astor
In liquidazione France 12,150.00 € CIR INTERNATIONAL S.A. 99.99
KTP GLOBAL FINANCE MANAGEMENT S.A. Luxembourg 31,000.00 € CIR INTERNATIONAL S.A. 47.55
(*) Investments which are non-significant, non-operational, or that have been recently acquired, unless stated otherwise
119
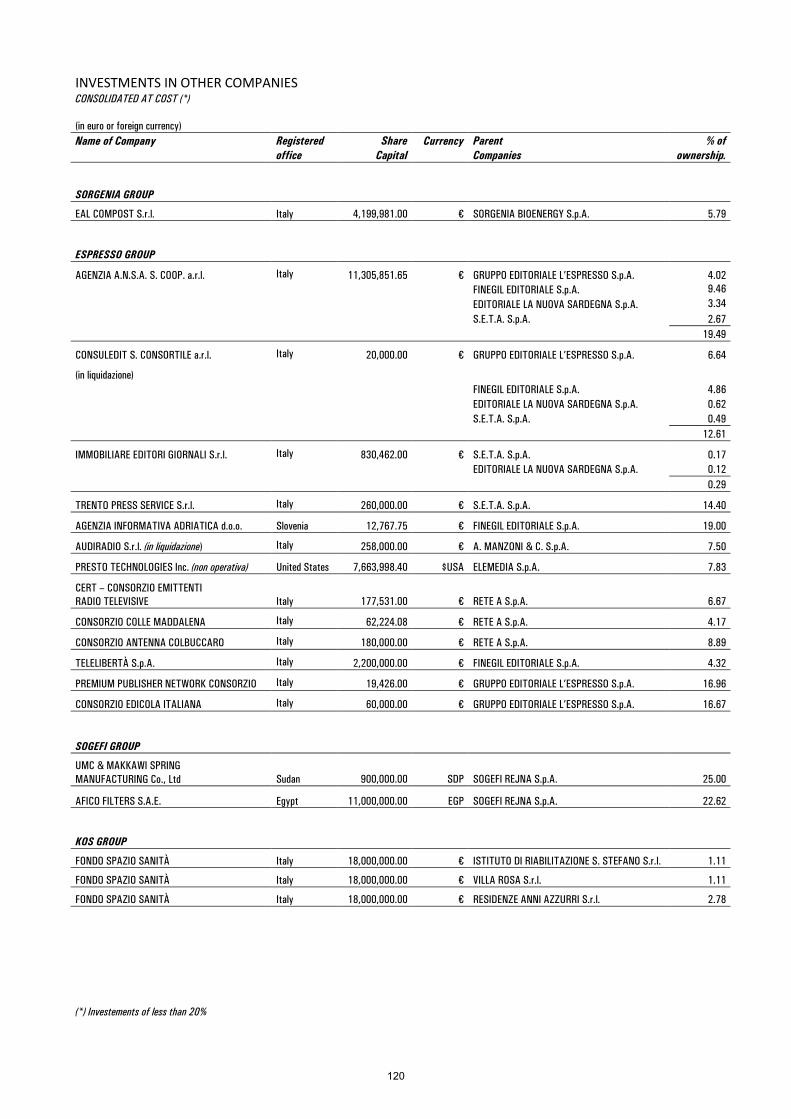
INVESTMENTS IN OTHER COMPANIES CONSOLIDATED AT COST (*) (in euro or foreign currency) Name of Company Registered
office Share
Capital Currency Parent
Companies % of
ownership.
SORGENIA GROUP
EAL COMPOST S.r.l. Italy 4,199,981.00 € SORGENIA BIOENERGY S.p.A. 5.79
ESPRESSO GROUP
AGENZIA A.N.S.A. S. COOP. a.r.l. Italy 11,305,851.65 € GRUPPO EDITORIALE L’ESPRESSO S.p.A. 4.02 FINEGIL EDITORIALE S.p.A. 9.46 EDITORIALE LA NUOVA SARDEGNA S.p.A. 3.34 S.E.T.A. S.p.A. 2.67 19.49
CONSULEDIT S. CONSORTILE a.r.l.
(in liquidazione)
Italy 20,000.00 € GRUPPO EDITORIALE L’ESPRESSO S.p.A. 6.64
FINEGIL EDITORIALE S.p.A. 4.86 EDITORIALE LA NUOVA SARDEGNA S.p.A. 0.62 S.E.T.A. S.p.A. 0.49 12.61
IMMOBILIARE EDITORI GIORNALI S.r.l. Italy 830,462.00 € S.E.T.A. S.p.A. 0.17 EDITORIALE LA NUOVA SARDEGNA S.p.A. 0.12 0.29
TRENTO PRESS SERVICE S.r.l. Italy 260,000.00 € S.E.T.A. S.p.A. 14.40
AGENZIA INFORMATIVA ADRIATICA d.o.o. Slovenia 12,767.75 € FINEGIL EDITORIALE S.p.A. 19.00
AUDIRADIO S.r.l. (in liquidazione) Italy 258,000.00 € A. MANZONI & C. S.p.A. 7.50
PRESTO TECHNOLOGIES Inc. (non operativa) United States 7,663,998.40 $USA ELEMEDIA S.p.A. 7.83
CERT – CONSORZIO EMITTENTI RADIO TELEVISIVE Italy 177,531.00 € RETE A S.p.A. 6.67
CONSORZIO COLLE MADDALENA Italy 62,224.08 € RETE A S.p.A. 4.17
CONSORZIO ANTENNA COLBUCCARO Italy 180,000.00 € RETE A S.p.A. 8.89
TELELIBERTÀ S.p.A. Italy 2,200,000.00 € FINEGIL EDITORIALE S.p.A. 4.32
PREMIUM PUBLISHER NETWORK CONSORZIO Italy 19,426.00 € GRUPPO EDITORIALE L’ESPRESSO S.p.A. 16.96
CONSORZIO EDICOLA ITALIANA Italy 60,000.00 € GRUPPO EDITORIALE L’ESPRESSO S.p.A. 16.67
SOGEFI GROUP
UMC & MAKKAWI SPRING MANUFACTURING Co., Ltd Sudan 900,000.00 SDP SOGEFI REJNA S.p.A. 25.00
AFICO FILTERS S.A.E. Egypt 11,000,000.00 EGP SOGEFI REJNA S.p.A. 22.62
KOS GROUP
FONDO SPAZIO SANITÀ Italy 18,000,000.00 € ISTITUTO DI RIABILITAZIONE S. STEFANO S.r.l. 1.11
FONDO SPAZIO SANITÀ Italy 18,000,000.00 € VILLA ROSA S.r.l. 1.11
FONDO SPAZIO SANITÀ Italy 18,000,000.00 € RESIDENZE ANNI AZZURRI S.r.l. 2.78
(*) Investements of less than 20%
120
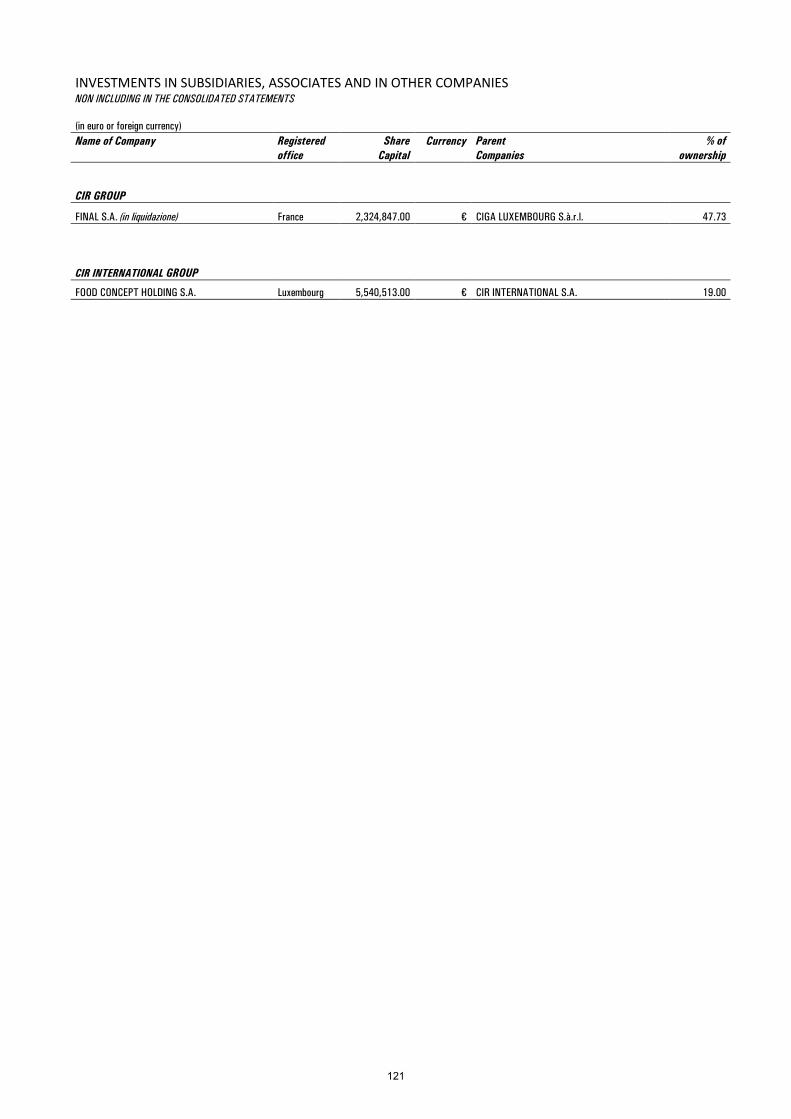
INVESTMENTS IN SUBSIDIARIES, ASSOCIATES AND IN OTHER COMPANIES NON INCLUDING IN THE CONSOLIDATED STATEMENTS (in euro or foreign currency) Name of Company Registered
office Share
Capital Currency Parent
Companies % of
ownership
CIR GROUP
FINAL S.A. (in liquidazione) France 2,324,847.00 € CIGA LUXEMBOURG S.à.r.l. 47.73
CIR INTERNATIONAL GROUP
FOOD CONCEPT HOLDING S.A. Luxembourg 5,540,513.00 € CIR INTERNATIONAL S.A. 19.00
121

REPORT OF THE INDIPENDENT AUDITORS
122

123
124124
125125