SEMI-ANNUAL INTERIM FINANCIAL REPORTAT JUNE 30 2012
115
SEMI-ANNUAL INTERIM FINANCIAL REPORT AT JUNE 30 2012
-
Upload
archivio-documenti -
Category
Documents
-
view
218 -
download
2
description
SEMI-ANNUAL INTERIM FINANCIAL REPORT AT JUNE 30 2012
Transcript of SEMI-ANNUAL INTERIM FINANCIAL REPORTAT JUNE 30 2012

SEMI-ANNUAL INTERIM FINANCIAL REPORT AT JUNE 30 2012

CONTENTS
ADMINISTRATIVE BODIES ...................................................................................................................................... 2
SEMI ANNUAL INTERIM FINANCIAL REPORT INTERIM REPORT ON OPERATIONS ................................................................................................................... 3
1. PERFORMANCE OF THE GROUP ................................................................................................................................ 7
2. PERFORMANCE OF THE PARENT COMPANY…………. ................................................................................................ 10
3. CHART RECONCILING THE BALANCE SHEET FIGURES OF THE PARENT COMPANY WITH THOSE
OF THE CONSOLIDATED FINANCIAL STATEMENTS ................................................................................................ 12
4. PERFORMANCE OF THE BUSINESS SECTORS………………….. .................................................................................... 14
5. NON-CORE INVESTMENTS ........................................................................................................................................ 20
6. SIGNIFICANT EVENTS WHICH OCCURRED AFTER JUNE 30 2012 ............................................................................ 21
7. BUSINESS OUTLOOK ................................................................................................................................................ 21
8. MAIN RISKS AND UNCERTAINTIES TO WHICH THE GROUP IS EXPOSED ................................................................ 21
9. OTHER INFORMATION .............................................................................................................................................. 22
CONDENSED CONSOLIDATED SEMI-ANNUAL FINANCIAL STATEMENTS 1. STATEMENTS OF FINANCIAL POSITION ................................................................................................................... 24
2. INCOME STATEMENT ............................................................................................................................................... 25
3. STATEMENT OF COMPREHENSIVE INCOME ............................................................................................................. 26
4. STATEMENT OF CASH FLOW .................................................................................................................................... 27
5. STATEMENT OF CHANGES IN EQUITY ...................................................................................................................... 28
6. EXPLANATORY NOTES .............................................................................................................................................. 29
CERTIFICATION OF THE SEMI–ANNUAL INTERIM FINANCIAL REPORT AS OF JUNE 30 2012 AS PER ART. 154-BIS OF D.LGS. 58/98 ............................................................................................................................ 93 LIST OF EQUITY INVESTMENTS AT JUNE 30 2012 ..................................................................................................... 95 FINANCIAL STATEMENTS OF THE PARENT COMPANY AS OF JUNE 30 2012 ................................................ 105
REPORTS OF THE INDEPENDENT AUDITORS ............................................................................................................................ 112
This Semi-annual Interim Financial Report as of June 30 2012 was prepared in accordance with Art. 154 ter of D. Lgs. 58/1998 and in conformity with applicable international accounting standards recognized in the European Union as per EU Regulation no. 1606/2002 of the European Parliament and Council of July 19 2002, and specifically with IAS 34 –Interim Financial Reporting, and also with the measures issued in implementation of Art. 9 of D. Lgs no. 38/2005.
This Semi-annual Interim Financial Report has been translated into English language solely for the convenience of international readers. In the event of any ambiguity the Italian text will prevail.

COMPAGNIE INDUSTRIALI RIUNITE
Limited-liability corporation - Share capital € 396,670,233.50 - Registered Office: Via Ciovassino, 1 – 201291 Milan - www.cirgroup.it
R.E.A. n. 1950112 – Milan Company Register / Fiscal Code / VAT no. 00519120018 Company subject to management and coordination by COFIDE – Gruppo De Benedetti S.p.A.
Office in Rome: Via del Tritone, 169 – 00187 Rome – Tel. +39 06 692055.1

BOARD OF DIRECTORS
Honorary Chairman CARLO DE BENEDETTI and Director Chairman STEFANO MICOSSI (1) Chief Executive Officer RODOLFO DE BENEDETTI (2) and General Manager Directors MARISTELLA BOTTICINI (4) GIAMPIO BRACCHI (3) (4) FRANCO DEBENEDETTI SILVIA GIANNINI (4) FRANCO GIRARD MICHAEL PISTAUER (5) CLAUDIO RECCHI (3) DOMINIQUE SENEQUIER (5) GUIDO TABELLINI (3) (5) (6) Secretary to the Board MASSIMO SEGRE
BOARD OF STATUTORY AUDITORS Chairman PIETRO MANZONETTO Statutory Auditors LUIGI NANI RICCARDO ZINGALES Alternate Auditors RAFFAELE CATARINELLA LUCA VALDAMERI LUIGI MACCHIORLATTI VIGNAT
INDIPENDENT AUDITORS
DELOITTE & TOUCHE S.p.A.
Notice in accordance with the recommendations of Consob contained in its Communiqué no.DAC/RM/97001574 of February 20 1997: (1) Legal Representative (2) Power to sign with single signature all documents relating to ordinary
And extraordinary administration except for those reserved by law to the Board of Directors
(3) Member of the Compensation Committee (4) Member of the Internal Control Committee (5) Member of the Appointments Committee (6) Lead Independent Director

INTERIM REPORT ON OPERATIONS
The CIR Group reported consolidated net income of € 0.7 million in the first half of 2012, compared to € 19.4 million in the same period of last year. During the first half of the year, the four main operating subsidiaries made a negative contribution of € 4.7 million, compared with a positive contribution of € 29.5 million in the same period of 2011. The reduction of € 34.2 million was mainly due to the deterioration of the results of the Sorgenia Group. The result of CIR and the financial holding companies was a positive € 8.8 million (compared to a negative figure of € 1.7 million in the first half of 2011), having benefited from a recovery in the value of the securities portfolio compared to the end of 2011. During the first half of 2012, the fair value adjustment was positive overall for around € 8 million, with a positive impact of equity investments for € 3.3 million and structured securities for € 5.8 million and a negative impact of bonds for € 1.1 million (essentially due to the technical effect of the purchase of these securities above par and against financial income on the same securities of € 7.4 million). Moreover, during the first six months income of € 4.2 million was generated on private equity investments. In the first half of 2012, the CIR Group reported revenues of € 2,406.9 million, up by 9.1% (€ 2,205.6 million in the same period of 2011) and EBITDA of € 175.8 million which was down by 22.3% from the figure of € 226.3 million for the first six months of last year, due to the decline in the profitability of the Sorgenia Group.
Semi-annual Interim Financial Report 2012 3

The CIR Group comprises the following business sectors: energy (electricity and gas), media (publishing, radio, television and internet), automotive components (engine systems and suspension components) and healthcare (nursing homes, rehabilitation centres and hi-tech services) together with activities linked to non-core investments (private equity/minority shareholdings, venture capital and other investments). In the energy sector, the Sorgenia Group reported revenues of € 1,119.3 million, posting a rise of 7.3% on the € 1,043.1 million for the first half of 2011, and adjusted EBITDA of € 33.6 million, down 56.8% from € 77.7 million in the same period in 2011. The results are in line with the slowing trend in the Italian electricity sector in view of the deep recession and the high gas costs for the thermoelectric power plants. The net result was a loss of € 54.1 million (affected by writedowns of € 13 million mainly relating to unsuccessful exploration activities) which compares with a substantial breakeven in the first half of 2011. To counter the recession and the market difficulties, Sorgenia has already taken a series of actions, the benefits of which should be seen between the end of 2012 and 2013. In the media sector, in an economic environment characterized by a period of severe recession and great uncertainty about future prospects, in the first half of 2012 the Espresso group reported revenues of € 419.8 million, down 8.2% on the first six months of 2011, due to the contraction in advertising revenues as a result of the market trend and to the performance of add-on products, which had been extraordinarily favourable in the first half of 2011. The operating result came in at € 42.1 million (€ 63 million in the first six months of 2011) and net income was € 21.2 million compared to € 31.5 million in the first half of 2011. During the first half of 2012, despite the difficulties experienced by the car industry in the main market in which it operates, i.e. Europe, the Sogefi Group achieved an increase in revenues and profitability thanks to the contribution of the businesses of Systèmes Moteurs, acquired during the second half of 2011. Revenues rose by 30.4% to € 686.8 million, EBITDA came to € 68.1 million (+ 28.9%) and net income was € 16.1 million (+ 4.8%). For the first half of 2012 the KOS Group posted consolidated revenues of € 178.7 million (+1%) and EBITDA of € 25 million, compared to € 27.5 million in the first half of 2011. Net income came in at € 4.6 million compared to € 6.2 million in the same period of 2011. It should be remembered that, after the Milan Court of Appeal ruling on 9 July 2011 which ordered Fininvest to pay compensation for damages resulting from bribery of a judge in the “Lodo Mondadori” case, on 26 July 2011 CIR received € 564.2 million from Fininvest, including legal costs and interest. As envisaged by international accounting standards (IAS 37), this amount has had no effect, nor will it have any effect, on the income statement of the group until the highest level of justice has been reached. The higher amount of liquidity available, offset in the statement of financial position by a borrowing of the same amount, will have no effect on the Group’s financial management strategy, based on prudent and discerning criteria, in a particularly complex financial market scenario. The amount has been invested in the short term (deposits and monetary funds through CIR S.p.A.) and in the medium term (mainly corporate bonds through the wholly-owned subsidiary Cir Investimenti S.p.A. - formerly Dry Products). Income from these investments was essentially in line with the legal interest which provision was made for. Apart from a breakdown by business sector of the economic and financial results of the Group, the charts on the following pages also provide a breakdown of the contribution of the main subsidiaries and the aggregate results of the holding company CIR and its financial holding/companies subsidiaries ("Financial holdings").
Semi-annual Interim Financial Report 2012 4

INCOME STATEMENT BY BUSINESS SECTOR AND CONTRIBUTIONS TO GROUP RESULTS
(in millions of euro) 1st Half 2011
CONSOLIDATED Revenues Cost of Other operating Adjustments to Amortisation, EBIT Net financial Dividends, Income Net income Net Income Net Incomeproduction income and costs the value of depraciation income gains and taxes minority interests of the of the
investments & write-downs and losses from Group Groupconsolidated expense trading and
at valuingequity securities
AGGREGATE (1) (2) (3) (4)Sorgenia Group 1,119.3 (1,058.8) (24.5) (3.9) (60.2) (28.1) (38.4) (0.7) 12.4 26.6 (28.2) 0.1 Espresso Group 419.8 (358.4) (1.1) 0.5 (18.7) 42.1 (5.9) 0.1 (15.1) (9.4) 11.8 17.3 Sogefi Group 686.8 (609.2) (9.5) -- (31.4) 36.7 (8.4) -- (10.5) (8.4) 9.4 8.8 Kos Group 178.7 (148.4) (6.5) -- (8.6) 15.2 (4.4) -- (6.0) (2.5) 2.3 3.3
Total main subsidiaries 2,404.6 (2,174.8) (41.6) (3.4) (118.9) 65.9 (57.1) (0.6) (19.2) 6.3 (4.7) 29.5
Other subsidiaries 2.3 (10.4) 6.6 -- (0.9) (2.4) (0.8) -- -- 0.6 (2.6) (3.0)
Total subsidiaries 2,406.9 (2,185.2) (35.0) (3.4) (119.8) 63.5 (57.9) (0.6) (19.2) 6.9 (7.3) 26.5
CIR and financial holding companies
Revenues -- -- -- -- Operating costs (8.0) -- (8.0) (9.4)Other operating income and costs 2.0 -- 2.0 2.3
1st Half 2012
Adjustments to the value of investments
consolidated at equity (0.5) -- (0.5) -- Amortisation, depreciation & write-downs (0.4) -- (0.4) (0.4)EBIT (6.9)Net financial income and expense (2.9) -- (2.9) (6.9)Dividends, gains and losses from trading securities 16.1 -- 16.1 10.2 Income taxes 2.5 -- 2.5 2.5
Total CIR and financial holding companies before non-recurring items -- (8.0) 2.0 (0.5) (0.4) (6.9) (2.9) 16.1 2.5 -- 8.8 (1.7)
Non-recurring items (5) -- (0.4) (0.6) -- -- (1.0) -- -- 0.2 - (0.8) (5.4)
Total consolidated of the Group 2,406.9 (2,193.6) (33.6) (3.9) (120.2) 55.6 (60.8) 15.5 (16.5) 6.9 0.7 19.4
(3) This item is the sum of “financial income” and “financial expense” in the consolidated income statement.
(5) This item is mainly related to legal expenses
(1) This item is the sum of “changes in inventories”, “costs for the purchase of goods”, “costs for services” and “personnel costs” in the consolidated income statement.This item does not consider the € (4,2) million effect of intercompany netting.(2) This item is the sum of “other operating income” and “other operating costs” in the consolidated income statement. This item does not consider the € 4,2 million effect of intercompany netting.
(4) This item is the sum of “dividends”, “gains from trading securities”, “losses from trading securities” and “adjustments to the value of financial assets” in the consolidated income statement.
Semi-annual Interim Financial Report 2012 5

CONSOLIDATED STATEMENT OF FINANCIAL POSITION BY BUSINESS SECTOR
(in millions of euro)31.12.201130.06.2012
CONSOLIDATED Fixed assets Other net non- Net Net Total Minority Group Groupcurrent assets working capital financial position equity of wich: interests equity equity equityand liabilities (continuing operation)
AGGREGATE (1) (2) (3) (4)Sorgenia Group 2,456.3 311.6 254.0 (1,936.7) (*) 1,085.2 546.4 538.8 577.5
E G 847 1 (192 5) 54 4 (147 1) 561 9 249 8 312 1 312 7 Espresso Group 847.1 (192.5) 54.4 (147.1) 561.9 249.8 312.1 312.7
Sogefi Group 486.6 (20.1) 51.3 (307.6) 210.2 98.4 111.8 113.3
Kos Group 385.9 (23.2) 17.6 (151.7) 228.6 113.1 115.5 111.2
Other subsdiaries 14.1 25.1 6.5 (34.0) 11.7 1.7 10.0 13.6
Total subsidiaries 4,190.0 100.9 383.8 (2,577.1) 2,097.6 1,009.4 1,088.2 1,128.3 , ( , ) , , , ,
CIR and financial holding companies
Fixed assets 139.9 139.9 -- 139.9 144.5
Other net non-current assets and liabilities 192.3 192.3 192.3 173.7
Net working capital (28.4) (28.4) -- (28.4) (19.6)
Net financial position 25.6 25.6 -- 25.6 10.8
Total consolidated of the Group 4,329.9 293.2 355.4 (2,551.5) 2,427.0 1,009.4 1,417.6 1,437.7
(*) The financial position includes cash and cash equivalents of Sorgenia Holding S.p.A.
(1) This item is the algebraic sum of “intangible assets”, “tangible assets”, “investment property”, “investments in companies consolidated at equity” and “other equity investments” in the consolidated statement of financial position.(2) This item is the algebraic sum of “other receivables", "securities" and "deferred taxes" under non-current assets and of "other payables", "deferred taxes", "personnel provisions" and "provisions for risks and losses" under non-current liabilities in the consolidated statement of financial position. This item also includes "Available for sale financial assets" and "Available for sale financial liabilities" in the consolidated statement of financial position.
(**) Certain amounts of the period ended 2011 were redetermined after the conclusion of the Purchase Price Allocation process of Systèmes Moteurs S.A.S
(3) This item is the algebraic sum of “inventories”, “contract work in progress”, “trade receivables” and “other receivables" under current assets, and of “trade payables”, “other payables” and “provisions for risks and losses” under current liabilities in the consolidated statement of financial position.
(4) This item is the algebraic sum of “financial receivables”, “securities”, “available-for-sale financial assets” and “cash and cash equivalents” under current assets, of “bond loans” and “other borrowings” under non-current liabilities, and of “bank overdrafts”, “bond loans” and “other borrowings” under current liabilities in the consolidated statement of financial position.
Semi-annual Interim Financial Report 2012 6

1. Performance of the Group Consolidated revenues for the first half of 2012 came in at € 2,406.9 million, compared to € 2,205.6 million in the corresponding period of 2011, posting a rise of € 201.3 million (+9.1%). Consolidated revenues can be broken down by business sector as follows: (in millions of euro) 1st Half 1st Half Change 2012 % 2011 % absolute %
Energy
Sorgenia Group 1,119.3 46.5 1,043.1 47.3 76.2 7.3
Media Espresso Group 419.8 17.4 457.4 20.7 (37.6) (8.2)
Automotive components
Sogefi Group 686.8 28.6 526.6 23.9 160.2 30.4
Healthcare
KOS Group 178.7 7.4 176.9 8.0 1.8 1.0
Other sectors 2.3 0.1 1.6 0.1 0.7 -
Total consolidated revenues 2,406.9 100.0 2,205.6 100.0 201.3 9.1
of which: ITALY 1,677.3 69.7 1,649.6 74.8 27.7 1.7
OTHER COUNTRIES 729.6 30.3 556.0 25.2 173.6 31.2
The key figures of the CIR Group consolidated income statement are as follows: (in millions of euro)
1st Half 2012
% 1st Half 2011
%
Revenues 2,406.9 100.0 2,205.6 100.0
Consolidated gross operating margin (EBITDA) (1) 175.8 7.3 226.3 10.3
Consolidated operating income (EBIT) 55.6 2.3 128.6 5.8
Financial management result (2) (45.3) (1.9) (52.3) (2.4)
Income taxes (16.5) (0.7) (30.1) (1.4)
Net income including minority interests (6.2) (0.3) 46.2 2.1
Net income – minority interests 6.9 0.3 (26.8) (1.2)
Net income of the Group 0.7 0.0 19.4 0.9
1) This balance is the sum of the items “earnings before interest and taxes (EBIT)” and “amortisation, depreciation and write-downs” in the consolidated
income statement 2) This balance is the sum of the items “financial income”, “financial expense”, “dividends”, “gains from trading securities”, “ losses from trading securities”
and “adjustments to the value of financial assets” in the consolidated income statement The consolidated gross operating margin (EBITDA) in the first half of 2012 was € 175.8 million (7.3% of revenues) compared to € 226.3 million in the first half of 2011 (10.3% of revenues), down by € 50.5 million (-22.3%). This change was essentially the result of the decline in the profitability of the Sorgenia Group.
Semi-annual Interim Financial Report 2012 7

The consolidated operating margin (EBIT) for the first half of 2012 was € 55.6 million (2.3% of revenues) compared to € 128.6 million (5.8% of revenues) in the same period of 2011 (-56.8%). The net result of financial management was a negative € 45.3 million (a negative € 52.3 million in the first six months of 2011), which was the result of the following factors:
- net financial expense of € 60.8 million (€ 62.4 in the first half of 2011); - dividends and net income from trading and valuing securities of € 15.5 million (a positive fig-
ure of € 10.1 million in the first half of 2011). The key figures of the consolidated statement of financial position of the CIR Group at 30 June 2012, compared with the same figures at 31 December 2011, are as follows: (in millions of euro) (1) 30.06.2012 31.12.2011 (*)
Fixed assets 4,329.9 4,333.8
Other net non-current assets and liabilities 293.2 209.3
Net working capital 355.4 271.0
Net invested capital 4,978.5 4,814.1
Net financial debt (2,551.5) (2,335.1)
Total equity 2,427.0 2,479.0
Group equity 1,417.6 1,437.7
Minority shareholders’ equity 1,009.4 1,041.3 (1) These figures are the result of a different organization of the financial statement items. For a definition of the same, reference should be made to the
notes referring to the chart “consolidated statement of financial position by business sector” shown earlier. (*) Certain 2011 values have been recalculated following the completion, by the Sogefi Group, of the Purchase Price Allocation process for Systèmes Mo-
teurs S.A.S. Net invested capital stood at € 4,978.5 million at 30 June 2012, compared to € 4,814.1 million at 31 December 2011, with a rise of € 164.4 million, due mainly to investments in fixed assets made by the Sorgenia group and to changes in working capital. The net financial position at 30 June 2012 showed net debt of € 2,551.5 million (compared to € 2,335.1 million at 31 December 2011) which was the result of the following:
- a net financial surplus for CIR and the financial holding companies of € 25.6 million, which compares with € 10.8 million at 31 December 2011. The increase is mainly due to the positive balance of € 6.6 million between dividends collected and paid out and the positive adjustment to the fair value of the securities portfolio, as already mentioned;
- total net debt of the operating groups of € 2,577.1 million compared to € 2,345.9 million at 31 December 2011. The change of € 231.2 million was due mainly to the investments in new production capacity and the higher working capital of the Sorgenia group.
The net financial position includes shares of hedge funds which amounted to € 84.3 million at 30 June 2012. The accounting treatment of these investments involves recognising changes in the fair value of the funds directly to equity.
Semi-annual Interim Financial Report 2012 8

The performance of these investments from their origin (April 1994) up to and including the whole of 2011 has given a weighted average return in dollar terms of 6.7%. In the first six months of 2012 performance was a positive 2.1%. Total equity stood at € 2,427 million at 30 June 2012, compared to € 2,479 million at 31 December 2011, with a reduction of € 52 million. The Group equity stood at € 1,417.6 million at 30 June 2012, down from € 1,437.7 million at 31 December 2011, with a net decrease of € 20.1 million, due essentially to the payment of dividends. Minority shareholders’ equity stood at € 1,009.4 million at 30 June 2012, down from € 1,041.3 million at 31 December 2011, with a net decrease of € 31.9 million. Changes in consolidated equity are reported in the explanatory Notes to the Financial Statements. The consolidated cash flow statement for the first half of 2012, prepared according to a “managerial” format which, unlike the format used in the statements attached, shows the changes in net financial position instead of the changes in cash and cash equivalents, can be broken down as follows:
(in millions of euro) 1st Half
2012 1st Half
2011
SOURCES OF FUNDING
Net income for the period including minority interests (6.2) 46.2 Amortization, depreciation, writedowns and other non-monetary changes 130.8 80.1
Self-financing 124.6 126.3
Change in working capital (108.5) (76.8)
CASH FLOW GENERATED BY OPERATIONS 16.1 49.5
Capital increases 18.1 27.6
Liabilities associated with assets held for disposal - 121.8
TOTAL SOURCES 34.2 198.9
USES OF FUNDING Net investments in fixed assets (181.5) (158.9) Buyback of own shares (2.2) (0.2)
Payment of dividends (41.5) (40.1)
Other changes (25.4) (17.2)
TOTAL USES OF FUNDING (250.6) (216.4)
FINANCIAL SURPLUS (DEFICIT) (216.4) (17.5) NET FINANCIAL POSITION AT THE BEGINNING OF THE PERIOD (2,335.1) (2,166.8)
NET FINANCIAL POSITION AT THE END OF THE PERIOD (2,551.5) (2,184.3)
The breakdown of the net financial position is given in the explanatory Notes to the Financial Statements.
Semi-annual Interim Financial Report 2012 9

The net cash flow generated by operations, amounting to € 16.1 million compared to € 49.5 million in the first half of 2011, consists of self-financing of € 124.6 million in line with the first half of 2011 (€ 126.3 million) offset by a negative change in net working capital of € 108.5 million, compared to € 76.8 million in the same period of last year. The total change in sources of funding was caused by the presence, in the first half of 2011, of an important decrease in borrowings relating to assets of the Sorgenia Group and the KOS Group which were being held for disposal. Uses in the first half of 2012 were up on the same period in 2011, essentially because of investments made by all the operating groups, but especially the Sorgenia group. At 30 June 2012 the Group had 14,271 employees, compared to 14,072 at 31 December 2011.
2. Performance of the Parent Company The parent company CIR S.p.A. closed the first half of 2012 with net income of € 19.8 million compared to € 14.2 million in the first half of 2011. Equity stood at € 948.6 million at 30 June 2012, compared to € 946 million at 31 December 2011. The key income statement figures of CIR for the first half of 2012, compared with those for the first six months of 2011, are as follows:
(in millions of euro) 1st Half
2012 1st Half
2011 Net operating costs (1) (4.4) (12.4) Other operating costs and amortization (2) (1.7) (1.3) Operating result (6.1) (13.7) Financial management result (3) 22.5 23.3 Income (loss) before taxes 16.4 9.6 Income taxes 3.4 4.6 Net income 19.8 14.2
(1)This item is the algebraic sum of “sundry revenues and income”, “costs for services” and “personnel costs” in the income statement of the Parent Compa-ny CIR S.p.A.
2) This item is the sum of “other operating costs” and “amortization, depreciation and write-downs” in the income statement of the Parent Company CIR S.p.A.
3) This item is the algebraic sum of “financial income”, “financial expense”, “dividends”, “gains from trading securities”, “losses from trading securities” and “adjustments to the value of financial assets” in the income statement of the Parent Company CIR S.p.A.
The operating result for the first half of 2012 was a loss of € 6.1 million which compares with an operating loss of € 13.7 million in the first six months of 2011. It includes costs for share-based incentive plans of € 1.3 million, compared to € 2.2 million in the first half of 2011, and non-recurring costs for legal fees of € 1.1 million (€ 7.5 million in the first six months of 2011). The financial management result includes the dividends of subsidiaries, which totalled € 31.1 million in the first half of 2012, compared to € 29.3 million in the same period of 2011, net financial expense of € 8.9 million (€ 4.9 million in the first six months of 2011) and gains from trading and valuing securities of € 0.2 million (losses of € 1.1 million in the first six months of 2011).
Semi-annual Interim Financial Report 2012 10

Lastly, the first half of 2012 benefited from a positive tax position of € 3.4 million, compared to € 4.6 million in the same period of 2011. The key figures of the statement of financial position of CIR at 30 June 2012, compared with the position at 31 December 2011, are as follows:
(in millions of euro) 30.06.2012 31.12.2011
Fixed assets (1) 1,202.5 1,202.8
Other net non-current assets and liabilities (2) 312.4 310.8
Net working capital (3) (19.7) (12.4)
Net invested capital 1,495.2 1,501.2
Net financial position (4) (546.6) (555.2)
Equity 948.6 946.0
1) This item is the sum of “intangible assets”, “ tangible assets”, “investment property” and “equity investments” in the statement of financial position of the Parent Company CIR S.p.A..
2) This item is the algebraic sum of “sundry receivables” and “deferred taxes” in non-current assets and “personnel provisions” in the non-current liabilities of the statement of financial position of the Parent Company CIR S.p.A.
3) This item is the algebraic sum of “sundry receivables” in current assets and “other payables” and “provisions for risks and losses” in the current liabilities of the statement of financial position of the Parent Company CIR S.p.A.
4) This item is the algebraic sum of “financial receivables”, “securities”, “available-for-sale financial assets” and “cash and cash equivalents” in current assets, and “bonds and notes” in non-current liabilities and “other borrowings” in current liabilities in the statement of financial position of the Parent Company CIR S.p.A.
The item “Other net non-current assets and liabilities” at 30 June 2012 mainly refers to a loan to the subsidiary CIR International. The net financial position at June 30 2012 shows net debt of € 546.6 million versus € 555.2 million at December 31 2011 and includes the liability recognized to offset the payment made by Fininvest in 2011 that was mentioned earlier. Equity rose from € 946 million at 31 December 2011 to € 948.6 million at 30 June 2012. This change was mainly due to the balance of the net income for the period and the dividend payout of € 18.6 million. At 30 June 2012, a total of 49,989,000 own shares were being held, equal to 6.3% of capital, for a total equivalent of € 108.3 million, unchanged from 31 December 2011.
Semi-annual Interim Financial Report 2012 11

3. Chart reconciling the figures of the Parent Company with those of the Consolidated Financial Statements
The following chart shows the reconciliation of the Group results for the period and equity with the figures of the parent company. (in thousands of euro) 30.06.2012 31.12.2011 (*)
Equity
Result 1st Half 2012
Equity
Net result 2011
Figures of the parent company CIR S.p.A. 948,559 19,786 946,037 269 - Dividends from companies included in consolidation (31,149) (31,149) (29,282) (29,282) - Net contribution of consolidated companies 567,781 12,841 582,894 37,429 - Difference between carrying values of investee compa-nies and the portions of consolidated equity, net of their contributions (66,867) -- (63,301) -- - Other consolidation adjustments (775) (775) 1,328 1,328
- Consolidated figures - Group share 1,417,549 703 1,437,676 9,744
(*) Certain 2011 values were recalculated following the completion, by the Sogefi Group, of the Purchase Price Allocation process for Systèmes Moteurs S.A.S.
Semi-annual Interim Financial Report 2012 12

MAIN EQUITY INVESTMENTS OF THE GROUP (*) AT JUNE 30 2012
Media
Energy
Healthcare
SORGENIA
CIR
52,0% (**)
58,3% (*)
51,3%
ESPRESSO 55,7% (*)
Automotive Components SOGEFI
KOS
(*) The percentage is calculated net of own shares held as treasury stock (**) Percentage of indirect control through Sorgenia Holding
Semi-annual Interim Financial Report 2012 13

4. Performance of the business sectors
ENERGY SECTOR In the first half of 2012 the Sorgenia group reported consolidated revenues of € 1,119.3 million, up 7.3% on the figure of € 1,043.1 million for the first half of 2011.
Sorgenia’s results for the first half of 2012 were in line with the slowing trend in the national electric-ity sector, especially the thermoelectric segment, in view of the deep recession and the high gas costs for Italian thermoelectric power plants, which were higher than those incurred by industrial us-ers with significantly lower consumption. National demand for electricity in the period went down by 2.8% compared to 2011 with the same calendar, with a more marked decline (-6.8%) in the thermoe-lectric sector. In this context, despite the growth in revenues and sales volumes, Sorgenia too reported significantly lower margins compared to the first half of last year, which were negatively affected by the lower profitability of power generation (due particularly to the rise in the price of gas for power plants), higher congestion charges on the electricity grid in the Southern region and the contraction in sales volumes of natural gas.
The group reported an adjusted consolidated net result (excluding the fair value measurement of hedging contracts and derivatives) which was a loss of € 54.3 million, versus a breakeven result (€ 0.5 million) in the same period of last year. The consolidated net result was a loss of € 54.1 million (income of € 0.3 million in the first half of 2011).
Consolidated revenues can be broken down as follows: (in millions of euro) 1st Half 2012 1st Half 2011 Change Values % Values % %
Electricity 1,030.7 92.1 822.1 78.8 25.4
Natural gas 67.3 6.0 129.3 12.4 (48.0)
Other revenues 21.3 1.9 91.7 8.8 (76.8)
TOTAL 1,119.3 100.0 1,043.1 100.0 7.3
During the first half of 2012, the adjusted gross operating margin (EBITDA) figure, (which excludes the fair value measurement of hedging contracts and derivatives) was € 33.6 million, down 56.8% from € 77.7 million in the same period of 2011. EBITDA totalled € 32.2 million, compared to € 76.3 million in the first half of 2011 (-57.8%). The considerable reduction in margins compared to last year was essentially attributable to the following factors:
- The contraction in thermoelectric generating margins, negatively impacted in particular by the high price of gas for the power plants, the competition of renewable sources at peak times of day, the significant slowdown in demand and the production overcapacity of the electricity system;
- The reduction in the contribution of the investee Tirreno Power for the same reasons as those listed above;
- Higher congestion charges on the electricity grid in the Southern region; - The reduction in the contribution of the renewable source businesses due to the changes in
the consolidation; - The decline in natural gas sales volumes and the margins thereon linked to the continuing
effects of “force majeure” in relation to the Libyan contract.
Semi-annual Interim Financial Report 2012 14

The consolidated EBIT figure for the first half of 2012 was a negative € 28 million compared to a positive € 28.8 million in the same period of last year, having been affected not only by the reduction in EBITDA, but also by the writedown of assets for € 13 million, mainly in hydrocarbon exploration and production. Consolidated net debt stood at € 1,857 million at 30 June 2012, net of cash flow hedge components, compared to € 1,667.2 million at 31 December 2011. The change was due not only to the increase in working capital but also to the scheduled investments for completing the Aprilia power plant, building wind parks and for the hydrocarbon exploration and production business. The positive effects of the receipt of the first cash inflow ($ 48 million) from the announced sale of the Orlando exploration field (United Kingdom), which should be completed in coming months, are not included in the result of the period and in the net financial debt position at 30 June. To counter the deep recession in Italy and the difficulties in the Italian energy market, Sorgenia has launched a series of actions which should generate the first benefits in economic and financial terms in the second part of this year and in 2013. More specifically, the company has started renegotiating its contract for sourcing natural gas, has launched a plan for cutting operating costs and is studying the possible sale of certain non-strategic businesses. At 30 June 2012, the group had 472 employees, up from 466 at 31 December 2011. As far as the advancement of Business Plan 2011-2016 is concerned, during the first half of the year the Aprilia power plant (Latina), the fourth and last CCGT planned by Sorgenia, started operating commercially. Construction work also went ahead on three new wind parks in Italy for a total of 31 MW, which are expected to start commercial operations by the end of 2012, and on a new 12.5 MW wind park in France. Exploration and Production (E&P) activity is also continuing through the exploration licenses in Colombia and the North Sea.
MEDIA SECTOR The Espresso group closed the first half of 2012 with consolidated revenues of € 419.8 million, down 8.2% on the figure of € 457.4 million in the first half of 2011, mainly as a result of the trend in add-on collateral products, which had been extraordinarily favourable in the first half of 2011. Without the add-ons, the decline would have been 5.4%. Consolidated net income was € 21.2 million, down from € 31.5 million in the first six months of last year (-32.7%). The revenues of the group can be broken down as follows: (in millions of euro) 1st Half 2012 1st Half 2011 Change Values % Values % %
Circulation 127.1 30.3 129.2 28.3 (1.6)
Advertising 251.1 59.8 274.4 60.0 (8.5)
Add-ons 25.6 6.1 40.8 8.9 (37.3)
Other revenues 16.0 3.8 13.0 2.8 23.1
TOTAL 419.8 100.0 457.4 100.0 (8.2)
Semi-annual Interim Financial Report 2012 15

The deteriorating economic situation, characterized by a period of severe recession and great uncertainty about future prospects, weighed heavily on the publishing industry. Advertising investments were down sharply: in the first five months of 2012 they declined by 9.5% compared to the same period in 2011 (Nielsen Media Research data). The trend was negative for all the traditional media: the press went down by 13.6%, television by 10% and radio by 5.5%. By contrast, internet advertising continued to show very positive performance, rising by 10.6%. Regarding the press in particular, newspapers and periodicals reported equivalent declines (-13.5% and -13.8% respectively). In terms of circulation, ADS figures (moving average at February 2012, on the same range of products) show a decline in sales on the news-stands of 5.3% for the daily newspapers, 6% for weeklies and 9.7% for monthlies. Group circulation revenues, excluding collateral products, amounted to € 127.1 million, holding up relatively well on the same period last year (€ 129.2 million), thanks in part to the gradual rise in the cover prices of newspapers. On the basis of the latest ADS (May 2012) and Audipress figures (2012/I survey), la Repubblica confirmed its ranking as the number one daily newspaper in terms of news-stand sales and the top newspaper in terms of number of readers per day (3.5 million). Again according to the latest Audipress surveys, L’Espresso tops the ranking of current affairs magazines with 2.6 million readers, up by 4.2% compared to the previous survey. Advertising revenues, totalling € 251.1 million, posted a decline of 8.5% on the first half of 2011, in a market which in May was down by 9.5%. By sector, the trends reflected the general performance of the market: the press was down 12.6% and radio was down 5%. However, performance was very positive for internet advertising (+13.2%) which confirmed the brilliant dynamics of the last few years, despite the particularly unfavourable climate. Revenues from add-ons amounted to € 25.6 million and were down significantly (-37.3%) on the same period of 2011. This on the one hand reflects the impact on the segment of the generalized decline in consumption and, on the other hand, the particular success that the various initiatives had in the first half of last year. Sundry revenues came to € 16 million and were up by more than 20% compared to the first six months of 2011, thanks to the growth of the business of renting out digital terrestrial TV bandwidth to third parties and to the positive performance of subscriptions to digital products. Total costs declined by 4.2%, mainly thanks to the new plans for reducing the workforce and cutting costs undertaken during 2011. The consolidated gross operating margin came in at € 60.8 million, down by 25.4% compared to the figure of € 81.5 million for the first half of 2011. Some 50% of this contraction was due to the reduction in the margin on collateral products, while the remaining part came from the print and radio activities, which were hit by the fall in advertising revenues, while internet and TV results improved.
The consolidated operating result was € 42.1 million, down 33.2% from € 63 million in the same period of last year. The consolidated net financial position showed net debt of € 147.1 million at 30 June 2012, up from € 110.2 million at 31 December 2011, due partly to the dividend distribution of € 25 million and to the share buyback of € 1.2 million. There were 2,632 employees, including temporary contracts, on the group payrolls at 30 June 2012, 41 less than at 31 December 2011.
Semi-annual Interim Financial Report 2012 16

It should be noted that, with its ruling no. 64/9/2012, filed on May 18 2012, the Rome Regional Tax Commission ("CTR") gave its pronouncement on the tax assessments issued by the Inland Revenue for events going back to financial year 1991, partly ruling against the Espresso Group. More specifically, the Regional Tax Commission pronounced as legitimate the application of ITL 440,824,125,000 of tax on capital gains which, according to the Commission, had been made but not declared and ITL 13,972,000,000 for costs indicated as non-deductible for dividends and tax credits, with the application of penalties set at the legal minimum and payment of court costs. On this subject it should be noted that the appeals against the said tax assessments were previously upheld in two levels of justice and the facts being contested were declared as unfounded in the criminal court at the time. The company also filed a petition to the Court of Cassation on 27 June 2012 and requested suspension of the effects of the ruling from the Regional Tax Commission on 28 June 2012. On 19 July 2012 the Rome RTC suspended the enforceability of the ruling. Given that the Company is certain that the operations being contested are legitimate according to the law and tax regulations, and this opinion is supported by technical evaluations obtained from third party professionals, it considered that the risk linked to the corporate restructuring operations, for which the ruling went against the Company, was “possible” rather than “likely” and therefore did not make any specific provisions for this risk according to the IAS 37. In view of the general situation of the economy and the negative prospects in the short and medium term, it is likely that the difficulties reported at sector-level in the first half of the year will continue, particularly as far as advertising revenues are concerned. However despite this outlook, the group closed the first half of the year with a significantly positive result and confirms its forecast of a positive result even for the whole year, although it will be considerably lower than that of 2011. The structural nature of the current crisis requires the group to again take measures to protect its cost efficiency in the short and medium term.
AUTOMOTIVE COMPONENTS SECTOR The consolidated revenues of the Sogefi group in the first half of 2012 came to € 686.8 million and were up by 30.4%, thanks to the contribution of the activities of Systèmes Moteurs, acquired during the second half of last year. These results were obtained despite the difficulties in the car sector in Sogefi’s main market, Europe, which in the first half reported a fall in new car registrations of 6.8%, mainly because of the negative economic situation in the Mediterranean countries. However, at global level new car sales rose by 5%, thanks particularly to growth in the United States (+13%), India (+12%), Russia (+15%) and Japan (+50% compared to the figure for 2011 which reflected the effects of the tsunami). Brazil and China, while still positive, did however suffer a slowdown. The production levels of new vehicles substantial-ly reflected the evolution of sales with a delay of a few months. Consolidated net income came in at € 16.1 million, up 4.8% compared to the € 15.3 million in the first six months of 2011. The breakdown of consolidated revenues of the Sogefi group by business sector is as follows:
Semi-annual Interim Financial Report 2012 17

(in millions of euro) 1st Half 2012 1st Half 2011 Change
Values % Values % %
Engine systems 412.0 60.0 246.2 46.8 67.4
Suspension components 275.1 40.0 281.8 53.5 (2.4)
Intercompany (0.3) - (1.4) (0.2) n.a.
TOTAL 686.8 100.0 526.6 100.0 30.4
The increase in revenues mainly concerned the Engine systems division (filters and engine air cooling systems), thanks to the contribution of the Systèmes Moteurs businesses. With the same consolidation as in first half 2011, the revenues of the division would have been down by 6.2%. The revenues of the Suspension components division came to € 275.1 million, down slightly from € 281.8 million in 2011. With the same consolidation, net of the acquisition of Systèmes Moteurs, group revenues would have been € 504.9 million, posting a modest decline (-4.1%). The sharp increase seen in the US (revenues quadrupled to over € 50 million), in China (+ 12.9%) and in India (+ 69.9%) compensated for the fall in the European market and the slowdown in Brazil. During the period the Sogefi group benefited from the absence of any commodity price rises and pursued strict policies for containing all cost factors, especially structure costs. During the first half of the year restructuring charges of € 1.4 million were recognized (€ 1.6 million in the same period of 2011) and there were non-operating costs of € 5.1 million euro (€ 3.3 million in the first half of 2011) due to the writedown of assets for the production of stabilizer bars in the Prichard factory (USA) that are no longer used and to consulting fees linked to the international development of the group. Consolidated EBITDA totalled € 68.1 million (9.9% of revenues), up 28.9% on the € 52.8 million (10% of revenues) of the first half of 2011. With the same consolidation EBITDA would have amounted to € 47.7 million (9.5% of revenues). Consolidated EBIT amounted to € 36.7 million (5.3% of revenues), up 20.1% on the € 30.6 million (5.8% of revenues) recorded in the first half of 2011. With the same consolidation EBIT would have been € 24.3 million (4.8% of revenues). During the first half of 2012 consolidated net income, totalling € 16.1 million, increased less than the operating results because of the rise in financial expense (€ 8.4 million compared with € 4.7 million in the same period of 2011) due to the higher average level of debt in the period following the acquisition of Systèmes Moteurs. Consolidated equity at 30 June 2012, including minority interests, amounted to € 210.2 million, down from the figure of € 214.2 million recorded at 31 December 2011. At 30 June 2012 net debt stood at € 307.6 million, compared to € 299.8 million at 31 December 2011. The change was due essentially to the distribution of dividends for € 17.2 million. The group had 6,760 employees on its payrolls at 30 June 2012 (6,708 at 31 December 2011). In the second half of the year there is not expected to be any improvement in the global car market compared to the first half.
Semi-annual Interim Financial Report 2012 18

A possible recovery in China and Brazil following actions taken by their respective governments to support the economy should be offset by the continuing weakness of Europe. However a scenario of commodity price stability and ongoing cost cutting actions should enable the Sogefi group to achieve economic results in the second half that are in line with those obtained in the first half of the year.
HEALTHCARE SECTOR In the first six months of 2012 the KOS group reported consolidated revenues of € 178.7 million, up 1% on the figure of € 176.9 million for the same period of last year, thanks to the development of the three business areas (nursing homes, rehabilitation units and hospital management).
The breakdown of the consolidated revenues of the KOS group by business sector is as follows: (in millions of euro) 1st Half 2012 1st Half 2011 Change Values % Values % %
Nursing homes (RSAs) 68.4 38.3 67.7 38.3 1.0
Rehabilitation 78.9 44.2 78.8 44.5 0.1
Acute/Hi-tech 31.4 17.5 30.4 17.2 3.1
TOTAL 178.7 100.0 176.9 100.0 1.0
The consolidated EBITDA (margin before amortization, depreciation, write-downs and provisions) came to € 25 million (14% of revenues) down from € 27.5 million in the first six months of 2011 partly as a result of the additional costs for leases due to the sale of three properties used for business purposes in the third quarter of last year. Consolidated EBIT was € 15.2 million (8.5% of revenues), compared to € 18.1 million (10.2% of revenues) in the same period of last year, also affected by a negative delta on provisions and writedowns of around € 0.4 million. Consolidated net income was € 4.6 million, compared to € 6.2 million in the first six months of 2011. At 30 June 2012 the net debt of the KOS group stood at € 151.7 million, down from € 165.1 million at 31 December 2011. The improvement of € 13.4 million was mainly due to the subscription to a € 17.5 million capital increase in May by the shareholder AXA Private Equity. Following the share capital increase, the KOS shareholding structure was as follows: CIR holds 51.3%, AXA Private Equity 46.7%, management and other shareholders the remaining 2%. At 30 June 2012 consolidated equity stood at € 225.3 million versus € 207.2 million at 31 December 2011. The activities in the start-up stage are continuing in India, where in the second half of 2011 the KOS group set up the joint venture ClearMedi Healthcare LTD, 51% controlled by the KOS group and 49% by a local operator. The company is active in the sector supplying diagnostic and therapeutic technologies in outsourcing to Indian hospitals. The KOS group, which currently manages a total of over 5,700 beds plus another 900 under construction, is active in three sectors:
Semi-annual Interim Financial Report 2012 19

- Nursing homes (RSAs), with 39 homes under management (3,954 beds in operation in seven regions of Central-Northern Italy);
- Rehabilitation (management of hospitals and rehabilitation units), with 13 rehabilitation facilities (in Lombardy, Emilia Romagna, Trentino and Marche), 9 psychiatric rehabilitation communities (in Liguria, Piedmont and Lombardy) and 13 day hospitals, with a total of 1,685 beds in operation.
- Hospital management (management of one hospital and hi-tech services in public and private facilities) in 20 facilities.
The group had 4,285 employees at 30 June 2012, up from 4,080 at 31 December 2011.
5. Non-core investments These consist of venture capital, private equity/minority holdings and other investments. Venture capital and private equity CIR Ventures is the Group’s venture capital fund. At 30 June 2012 the fund portfolio contained investments in four companies, of which three in the United States and one in Israel. These companies all operate in the sector of information and communications technology. The total fair value of these investments at 30 June 2012 was 14 million dollars. The CIR Group, through its subsidiary CIR International, manages a diversified portfolio of private equity funds and direct minority shareholdings, the fair value of which determined on the basis of the NAV provided by the various funds at 30 June 2012 was approximately € 105.6 million. Remaining commitments outstanding at 30 June 2012 amounted to € 13.7 million. Other investments The SEG Group (Swiss Education Group) - a world leader in managerial training in the hospitality sector (hotels, catering, etc.), in which CIR has a holding of around 20% - once again in the first half of 2012 had good level of enrolments with much of this demand coming from Asian countries and Brazil. In January 2012, the new headquarters of Cesar Ritz (one of the group’s schools dedicated to the culinary arts), located in Bouveret, began operations. The subsidiary Food Concepts, set up in 2010, is active in the casual dining sector in Europe with three restaurants in Germany in the cities of Munich, Düsseldorf and Hamburg (LaBaracca brand). During the first half of 2012, Food Concepts business activities achieved revenues of € 2.3 million. The result for the period was a negative € 2.1 million (of which CIR’s share was € 1.7 million). During the first half of 2012 the company Jupiter Finance, which carries out a master servicing function for the collection of problem loans acquired by the securitization vehicles Zeus, Vesta and Urania, continued its routine management of current transactions. Moreover, during the first half of the year the Company began a reorganization process with the aim of giving up its master servicer functions as per Law 130/1999, together with other functions no longer considered to be core, and to focus on specific activities in the interest of its controlling shareholder and the noteholders of the vehicle companies.
Semi-annual Interim Financial Report 2012 20
On June 25 agreements were signed terminating the master and corporate servicing roles existing with the vehicle Zeus, for whom the company will continue to carry out an asset advisory service in the interest of the noteholders, including the CIR group which holds all of the Junior Notes of the same vehicle company. At 30 June 2012, the net value of the investment of the CIR Group in the activities relating to non-performing loans amounted to € 63.4 million.
6. Significant events which occurred after 30 June 2012 On the subject of the main events that have taken place since June 30 2012, it should be noted in relation to the Espresso group that on July 19 the Rome Regional Tax Commission (RTC) suspended the enforceability of ruling no. 64/9/2012. For further details see the section “Performance of the Business Sectors” in the paragraph "Media Sector".
7. Business outlook The performance of the CIR group in 2012 will be affected by the evolution of the macroeconomic environment, which is currently characterized by a recessionary scenario the intensity and duration of which cannot at the moment be predicted, and by the performance of the financial markets. In this scenario the main operating subsidiaries of the group will continue the strategy of taking action to improve their operating efficiency while at the same time engaging in business development initiatives.
8. Main risks and uncertainties to which the Group is exposed The main risk factors relating to the businesses in which the CIR Group is involved and thus has exposure are substantially unchanged from those for the year 2011. For a detailed description of these risks, reference should be made to the Annual Report and Financial Statements as of December 31 2011 in the Report on Operations. For the risks relating to specific businesses, see the section “Performance of the Business Sectors”.
Semi-annual Interim Financial Report 2012 21

9. Other information TRANSACTIONS WITH GROUP COMPANIES AND RELATED PARTIES On 28 October 2010 the company adopted the Regulations on Related Party Transactions envisaged by the Consob Regulation, issued by means of Resolution No. 17221 dated 12 March 2010, as subsequently amended and added to by Resolution No. 17389 of 23 June 2010. This procedure can be found in the Governance section on the web site: www.cirgroup.it. The procedure aims to establish principles of conduct that the Company is required to adopt in order to guarantee the correct management of related party transaction and it therefore:
1. sets out the criteria and procedures for identifying the Company’s related parties; 2. dictates the principles for identifying related party transactions; 3. regulates the procedures for carrying out related party transactions; 4. establishes methods for compliance with the related disclosure obligations. The Board of Directors has also appointed a Related Party Transactions Committee, establishing that its members coincide with membership of the Internal Control Committee, except for the system of substitutes envisaged in the procedures. During the period CIR S.p.A. provided management and strategic support services to its subsidiaries and affiliates, which involved, among other things, supplying administrative and financial services and granting loans. Transactions with the parent company consisted of providing services of an administrative and financial nature and being supplied with management support and communication services. The main concern of CIR and its counterparties in relation to these services is to ensure quality and a high level of efficiency of the services rendered, which derive from CIR’s specific knowledge of Group business activities. It should also be noted that CIR S.p.A. has signed lease contracts with subsidiaries and executives with strategic responsibilities within the Group. The Group’s related party transactions are settled at arm’s length, taking into consideration the quality and specific nature of the services provided. For further details on related party transactions, reference should be made to paragraph 27 “Related party transactions”. Regarding the main equity transactions reference should be made to the appropriate sections of the Notes to the financial statements. It should be pointed out that the CIR Group did not enter into any transactions with related parties, according to Consob’s definition, or with entities other than related parties of an atypical or unusual nature beyond normal business administration or such as to have any significant impact on the economic, financial or equity position of the Group. OTHER CIR S.p.A. – Compagnie Industriali Riunite has its registered office at Via Ciovassino 1, Milan, Italy.
CIR shares have been listed on the Milan Stock Exchange since 1973 (Reuters code: CIRX.MI, Bloomberg code CIR IM).
This Financial Report for the period 1 January – 30 June 2012 was approved by the Board of Directors on 30 July 2012.
CIR S.p.A. is subject to management and coordination by Cofide - Gruppo De Benedetti S.p.A..
Semi-annual Interim Financial Report 2012 22

CIR Group
Condensed Consolidated Semi-Annual Financial Statements
STATEMENT OF FINANCIAL POSITION
INCOME STATEMENT
STATEMENT OF COMPREHESIVE INCOME
STATEMENT OF CASH FLOW
STATEMENT OF CHANGES IN EQUITY
EXPLANATORY NOTES
Semi-annual Interim Financial Report 2012 23

1. CONSOLIDATED STATEMENT OF FINANCIAL POSITION
(in thousands of euro)
ASSETS Notes 30.06.2012 31.12.2011 (**)
NON-CURRENT ASSETS 4,956,022 4,919,524 INTANGIBLE ASSETS (7.a) 1,489,319 1,500,545 TANGIBLE ASSETS (7.b) 2,422,718 2,400,534 INVESTMENT PROPERTY (7.c) 23,218 23,551 INVESTMENTS IN COMPANIES CONSOLIDATED AT EQUITY (7.d) 388,024 386,253 OTHER EQUITY INVESTMENTS (7.e) 6,668 22,903 OTHER RECEIVABLES (7.f) 247,442 247,079
of which with related parties (*) (7.f) 27,108 29,481 SECURITIES (7.g) 123,042 107,321 DEFERRED TAXES (7.h) 255,591 231,338
CURRENT ASSETS 3,041,110 2,951,235 INVENTORY (8.a) 196,801 184,530 CONTRACT WORK IN PROGRESS 40,666 35,330 TRADE RECEIVABLES (8.b) 1,312,408 1,215,226
of which with related parties (*) (8.b) 12,904 9,352 OTHER RECEIVABLES (8.c) 327,238 269,815
of which with related parties (*) (8.c) 1,049 2,603 FINANCIAL RECEIVABLES (8.d) 27,723 11,956 SECURITIES (8.e) 612,256 613,877 AVAILABLE-FOR-SALE FINANCIAL ASSETS (8.f) 131,096 126,495 CASH AND CASH EQUIVALENTS (8.g) 392,922 494,006
ASSETS HELD FOR DISPOSAL (8.h) 47,397 1,924
TOTAL ASSETS 8,044,529 7,872,683
LIABILITIES AND EQUITY 30.06.2012 31.12.2011 (**)
EQUITY 2,426,998 2,479,021 ISSUED CAPITAL 396,670 396,666 less OWN SHARES (24,995) (24,995)SHARE CAPITAL (9.a) 371,675 371,671 RESERVES (9.b) 290,741 293,015 RETAINED EARNINGS (LOSSES) (9.c) 754,430 763,246 NET INCOME FOR THE YEAR 703 9,744 GROUP EQUITY 1,417,549 1,437,676 MINORITY INTERESTS EQUITY 1,009,449 1,041,345
NON-CURRENT LIABILITIES 2,984,248 3,101,148 BOND LOANS (10.a) 504,328 525,802 OTHER BORROWINGS (10.b) 2,099,651 2,197,337 OTHER PAYABLES 1,679 1,856 DEFERRED TAXES (7.h.) 183,272 177,698 PERSONNEL PROVISIONS (10.c) 122,239 123,766 PROVISIONS FOR RISKS AND LOSSES (10.d) 73,079 74,689
CURRENT LIABILITIES 2,633,283 2,292,217 BANK OVERDRAFTS 180,233 142,485 BOND LOANS (11.a) 10,037 4,243 OTHER BORROWINGS (11.b) 921,227 711,600
of which from related parties (*) (11.b) 2 2 TRADE PAYABLES (11.c) 1,026,838 980,427
of which to related parties (*) (11.c) 25,663 36,629 OTHER PAYABLES (11.d) 402,943 368,075
of which to related parties (*) (11.d) 280 251 PROVISIONS FOR RISKS AND LOSSES (10.d) 92,005 85,387
LIABILITIES ASSOCIATED WITH ASSETS HELD FOR DISPOSAL (8.h) -- 297
TOTAL LIABILITIES AND EQUITY 8,044,529 7,872,683
(*) As per Consob Resolution no. 6064293 of 28 July 2006
(**) Some values for 2011 were recalculated following completion, by the Sogefi Group, of the Purchase Price Allocation process for Systèmes Moteurs SAS
Semi-annual Interim Financial Report 2012 24

2. CONSOLIDATED INCOME STATEMENT
(in thousands of euro)
Note 1st Half2012
1st Half2011
SALES REVENUES (12) 2,406,946 2,205,630 of which from related parties (*) (12) 32,012 2,879
CHANGE IN INVENTORIES 12,893 9,172
COSTS FOR THE PURCHASE OF GOODS (13.a) (1,393,495) (1,209,741) of which to related parties (*) (13.a) (75,751) (62,783)
COSTS FOR SERVICES (13.b) (426,985) (413,464)of which from related parties (*) (13,b) (1,204) (624)
PERSONNEL COSTS (13.c) (381,823) (360,713)
OTHER OPERATING INCOME (13.d) 58,305 71,015 of which from related parties (*) (13.d) 10,069 748
OTHER OPERATING COSTS (13.e) (96,121) (83,501)of which to related parties (*) (13.e) (50) --
ADJUSTMENTS TO THE VALUE OF INVESTMENTS CONSOLIDATED AT EQUITY (7.d) (3,897) 7,869
AMORTISATION, DEPRECIATION & WRITE-DOWNS (120,227) (97,691)INCOME BEFORE FINANCIAL ITEMSAND TAXES ( E B I T ) 55,596 128,576
FINANCIAL INCOME (14.a) 38,875 28,326 of which with related parties (*) (14.a) 6,352 5,068
FINANCIAL EXPENSE (14.b) (99,672) (90,683) of which with related parties (*) (14.b) (5,086) (5,058)
DIVIDENDS 389 137 of which with related parties (*) 14 11
GAINS FROM TRADING SECURITIES (14.c) 6,449 7,858
LOSSES FROM TRADING SECURITIES (14.d) (1,248) (330)
ADJUSTMENTS TO THE VALUE OF FINANCIAL ASSETS 9,886 2,420
INCOME( LOSS) BEFORE TAXES 10,275 76,304
INCOME TAXES (15) (16,460) (30,090)
INCOME (LOSS) BEFORE TAXESFROM OPERATING ACTIVITY (6,185) 46,214
INCOME/(LOSS) FROM ASSETS HELD FOR DISPOSAL -- --
NET INCOME FOR THE YEAR INCLUDING MINORITY INTERESTS (6,185) 46,214
- NET INCOME (LOSS) MINORITY INTERESTS 6,888 (26,782) - NET INCOME OF THE GROUP 703 19,432
BASIC EARNINGS PER SHARE (in euro) (16) 0.0009 0.0259 DILUTED EARNINGS PER SHARE (in euro) (16) 0.0009 0.0259
(*) As per Consob Resolution no. 6064293 of 28 July 2006
Semi-annual Interim Financial Report 2012 25

3. CONSOLIDATED STATEMENT OF COMPREHENSIVE INCOME
(in thousands of euro)
1st Half2012
1st Half2011
Net income for the year (6,185) 46,214
Other items of statement of comprehensive income
Currency translation differences of foreign operations 1,865 (12,802)
Net change in fair value of available-for-sale financial assets 4,306 (3,245)
Net change in cash flow hedge reserve (29,576) 6,589
Other items of comprehensive income (9,122) 6,177
Taxes on other items of statement of comprehensive income 7,891 (1,951)Other items of statement of comprehensive income,net of tax effects (24,636) (5,232)
TOTAL STATEMENT OF COMPREHENSIVE INCOME FOR THE YEAR (30,821) 40,982
Total Statement of comprehensive income attributable to:Shareholders of the parent company (8,888) 12,065 Minority interests (21,933) 28,917
BASIC COMPREHENSIVE EARNINGS PER SHARE (in euro) (0.0120) 0.0161 DILUTED COMPREHENSIVE EARNINGS PER SHARE (in euro) (0.0120) 0.0161
Semi-annual Interim Financial Report 2012 26

4. CONSOLIDATED STATEMENT OF CASH FLOW
(in thousands of euro)
1st Half2012
1st Half2011
OPERATING ACTIVITY
NET INCOME FOR THE YEAR INCLUDING MINORITY INTERESTS (6,185) 46,214
ADJUSTMENTS:
AMORTISATION, DEPRECIATION & WRITE-DOWNS 120,227 97,691
SHARE OF RESULT OF COMPANIES CONSOLIDATED AT EQUITY 3,897 (7,869)
ACTUARIAL VALUATION OF STOCK OPTION PLANS 5,078 5,162
CHANGE IN PERSONNEL PROVISIONS, PROV. FOR RISKS & LOSSES 3,481 (11,902)
ADJUSTMENTS TO THE VALUE OF FINANCIAL ASSETS (9,886) (2,420)
INCREASE (DECREASE) IN NON-CURRENT RECEIVABLES/PAYABLES (*) (17,592) (3,309)
INCREASE (DECREASE) IN NET WORKING CAPITAL(*) (90,933) (73,522)
CASH FLOW FROM OPERATING ACTIVITY 8,087 50,045
of which:- interest received (paid) (33,773) (43,371)- income tax disbursements (26,316) (26,432)
INVESTMENT ACTIVITY
(PURCHASE) SALE OF SECURITIES (*) 5,038 (16,830)
PURCHASE OF FIXED ASSETS (*) (181,535) (154,520)
CASH FLOW FROM INVESTMENT ACTIVITY (176,497) (171,350)
FUNDING ACTIVITY
INFLOWS FOR CAPITAL INCREASES 18,120 27,622
OTHER CHANGES IN EQUITY (25,359) (17,227)
DRAWDOWN/(REPAYMENT) OF OTHER BORROWINGS (*) 80,494 (120,432)BUY-BACK OF OWN SHARES (2,164) (210)
DIVIDENDS PAID (41,513) (40,115)
CASH FLOW FROM FUNDING ACTIVITY 29,578 (150,362)
INCREASE (DECREASE) IN NET CASH & CASH EQUIVALENTS (138,832) (271,667)
NET CASH AND CASH EQUIVALENTS - OPENING BALANCE 351,521 419,410
NET CASH & CASH EQUIVALENTS - CLOSING BALANCE 212,689 147,743
(*) At 30 June 2011 these items reflect the reclassification pursuant IFRS5 of discontinued assets and liabilities of the Sorgenia and Kos groups. For further details, see note 8.h. of Notes to the Consolidated Financial Statements.
Semi-annual Interim Financial Report 2012 27

5. CONSOLIDATED STATEMENT OF CHANGES IN EQUITY
(in thousands of euro) Minority Total
Issued Less Share Reserves Retained earnings Net income Total interestscapital own shares capital (losses) (losses)
BALANCE AT DECEMBER 31 2010 396,059 (21,537) 374,522 321,923 733,733 56,850 1,487,028 1,035,912 2,522,940
Capital Increases 607 -- 607 645 -- -- 1,252 33,184 34,436
Dividends to Shareholders -- -- -- -- (18,726) -- (18,726) (21,823) (40,549)
Retained earnings -- -- -- -- 56,850 (56,850) -- -- --
Dividends unclaimend as per Art. 23, Articles of Association -- -- -- 15 -- -- 15 -- 15
Adjustment for own share transactions -- (3,458) (3,458) 3,458 (9,683) -- (9,683) -- (9,683)
Movements between reserves (1,072) 1,072 -- -- -- --
Notional recognition of stock options -- -- -- 4,370 -- -- 4,370 -- 4,370
Effects of changes in equityof subsidiaries -- -- -- 9,922 -- -- 9,922 (23,923) (14,001)
Comprehensive result for the year
Fair value measurement of hedging instruments -- -- -- (32,762) -- -- (32,762) (32,298) (65,060)
Fair value measurement of securities -- -- -- (13,007) -- -- (13,007) (543) (13,550)
Securities fair value reserve recognised to income statement -- -- -- (307) -- -- (307) 527 220
Effects of changes in equityof subsidiaries -- -- -- (1,810) -- -- (1,810) (974) (2,784)
Currency translation differences -- -- -- 1,640 -- -- 1,640 (1,590) 50
Result for the year -- -- -- -- -- 9,744 9,744 52,873 62,617
Total comprehensive result for the year -- -- -- (46,246) -- 9,744 (36,502) 17,995 (18,507)
BALANCE AT DECEMBER 31 2011 396,666 (24,995) 371,671 293,015 763,246 9,744 1,437,676 1,041,345 2,479,021
Capital Increases 4 -- 4 5 -- -- 9 18,111 18,120
Dividends to Shareholders -- -- -- -- (18,584) -- (18,584) (22,929) (41,513)
Retained earnings -- -- -- -- 9,744 (9,744) -- -- --
Dividends unclaimend as per Art. 23, Articles of Association -- -- -- -- -- -- -- -- --
Adjustment for own share transactions -- -- -- -- -- -- -- -- --
Movements between reserves (24) 24 -- -- -- --
Notional recognition of stock options -- -- -- 1,311 -- -- 1,311 -- 1,311
Effects of changes in equityof subsidiaries -- -- -- 6,025 -- -- 6,025 (6,415) (390)
Comprehensive result for the year
Fair value measurement of hedging instruments -- -- -- (11,668) -- -- (11,668) (15,023) (26,691)
Fair value measurement of securities -- -- -- 2,719 -- -- 2,719 170 2,889
Securities fair value reserve recognised to income statement -- -- -- 1,502 -- -- 1,502 347 1,849
Effects of changes in equityof subsidiaries -- -- -- (3,278) -- -- (3,278) (3,278)
Currency translation differences -- -- -- 1,134 -- -- 1,134 731 1,865
Result for the year -- -- -- -- -- 703 703 (6,888) (6,185)
Total comprehensive result for the year -- -- -- (9,591) -- 703 (8,888) (20,663) (29,551)
BALANCE AT 30 JUNE 2012 396,670 (24,995) 371,675 290,741 754,430 703 1,417,549 1,009,449 2,426,998
Attributable to the shareholders of the parent company
Semi-annual Interim Financial Report 2012 28

EXPLANATORY NOTES
1. Structure and content of the financial statements The consolidated semi-annual interim financial statements of the Group have been prepared in accordance with international accounting standards (IAS/IFRS) published by the International Accounting Standards Board (“IASB”) and ratified by the European Union, together with all the measures issued in implementation of Art. 9 of Italian Legislative Decree 38/2005, including all the interpretations of the International Financial Reporting Interpretations Committee (“IFRIC”), previously known as the Standing Interpretations Committee (“SIC”). The financial statements are based on the principle of historical cost, modified as required for the measurement of certain financial instruments, in compliance with accrual basis accounting and going concern assumptions. In spite of the difficult economic and financial context, the Group has established that there are no significant uncertainties, as defined in paragraph 25 of IAS 1, regarding going concern. This consolidated semi-annual interim financial report was prepared in a condensed form in compliance with IAS 34 “Interim Financial Reporting”. This semi-annual interim report does not therefore include all the information required for the annual report and must be read together with the annual report and financial statements for the year ended December 31 2011. The accounting principles adopted in the preparation of this condensed consolidated semi-annual interim financial report are the same as those adopted in the preparation of the annual consolidated financial statements of the Group for the year ended December 31 2011. Below the full text of these principles is given to facilitate consultation. The consolidated semi-annual interim financial statements at 30 June 2012 include the parent company CIR S.p.A. (hereinafter “CIR”) and its subsidiaries, and were prepared using the positions of individual companies in the consolidation area, corresponding to the related separate interim financial statements, or consolidated statements for sub-groups, examined and approved by their administrative bodies and suitably adjusted and reclassified, where necessary, to bring them into line with the accounting standards listed below where these are compatible with Italian regulations. The presentation criteria adopted are as follows: - the statement of financial position is organised by matching items on the basis of current and non-
current assets and liabilities; - the income statement is shown by type of expenditure; - the statement of cash flow was prepared using the indirect method; - the chart showing changes in equity gives a breakdown of the changes that took place in the year
and in the previous year; - the statement of comprehensive income shows the income items suspended in equity. It should also be noted that some valuation processes, especially the more complex ones such as the determination of any impairment of non-current assets, are generally carried out fully only in the preparation of the annual report, when all the information that may be necessary is likely to be
Semi-annual Interim Financial Report 2012 29

more available and more accurate. This is obviously not true for cases where there are indicators of impairment requiring an immediate valuation of any losses in value. Income taxes are recognized on the basis of the best estimate of the weighted average tax rate expected for the whole year. These financial statements were prepared in thousands of euro, which is the “functional” and “presentation” currency of the Group according to IAS 21, except where expressly indicated otherwise.
2. Consolidation principles 2.a. Consolidation methods All companies over which the group exercises control according to the terms of IAS 27, SIC 12 and IFRIC 2 are considered subsidiaries. In particular, companies and investment funds are considered as subsidiaries when the Group has the power to make decisions regarding financial and operating policy. Such power is presumed to exist when the group holds the majority of voting rights of a company, including potential voting rights exercisable without restrictions or in any case when it has working control over Shareholders’ Meetings despite not holding a majority of the voting rights. Subsidiaries are fully consolidated as from the date on which the Group takes control and are de-consolidated when such control ceases to exist. Consolidation is carried out using the full line-by-line method. The main criteria adopted for the application of this method are: - the carrying value of the equity investment is eliminated against the related portion of equity and the difference between acquisition cost and the equity of investee companies is recognised, where the conditions are met, to assets and liabilities included in the consolidation. Any remaining part is recognised to the income statement when negative or to “Goodwill” under assets when positive. Goodwill is impairment tested to determine its recoverable value; - significant transactions between consolidated companies are eliminated as are payables, receivables and unrealised income resulting from transactions between Group companies, net of any tax effect; - minority interests’ share of equity and net income for the period are shown in special items of the consolidated statement of financial position and consolidated income statement. Associates All companies over which the group exercises significant influence, without control as prescribed in IAS 28, are considered associates. Significant influence is presumed to exist when the group holds between 20% and 50% of voting rights (excluding cases of joint control). Associates are consolidated using the equity method as from the date on which the Group acquires significant influence in the associate and they are de-consolidated from the moment significant influence ceases to exist. The main criteria adopted for applying the equity method are:
- the carrying value of the holding is eliminated against the appropriate portion of equity and any positive difference, identified at the time of acquisition, net of any lasting loss of value resulting from impairment testing to establish its recoverable value; the corresponding share of net income or loss for the period is recognised to the income statement. Whenever the group share of accumulated losses exceeds the carrying value of the
Semi-annual Interim Financial Report 2012 30

associate, the value of the investment is written off and no further losses are recognised unless the group has a contractual obligation to do so;
- any unrealised gains and losses generated by transactions between Group companies are netted out except in cases where losses represent impairment of the assets of the associate;
- the accounting standards of associates are amended, where necessary, in order to make them compatible with the accounting standards adopted by the Group.
Joint ventures: All companies in which the group exercises joint control with another company according to the terms of IAS 31 are considered joint ventures. In particular it is presumed that joint control exists when the group owns half of the voting rights of a company. International accounting standards envisage two methods for consolidating investments in joint ventures:
- the standard method, which involves proportional consolidation; - the alternative method which involves use of the equity method.
The Group has adopted the equity method of consolidation. 2.b. Translation of foreign companies’ financial statements into euro The translation into euro of the financial statements of subsidiaries from outside the Euro Area, none of which has a hyperinflationary economy according to the definition given in IAS 29, is carried out at the year-end exchange rate for the statement of financial position and at the period average exchange rate for the income statement. Any exchange rate differences resulting from the translation of equity at the year-end exchange rate and from translation of the income statement at the average rate for the period are recorded in the item “Other reserves” under equity. The main exchange rates used are the following:
30.06.2012 31.12.2011
Average rate 30.06.2012 Average rate 31.12.2011
US dollar 1.2965 1.2590 1.39196 1.2939
GB pound 0.8223 0.8068 0.8675 0.8353
Brazilian real 2.4102 2.5788 2.3239 2.4159
Argentine peso 5.6918 5.6433 5.7369 5.5676
Chinese renminbi 8.1893 8.0013 8.9847 8.1588
Indian rupee 67.5676 70.1262 64.7668 68.713
Romanian leu 4.3900 4.4514 4.2371 4.3233
Canadian dollar 1.3040 1.2871 1.3752 1.3215
Mexican peso 17.1821 18.8748 17.2444 18.0512
Hong Kong dollar 10.0604 10.7656 10.8237 10.0510
Semi-annual Interim Financial Report 2012 31

2.c. Consolidation Area The consolidated semi-annual interim financial statements condensed at 30 June 2012 and the Group’s consolidated financial statements for the previous year derive from the consolidation at those dates of the parent company CIR and all directly and indirectly controlled, jointly controlled or associated companies. Assets and liabilities scheduled for disposal are reclassified to the relevant assets and liabilities items. In particular, discontinued assets refer to assets of the Sorgenia group scheduled for disposal in 2012. The list of equity investments included in the consolidation area, with an indication of the consolidation method used, and of those excluded is given in the appropriate section of these statements. 2.d. Changes in the consolidation area The main changes in the consolidation area compared with the previous year concern the following:
• Energy sector The following companies are new entries to the consolidation area:
- Cap Energie S.a.s. - Ecoparc des Energies S.a.s. - Eolian Medgidia Pestera S.r.l. - Sorgenia ASD S.r.l.
After the conferral in the 2012 of certain business lines from the parent companies in favour of PVP 1 S.r.l., Sorgenia Castelvetere S.r.l. and Sorgenia Ricigliano S.r.l were consolidated applying the line by line consolidation method instead of the valuation at cost.
• Media sector During the period there were no changes to the consolidation area compared to 31 December 2011.
• Automotive components sector The subsidiary Allevard Rejna Autosospensions S.A. increased its interest in the subsidiary S.ARA. Composite S.a.S. from 86.67% to 90.00% (percentages referring to the capital subscription actually paid in). During the period there were no further changes to the consolidation area compared to 31 December 2011.
• Healthcare sector In the six months period the following transactions led to a change in the consolidation area:
- in the Rehabilitation sector (Istituto di Riabilitazione Santo Stefano S.r.l. and Redancia S.r.l.) - further acquisition in May of 39% of Casa Argento S.r.l. for an amount of € 650,000
increasing the interest to 90% of the capital stock; This operation has originated a bad will of € 54 thousand, recorded in the net equity, as per IFRS3.
With effect January 2012 the nursing homes located in Alessandria and in Castelferro were disposed.
Semi-annual Interim Financial Report 2012 32

• Other companies As from this abbreviated consolidated semi-annual report, the company Swiss Education Group AG is being consolidated using the equity method. Finally, it should be noted that, in early July, CIR - through Sorgenia Holding - purchased shares from about 50 employees of Sorgenia S.p.A., deriving from incentive plans for the 2001-2006 period, with a total outlay of about 11 million. As a result of this operation, CIR’s stake in the Sorgenia group increased from 52.01% to 52.87%.
2.e. Purchase Price Allocation Systèmes Moteurs S.A.S. Business combinations As mentioned earlier, the determination of the fair value of identifiable assets acquired and identifiable liabilities assumed in connection with the Systèmes Moteurs Group acquisition in July 2011, as required by the acquisition method, was completed during the first half of 2012. The following table reports the final fair values of acquired assets and liabilities and details of goodwill as of the “acquisition date” (July 29, 2011), as well as the corresponding provisional values reported in the consolidated financial statements at December 31, 2011:
Semi-annual Interim Financial Report 2012 33

ASSETS
Final Fair Value
Provisional Fair Value as of December
31, 2011
CURRENT ASSETS Cash and cash equivalents 8.311 8.311 Other financial assets - - Inventories 51.395 51.395 Trade receivables 48.193 48.193 Other receivables 3.877 5.307 Tax receivables 4.356 4.356 Other assets 334 334TOTAL CURRENT ASSETS 116.466 117.896NON-CURRENT ASSETSFIXED ASSETS Land 1.006 1.006 Property, plant and equipment 38.129 37.156 Other tangible fixed assets 715 715 Intangible assets 47.570 17.627TOTAL FIXED ASSETS 87.420 56.504OTHER NON-CURRENT ASSETS Investments in associates 274 274 Other receivables 24.320 952 Deferred tax assets 12.304 1.518TOTAL OTHER NON-CURRENT ASSETS 36.898 2.744TOTAL NON-CURRENT ASSETS 124.318 59.248
TOTAL ASSETS (A) 240.784 177.144
LIABILITIES
Final Fair Value
Provisional Fair Value as of December
31, 2011
CURRENT LIABILITIES Bank overdrafts and short-term loans - - Current portion of medium/long-term financial debts and other loans - - TOTAL SHORT-TERM FINANCIAL DEBTS - - Other short-term liabilities for derivative financial instruments - - TOTAL SHORT-TERM FINANCIAL DEBTS AND DERIVATIVE FIN. INSTUMENTS - - Trade and other payables 74.517 69.653 Tax payables 32 32 Other current liabilities 2.887 2.887TOTAL CURRENT LIABILITIES 77.436 72.572NON-CURRENT LIABILITIESOTHER LONG-TERM LIABILITIES Long-term provisions 31.276 4.815 Other payables 1.359 1.359 Deferred tax liabilities 16.771 6.816TOTAL OTHER LONG-TERM LIABILITIES 49.406 12.990TOTAL NON-CURRENT LIABILITIES 49.406 12.990
TOTAL LIABILITIES (B) 126.843 126.843
Transferred consideration for the acquisition 146.501 146.501Net asset acquired (A)-(B) 113.941 91.582GOODWILL 32.560 54.919 - -
- - Transferred consideration for the acquisition 146.501 146.501Cash and cash equivalents owned by the purchased group (8.311) (8.311)CASH FLOW FOR THE ACQUISITION 138.190 138.190
Semi-annual Interim Financial Report 2012 34

Below is a description of the nature and amounts of major adjustments to the fair value of acquired assets and liabilities occurred during the measurement period. After completion of fair value determination, "Plant and machinery" was increased by Euro 973 thousand. After completion of the determination of fair value of "Intangible assets", the following separable intangible assets were identified:
• Customer Relations: Euro 19,215 thousand (amortised over a useful life of 20 years); • Patents: Euro 2,292 thousand (amortised over a useful life of 4 to 5 years); • "Systèmes Moteurs” trade name: Euro 8,437 thousand (amortised over a useful life of 20
years). After completion of the determination of the fair value of potential liabilities connected with product warranty risks, liabilities for the amount of Euro 25,068 thousand were recognised. Of such liabilities, Euro 4,177 thousand were charged to short-term "Trade and other payables" and Euro 20,891 thousand were booked to "Long-term provisions". Such potential liabilities actually occurred in the amount of Euro 4,177 thousand at June 30, 2012. We believe that the amount left after full or partial insurance compensation and indemnities paid by subsuppliers will be repaid by the seller of Systèmes Moteurs S.A.S.' shares. For this reason, the amount of Euro 23,368 thousand was credited as an indemnification asset to “Other non-current receivables”. "Long-term provisions" include other liabilities for the amount of Euro 7,000 thousand. The balance includes different items, among which legal costs to be incurred in proceedings to recover "Other receivables" mentioned above. 3. Accounting standards applied 3.a. Intangible assets (IAS 38) Intangible assets are recognised only if they can be separately identified, if it is probable that they will generate future economic benefits and if their cost can be measured reliably. Intangible assets with a finite useful life are valued at purchase or production cost net of amortisation and accumulated impairment. Intangible assets are initially recognised at purchase or production cost. Purchase cost is represented by the fair value of the means of payment used to purchase the asset and any additional direct cost incurred to prepare the asset for use. The purchase cost is the equivalent price in cash as at the date of recognition and, where payment is deferred beyond normal terms of credit, the difference compared with the cash price is recognised as interest for the whole period of deferment. Amortisation is calculated on a straight-line basis throughout the expected useful life of the asset and starts when the asset is ready for use. Intangible assets with an indefinite useful life are not amortised but are constantly monitored for any impairment. It is mainly the newspaper, magazine titles and frequencies of the Espresso group that are considered intangible assets with an indefinite useful life. The carrying value of intangible assets is maintained to the extent that there is evidence that this value can be recovered through use; to this end at least once a year an impairment test is carried out to check that the intangible asset is able to generate future cash flows.
Semi-annual Interim Financial Report 2012 35

Development costs are recognised as intangible assets when their cost can be measured reliably, when there is a reasonable assumption that the asset can be made available for use or for sale and that it is able to generate future benefits. Once a year or any time it appears to be justified, capitalised costs are impairment tested. Research costs are charged to the income statement as and when they are incurred. Trademarks and licenses, which are initially recognised at cost, are subsequently accounted for net of amortisation and any impairment. The period of amortisation is defined as the lower of the contractual duration for use of the license and the useful life of the asset. Software licenses, including associated costs, are recognised at cost and are recorded net of accumulated amortisation and any impairment. Goodwill In the event of acquisition of companies, the identifiable assets, liabilities and potential liabilities acquired are recognised at their fair value as at the acquisition date. The positive difference between the acquisition cost and the Group’s share of the fair value of these assets and liabilities is classified as goodwill and is recorded in the statement of financial position as an intangible asset. Any negative difference (“badwill”) is instead recognised to the income statement at the moment of acquisition. After initial recognition, goodwill is measured at cost less any accumulated impairment. Goodwill always refers to identified income-producing assets, the ability of which to generate income and cash flows is constantly monitored and impairment tested as appropriate. See also paragraph 3.x. below (Business Combinations and Goodwill). 3.b. Tangible assets (IAS 16) Tangible assets are recognised at purchase price or at production cost net of accumulated depreciation. The cost includes associated expenses and any direct and indirect costs incurred at the moment of acquisition and necessary to make the asset ready for use. Financial charges relating to specific loans for long-term investments are capitalised until the date of operational start-up of the assets concerned. When there are contractual or compulsory obligations for decommissioning, removing or clearing sites where fixed assets are installed, the value recognised includes a discounted estimate of costs that will be incurred for their disposal. Fixed assets are depreciated on a straight-line basis each year throughout the remaining useful life of the asset. Land, assets under construction and advance payments are not depreciated. Real estate and land not held for instrumental or operating purposes are classified under a special item of assets and are accounted for on the basis of IAS 40 “Investment property” (see Note 3.e. below). Should there be any event from which impairment of an asset can be assumed, its carrying value is checked against its recoverable value, which is the higher of fair value and value in use. Fair value is defined on the basis of values expressed by the active market, by recent transactions or from the best information available to determine the potential amount obtainable from sale of the asset. Value in use is determined by discounting cash flows resulting from the use expected of that asset, applying the best estimates of its residual useful life and a rate that also takes into account the implicit risk of the Group’s specific business sectors. This valuation is carried out for each individual asset or for the smallest identifiable cash generating unit (CGU).
Semi-annual Interim Financial Report 2012 36

Where there is a negative difference between the values stated above and the carrying value then the asset’s carrying value is written down, while as soon as the reasons for impairment cease to exist the asset value is reversed. Write-downs and revaluations are recognised to the income statement. 3.c. Public entity grants Any grants from a public entity are recognised when there is a reasonable degree of certainty that the beneficiary company will comply with all the conditions envisaged, regardless of whether or not there is a formal resolution on awarding the grant, and the certainty that the grant will be received. Grants are recognised in the statement of financial position either as deferred income, which is recorded in the income statement on the basis of the useful life of the asset for which it has been granted, as a reduction in depreciation, or deducted directly from the asset to which they refer. Any public entity grants obtained in the form of reimbursement of expenses and costs already incurred or with the purpose of providing immediate support for the beneficiary company with no future related costs, are recognised as income in the period in which they can be claimed. 3.d. Leases (IAS 17) Lease contracts for assets where the lessee substantially assumes all the risks and benefits of ownership are classified as finance leases. Where such finance leases exist, the asset is recognised at the lower of its fair value and the present value of the minimum lease payments stipulated in the relevant contracts. The total lease payments are allocated between the liability and financial expense so as to achieve a constant rate on the financial balance outstanding. The residual lease payments, net of financial charges, are classified as borrowings. The financial charge is recognised to the income statement over the term of the lease. Assets acquired under finance leases are depreciated to an extent consistent with the nature of the asset. Lease contracts in which the lessor substantially retains the risks and benefits of ownership, on the other hand, are classified as operating leases and payments made under such leases are charged to the income statement on a straight-line basis over the term of the lease. In the event of a sale and leaseback agreement, any difference between the price of sale and the carrying value of the asset is not recognised to the income statement unless the asset itself suffers an impairment loss. 3.e. Investment property (IAS 40) An investment property is a property, either land or building – or part of a building – or both, owned by the owner or by the lessee, also through a finance lease agreement, for the purpose of receiving lease payments or to achieve a gain on the capital invested or both, rather than for the purpose of directly using it for the production or supply of goods or services or for administration of the company or for sales as part of ordinary business activities. The cost of an investment property is represented by its purchase price, improvements made, replacements and extraordinary maintenance. For self-constructed investment property an estimation is made of all costs incurred as of the date on which the construction or development was completed. Until that date the conditions of IAS 16 apply. In the event of an asset held through a finance lease contract, the initial cost is determined according to IAS 17 from the lower of the fair value of the property and the present value of the minimum lease payments due. The Group has opted for the cost method to be applied to all investment property held. According to the cost method, the estimation is made net of depreciation and any impairment losses.
Semi-annual Interim Financial Report 2012 37

At the time of disposal or in the event of permanent non-use of the assets, all related income and expenses must be recognised to the income statement. 3.f. Impairment of intangible and tangible assets (IAS 36) At least once a year the Group verifies whether the carrying value of intangible and tangible assets (including capitalised development costs) are recoverable, in order to determine whether the assets have suffered impairment. If there is such evidence, the carrying value of the asset is reduced to its recoverable value. An intangible asset with an indefinite useful life is tested for impairment every year or more frequently if there is any indication that it may have suffered impairment. When it is not possible to estimate the recoverable value of an individual asset, the Group estimates the recoverable value of the cash generating unit to which the asset belongs. The recoverable value of an asset is the higher of fair value less costs to sell and its value in use. To determine the value in use of an asset the Group calculates the present value of estimated future cash flows, applying a discount rate consistent with the cash flows, which reflects the current market estimate of the time value of money and the specific risks of the business sector. An impairment loss is recognised if the recoverable value is lower than the carrying value. If at a later date the impairment ceases to exist or is reduced, the carrying value of the asset is reversed by up to the new estimated recoverable value but cannot exceed the value which would have been determined if no impairment loss had been recognised. The reversal of an impairment loss is immediately recognised in the income statement. 3.g. Other equity investments Investments in companies where the Parent Company does not exercise a significant influence are accounted for in accordance with IAS 39 and are therefore classified as available-for-sale investments and measured at fair value or at cost if estimation of the fair value or market price is not possible. 3.h. Receivables and payables (IAS 32, 39 and 21) Receivables are recognised at amortised cost and measured at their presumed realisable value, while payables are recognised at amortised cost. Receivables and payables in foreign currencies, initially recognised at the spot rates on the transaction date, are adjusted to period-end spot exchange rates and any exchange gains and losses are recognised to the income statement (see Note 3.u. below). 3.i. Securities (IAS 32 and IAS 39) In accordance with IAS 32 and IAS 39 investments in companies other than subsidiaries and associates are classified as available-for-sale financial assets and are measured at fair value. Gains and losses resulting from fair value adjustments are recorded in a special equity reserve. When there are impairment losses or when the assets are sold, the gains and losses recognised previously to equity are transferred to the income statement. Note that purchases and sales are recognised as at the date of the transaction. This category also includes financial assets bought or issued that are classified as either held for trading or at fair value through profit and loss according to the fair value option. For a more complete description of the treatment of financial instruments we would refer readers to the note specially prepared on “Financial instruments”.
Semi-annual Interim Financial Report 2012 38

3.l. Income taxes (IAS 12) Current taxes are recognised and determined on the basis of a realistic estimate of taxable income according to current tax regulations of the country in which the company is based and taking into account any applicable exemptions and tax receivables. Deferred taxes are calculated on the basis of temporary differences, which are taxable or deductible, between the carrying values of assets and liabilities and their tax bases and are classified under non-current assets and liabilities. A deferred tax asset is recognised to the extent that it is probable that future taxable income will be available against which the deductible temporary difference can be utilised. The carrying value of deferred tax assets is subject to periodic analysis and is reduced to the extent to which it is no longer probable that there will be sufficient taxable income to allow the benefit of this deferred asset to be utilised. 3.m. Inventories (IAS 2) Inventories are recorded at the lower of purchase or production cost, calculated using the weighted average cost method, and their presumed realisable value. 3.n. Cash and cash equivalents (IAS 32 and IAS 39) Cash and cash equivalents include cash in hand, demand deposits and short-term and high-liquidity financial investments which are easily convertible into cash and which have an immaterial risk of price changes. 3.o. Equity Ordinary shares are recognised at nominal value. Costs directly attributable to the issuance of new shares are deducted from equity reserves, net of any related tax benefit. Own shares are classified in a special item which reduces the reserves; any subsequent sale, re-issuance or cancellation transaction will have no impact on the income statement but will affect only equity. Unrealised gains and losses, net of tax, on financial assets classified as “available for sale” are recorded under equity in the fair value reserve. The reserve is reversed to the income statement when the financial asset is realised or when impairment is recognised. The hedging reserve is formed when fair value changes are recognised on derivatives which, for the purposes of IAS 39, have been designated as “cash flow hedges” or as “hedges of net investments in foreign operations”. The portion of gains and losses considered “effective” is recognised to equity and is reversed to the income statement as and when the elements hedged are in turn recognised to the income statement, or when the subsidiary is sold. When a subsidiary prepares its financial statements in a currency different from the Group’s functional currency, the subsidiary’s financial statements are translated and any translation differences are recognised in a special reserve. When the subsidiary is sold the reserve is reversed to the income statement, recording any gains or losses resulting from disposal. The item “Retained earnings (losses)” includes accumulated earnings and balances transferred from other reserves when these are released from any prior limitations. This item also shows the cumulative effect of changes in accounting standards and/or the correction of errors accounted for in accordance with IAS 8.
Semi-annual Interim Financial Report 2012 39

3.p. Borrowings (IAS 32 and IAS 39) Borrowings are initially recognised at cost, represented by their fair value net of any transaction costs incurred. Subsequently the borrowings are measured at amortised cost calculated by applying the effective interest rate method, taking into consideration any issuance costs incurred and any premium or discount applied at the time the instrument is settled. 3.q. Provisions for risks and losses (IAS 37) Provisions for risks and losses refer to liabilities which are probable but where the amount and/or maturity are uncertain. They are the result of past events which will cause a future cash outflow. Provisions are recognised exclusively in the presence of a current obligation to third parties, either legal or implicit, which implies an outflow and when a reliable estimate of the amount involved can be made. The amount recognised as a provision is the best estimate of the disbursement required to settle the obligation as at the reporting date. The provisions recognised are reviewed at the close of each accounting period and adjusted to represent the best current estimate. Changes in the estimate are recognised to the income statement. When the estimated outflow relating to the obligation is expected in a time horizon longer than normal payment terms and the discount factor is significant, the provision represents the present value, discounted at a nominal risk-free rate, of the expected future outflows to settle the obligation. Contingent assets and liabilities (potential assets and liabilities, or those not recognised because no reliable estimate can be made) are not recognised. However, adequate disclosure on such items is given. 3.r. Revenues and income (IAS 18) Revenues from the sale of goods are recognised at the moment when ownership and the risks of the goods are transferred, net of returns, discounts and rebates. Service revenues are recognised at the time the service is provided, with reference to the progress status of the activity as of the reporting date. Income from dividends, interest and royalties is recognised as follows:
- dividends, when the right to receive payment is established (with a balancing entry under receivables when distribution is approved);
- interest, using the effective interest rate method (IAS 39); - royalties, on an accruals basis in accordance with the underlying contractual agreement.
3.s. Employee benefits (IAS 19) Benefits to be paid to employees on termination of their employment and other long term benefits are subject to actuarial valuation. Following this methodology, liabilities recognised represent the present value of the obligation adjusted for any actuarial gains or losses not accounted for. Italian Finance Law no. 296/2006 made important changes to employee leaving indemnity (TFR) regulations, introducing the option for workers to transfer their indemnity maturing after 1 January 2007 to selected pension schemes. Therefore employee leaving indemnity accrued as at 31 December 2006 for employees who exercised the above option, while remaining within the sphere of defined benefit plans, was
Semi-annual Interim Financial Report 2012 40

determined using actuarial methods that exclude the actuarial/financial components relating to future changes in salary. Given that this new method of calculation reduces the volatility of actuarial gains/losses the decision was made to abandon the corridor method and recognise all actuarial gains and losses to the Income Statement. Accounting standard IFRS 2 “Share-based payments” issued in February 2005 with validity as from 1 January 2005 (revised version entering into force on 1 January 2010) requires that application should be retrospective in all cases where stock options were assigned after 7 November 2002 and for which as at the date of entry into force the vesting conditions of the plans had not yet matured. In accordance with this principle the CIR Group now measures and recognises the notional cost of stock options and stock grants to the income statement under personnel costs and apportions them throughout the vesting period of the benefit, with a balancing entry in the appropriate reserve of equity. The cost of the option is determined at the assignment date of the plan applying special models and multiplying by the number of options exercisable over the reference period, this number being assessed with the aid of appropriate actuarial variables. Similarly the cost resulting from the assignment of phantom stock options is determined in relation to the fair value of the options at the assignment date and is recognised to the income statement under personnel costs throughout the vesting period of the benefit; the balancing entry, unlike for stock options, is recorded under liabilities (other personnel provisions) and not in an equity reserve. Until this liability is extinguished its fair value is recalculated at each reporting date and on the date of actual disbursement and all fair value changes are recognised to the income statement. 3.t. Derivatives (IAS 32 and IAS 39) Derivatives are measured at fair value. The Group uses derivatives mainly to hedge risks, in particular interest rate, foreign exchange and commodity price risks. Classification of a derivative as a hedge is formally documented, stating the effectiveness of the hedge. For accounting purposes hedging transactions can be classified as:
- fair value hedges – where the effects of the hedge are recognised to the income statement; - cash flow hedges – where the fair value change of the effective portion of the hedge is
recognised directly to equity while the non-effective part is recognised to the income statement.
- hedges of a net investment in a foreign operation – where the fair value change of the effective portion of the hedge is recognised directly to equity while the non-effective part is recognised to the income statement.
3.u. Foreign currency translation (IAS 21) The Group’s functional currency is the euro, and is the currency in which the financial statements are prepared. Group companies prepare their financial statements in the currencies used in their respective countries. Transactions carried out in foreign currencies are initially recognised at the exchange rate on the date of the transaction. At the reporting date monetary assets and liabilities are translated at the exchange rate prevailing on that date. Non-monetary items measured at historical cost in a foreign currency are translated using the exchange rate prevailing at the date of the transaction.
Semi-annual Interim Financial Report 2012 41

Non-monetary items measured at fair value are translated using the exchange rate at the date on which the carrying values were measured. The assets and liabilities of Group companies whose functional currency is not the euro are measured as follows: - assets and liabilities are translated using the exchange rate prevailing at the reporting date; - costs and revenues are translated using the average exchange rate for the period; Exchange rate differences are recognised directly to a special equity reserve. Should an investment in a foreign operation be sold, the accumulated exchange rate differences recognised in the equity reserve are reversed to the income statement. 3.v. Non-current assets held for sale (IFRS 5) A non-current asset is held for sale if its carrying value will be recovered principally through a sale rather than through its use. For this condition to be satisfied the asset must be immediately saleable in its present condition and a sale must be considered highly likely. Assets or groups of discontinued assets that are classified as held for sale are valued at the lower of their carrying value and expected realisation value less costs to sell. The individual assets or those which are part of a group classified as held for sale are not amortised. These assets are shown in the financial statements on a separate line in the Income Statement stating income and losses net of taxes resulting from the sale. Similarly the assets and liabilities must be shown on a separate line of the statement of financial position. 3.w. Earnings per share (IAS 33) Basic earnings per share are determined by dividing the net income attributable to ordinary shareholders of the parent company by the weighted average number of ordinary shares in circulation during the period. Diluted earnings per share are calculated by adjusting the weighted average number of ordinary shares in circulation to take into account all potential ordinary shares, for example deriving from the possible exercise of assigned stock option plans, that could have a diluting effect. 3.x. Business combinations and Goodwill Business acquisitions are recognised using the purchase and acquisition method in compliance with IFRS 3, on the basis of which the acquisition cost is equal to the fair value on the date of exchange of the assets transferred and the liabilities incurred or assumed. Any transaction costs relating to business combinations are recognised to the income statement in the period in which they are incurred. Contingent considerations are considered part of the transfer price of the net assets acquired and are measured at fair value at the acquisition date. Similarly, if the business combination agreement envisages the right to receive repayment of certain elements of the price if certain conditions are met, this right is classified as an asset by the acquirer. Any subsequent changes in this fair value are recognised as an adjustment to the original accounting treatment only if they are the result of greater or better information regarding that fair value and if they occur within twelve months of the acquisition date. All other changes must be recognised to the income statement. In the event of a step acquisition of a subsidiary, the minority interest previously held, until that moment recognised according to the terms of IAS 39 – Financial Instruments: Recognition, or according to IAS 28 – Investments in associates or according to IAS 31 – Investments in joint ventures, is treated as if it had been sold and reacquired at the date of acquisition of control. This
Semi-annual Interim Financial Report 2012 42

investment is therefore measured at its fair value on the date of “transfer” and any resulting gains and losses from such measurement are recognised to the income statement. Moreover, any amount previously recognised in equity as “Other comprehensive gains and losses”, is reversed to the income statement following the sale of the asset to which it refers. The goodwill or income (in the case of badwill) resulting from conclusion of the deal with subsequent acquisition is calculated as the sum of the price paid for the acquisition of control, the value of minority interests (measured using one of the methods permitted by the accounting standard), the fair value of the minority interest previously held, net of the fair value of the identifiable net assets acquired. The assets, potential identifiable liabilities of the acquiree which meet the conditions for recognition are recognised at their fair value as at the acquisition date. Any positive difference between the acquisition cost and the fair value of the share of net assets acquired and attributable to the Group is recognised as goodwill or, if negative, to the income statement. After initial recognition, goodwill is measured at cost less any accumulated impairment. Goodwill always refers to identified income-producing assets, the ability of which to generate income and cash flows is constantly monitored and impairment tested as appropriate. The accounting treatment of the acquisition of any further investment in companies already controlled are considered transactions with shareholders and therefore any differences between acquisition costs and the carrying value of the minority interests acquired are recognised in Group equity. Likewise, sales of minority interests not involving loss of control do not generate gains/losses but rather changes in Group equity. Initial allocation to assets and liabilities as above, using the option given in IFRS 3, can be determined provisionally by the end of the year in which the transaction is completed, and it is possible to recognise an adjustment to the values provisionally assigned on initial recognition within twelve months of the date of acquisition of control. 3.y. Use of estimates Preparation of the financial statements and the explanatory notes in application of IFRS requires management to make estimates and assumptions which affect the values of the assets and liabilities in the statement of financial position and the disclosures regarding potential assets and liabilities as at the reporting date. The estimates and assumptions used are based on experience and on other factors considered relevant. The actual results could therefore be different from these estimates. Estimates and assumptions are reviewed periodically and the effects of any changes are reflected in the income statement in the period in which the amendment is made if the review affects only that period, or in subsequent periods if the amendment affects both the current year and future periods. The items of the financial statements mainly affected by the estimation process are goodwill, deferred taxes and the fair value of financial instruments, stock options, phantom stock options and stock grants. See the specific Notes for further details.
Semi-annual Interim Financial Report 2012 43
4. Financial instruments Financial instruments take on a particular significance in the economic and financial structure of the CIR Group and for this reason, in order to give a better and clearer understanding of the financial issues involved, it was considered useful to devote a special section to accounting standards IAS 32 and IAS 39. According to IAS 32 financial instruments are classified into four categories:
a) financial instruments measured at fair value with a balancing entry in the income statement (“fair value through profit and loss” - FVTPL) in application of the fair value option and are held for trading;
b) investments held to maturity (HTM); c) loans and receivables (L&R); d) available-for-sale financial assets (AFS).
Classification depends on financial management’s intended use of the financial instrument in the business context and each involves a different measurement for accounting purposes. Financial transactions are recognised on the basis of their value date. Financial instruments at fair value through profit and loss Instruments are classified as such if they satisfy one of the following conditions: - they are held for trading; - they are a financial asset designated on adoption of the fair value option, the fair value of which
can be reliably determined. Trading generally means frequent buying and selling with the aim of generating profit on short-term price fluctuations. Derivatives are included in this category unless they are designated as hedge instruments. The initial designation of financial instruments, other than derivatives and those held for trading, as instruments at fair value through profit and loss in adoption of the fair value option is limited to instruments that meet the following conditions:
a) designation under the fair value option eliminates or significantly reduces an accounting mismatch;
b) a group of financial assets, financial liabilities or both are managed and their performance is measured on a fair value basis, in accordance with a documented investment risk management strategy; and
c) an instrument contains an embedded derivative which meets particular conditions. The designation of an individual instrument to this category is final, is made at the time of initial recognition and cannot be modified. Investments held to maturity This category includes non-derivative instruments with fixed payments or payments that can be determined and that have a fixed maturity, and which it is intended and possible to hold until maturity. These instruments are measured at amortised cost and constitute an exception to the general principle of measurement at fair value. Amortised cost is determined by applying the effective interest rate of the financial instrument, taking into account any discounts or premiums received or paid at the time of purchase, and recognising them throughout the entire life of the instrument until its maturity. Amortised cost represents the initial recognition value of a financial instrument, net of any capital repayments and any impairment, plus or minus cumulative differences between its initial value and its value at maturity calculated using the effective interest rate method.
Semi-annual Interim Financial Report 2012 44

The effective interest rate method is a calculation criterion used to assign financial charges to their related payment period. The effective interest rate is the rate that gives a correct present value to expected future cash flows until maturity, so as to obtain the net present carrying value of the financial instrument. If even one instrument in this category is sold before maturity, for a significant amount and where there is no special justification for its disposal, the tainting rule is applicable and requires that the entire portfolio of securities classified as Held To Maturity be reclassified and measured at fair value, after which this category cannot be used for the next two years. Loans and receivables This category refers to financial instruments which are not derivatives, have payments that are either fixed or can be determined, which are not listed on an active market and which are not intended to be traded. The category includes trade receivables (and payables). Measurement of these instruments, with the exception of those classified as current assets or liabilities (within 12 months), is made by applying the amortised cost method, using the effective interest rate and taking into account any discounts or premiums obtained or paid at the time of acquisition and recognising these throughout the entire life of the instrument until its maturity. Available-for-sale financial assets This is a “residual” category which includes non-derivative financial instruments that are designated as available for sale and are not included in any of the previous categories. Available-for-sale financial assets are recognised at their fair value plus any transaction costs. Gains and losses are recognised to a separate item of equity until the financial instruments are sold or suffer impairment. In such cases gains and losses accrued under equity are released to the income statement. Fair value is the price at which an asset can be traded or a liability settled in a free transaction between independent parties at arm’s length. In the case of securities listed on regulated markets, the fair value is the bid price at the close of trading on the last day of the reporting period. Where no market prices are available, fair value is determined either on the basis of the fair value of a substantially similar financial instrument or by using appropriate financial techniques (e.g. discounted cash flow). Investments in financial assets can be derecognised from the financial statements only when the contractual rights to receive their respective cash flows have expired or when the financial asset is transferred to third parties together with all associated risks and benefits. 5. Accounting standards, changes in accounting estimates and errors The criteria for making estimates and measurements are reviewed on a regular basis and are based on historical experience and on other factors such as expectations of possible future events that are reasonably likely to take place.
If the initial application of a standard affects the current or previous year this effect is shown by indicating the nature of the change, the reasons for adoption of the new standard, and the amount of any adjustments made for years prior to the reporting period.
Semi-annual Interim Financial Report 2012 45

If a voluntary change of a standard affects the current or previous year this effect is shown by indicating the nature of the change, the reasons for adoption of the new standard, and the amount of any adjustments made for years prior to the reporting period. In the event of a new standard/interpretation issued but not yet in force, an indication is given of the fact, of its potential impact, the name of the standard/interpretation, the date on which it will enter into force and the date of its first-time application. A change in accounting estimates involves an indication of the nature and the impact of the change. Estimates are used mainly to recognise impairment of assets recorded, provisions for risks, employee benefits, taxes and other provisions and reserves. Estimates and assumptions are reviewed regularly and the effects of any changes are reflected in the income statement. Lastly, the treatment of accounting errors involves an indication of the nature of the error, the amount of the adjustments to be made at the beginning of the first reporting period after their discovery.
6. Adoption of the new accounting standards, interpretations and amendments
Accounting standards, Interpretations and Amendments applied in 2012 The following accounting standards, amendments and interpretations were applied for the first time by the Group with effect from 1 January 2012. • IFRS 7 – Financial Instruments: Disclosures - the amendment published on 7 October 2010
applies to accounting periods beginning on or after 1 July 2011. The amendments were issued with the intent of improving the understanding of transfers of financial assets, including the understanding of possible effects of any residual risk for the company transferring such assets. The amendments also require further disclosure if a disproportionate amount of such transactions are executed at the end of an accounting period. The adoption of this amendment had no effect on the measurement of financial statement items.
Accounting standards, amendments and interpretations not yet applicable and not adopted early by the Group As of the date of this annual report the relevant bodies of the European Union had not yet completed the endorsement procedure necessary for adoption of the following accounting standards and amendments: • IFRS 7 – Financial Instruments: Disclosures. This amendment calls for disclosures on the effects
or potential effects of netting arrangements for financial assets and liabilities on the financial position. The amendments apply to accounting periods beginning on or after 1 January 2013 and interim periods thereafter. The disclosures must be provided retrospectively;
• IFRS 9 – On 12 November 2009 the IASB issued the standard IFRS 9 – Financial Instruments. This standard was later amended. Applicable retrospectively from 1 January 2015, this standard is the first step in a process that aims to fully replace IAS 39 and introduce new criteria for classifying and measuring financial assets and liabilities and for the derecognition of financial assets from the statement of financial position. More specifically, the new standard uses a single approach based on how financial instruments are managed and on the characteristics of the contractual cash flows of financial assets to determine how they should be measured, replacing the many different rules in IAS 39.
Semi-annual Interim Financial Report 2012 46
However for financial liabilities, the main change concerns the accounting treatment of changes in fair value of a financial liability designated as a financial liability at fair value through profit and loss, when such changes are due to a change in the credit rating of the liability in question. According to the new standard, such changes must be recognised to “Other comprehensive gains and losses” and will no longer affect the income statement;
• IAS 12 – Income taxes – the amendment issued on 20 December 2010 requires entities to measure deferred taxes resulting from an operating asset according to the way in which the carrying value of the asset will be recovered (through continuing use or through a sale). As a result of this amendment SIC-21 – Income taxes – Recoverability of a non-depreciable asset at revaluation will no longer apply. The amendment will apply retrospectively from 1 January 2012;
• IFRS 10 - Consolidated Financial Statements. This new standard replaces SIC 12 Consolidation - Special Purpose Entities and parts of IAS 27 - Consolidated and Separate Financial Statements, which will be renamed Separate Financial Statements and govern the accounting treatment of investments in the separate financial statements. The new standard is based on existing standards, identifying the concept of control as the determining factor for consolidation of a company in the consolidated financial statements of the parent company. It also provides guidance on determining the existence of control where this is difficult to ascertain. Application of the standard will be retrospective from 1 January 2013;
• IFRS 11 – Joint arrangements, due to replace IAS 31 – Interests in joint ventures and SIC-13 – Jointly controlled entities – Non-monetary contributions by venturers. The new standard provides criteria to identify joint arrangements based on rights and obligations deriving from agreements rather than their legal format, and establishes that the only accounting method for jointly controlled ventures in the consolidated financial statements is the equity method. Application of the standard will be retrospective from 1 January 2013. After the issue of IAS 28 - Investments in associates, it was amended to also include investments in joint ventures in its scope of application, from entry into force of the standard;
• IFRS 12 – Disclosure of interests in other entities, a new and complete standard on disclosures on all investment types, including investments in subsidiaries, joint ventures, associates, special purpose entities and other unconsolidated vehicles. Application of the standard will be retrospective from 1 January 2013;
• IFRS 13 – Fair value measurement, which clarifies how to measure fair value for financial statements purposes and applies to all IFRS that require or allow fair value measurement or the presentation of information based on fair value. Application of the standard will be retrospective from 1 January 2013.
• IAS 1 – Presentation of financial statements, requiring that companies group all their "Other
comprehensive income” (OCI) components according to whether or not they can later be reclassified to the income statement. The amendment applies to financial years beginning on or after 1 July 2012;
• IAS 19 – Employee benefits, which eliminates the option of different recognition of actuarial gains and losses using the corridor method, requiring the presentation of fund surplus or deficit in the statement of financial position, recognition in the income statement of cost components associated with employee service and net financial charges, and the recognition of actuarial gains and losses from re-measurement of assets and liabilities in “Other comprehensive income” (OCI). In addition, the return on assets included under net financial charges will have to be calculated according to the discount rate for the liability and no longer on estimated returns. Lastly, the amendment introduces new disclosures to be provided in the notes to the
Semi-annual Interim Financial Report 2012 47
financial statements. Application of the standard will be retrospective from the year beginning 1 January 2013;
• IAS 32 - Financial Instruments: Presentation clarifies the application of certain criteria for the offsetting of financial assets and liabilities referred to in IAS 32. The amendments will apply retrospectively to accounting periods beginning on or after 1 January 2014.
• IFRS 1 - “Government Loans”. On March 13, 2012 the IASB issued the document “Government Loans – Amendments to IFRS 1” that mirror the requirements for existing IFRS preparers in relation to the application of amendments made to IAS 20 Accounting for Government Grants and Disclosure of Government Assistance in relation to accounting for government loans. First-time adopters of IFRSs are permitted to apply the requirements in paragraph 10A of IAS 20 only to new loans entered into after the date of transition to IFRSs. However, if it did not, under its previous GAAP, recognise and measure a government loan at a below-market rate of interest on a basis consistent with IFRS requirements, it would be permitted to apply the previous GAAP carrying amount of the loan at the date of transition as the carrying amount of the loan in the opening IFRS statement of financial position. Applicable to annual periods beginning on or after 1 January 2013
Annual Improvements 2009-2011 Cycle Makes amendments to the following standards:
• IFRS 1 — Permit the repeated application of IFRS 1; • IAS 1 — Clarification of the requirements for comparative information; • IAS 8 — Change in the accounting valuation • IAS 16 — Classification of servicing equipment; • IAS 32 — Clarify that tax effect of a distribution to holders of equity instruments should be
accounted for in accordance with IAS 12 Income Taxes; • IAS 34 — Clarify interim reporting of segment information for total assets in order to
enhance consistency with the requirements in IFRS 8 Operating Segments. Applicable to annual periods beginning on or after 1 January 2013 Consolidated Financial Statements, Joint Arrangements and Disclosure of Interests in Other Entities: Transition Guidance Amends IFRS 10 Consolidated Financial Statements, IFRS 11 Joint Arrangements and IFRS 12 Disclosure of Interests in Other Entities to provide additional transition relief in by limiting the requirement to provide adjusted comparative information to only the preceding comparative period. Also, amendments to IFRS 11 and IFRS 12 eliminate the requirement to provide comparative information for periods prior to the immediately preceding period. Applicable to annual periods beginning on or after 1 January 2013. The adoption of these amendments is not expected to have significant effects on the financial statements of the Group.
Semi-annual Interim Financial Report 2012 48

NOTES ON THE BALANCE SHEET
7. NON-CURRENT ASSETS
7.a. INTANGIBLE ASSETS
Historical Accum. amort. Net balance Acquisitions Exch. Rate Other Net Amort. Historical Accum. amort. Balancecost and writedowns 31.12.2011 differences changes disposals and writedowns cost and writedowns 30.06.2012
(in thousands of euro) increases decreases costStart-up and expansion costs 69 (63) 6 -- -- -- -- -- (1) -- 68 (63) 5 Capitalized development costs - purchased -- -- -- -- -- -- -- -- -- -- -- -- -- - produced internally 105,233 (57,635) 47,598 11,534 -- -- (104) 1,176 -- (6,687) 117,069 (63,552) 53,517 Industrial patents and intellectualproperty rights 14,326 (9,095) 5,231 1,605 -- -- 1 629 -- (1,357) 16,566 (10,457) 6,109 Concessions, licenses, trademarks & similar rig 119,825 (86,733) 33,092 2,992 9 552 (1) (6,845) 123,237 (93,438) 29,799 Titles and trademarks 400,245 -- 400,245 -- -- -- -- -- -- -- 400,245 -- 400,245 Frequencies 222,011 -- 222,011 -- -- -- -- -- -- 222,011 -- 222,011 Goodwill 744,740 (54,693) 690,047 4,201 -- 14 7 (391) 748,054 (54,176) 693,878 Assets in process & advance payments - purchased 75,922 (25,204) 50,718 50,165 -- -- (12) (60,877) (663) -- 39,331 -- 39,331 - produced internally 5,471 (36) 5,435 2,384 -- -- (52) (242) -- (31) 7,560 (66) 7,494 Other 56,310 (10,148) 46,162 6,185 -- -- (8) (637) (31) (14,741) 49,905 (12,975) 36,930 Total 1,744,152 (243,607) 1,500,545 79,066 -- -- (152) (59,392) (1,087) (29,661) 1,724,046 (234,727) 1,489,319
Intagible assets rose from € 1.500.545 thousand at December 31 2011 to € 1.489.319 thousand at June 30 2012.
Closing PositionCombinations
sales of businesses
Opening Position Changes in the period
Semi-annual Interim Financial Report 2012 49

Amortisations Rates
Description
% Capitalised development costs 20-33% Industrial patents and intellectual property rights 4-20% Concessions, licenses, trademarks and similar rights 16-30% Other intangible assets 16-30% Goodwill, trademarks and other assets with an indefinite useful life A more detailed analysis of the main items making up intangible assets with an indefinite useful life is given in the following charts. Titles and trademarks:
(in thousands of euro) 30.06.2012 31.12.2011
la Repubblica 229,952 229,952 Il Piccolo / Messaggero Veneto 104,527 104,527 Local newspapers 61,222 61,222 Other titles and trademarks 4,544 4,544 Total 400,245 400,245 Frequencies:
(in thousands of euro) 30.06.2012 31.12.2011
Radio frequencies 83,728 83,728 Television frequencies 138,283 138,283 Total 222,011 222,011 Goodwill:
(in thousands of euro) 30.06.2012 31.12.2011
Utilities sector (Sorgenia Group) 258,360 254,159 Media sector (L’Espresso Group) 140,337 140,337 Healthcare sector (KOS Group) 166,544 166,914 Automotive components sector (Sogefi Group) 128,637 128,637 Total 693,878 690,047
In detail, goodwill was allocated to the cash generating units (“CGUs”) identified according to the operating segments of the Group. The chart above shows the allocation of goodwill by operating segment of the Group. For the purpose of impairment testing of goodwill and other intangible assets with an indefinite useful life, the estimated recoverable value of each cash generating unit, defined in accordance with the terms of IAS 36 - also considering the guidelines of the consultation document issued by the OIV - was based on value in use, i.e. fair value less costs to sell. Value in use was calculated by discounting to present value future cash flows generated by the unit in the production phase and at the time of its disposal, using an appropriate discount rate (discounted cash flow method). More specifically, in accordance with international accounting standards, to test the value, cash flows were considered without taking into account inflows and outflows generated by financial management or any cash flows relating to tax management. The cash flows to be discounted are therefore operating cash flows, unlevered and differential (as they refer to individual units).
Semi-annual Interim Financial Report 2012 50

The cash flows of the single operating units were extrapolated from the budgets and forecasts made by management. These plans were then processed on the basis of economic trends recorded in previous years and using the forecasts made by leading analysts on the outlook for the respective markets and more in general on the evolution of each business sector. To correctly estimate the value in use of a Cash Generating Unit, it was necessary to assess the amount of expected future cash flows of the unit, any changes expected in the amount and timing of the flows, the discount rate to be used and any other risk factors affecting the specific unit. In order to determine the discount rate to be used, an estimate was made of the weighted average cost of capital invested (WACC) at sector level, regardless of the financial structure of the individual company/subgroup. More specifically, the discount rate used for the media sector was determined gross of tax (pre-tax WACC) while for the other sectors after-tax WACC was used, thus consistently expressing the future cash flows in such cases. The fair value less costs to sell of an asset or a group of assets (e.g. a Cash Generating Unit) is best expressed in the “made” price in a binding sale agreement between independent parties, net of any direct disposal costs. If this information was not available, the fair value net of costs to sell was determined in relation to the following trading prices, in order of importance: • the current price traded on an active market; prices for similar transactions executed
previously; • the estimated price based on information obtained by the company. For estimating the recoverable value of each asset the higher of fair value less costs to sell and value in use was used. For a detailed description of the analyses conducted, please refer to the 2011 financial statements. For a detailed description of the impairment test, see the content of the Annual Report and Financial Statements for the year ended December 31 2011, which confirmed that the amounts recognized in the accounts were appropriate. At 30 June 2012, in view of the performance of sales and of the margins of the CGU in the first half of 2012 even in relation to budget, no indication had emerged that could question the validity of the impairment test and the adequacy of the values recognized.
Semi-annual Interim Financial Report 2012 51

Historical Accum. Deprec. Net balance Acquisitions Capitalized Exch. rate Other Net Deprec.& Historical Accum. deprec. BalanceCost & writedowns 31.12.2011 financial differences Changes disposals writedowns cost and writedowns 30.06.2012
(in thousands of euro) increase decrease expense costLand 73,222 (320) 72,902 1,095 -- -- -- (47) 305 -- -- 75,160 (905) 74,255 Buildings used for business 431,705 (137,288) 294,417 30,609 -- -- -- (204) 12,317 (3) (8,221) 475,647 (146,732) 328,915 Plant and machinery 2,313,434 (853,414) 1,460,020 27,389 -- -- -- (624) 415,849 (8,827) (69,904) 2,744,467 (920,564) 1,823,903 Industrial & commercial equipment 136,341 (107,285) 29,056 3,682 -- -- -- (35) 6,832 (81) (3,670) 146,589 (110,805) 35,784 Other Assets 253,621 (187,265) 66,356 4,657 -- -- -- (76) 2,708 (75) (8,400) 258,756 (193,586) 65,170 Assets under construction & advance pay 479,523 (1,740) 477,783 33,918 -- -- (110) (415,783) (1,117) -- 95,385 (694) 94,691 Total 3,687,846 (1,287,312) 2,400,534 101,350 -- -- -- (1,096) 22,228 (10,103) (90,195) 3,796,004 (1,373,286) 2,422,718
Description %
Building used for business 3.00%Plant and machinery 10,00-25,00%
Other assets
- Electronic office equipment 20,00%- Furniture and fittings 12,00%- Motor vehicles 25,00%
7.b. TANGIBLE ASSETS
DEPRECIATION RATES
Closing positionCombinations
sales of businesses
Opening Position Changes in the period
Tangible assets rose from € 2.400.534 thousand at December 31 2011 to € 2.422.718 thousand at June 30 2012, mainly for the acquisitions and for the depreciation of the period.
Semi-annual Interim Financial Report 2012 52
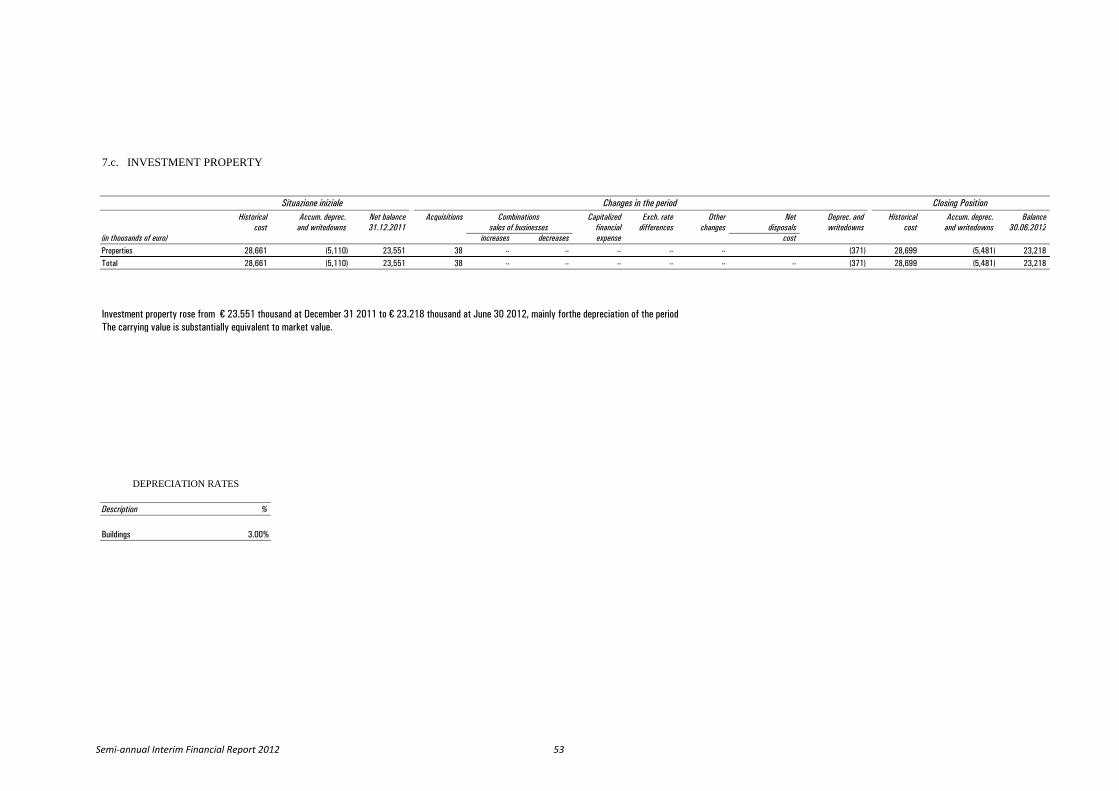
Historical Accum. deprec. Net balance Acquisitions Capitalized Exch. rate Other Net Deprec. and Historical Accum. deprec. Balancecost and writedowns 31.12.2011 financial differences changes disposals writedowns cost and writedowns 30.06.2012
(in thousands of euro) increases decreases expense costProperties 28,661 (5,110) 23,551 38 -- -- -- -- -- (371) 28,699 (5,481) 23,218 Total 28,661 (5,110) 23,551 38 -- -- -- -- -- -- (371) 28,699 (5,481) 23,218
Investment property rose from € 23.551 thousand at December 31 2011 to € 23.218 thousand at June 30 2012, mainly forthe depreciation of the periodThe carrying value is substantially equivalent to market value.
7.c. INVESTMENT PROPERTY
Closing Position
sales of businesses
Situazione inizialeCombinations
Changes in the period
Description %
Buildings 3.00%
DEPRECIATION RATES
Semi-annual Interim Financial Report 2012 53

Leasing The position of assets under lease as of 30 June 2012 and 31 December 2011 and of restrictions applied to tangible assets on account of guarantees and commitments is as follows: (in thousands of euro) Gross leasing amount Accumulated depreciation Restrictions for
guarantees and commitments 30.06.2012 31.12.2011 30.06.2012 31.12.2011 30.06.2012 31.12.2011
Land 1,487 1,487 -- -- 6,618 5,718 Buildings 43,673 43,592 8,522 7,599 252,792 211,974 Plant and machinery 105,575 105,500 16,280 13,450 1,613,044 1,240,050 Other assets 10,430 10,445 3,007 2,170 15,256 9,420 Assets in progress and advance payments
-- --
-- --
8,836 400,710
7.d. Investments in companies consolidated at equity
(in thousands of euro) % Balance Increases Decreases Dividends Share of result Other Balance 31.12.2011 Loss Income changes 30.06.2012 Tirreno Power S.p.A. 39.00 292,287 -- (7,214) -- (2,285) -- (7,214) 282,788 Le Scienze S.p.A. 50.00 304 -- -- (233) -- 107 -- 178 Editoriale Libertà S.p.A. 35.00 24,822 -- -- (525) -- 322 -- 24,619 Editoriale Corriere di Romagna S.r.l.
49.00 2,986 -- -- -- -- 1 -- 2,987
Altrimedia S.p.A. 35.00 745 -- -- (70) -- 41 -- 716 Fin Gas S.r.l. 50.00 7,678 524 -- -- (69) -- -- 8,133 Saponis Investments SP Zoo 26.76 6,679 -- (282) -- (907) -- -- 5,490 PAF Agricola S.r.l. 50.00 163 -- -- -- (11) -- -- 152 Gica SA 25.00 - 387 -- -- (387) -- -- -- Volterra A.E. 50.00 2,728 -- -- -- (184) -- -- 2,544 Mark IV Asset (Shanghai) Auto Parts Co. Ltd. 50.00 303 -- -- -- -- 9 312 Sorgenia France Production S.A. 50.00 46,943 2 (238) -- (1,187) 1,119 -- 46,639 LLIS – Lake Leman International School S.A. 49.36 615 -- -- -- (623) -- 8 --
Swiss Education Group AG 19.54 - -- -- -- -- 166 13,300 13,466 Total 386,253 913 (7,734) (828) (5,653) 1,756 13,317 388,024
7.e. Other equity investments (in thousands of euro) % 30.06.2012 31.12.2011
Ansa S. Coop. A.R.L. 18.48 2,209 2,209
Tecnoparco Valbasento 20.00 1,266 516
Emittenti Titoli S.p.A. 5.44 132 132
Swiss Education Group AG 19.54 -- 14,035
Agriterra Ltd. 8.30 -- 2,973
Other -- 3,061 3,038
Total 6,668 22,903
It should be remembered that as from this abbreviated consolidated semi-annual report the company Swiss Education Group SAS is being consolidated using the equity method.
Semi-annual Interim Financial Report 2012 54

The values of investments indicated in the financial statements correspond to cost, less any impairment where applicable, and are considered to be substantially equivalent to the fair value of the investments. 7.f. Other receivables “Other receivables” at 30 June 2012 amounted to € 248,177 thousand, compared to € 247,079 thousand at 31 December 2011. At 30 June 2012, this item also included € 84,085 thousand (€ 93,008 thousand at 31 December 2011) in receivables (unsecured and mortgage-based) of the securitisation companies Zeus Finance S.r.l. and Urania Finance S.A., € 72,336 thousand (€ 60,717 thousand at 31 December 2011) of tax receivables corresponding to the value of CO2 rights that should have been assigned to the Sorgenia Group, for the installations which came onto stream as from 2010, but which do not fall within the national plan for the free assignment of the rights in question. In order not to create discriminatory treatment among the various market operators, a regulatory measure was issued that recognised a credit to these operators equal to the value of CO2 rights not assigned. The increase in the balance therefore relates to the valorisation of the CO2 rights not assigned for 2011 and for the first half of 2012, which will be reimbursed as from 2013 via auction mechanisms. This item also includes € 6,838 thousand (€ 8,743 thousand at 31 December 2011) in security deposits paid as guarantees to wind farm suppliers. 7.g. Securities “Securities” amounted to € 123,042 thousand at 30 June 2012, compared to € 107,321 thousand at 31 December 2011 and refer mainly to investments in private equity funds and minority holdings. These investments were measured at fair value recognizing to the fair value reserve an amount, net of tax, of € 10,280 thousand (€ 10,105 thousand at 31 December 2011). The remaining commitment for investments in private equity funds at 30 June 2012 stood at approximately € 13.7 million. 7.h. Deferred taxes The tax amounts resulting from deductible temporary differences and retained losses are deemed recoverable.
Semi-annual Interim Financial Report 2012 55

The breakdown of “Deferred tax assets and liabilities” by type of temporary difference, is as follows:
(in thousands of euro) 30.06.2012 31.12.2011 Difference Amount of tax Difference Amount of tax
Temporary differences - deductible from: - write-down of current assets 169,621 54,909 167,712 54,111 - write-down of fixed assets 60,577 18,702 43,808 14,761
- revaluation of current liabilities 20,849 6,499 16,134 5,198
- revaluation of personnel provisions 48,583 14,983 47,713 14,554
- revaluation of provisions for risks and losses 110,088 35,968 89,743 28,941
- revaluation of long-term debt 8,614 1,841 33,892 8,267
- write-down of financial instruments 80,054 33,288 96,083 30,330
- tax losses from previous periods 396,366 89,401 351,998 75,176
Total deferred tax assets 894,752 255,591 847,083 231,338
Temporary differences - taxable from: - revaluation of current assets 1,404 450 982 334 - revaluation of fixed assets 535,791 166,114 522,989 162,345
- write-down of current liabilities 25,474 7.741 21,019 6,313
- valuation of personnel provisions 23,846 6,259 22,639 5,991
- write-down of provisions for risks and losses 651 193 725 217
- revaluation of financial instruments 7,825 2,515 7,736 2,498
Total deferred tax liabilities 594,991 183,272 576,090 177,698
Net deferred taxes 72,319 53,640
Previous periods' losses not used in the deferred tax calculation refer to CIR International for approximately € 427 million that can be carried forward indefinitely, and to other Group companies for approximately € 36 million. Note that deferred tax assets were not recognised on these losses as at present there are no grounds to consider their recoverability as certain. The changes in “Deferred tax assets and liabilities” during the year were as follows:
Use of Deferred taxes Balance at deferred taxes generated Exchange Balance at (in thousands of euro) 31.12.2011 from previous periods in the period differences 30.06.2012 Deferred tax assets: - income statement 203,378 (7,387) 17,862 (422) 213,431 - equity 27,960 (545) 8,899 5,846 42,160
Deferred tax liabilities: - income statement (154,262) 461 (4,543) (845) (159,189) - equity (23,436) 330 (977) -- (24,083) Net deferred taxes 53,640 72,319
Semi-annual Interim Financial Report 2012 56
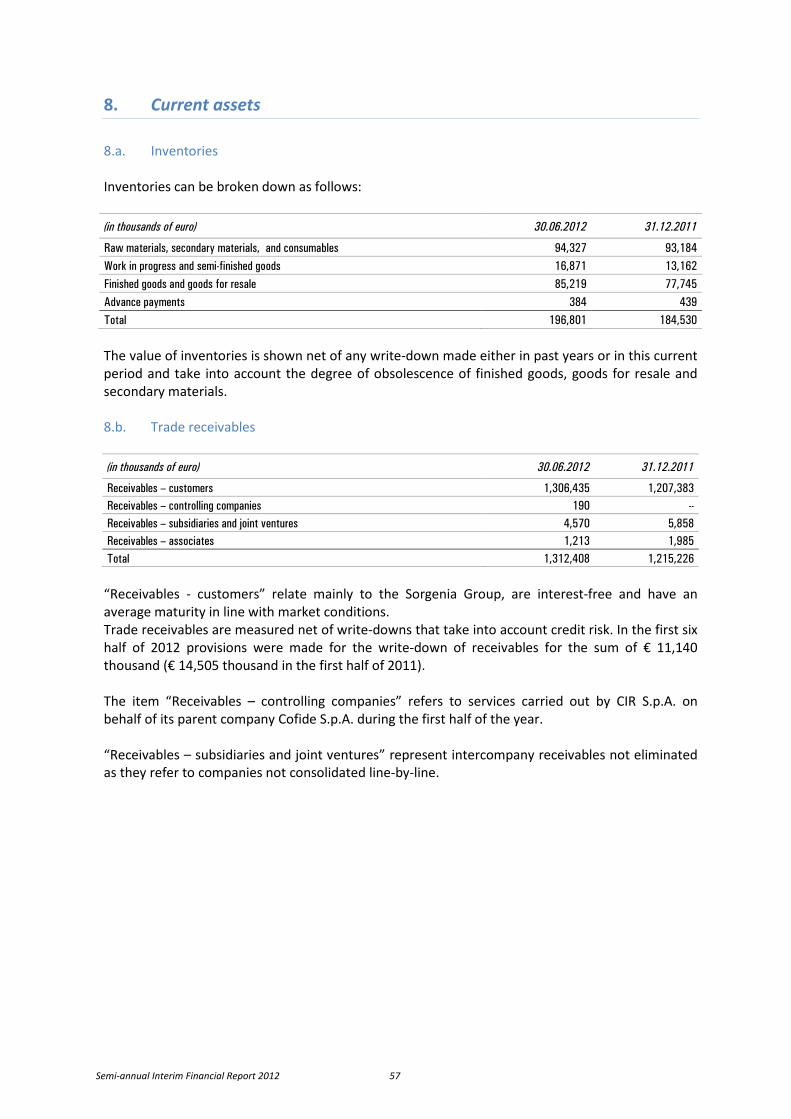
8. Current assets
8.a. Inventories Inventories can be broken down as follows: (in thousands of euro) 30.06.2012 31.12.2011
Raw materials, secondary materials, and consumables 94,327 93,184 Work in progress and semi-finished goods 16,871 13,162 Finished goods and goods for resale 85,219 77,745 Advance payments 384 439 Total 196,801 184,530 The value of inventories is shown net of any write-down made either in past years or in this current period and take into account the degree of obsolescence of finished goods, goods for resale and secondary materials. 8.b. Trade receivables (in thousands of euro) 30.06.2012 31.12.2011
Receivables – customers 1,306,435 1,207,383 Receivables – controlling companies 190 -- Receivables – subsidiaries and joint ventures 4,570 5,858 Receivables – associates 1,213 1,985 Total 1,312,408 1,215,226
“Receivables - customers” relate mainly to the Sorgenia Group, are interest-free and have an average maturity in line with market conditions. Trade receivables are measured net of write-downs that take into account credit risk. In the first six half of 2012 provisions were made for the write-down of receivables for the sum of € 11,140 thousand (€ 14,505 thousand in the first half of 2011). The item “Receivables – controlling companies” refers to services carried out by CIR S.p.A. on behalf of its parent company Cofide S.p.A. during the first half of the year. “Receivables – subsidiaries and joint ventures” represent intercompany receivables not eliminated as they refer to companies not consolidated line-by-line.
Semi-annual Interim Financial Report 2012 57

8.c. Other receivables (in thousands of euro) 30.06.2012 31.12.2011
Receivables – subsidiaries and joint ventures 1,049 2,565 Receivables – associates 38 38 Tax receivables 140,805 121,860 Other receivables 185,346 145,352 Total 327,238 269,815 The item “Other receivables” includes € 101,829 thousand (€ 74,669 thousand at 31 December 2011) relating to the fair value measurement of commodity derivatives of the Sorgenia group. 8.d. Financial receivables “Financial receivables” rose from € 11,956 thousand at 31 December 2011 to € 27,723 thousand at 30 June 2012 and mainly include € 6,960 thousand referring to a Euro Commercial Paper subscribed by the subsidiary CIR Investimenti S.p.A., maturing November 2012, € 4,137 thousand for the temporary use of the liquidity of the subsidiary CIR International S.A. maturing in July 2012 and € 11,562 thousand, within the sphere of the Sogefi Group, for an amount receivable from the German federal authorities for a withholding subject to immediate reimbursement. The reimbursement took place during the first few days of July. 8.e. Securities This item contains the following classes of securities: (in thousands of euro) 30.06.2012 31.12.2011
Italian Government securities or similar 6,264 5,911
Investment funds and similar funds 211,749 193,143
Bonds 332,339 348,097
Certificates of deposit and other securities 61,904 66,726
Total 612,256 613,877
The fair value measurement of the item “securities” involved a positive adjustment to the income statement of € 8 million. 8.f. Available for sale financial assets This item totals € 131,096 thousand and refers for € 84,258 thousand to shares in hedge funds and redeemable shares in asset management companies held by CIR International S.A.. The investment marketability is based on the funds’ redemption timing, normally between one and three months. The fair value measurement of these funds involved a total value adjustment of € 10,322 thousand (€ 7,291 thousand at 31 December 2011). The item also includes € 46,838 thousand of bonds held by the Espresso group which mature between 3 June 2013 and 20 October 2014. The negative effects of the change in these bonds on CIR’s equity for the part pertaining to the group and net of tax amounted to € 344 thousand.
Semi-annual Interim Financial Report 2012 58
8.g. Cash and cash equivalents Cash and cash equivalents declined from € 494,006 thousand at 31 December 2011 to € 392,922 thousand at 30 June 2012. A breakdown of the changes during the period is given in the statement of cash flow. 8.h. Assets and liabilities held for disposal The item refers to assets held for disposal within the sphere of the Sorgenia Group and in particular the E&P licence of Orlando, whose envisaged sale presents the requisites so that the same can be classified in this item. The balance at 31 December 2011 referred to the assets held for disposal within the sphere of the Kos Group and the Sogefi Group. For the Sogefi group in particular, since the building is no longer expected to be sold in the next 12 months, it has been reclassified in the item “Tangible assets” and depreciation has now been resumed.
9. Equity 9.a. Share Capital The share capital increased from € 396,665,733.50 at 31 December 2011 (comprising 793,331,467 shares with a par value of € 0.5 each) to € 396,670,233.50 (793,340,467 shares) at 30 June 2012 due to the issue of 9,000 shares resulting from the exercise of stock option plans. As of 30 June 2012, the company had 49,989,000 own shares (6.3% of share capital) for a total value of € 108,340 thousand, unchanged from 31 December 2011. In application of IAS 32, the own shares held by the Parent Company of the Group are deducted from equity. On this subject, for the sake of clarity, the nominal value of the shares held was deducted directly from the amount of share capital issued. The share capital is fully subscribed and paid up. None of the shares are subject to any rights, privileges or limitations on the distribution of dividends, with the exception of own shares. It should be noted that for a period of five years from 30 April 2009 the Board of Directors was authorised to increase the share capital once or more by a maximum € 500 million (nominal value) and for a further maximum of € 20 million (nominal value) in favour of employees of the company, its subsidiaries and parent companies. Regarding stock option and stock grant plans at 30 June 2012, there were 47,349,600 options outstanding, corresponding to an equal number of shares. The total notional cost of the stock option and stock grant plans assigned to employees, which was posted to a special equity reserve, totalled € 1,311 thousand at 30 June 2012.
Semi-annual Interim Financial Report 2012 59

9.b. Reserves The evolution and breakdown of the item “Reserves” are as follows: (in thousands of euro) Share Legal Fair value Translation Reserve for Stock option Other Total premium reserve reserve reserve own shares reserve reserves reserves reserve held
Balance at 31 December 2010 34,130 115,969 29,747 1,038 21,537 15,007 104,495 321,923 Capital increases 645 -- -- -- -- -- -- 645 Unclaimed dividends as per Art. 23. of the Articles of Association -- -- -- -- -- -- 15 15 Fair value measurement of hedging instruments -- -- (32,762) -- -- -- -- (32,762)
Fair value measurement of securities -- -- (13,007) -- -- -- -- (13,007) Securities fair value reserve recognized to income statement -- -- (307) -- -- -- -- (307) Adjustment for own share transactions -- -- -- -- 3,458 -- -- 3,458 Movements between reserves -- -- -- -- -- (1,072) -- (1,072) Notional cost of stock options and stock grants credited -- -- -- -- -- 4,370 -- 4,370 Effects of changes in equity of subsidiaries -- -- 79 49 -- -- 7,984 8,112 Currency translation differences -- -- 215 1,425 -- -- -- 1,640
Balance at 31 December 2011 34,775 115,969 (16,035) 2,512 24,995 18,305 112,494 293,015 Capital increases 5 -- -- -- -- -- -- 5 Unclaimed dividends as per Art. 23. of the Articles of Association -- -- -- -- -- -- -- -- Fair value measurement of hedging instruments -- -- (11,668) -- -- -- -- (11,668)
Fair value measurement of securities -- -- 2,719 -- -- -- -- 2,719 Securities fair value reserve recognized to income statement -- -- 1,502 -- -- -- -- 1,502 Adjustment for own share transactions -- -- -- -- -- -- -- -- Movements between reserves -- -- -- -- -- (24) -- (24) Notional cost of stock options and stock grants credited -- -- -- -- -- 1,311 -- 1,311 Effects of changes in equity of subsidiaries -- -- 54 4 -- -- 2,689 2,747 Currency translation differences -- -- 48 1,086 -- -- -- 1,134
Balance at 30 June 2012 34,780 115,969 (23,380) 3,602 24,995 19,592 115,183 290,741
The “Share premium reserve” totalled € 34,780 thousand at 30 June 2012, compared with € 34,775 thousand at 31 December 2011. The change was due to the subscription of the stock option plans for € 5 thousand. The “Fair value reserve” net of tax effects was negative for € 23,380 thousand and refers on the up side to the € 10,280 thousand measurement of “Securities” under item 7.g. and € 9,978 thousand to the measurement of “Available-for-sale financial assets” under item 8.f. and, on the down side, € 43,637 thousand to the measurement of hedges and € 1 thousand to the valuation of “Securities” under item 8.e.. The “Translation reserve” had a balance of € 3,602 thousand at 30 June 2012 with the following breakdown:
Semi-annual Interim Financial Report 2012 60
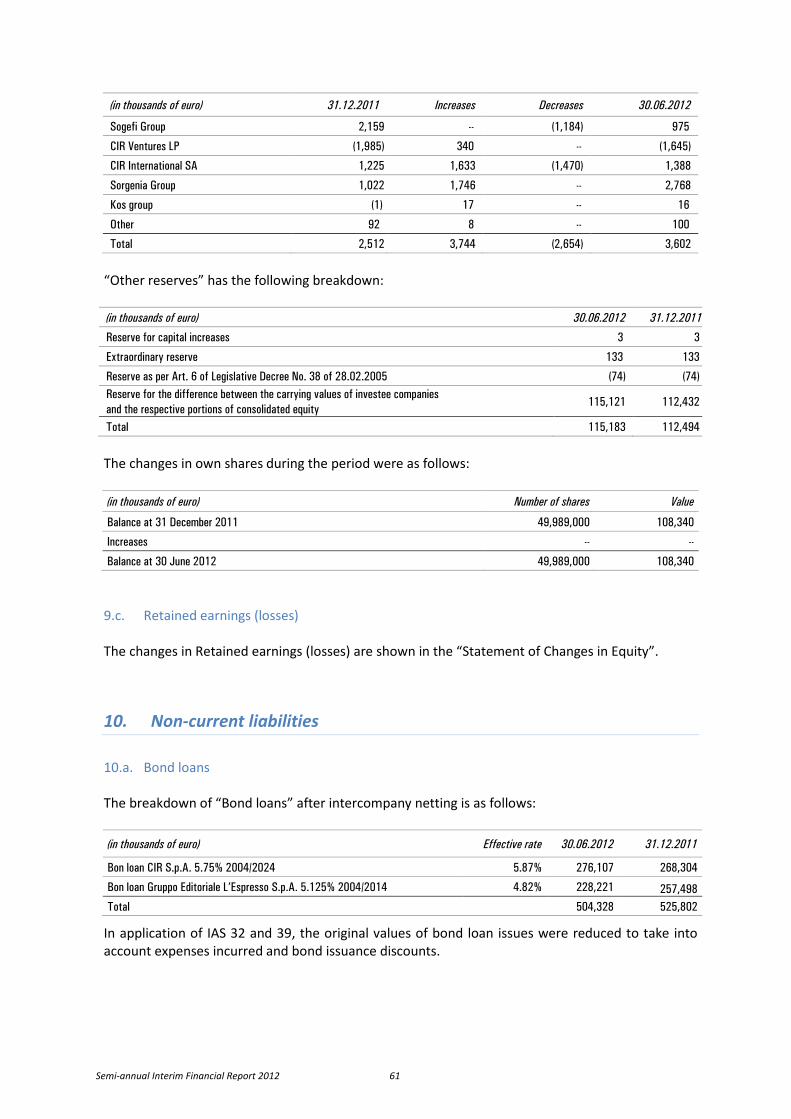
(in thousands of euro) 31.12.2011 Increases Decreases 30.06.2012
Sogefi Group 2,159 -- (1,184) 975
CIR Ventures LP (1,985) 340 -- (1,645)
CIR International SA 1,225 1,633 (1,470) 1,388
Sorgenia Group 1,022 1,746 -- 2,768
Kos group (1) 17 -- 16
Other 92 8 -- 100
Total 2,512 3,744 (2,654) 3,602
“Other reserves” has the following breakdown: (in thousands of euro) 30.06.2012 31.12.2011
Reserve for capital increases 3 3
Extraordinary reserve 133 133
Reserve as per Art. 6 of Legislative Decree No. 38 of 28.02.2005 (74) (74) Reserve for the difference between the carrying values of investee companies and the respective portions of consolidated equity
115,121 112,432
Total 115,183 112,494
The changes in own shares during the period were as follows: (in thousands of euro) Number of shares Value
Balance at 31 December 2011 49,989,000 108,340
Increases -- --
Balance at 30 June 2012 49,989,000 108,340
9.c. Retained earnings (losses) The changes in Retained earnings (losses) are shown in the “Statement of Changes in Equity”.
10. Non-current liabilities 10.a. Bond loans The breakdown of “Bond loans” after intercompany netting is as follows: (in thousands of euro) Effective rate 30.06.2012 31.12.2011
Bon loan CIR S.p.A. 5.75% 2004/2024 5.87% 276,107 268,304
Bon loan Gruppo Editoriale L’Espresso S.p.A. 5.125% 2004/2014 4.82% 228,221 257,498 Total 504,328 525,802
In application of IAS 32 and 39, the original values of bond loan issues were reduced to take into account expenses incurred and bond issuance discounts.
Semi-annual Interim Financial Report 2012 61

During the first half of 2012, a nominal € 28,818 thousand of the Gruppo Editoriale L’Espresso 2004/2014 bond loan was acquired and subsequently cancelled. At 30 June 2012 CIR International held a nominal € 30,000 thousand, unchanged from 31 December 2011, of the CIR 5.75% 2004/2024 bond loan. 10.b. Other borrowings (in thousands of euro) 30.06.2012 31.12.2011
Collateralised bank loans 96,255 117,414
Other bank loans 1,784,259 1,867,392
Leases 123,028 123,279
Other payables 96,109 89,252
Total 2,099,651 2,197,337
“Other bank loans” mainly refer to Sorgenia group loans for € 1,640,598 thousand, Sogefi group loans for € 133,155 thousand and Kos group loans for € 9,945 thousand. 10.c. Personnel provisions The breakdown of these provisions is as follows: (in thousands of euro) 30.06.2012 31.12.2011
Employee leaving indemnity (TFR) 86,103 88,614
Pension funds and similar obligations 36,136 35,152
Total 122,239 123,766
(in thousands of euro) 30.06.2012 31.12.2011
Opening balance 123,766 124,343
Provisions for service during the period 10,855 24,555
Increases for financial interest 2,573 5,540
Actuarial gains or losses 82 (17)
Benefits paid (6,199) (15,108)
Increases or decreases due to changes in the consolidation area ---- 102
Other changes (8,838) (15,649)
Closing balance 122,239 123,766
Semi-annual Interim Financial Report 2012 62
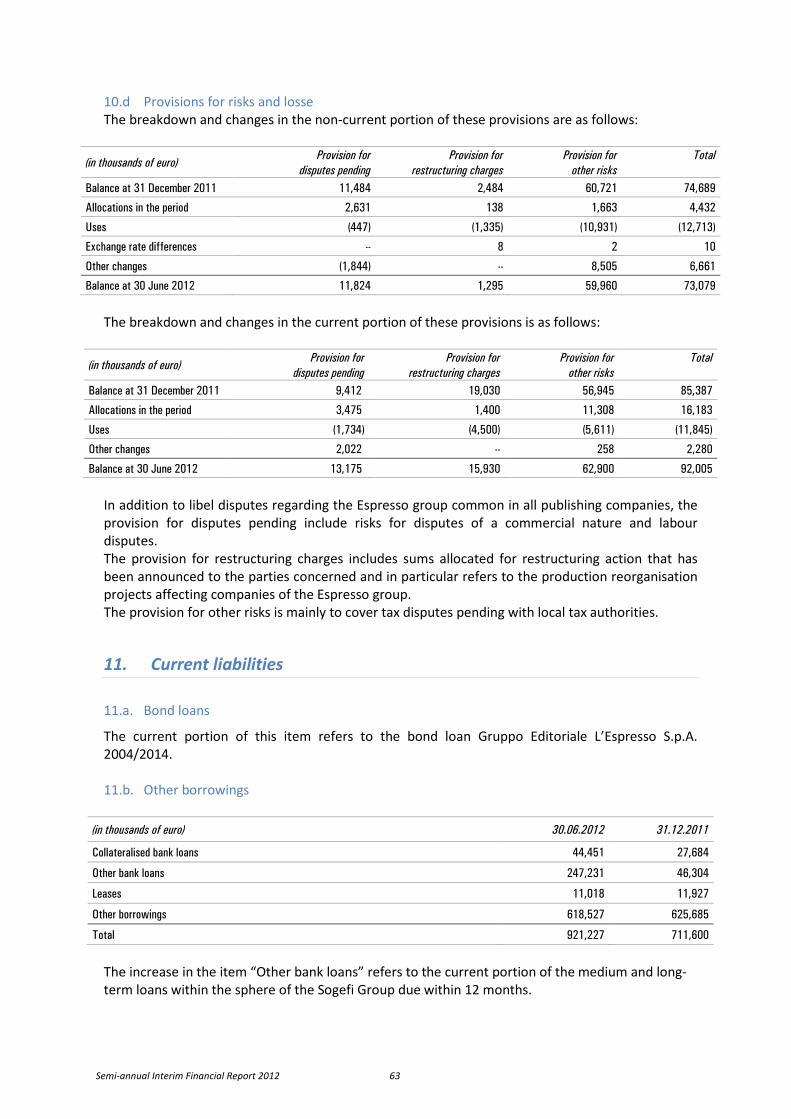
10.d Provisions for risks and losse The breakdown and changes in the non-current portion of these provisions are as follows:
(in thousands of euro) Provision for
disputes pending Provision for
restructuring charges Provision for
other risks Total
Balance at 31 December 2011 11,484 2,484 60,721 74,689
Allocations in the period 2,631 138 1,663 4,432
Uses (447) (1,335) (10,931) (12,713)
Exchange rate differences -- 8 2 10
Other changes (1,844) -- 8,505 6,661
Balance at 30 June 2012 11,824 1,295 59,960 73,079
The breakdown and changes in the current portion of these provisions is as follows:
(in thousands of euro) Provision for
disputes pending Provision for
restructuring charges Provision for
other risks Total
Balance at 31 December 2011 9,412 19,030 56,945 85,387
Allocations in the period 3,475 1,400 11,308 16,183
Uses (1,734) (4,500) (5,611) (11,845)
Other changes 2,022 -- 258 2,280
Balance at 30 June 2012 13,175 15,930 62,900 92,005
In addition to libel disputes regarding the Espresso group common in all publishing companies, the provision for disputes pending include risks for disputes of a commercial nature and labour disputes. The provision for restructuring charges includes sums allocated for restructuring action that has been announced to the parties concerned and in particular refers to the production reorganisation projects affecting companies of the Espresso group. The provision for other risks is mainly to cover tax disputes pending with local tax authorities.
11. Current liabilities 11.a. Bond loans
The current portion of this item refers to the bond loan Gruppo Editoriale L’Espresso S.p.A. 2004/2014. 11.b. Other borrowings
(in thousands of euro) 30.06.2012 31.12.2011
Collateralised bank loans 44,451 27,684
Other bank loans 247,231 46,304
Leases 11,018 11,927
Other borrowings 618,527 625,685
Total 921,227 711,600
The increase in the item “Other bank loans” refers to the current portion of the medium and long-term loans within the sphere of the Sogefi Group due within 12 months.
Semi-annual Interim Financial Report 2012 63

In relation to “Other borrowings”, on 9 July 2011 the Milan Court of Appeal pronounced on the civil case brought by CIR against Fininvest for compensation for damages resulting from bribery in the “Lodo Mondadori” case. The ruling sentenced Fininvest to pay CIR approximately € 540.1 million, plus interest at the legal rate and costs, as compensation for the immediate and direct damage suffered. As a result of this sentence, on 26 July 2011 CIR received a total of around € 564.2 million from Fininvest, by way of an interim payment. As envisaged in the international accounting standards (IAS 37), this amount has no effect on the income statement of the company up to the highest legal authority level and was therefore recognised as a matching balance to this item. The item also includes the effects of the fair value valuation of hedging derivatives. 11.c. Trade payables (in thousands of euro) 30.06.2012 31.12.2011
Parent companies 562 --
Payables – joint ventures 17,512 34,626
Payables – associates 1,581 2,003
Payables – suppliers 1,000,628 937,152
Advance payments 6,555 6,642
Payables in the form of notes -- 4
Total 1,026,838 980,427
The item “Payables – parent companies” refers to management support and communication services received by CIR S.p.A. from its parent company Cofide S.p.A.. The item “Payables – joint ventures” refers mainly to the trade payables of Sorgenia S.p.A. owed to Tirreno Power S.p.A. 11.d. Other payables (in thousands of euro) 30.06.2012 31.12.2011
Due to employees 91,885 80,700
Tax payables 60,604 57,402
Social security payables 44,612 53,849
Other payables 205,842 176,124
Total 402,943 368,075
“Other payables” includes € 129,298 thousand (€ 93,134 thousand at 31 December 2011) relating to the fair value measurement of commodity derivatives of the Sorgenia group.
Semi-annual Interim Financial Report 2012 64

NOTES TO THE INCOME STATEMENT
12. Revenues Breakdown by business sector (in millions of euro) 1st Half 2012 1st Half 2011 Change
amount %
amount % %
Energy 1,119.3 46.5 1,043.1 47.3 7.3
Media 419.8 17.4 457.4 20.7 (8.2)
Automotive components 686.8 28.6 526.6 23.9 30.4
Healthcare 178.7 7.4 176.9 8.0 1.0
Other 2.3 0.1 1.6 0.1 --
Total consolidated revenues 2,406.9 100.0 2,205.6 100.0 9.1
Revenues for the Energy sector include € 32 million achieved through related parties of which € 29.1 million related to the minority shareholder Verbund. Breakdown by geographical area (in millions of euro)
1st Half 2012 Total Italy Other
European North South Asia Other revenues countries America America countries
Energy 1,119.3 1,036.4 82.9 -- -- -- --
Media 419.8 419.8 -- -- -- -- --
Automotive components 686.8 42.6 431.7 75.4 108.4 21.0 7.7
Healthcare 178.7 178.5 -- -- -- 0.2 --
Other 2.3 -- 2.3 -- -- -- --
Total consolidated revenues 2,406.9 1,677.3 516.9 75.4 108.4 21.2 7.7
Percentages 100.0% 69.7% 21.5% 3.1% 4.5% 0.9% 0.3%
(in millions of euro)
1st Half 2011 Total Italy Other
European North South Asia Other revenues countries America America countries
Energy 1,043.1 977.3 65.8 -- -- -- --
Media 457.4 457.4 -- -- -- -- --
Automotive components 526.6 38.0 339.9 13.7 117.8 16.3 0.9
Healthcare 176.9 176.9 -- -- -- -- --
Other 1.6 -- 1.6 -- -- -- --
Total consolidated revenues 2,205.6 1,649.6 407.3 13.7 117.8 16.3 0.9
Percentages 100.0% 74.8% 18.5% 0.6% 5.4% 0.7% 0.0%
Semi-annual Interim Financial Report 2012 65

The types of products marketed by the Group and the nature of its business sectors mean that revenues are reasonably linear throughout the year and are not subject to any particular cyclical phenomena on a like-for-like basis.
13. Operating costs and income 13.a. Costs for the purchase goods Costs for the purchase of goods rose from € 1,209,741 thousand in the first half of 2011 to € 1,393,495 thousand in the same period of 2012. The costs include € 75.8 million paid to related parties, of which € 68.7 million attributable to relations with the associate Tirreno Power S.p.A.. 13.b. Costs for services This item rose from € 413,364 thousand in the first half of 2011 to € 426,985 thousand in the first half 2012, as can be seen from the following breakdown:
(in thousands of euro) 1st Half
2012 1st Half
2011 Services provided by the parent company 556 620
Technical and professional consulting 55,003 59,000
Distribution and transport costs 21,064 21,100
Outsourcing 45,193 48,637
Other expenses 305,169 284,107
Total 426,985 413,464
13.c. Personnel costs Personnel costs totalled € 381,823 thousand in the first half of 2012 (€ 360,713 thousand in the first half of 2011) with the following breakdown:
(in thousands of euro) 1st Half
2012 1st Half
2011 Salaries and wages 269,395 246,601
Social security contributions 87,466 77,491
Employee leaving indemnity 9,785 9,986
Pensions and similar benefits 1,078 1,072
Valuation of stock option plans 5,078 5,162
Other costs 9,021 20,401
Total 381,823 360,713
There was an average of 14,089 employees on the payrolls of the Group in the first half of 2012 (13,062 in the first half of 2011). The increase is due mainly to the entry of the Systèmes Moteurs group into the sphere of the Sogefi group.
Semi-annual Interim Financial Report 2012 66

13.d. Other Operating Income This item can be broken down as follows:
(in thousands of euro) 1st Half
2012 1st Half
2011 State grants 3,741 1,769
Capital gains on asset disposals 638 3,441
Contingent assets and other income 53,926 65,805
Total 58,305 71,015
13.e. Other Operating Costs This item can be broken down as follows:
(in thousands of euro) 1st Half
2012 1st Half
2011
Write-downs and losses on receivables 22,149 16,140
Allocation to provisions for risks and losses 8,502 5,061
Indirect taxes 17,924 16,333
Restructuring costs 1,038 1,593
Capital losses on asset disposals 945 931
Contingent liabilities and other costs 45,563 43,443
Total 96,121 83,501
“Restructuring costs” referred to costs for the restructuring plans already being implemented by the Sogefi group.
14. Financial income and expense 14.a. Financial Income This item has the following breakdown:
(in thousands of euro) 1st Half
2012 1st Half
2011 Interest income on bank accounts 5,048 2,533
Interest on securities 9,337 4,023
Other interest income 11,786 10,616
Interest rate derivatives 11,265 5,393
Exchange gains 1,334 5,658
Other financial income 105 103
Total 38,875 28,326
Semi-annual Interim Financial Report 2012 67
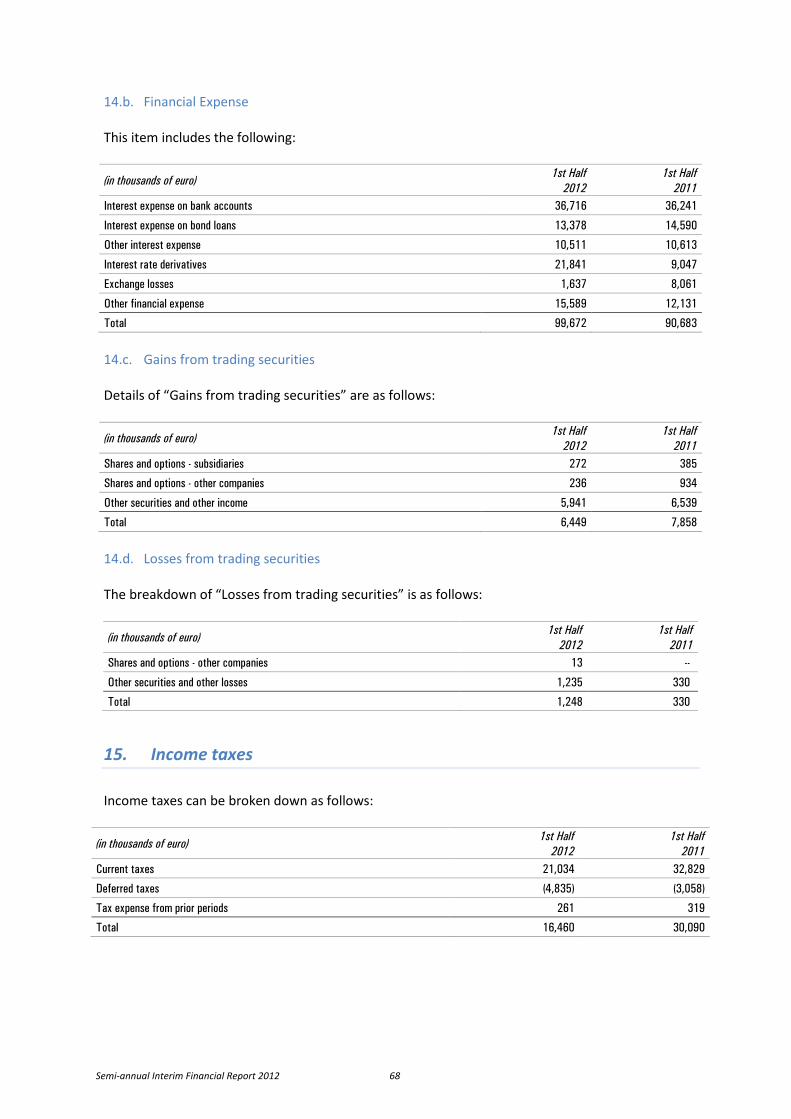
14.b. Financial Expense This item includes the following:
(in thousands of euro) 1st Half
2012 1st Half
2011 Interest expense on bank accounts 36,716 36,241
Interest expense on bond loans 13,378 14,590
Other interest expense 10,511 10,613
Interest rate derivatives 21,841 9,047
Exchange losses 1,637 8,061
Other financial expense 15,589 12,131
Total 99,672 90,683
14.c. Gains from trading securities Details of “Gains from trading securities” are as follows:
(in thousands of euro) 1st Half
2012 1st Half
2011 Shares and options - subsidiaries 272 385
Shares and options - other companies 236 934
Other securities and other income 5,941 6,539
Total 6,449 7,858
14.d. Losses from trading securities The breakdown of “Losses from trading securities” is as follows:
(in thousands of euro) 1st Half
2012 1st Half
2011 Shares and options - other companies 13 --
Other securities and other losses 1,235 330
Total 1,248 330
15. Income taxes Income taxes can be broken down as follows:
(in thousands of euro) 1st Half
2012 1st Half
2011 Current taxes 21,034 32,829
Deferred taxes (4,835) (3,058)
Tax expense from prior periods 261 319
Total 16,460 30,090
Semi-annual Interim Financial Report 2012 68

16. Earnings per share The basic earnings per share are calculated by dividing the net income for the period attributable to ordinary Shareholders by the weighted average number of shares in circulation. The diluted earnings per share are calculated by dividing the net income for the period attributable to ordinary Shareholders by the weighted average number of ordinary shares in circulation during the period, adjusted for the dilution effects of any options outstanding. Any own shares held are not included in the calculation. The parent company of the Group has only one category of potential ordinary shares, which are those shares resulting from the stock options awarded to employees. In calculating the average number of options, the average fair value of the shares for each financial year was used. The average fair value of CIR ordinary shares in the first half of 2012 was € 1.0629 compared to an average fair value of € 1.5936 in the first half of 2011. The following chart provides information on the shares used to calculate the basic and diluted earnings per share. Basic earnings per share 1st Half
1st Half
Net income attributable to the Shareholders (in thousands of euro) 703 19,432
Weighted average number of ordinary shares in circulation 743,348,500 749,043,267
Basic earnings per share (euro) 0.0009 0.0259 1st Half
1st Half
Net income from the statement of comprehensive income attributable
(8,888) 12,065 Weighted average number of ordinary shares in circulation 743,348,500 749,043,267
Comprehensive basic earnings per share (euro) (0.0120) 0.0161
Diluted earnings per share 1st Half
1st Half
Net income attributable to the Shareholders (in thousands of euro) 703 19,432
Weighted average number of ordinary shares in circulation 743,348,500 749,043,267
Weighted average number of options 1,720,095 6,393,751
Fair value of weighted average number of options (1,603,253) (5,156,005)
Adjusted weighted average number of shares in circulation 743,465,342 750,281,013
Diluted earnings per share (euro) 0.0009 0.0259 1st Half
2012 1st Half
2011 Net income from the statement of comprehensive income attributable
(8,888) 12,065 Weighted average number of ordinary shares in circulation 743,348,500 749,043,267
Weighted average number of options 1,720,095 6,393,751
No. of shares that could have been issued at fair value (1,603,253) (5,156,005)
Adjusted weighted average number of shares in circulation 743,465,342 750,281,013
Comprehensive diluted earnings per share (euro) (0.0120) 0.0161
Semi-annual Interim Financial Report 2012 69

17. Dividends paid Dividends paid in the first half of 2012 totalled € 18,584 thousand, equal to € 0.025 per share.
18. Financial risk management: additional disclosures (IFRS7) The CIR Group operates in different sectors of industry and services both at national and international level and thus its business is exposed to various kinds of financial risk, including market risk (exchange rate risk and price risk), credit risk, liquidity risk and interest rate risk. To minimise certain types of risks the Group uses hedging derivatives. Risk management is carried out by the central finance and treasury function on the basis of policies approved by CIR Management and transmitted to the subsidiaries on 25 July 2003. 18.a. Market risk
Foreign currency risk
Operating internationally and buying commodities denominated mainly in USD especially within Sorgenia group, the Group is subject to the risk that fluctuations in exchange rates may affect the fair value of a number of its assets and liabilities. Although the Group produces and sells mainly in the Euro Area it is subject to foreign currency risk especially in relation to the GB pound, Brazilian real, US dollar, Argentine peso, Chinese renminbi and Indian rupee. The Group uses forward contracts to reduce the risk of fluctuations in the EUR/USD exchange rate. As described in the Note on price risk, in certain cases it hedges its purchase and sales formulae directly and the price of this hedging depends on the EUR/USD exchange rate. By fixing its formulae in euro, the exchange rate is also indirectly hedged. Regarding the foreign currency risk of translating the financial statements of international subsidiaries, the operating companies generally have a degree of convergence between their sourcing costs and their sales revenues and this kind of risk is also limited by the fact that the companies operate in their local currencies, are active in their own domestic markets and abroad and, if necessary, can arrange funding locally.
Price risk Through the activity in the energy sector of the Sorgenia group, the Group is exposed to the risk of fluctuations in energy commodity prices on the purchase of fuels for its power production plants and on its purchases and sales of gas and electricity (where contracts stipulate specific indexing to baskets of fuels). Moreover since almost all of the commodities in question are priced in USD, the Group is also exposed to fluctuations in the EUR/USD exchange rate (as said before). Sorgenia continually monitors this exposure by breaking its contractual formulae down into the underlying risk factors and managing the exposure using a two-step procedure.
The first step involves the negotiation of gas and electricity purchase agreements and the definition of pricing policies. On both purchase and sales sides, price control enables the Group to guarantee a high level of natural hedging, minimising the impact on margins of the factors of uncertainty mentioned above not only at business line level but also at consolidated portfolio level. The second step involves monitoring net remaining exposure after the action described above. Sorgenia trades derivatives with leading banks in order to minimise counterparty risk. The derivatives in question are traded over the counter (OTC) directly with the counterparties and are mainly fixed vs. floating swaps or vice versa for commodity price hedges, and outright forwards for foreign currency risk hedges.
Semi-annual Interim Financial Report 2012 70

Since 2008, given the greater liquidity achieved by derivatives markets, in order to reduce basis risk on the hedges as far as possible, the group has been negotiating contracts with its financial counterparties where the underlying is the whole formula for the purchase or sale of natural gas or electricity. These hedges make it possible to eliminate changes in costs and revenues caused by the commodity risk factor and the foreign currency risk factor through a single contract. As from the previous year these commodity derivative contracts, being entered into exclusively for hedging purposes, are managed according to the IAS 39 rules on hedge accounting. Therefore the effects in terms of profit and loss of changes in their fair value are recognised directly to a special equity reserve (Cash flow hedge reserve). Should the effectiveness test show that the hedges ineffective to some degree, the ineffective part is recognised immediately to the income statement. The fair value of derivative contracts is calculated using market forward prices as at the reporting date, when the underlying commodities are traded on markets with a forward price structure. Otherwise, fair value is calculated using internal models based on data and information available on the market, supplied by recognised and reliable third party sources. Regarding the hierarchical form of classification reviewed by IFRS 7 which is based on three levels according to the method and the input used to determine fair value, it should be pointed out that the financial instruments used for managing commodity risk belong to level 2 of the fair value hierarchy. The valuation techniques for derivatives outstanding at the end of the period were the same as those adopted in the previous year. For commodities the maturity of the related swaps is generally less than 18 months. However, in certain exceptional cases hedges with longer maturities have been entered into with end customers for fixed price contracts or contracts with particular kinds of options involved. At 30 June there were open positions in liquid fuel derivatives with maturities in 2012. As in previous years, the Sorgenia group minimised its exposure to changes in commodity price risk hedges through increased opportunities for defining sales formulae consistent with its sourcing formulae, through hedging strategies using financial instruments trading and also through the new use of more structured instruments with a short-term horizon. Commodity derivative contracts, in fact, are entered into only for hedging purposes, therefore changes in the results of the commodity derivative positions are offset by changes in the results of the underlying physical positions with an impact on the income statement essentially limited to the basis risk in all cases where there is a discrepancy between the commodities of the underlying physical contracts and the liquid commodities traded on the markets, both regulated and OTC, on which the derivatives are based. This activity is segregated to a special portfolio with transactions completed on the power, commodities and foreign exchange markets. This portfolio is monitored on a daily basis by a special company department, has strict limits on risk levels (calculated through VaR 95%) and profit and loss (calculated as a stop-loss limit through P&L). In order to reliably calculate VaR, the Risk Management Department of Sorgenia S.p.A. developed a mixed benchmark-simulation approach based on which the price scenarios generated are consistent with benchmarks describing time series observations. The Value at Risk is daily and has a confidence level of 95%. The VaR value is a function of statistical price distribution and market returns, and also of time series correlations of different products and markets. 18.b Credit risk Credit risk can be valued both in commercial terms relating to customer type, contractual terms and sales concentration, and in financial terms in connection with the type of counterparty involved in financial transactions. Within the Group there is no significant concentration of credit risk. Some time ago adequate policies were put in place to ensure that sales are made to customers of good standing. The counterparties for derivative products and cash transactions are exclusively
Semi-annual Interim Financial Report 2012 71

financial institutions with a high credit rating. The Group has policies that limit credit exposure to individual financial institutions. Credit risk is different depending on the business sector concerned. In the utilities sector, for example, the assessment of credit risk exposure is made using internal processes and aided by companies with sector expertise in both credit facility assessment and allocation and in credit collection management. The customer base and its diversification make exposure to a concentration of credit risk immaterial. In the “Automotive components” sector there is no excessive concentration of risk since the Original Equipment and After-market distribution channels of operation are car manufacturers or large purchasing groups without any particular concentration of risk. The “Media” sector has no areas of risk for trade receivables of a significant entity and in any event the Group adopts operating procedures that prevent the sale of products or services to customers without an adequate credit profile or collateral. The healthcare sector does not present any concentration of credit risk because credit exposure is spread over a large number of customers and counterparties especially in the residential care homes sector. The hospital sector, however, has a higher concentration of risk because most counterparties are local health authorities. Since 2006 the CIR Group has been acquiring and managing non-performing loans and has put in place procedures for measuring and establishing the fair value of its portfolios. 18.c Liquidity risk Prudent management of liquidity risk implies maintaining sufficient liquidity and tradeable securities and ensuring an adequate supply of credit facilities to ensure sufficient funding. The Group systematically meets its maturities and commitments, and such conduct enables it to operate on the market with the necessary flexibility and reliability to maintain a correct balance between funding and deployment of its financial resources. The companies heading the four major business sectors manage their liquidity risk directly and independently. Tight control is exercised over the net financial position and its short, medium and long term developments. In general the CIR Group follows an extremely prudent financial policy using mainly medium/long-term funding structures. The operating Groups’ treasuries are centrally managed. 18. d. Interest rate risk (fair value and cash flow) Interest rate risk depends on fluctuations in market rates which can cause changes in the fair value of cash flows of financial assets or liabilities. Interest rate risk mainly concerns long-term bond loans issued at a fixed rate, thereby exposing the Group to the risk of fair value changes in the loans themselves as interest rates change. Following risk management policies, the Parent Company and the subsidiaries have entered into various IRS contracts over the years in order to hedge interest rate risk on their bond loan issues and on loan agreements. 18.e Derivatives Derivatives are recognised at their fair value. For accounting purposes hedging transactions are classified as: - fair value hedges if they are subject to price changes in the market value of the underlying asset
or liability;
Semi-annual Interim Financial Report 2012 72

- cash flow hedges if they are entered into against the risk of changing cash flows from an existing asset and liability, or from a future transaction.
- hedges of net investments in foreign operations if they are entered into to protect against foreign currency risk from the translation of subsidiaries’ equity denominated in a currency other than the Group’s functional currency.
For derivatives classified as fair value hedges, gains and losses resulting from both the determination of their market value and the adjustment to fair value of the element underlying the hedge are recognised to the income statement. For derivatives classified as cash flow hedges (e.g. interest rate swaps) gains and losses on their mark-to-market are recognised directly to equity for the part “effectively” hedging the risk concerned, while any “ineffective” part is recognised to the income statement. For hedges of net investments in foreign operations, gains and losses on their mark-to-market are recognised directly to equity for the part “effectively” hedging the risk in questions, while any “ineffective” part is recognised in the income statement. On initial hedge accounting recognition, derivatives are accompanied by a hedging relationship which designates the individual derivative as a hedge and specifies the hedge effectiveness parameters in relation to the financial instrument hedged. Hedge effectiveness is tested at regular intervals, the effective part of the relationship recognised to equity and any ineffective part recognised to the income statement. More specifically, the hedge is considered effective when the change in fair value or in the financial flows of the instrument hedged is almost entirely offset by the change in fair value or cash flows of the hedging instrument and when the results achieved are in a range of 80%-125%. Moreover in order to optimize the management of its investments, the group also carries out transactions in derivative financial instruments that are not for hedging purposes. 18.f. Capital ratios Management regulates the use of leverage to guarantee solidity and flexibility in the asset and liability structure of CIR and its financial holding companies, measuring the ratio of funding sources to investment activity. Leverage is calculated as the ratio between net debt (represented by bond loans issued net of cash and cash equivalents and investments in liquid financial instruments, according to parameters agreed with the rating agency) and the total investments measured at fair value (including equity investments and remaining investments in financial instruments). Management’s objective is to maintain a solid and flexible financial structure to keep this ratio below restricted percentages. Currently it stands at 12%. 18.g. Contractual clauses of borrowings Certain agreements regarding Group borrowings contain special clauses which, in the event of failure to comply with certain economic and financial covenants, envisage the lending banks’ option to claim repayment if the company involved does not immediately remedy the infringement of such covenants as required under the terms and conditions of the agreements. At 30 June 2012 all the contractual clauses relating to medium and long term financial liabilities were complied with by the group. Below is a description of the main covenants relating to the borrowings of the operating sub-holding companies outstanding at year end. Sogefi Group
Semi-annual Interim Financial Report 2012 73

Sogefi S.p.A., the parent company of the group’s sub-holding operating in the automotive sector, has undertaken to comply with a series of “covenants” as summarised below: - syndicated loan of € 160 million: ratio of consolidated net financial position to consolidated
EBITDA of 3.5 or lower; ratio of EBITDA to net financial expense no lower than 4; - loan of € 100 million: ratio of consolidated net financial position to consolidated EBITDA lower
than 4; - loan of € 60 million: ratio of consolidated net financial position to consolidated EBITDA lower
than 3.5; - other loans for a total of € 140 million: ratio of consolidated net financial position to
consolidated EBITDA of 3.5 or lower; ratio of consolidated EBITDA to net financial expense no lower than 4.
Sorgenia Group For borrowings regarding power plant construction, through a number of its subsidiaries the Sorgenia group has undertaken to comply with covenants requiring that the ratio of consolidated net debt to the sum of debt plus equity (gearing ratio) remains between 64% and 80%, depending on the loan, and that the operating cash flow net of tax during construction of the power plants is higher than 1.05 times the debt service coverage ratio. KOS Group The KOS Group has undertaken to comply with a series of covenants in relation to a number of loans, details of which are as follows: - revolving credit facilities for a total of € 47 million (debt at 30 June 2012 € 4 million) obtained by
the Parent Company KOS: ratio of consolidated net financial position to consolidated equity lower than 2.5;
- syndicated loan for a total remaining at 30 June 2012 of approximately € 22.1 million obtained by Residenze Anni Azzurri S.r.l.: ratio of net financial position to EBITDA lower than 3.88 and ratio of consolidated net financial position to consolidated equity lower than 2.19;
- syndicated loan for a total remaining at 30 June 2012 of approximately € 29.3 million obtained by Istituto di Riabilitazione Santo Stefano S.r.l.: ratio of net financial position to EBITDA lower than 5.8, ratio of consolidated net financial position to consolidated equity below 1.5, and a debt service coverage ratio of above 0.8;
- loan for a total remaining at 30 June 2012 of approximately € 4.9 million obtained by Medipass S.p.A.: ratio of net financial position to EBITDA lower than 3.6, ratio of consolidated net financial position to consolidated equity lower than 3.5, and a debt service coverage ratio above1.
18.h. Measurement of financial assets and liabilities and fair value hierarchy The fair value of financial assets and liabilities is calculated as follows: • the fair value of financial assets with standard terms and conditions listed on an active market is
measured on the basis of prices published on the active market; • the fair value of other financial assets and liabilities (except derivatives) is measured using
commonly accepted methods and based on analytical models using discounted cash flows, which as variables use prices observable in recent market transactions and from broker listed prices for similar instruments;
• for derivatives listed on an active market the fair value is measured on market prices; if these prices are not published, different approaches are used for the various types of instruments.
In particular, for the measurement of certain investments in bond instruments with no regular market, i.e. where there is an insufficient number of frequent transactions with a bid-ask spread and a sufficiently limited volatility, then the fair value of these instruments is mainly measured
Semi-annual Interim Financial Report 2012 74

according to prices provided by leading international brokers at the request of the company, which are then validated through comparison with market prices, albeit of a limited number, or with prices observable for other instruments with similar characteristics. In measuring investments in private equity funds, fair value is determined on the basis of the NAV disclosed by the respective fund administrators at the reporting date. Where such information is not available at the reporting date, the last official disclosure is used, which must not however be more than three months old at the reporting date and if necessary validated against information made available to investors by the fund managers at a later date.
19. Guarantees and commitments At 30 June 2012 the guarantees and commitments position was as follows: CIR and financial holding companies For the incentive plans for directors and employees, CIR has a joint commitment with Verbund to buy back any shares of Sorgenia S.p.A. resulting from the exercise of options by employees who are beneficiaries of stock option plans. Other guarantees and commitments of CIR are as follows: - commitments for private equity fund investments by CIR International for € 13,7 million; - securities as collateral for derivative transactions for an amount of €22.5 million.
Sorgenia Group 1. Guarantees issued
As collateral for loans obtained by subsidiaries, shares representing the capital of the borrowing companies have been pledged in favour of the lending banks for a total of € 684,798 thousand (€ 674,798 thousand at 31 December 2011).
2. Sureties
Within the group sureties have been granted to third parties for a total of € 305,342 thousand (€ 335,674 at 31 December 2011). These are mainly bonds issued to guarantee payments linked to the purchase and transmission of electricity and gas and commitments to the Tax Authority for VAT reimbursement claims. This category also includes sureties requested for power plant constructions and land purchases.
3. Commitments
The commitments outstanding at the reporting date refer mainly to guarantees issued by Sorgenia S.p.A. in favour of the banks financing Sorgenia Power S.p.A. for € 195,800 thousand for the Termoli power plant and € 660,000 thousand for the Aprilia and Bertonico -Turano Lodigiano plants. Sorgenia S.p.A. signed a commitment to capitalise Sorgenia Power by up to € 47,537 thousand and to fund the company by up to € 100,000 thousand. There is also a commitment to contribute a maximum of USD 30,000 to the subsidiary Sorgenia USA, of which USD 23,097 already paid in leaving a residual commitment outstanding of € 5,483 thousand. Sorgenia and other shareholders with equal investments in Gica S.A., following an agreement signed on 8 April 2008, are committed to pay up to a maximum € 7.5 million each as a financial commitment. In July 2011 the agreement was amended and the commitment of each shareholder reduced to € 3.25 million. During the year the shareholders were not asked to make a payment and therefore the outstanding Sorgenia commitment is € 2,440 thousand.
Semi-annual Interim Financial Report 2012 75

For natural gas purchases and sales only, the supply contract includes the standard take or pay clause which makes it compulsory for the buyer to pay for any shortfall in the amount withdrawn compared to the annual minimum envisaged in the contract with reference to this clause CIR has issued a guarantee. Currently this clause is suspended due to the political issues and social conflicts in Lybia. As a result of leasing operations involving the Minervino and San Gregorio Magno plants, Sorgenia is committed to not disposing of the investment in Sorgenia Green (in turn holder of investments in the two companies) if the transaction leads to loss of control. Sorgenia S.p.A. is also committed to guaranteeing a Debt Service Cover Ratio defined by the company with which the lease contract was signed by Sorgenia San Gregorio Magno, below which the company must refinance or recapitalise the subsidiary.
Espresso Group Apart from liens on printing plants and rotary presses arranged through banks to cover loans agreed in 2005, at 30 June 2012 the Group had commitments outstanding for € 3,790 thousand in relation to contracts for the purchase of plants and other printing equipment (€ 944 thousand) mainly for La Repubblica and the North-East and North-West divisions of Fin.E.Gi.L. Editoriale. Guarantees issued amounted to € 2,846 thousand and referred mainly to guarantees given by the Parent Company and the subsidiaries Elemedia and A. Manzoni & C. for the lease of their respective premises, and also to the payment obligation undertaken by the Parent Company to the Tax Authority to guarantee excess credit positions created in the last three years. Sogefi Group
1. Operating leases For accounting purposes, leases and rental contracts are classified as operating leases when the following conditions apply: - a significant part of the risks and benefits of ownership are retained by the lessor; - there are no buy-back options on the leased property at a price that does not represent its
presumed market value at period end; - the duration of the contract does not extend over most of the useful life of the asset leased or
rented. The rental payments for operating leases are recognized to the income statement in line with the underlying contracts. The main operating leases outstanding at 30 June 2012 refer to the following subsidiaries: - Allevard Federn GmbH for lease of the Volklingen production site. In May 2010 the company
renewed the lease of its production site until May 2020. The remaining instalments at 30 June 2012 totalled € 3,206 thousand, of which € 366 thousand due within one year. The Group has not given any form of guarantee on this contract.
- Filtrauto S.A. for lease of the Guyancourt production site. The contract terminates in December 2016 and at 30 June 2012 the remaining instalments amounted to € 2,176 thousand, of which € 870 thousand within one year. The Group has not given any form of guarantee on this contract.
- Mark IV Air Intake Systems Corp. for lease of the Montreal production site. The contract terminates in December 2015 and at 30 June 2012 the remaining instalments amounted to CAD 4,057 thousand, of which CAD 970 thousand within one year. The Group has not given any form of guarantee on this contract.
- Shanghai Sogefi Auto Parts Co., Ltd. for lease of a production site, purchasing office and a laboratory, all located in the Pudong district of Shanghai. The contracts on each, respectively, terminate in August 2023, March 2013 and June 2014. At 30 June 2012 the remaining
Semi-annual Interim Financial Report 2012 76

instalments amount to CNY 17,422 thousand, of which CNY 1,790 thousand within one year. The Group has not given any form of guarantee on these contracts.
- Allevard Sogefi U.S.A. Inc. for the lease on the production site in Prichard (West Virginia). The contract terminates in May 2019 and the remaining instalments at 31 December 2011 total USD 2,744 thousand, of which USD 397 thousand within one year. Against this contract Sogefi S.p.A. has issued a guarantee for approximately 62% of remaining lease instalments. The guarantee is renewed at the end of each year based on the residual amount outstanding. There are no restrictions of any kind connected with this kind of leasing and at the end of the contract the US company will have the right to buy the property at market price.
2. Investment commitments
At 30 June 2012 there were commitments for investments for a total of € 2,407 thousand.
3. Guarantees issued The details of these guarantees are as follows:
(in thousands of euro) 2012 2011
Guarantees to third parties 1,258 1,340
Other personal guarantees to third parties 9,714 9,714
Collateral provided for recognised borrowings 7,056 1,738
Guarantees issued refer to operating lease contracts and guarantees given to certain clients and are recognised at the value of the commitment outstanding as of the reporting date. The item “Other personal guarantees to third parties” refers to the LPDN GmbH commitment to the employee pension fund of the two business divisions at the time of the acquisition completed in 1996. This commitment is covered by contractual obligations on the part of the vendor, a leading German market operator. Collateral refers to the subsidiaries Systèmes Moteurs S.A.S., Allevard IAI Suspensions Private Ltd, United Springs B.V. and Sogefi M.N.R. Filtration India Private Ltd which provided Guarantees collateral to lending banks on their tangible assets, inventories and trade receivables.
4. Other risks At 30 June 2012 the Sogefi Group held assets belonging to third parties on its group company premises for € 5,096 thousand. Kos group Below is a breakdown of the bank guarantees and other guarantees issued by Kos S.p.A. for a total of approximately € 2,421 thousand: - a guarantee in favour of the Sanremo Town Council as a security deposit for urbanisation works,
for € 226 thousand; - a guarantee on behalf of Residenze Anni Azzurri S.r.l. for the lease of Santegidio S.r.l.
(Scarnafigi), for € 100 thousand; - a guarantee on behalf of Residenze Anni Azzurri S.r.l. for the Rivarolo property lease, for € 75
thousand; - a guarantee on behalf of Residenze Anni Azzurri S.r.l. for the Rivarolo business unit lease, for €
35 thousand; - a guarantee on behalf of Residenze Anni Azzurri S.r.l. for the care home due to be built in
Montanaro to guarantee signing of the future lease agreement for € 550 thousand;
Semi-annual Interim Financial Report 2012 77

- a guarantee on behalf of Residenze Anni Azzurri S.r.l. for the Peveragno property lease, for € 235 thousand;
- a guarantee on behalf of Residenze Anni Azzurri S.r.l. for the Dorzano property lease, for € 121 thousand;
- a guarantee on behalf of Residenze Anni Azzurri S.r.l. for the Dormelletto property lease, for € 200 thousand;
- a guarantee on behalf of Residenze Anni Azzurri S.r.l. for a property lease, for € 180 thousand; - an omnibus guarantee on behalf of Medipass S.p.A. in its relations with the Venice Health
Authority, for € 700 thousand. Bank guarantees given by other group companies for € 10,177 thousand, with the following breakdown: - a guarantee given by Residenze Anni Azzurri S.r.l. to guarantee care home lease payments, for
€ 8,354 thousand; - a guarantee given by Residenze Anni Azzurri S.r.l. in favour of HSS Real Estate S.p.A. to
guarantee the security deposit policy for urbanisation works regarding the care home to be built in the municipality of Monza, for € 184 thousand;
- guarantee policies issued by Ospedale di Suzzara in favour of F.lli Montecchi, for € 953 thousand.
- a guarantee given by Residenze Anni Azzurri S.r.l. to guarantee the payment of the second instalment, for the acquisition of the company Beato Angelico S.r.l. for € 547 thousand;
- a guarantee given by Residenze Anni Azzurri S.r.l. in favour of the Modena Municipality for an amount of € 116 thousand.
At 30 June 2012 the other commitments and risks amounted to € 6,222 thousand and mainly referred to: - assets on free loan for € 2,238 thousand - commitments relating to the refurbishment of the Suzzara hospital, for contracts already signed
at 31 December 2011, for € 228 thousand; - contractual commitments for technology upgrades to equipment, where this proves necessary,
for approximately € 692 thousand. Given the current status of the contracts, there is no reason to assume that such commitments will arise;
- third party commitments to sell for approximately € 130 thousand; - counter-guarantee commitments for the successful completion of structural works for around
€ 2,891 thousand. The group carries out its business activities in owned and leased properties. In particular, the duration of leases varies from 3 to 9 years and is generally renewable. Of the 39 care homes for the elderly in operation at the reporting date, 5 properties are owned, while 10 of the 22 functional and psychiatric rehabilitation facilities are owned (including two residential care homes for the elderly). The remaining facilities (day hospitals, psychiatric treatment communities, diagnostics departments) are generally leased.
Semi-annual Interim Financial Report 2012 78

20. Information on business sectors The business sectors coincide with the Groups of companies over which CIR S.p.A. has control. These are specifically:
- the Sorgenia group: utilities; - the Espresso group: media; - the Sogefi group: automotive components; - the KOS group: healthcare.
Geographically, with the exception of the Sogefi group, the business is carried out almost exclusively in Italy. A chart showing the breakdown of income components and balance sheet information of the
primary sector is shown in the Report on Operations while details regarding revenues by geographical area (secondary sector) are given in the Notes to the Financial Statements in the section regarding revenues (note 12)
21. Joint ventures The main joint venture at 30 June 2012 were Tirreno Power and Sorgenia France Production. International accounting standards envisage two methods for consolidating investments in joint ventures:
- the standard method, which involves proportional consolidation; - the alternative method which involves use of the equity method.
The Group has adopted the equity method for the sake of consistency with accounts presented to date. The chart below shows the key financial figures of Tirreno Power:
(in millions of euro) 1st half 1st half 2012 2011 Income statement Electricity sold (TWh) 5.0 6.2 Revenues from sales and services 462.4 535.2 EBITDA 53.9 80.5 Net result (4.6) 14.9 30.06.2012 31.12.2011 Statement of financial position Net invested capital 1.363,9 1.418,0 Net financial debt 860,1 895,2 Equity 503,8 522,8 No. of employees 536 535
The share of net income of Tirreno Power, consolidated by the equity method on the basis of values determined by applying IAS/IFRS standards, was € 2.3 million in 2012 compared to € 7.7 million in the first half of 2011.
Semi-annual Interim Financial Report 2012 79

The main figures relating to Sorgenia France Production are as follows:
(in millions of euro) 1st half 1st half 2012 2011
Income statement
Sales revenues 13,287.23 10,944.5 EBITDA 8,025.31 3,660.5 Operating income 2,664.24 (130.0) Profit (loss) for the year 132.48 (2,028.8) 30.06.2012 31.12.2011
Statement of financial position
Total assets 173,502.33 164,647.87 Total shareholders’ equity 17,601.24 18,209.20 Net financial position 110,599.28 109,121.55
22. Net financial position The net financial position, in accordance with Consob Resolution no. 6064293 of 28 July 2006, can be broken down as follows: (in thousands of euro) 30.06.2012 31.12.2011 A. Cash and bank deposits 392,922 494,006 B. Other cash and cash equivalents 131,096 126,495 C. Securities held for trading 612,256 613,877 D. Cash and cash equivalents (A) + (B) + (C) 1,136,274 1,234,378 E. Current financial receivables 27,723 11,956 F. Current bank payables (*) (471,915) (216,473) G. Bonds issued (10,037) (4,243) H. Current portion of non-current borrowings (629,543) (637,610) I. Other current financial payables (2) (2) J. Current financial debt (F) + (G) + (H) + (I) (1,111,497) (858,328) K. Net current financial position (J) + (E) + (D) 52,500 388,006 L. Non-current bank payables (**) (1,880,514) (1,984,806) M. Bonds issued (504,328) (525,802) N. Other non-current payables (**) (219,137) (212,531) O. Non-current financial debt (L) + (M) + (N) (2,603,979) (2,723,139) P. Net financial position (K) + (O) (2,551,479) (2,335,133)
(*) € 291,682 thousand (€ 471,915 - € 180,233) is classified in the Statement of Financial Position under “Other borrowings”. (**) Classified under “Other borrowings” – Non-current liabilities
Semi-annual Interim Financial Report 2012 80

23. Legal disputes It should be remembered that certain companies of the Group have disputes in progress against which their respective Boards have set aside risk provisions for amounts considered appropriate, taking into account the opinion of their consultants and based on the degree of likelihood that significant liabilities will actually occur. In particular, by means of sentence No. 64/9/2012, deposited on 18 May 2012, the Rome Regional Tax Commission passed judgement on the assessment issued by the Inland Revenue vis-à-vis the company for events dating back to 1991, partly convicting the Espresso Group. In detail, the RTC declared that the payment of taxation for Lire 440,824,125,000 for capital gains realized and undeclared was legitimate, in its opinion, along with Lire 13,972,000,000 for the recovery of the costs assumed as non-deductible pertaining to dividends and the tax credit, with application of the minimum legal fines and the ordering of payment of the legal costs. This ruling, on the basis of evaluations updated as of June 30 2012, would appear to give rise to a maximum amount at risk of 354.8 million euro (of which higher taxes assessed of 121.4 million euro, interest expense of 112.0 million euro and fines of 121.4 million euro): this amount comes from the fact that the Tax Authority did not limit itself to merely not recognizing the tax benefits (considered to be undue) of the higher values recognized on allocation of the “cancellation deficit” in the merger process, but it unexpectedly claimed that this deficit be immediately and fully subject to taxation, although in itself lacking in any income value, on the basis that it was a “realized” capital gain. In this connection, it is hereby revealed that the appeals against said assessments had been upheld at two previous levels of jurisdiction and that the circumstances disputed had originally been declared as inexistent at criminal level. On 19 July 2012, the Rome RTC suspended the executive nature of the sentence. By virtue of the awareness of the statutory-tax-related legitimacy of the transactions subject to tax dispute, as well as on the basis of the technical opinions obtained from third party professionals, the Company has deemed the risk linked to the corporate restructuring transactions for which it emerges as the losing party “possible” and not “probable” and therefore it has not made any specific provisions to cover the related risk. Furthermore, it took steps to file an appeal before the Supreme Court of Cassation on 27 June 2012 and to present the Rome RTC, on 28 June 2012, with an application for the suspension of the effects of the sentence. On this subject with reference to the accounting details please refer to the related financial report. On 9 July 2011 the ruling of the Milan Court of Appeal was filed in the civil proceedings brought by CIR, against Fininvest for damages caused by the corruption of judges in the Lodo Mondadori case. The ruling sentences Fininvest to pay CIR approximately € 540.1 million, plus interest at the legal rate since 3 October 2009 and costs, as compensation for the immediate and direct damage suffered by the latter. As an effect of this ruling, on 26 July 2011 CIR received a total of approximately € 564.2 million from Fininvest, inclusive of legal costs and interest. As per the terms of international accounting standards (IAS 37), this sum will not affect the income statement of the group until the last level of justice.
Semi-annual Interim Financial Report 2012 81

24. Disclosures regarding share –based incentive plans 24.a. Incentive Plans 30 June 2012 (CIR) The following chart shows the stock option plans of the Parent Company CIR S.p.A.
Semi-annual Interim Financial Report 2012 82

STOCK OPTION PLANS OUTSTANDING AT JUNE 30 2012
The following chart shows the stock option plans of the Parent Company CIR S.p.A.
No.of Weighted No.of Weighted No.of Weighted No.of Weighted No.of Average Average No.of Weightedoptions average options average options average options average options strike duration options average
strike price strike price strike price strike price price (years) strike price
Stock Option Plan September 5 2003 112,500 1.13 -- -- -- -- -- -- 112,500 1.13 1.67 112,500 1.13
Stock Option Plan March 12 2004 384,100 1.60 -- -- -- -- -- -- 384,100 1.60 2.25 384,100 1.60
Stock Option Plan September 6 2004 1,480,200 1.56 -- -- -- -- -- -- 1,480,200 1.56 2.67 1,480,200 1.56
Stock Option Plan March 11 2005 3,414,200 2.34 -- -- -- -- -- -- 3,414,200 2.34 3.25 3,414,200 2.34
Stock Option Plan September 6 2005 2,425,000 2.49 -- -- -- -- -- -- 2,425,000 2.49 3.67 2,425,000 2.49
Stock Option Plan 2006 1st tranche 2,475,000 2.50 -- -- -- -- -- -- 2,475,000 2.50 4.51 2,475,000 2.50
Stock Option Plan 2006 2nd tranche 2,475,000 2.47 -- -- -- -- -- -- 2,475,000 2.47 5.00 2,475,000 2.47
Extraordinary Stock Option Plan 1st tranche 3,470,000 3.0877 -- -- -- -- -- -- 3,470,000 3.0877 5.25 3,470,000 3.0877
Extraordinary Stock Option Plan 2nd tranche 3,470,000 2.7344 -- -- -- -- -- -- 3,470,000 2.7344 5.75 3,470,000 2.7344
Extraordinary Stock Option Plan 3rd tranche 3,530,000 1.6806 -- -- -- -- 42,000 1.6806 3,488,000 1.6806 6.25 3,488,000 1.6806
Extraordinary Stock Option Plan 4th tranche 2,587,000 1.0718 -- -- -- -- 92,400 1.0718 2,494,600 1.0718 6.75 2,183,600 1.0718
Stock Option Plan 2009 1st tranche 2,861,200 0.9907 -- -- 9,000 0.9907 142,800 0.9907 2,709,400 0.9907 7.25 1,981,200 0.9907
Stock Option Plan 2009 2nd tranche 3,590,800 1.5449 -- -- -- -- 204,000 1.5449 3,386,800 1.5449 7.67 2,312,400 1.5449
Stock Option Plan 2010 1st tranche 3,739,600 1.6208 -- -- -- -- 253,200 1.6208 3,486,400 1.6208 8.26 1,963,800 1.6208
Stock Option Plan 2010 2nd tranche 3,734,800 1.4982 -- -- -- -- 298,800 1.4982 3,436,000 1.4982 8.67 1,516,200 1.4982
Total 39,749,400 1.9705 -- -- 9,000 0.9907 1,033,200 1.4366 38,707,200 1.9850 5.9305 33,151,200 2.0745
STOCK GRANT PLAN AT JUNE 30 2012
Number Value Number Value Number Weighted Number Weighted Number Value Average Number ValueUnits Units Units average Units average Units duration Units
strike price strike price (years)
Stock Grant Plan 2011 3,299,400 1.6391 -- -- -- 357,000 1.4771 2,942,400 1.6391 8.84 -- --Stock Grant Plan 2012 -- -- 5,700,000 1.0263 -- -- -- -- 5,700,000 1.0263 9.83 -- --Total 3,299,400 1.6391 5,700,000 1.0263 -- -- 357,000 1.4771 8,642,400 1.2349 9.4929 -- --
at the end of periodat start of period during the periodUnits exercisableUnits in circulation Units awarded Units exercised Units expiring Units in circulation
during the period in the period at the end of period
Options exercisedduring the period
Options in circulationat the end of period
Options exercisableat the end of period
Options in circulationat start of period
Options awarded during the period
Options expiringin the period
Semi-annual Interim Financial Report 2012 83

24.b. Incentive Plans 30 June 2012 (Sorgenia)
The chart below shows the incentive plans of the Sorgenia group:
STOCK OPTION PLANS OUTSTANDING AT 30 JUNE 2012
Options in circulation
at start of year
Options assigned during the year
Options exercised in the year
Options in circulation at end of year
No. of options
No. of options
No. of options
No. of options
‐‐
15 April 2003 1,260,000 ‐‐ ‐‐ 1,260,000
25 February 2005 4,972,040 ‐‐ ‐‐ 4,972,040
29 July 2005 20,538,965 ‐‐ ‐‐ 20,538,965
18 April 2006 5,725,140 ‐‐ ‐‐ 5,725,140
2009‐20121 1st Tranche 16,713,381 ‐‐ ‐‐ 16,713,381
2009‐2012 2nd Tranche 13,674,400 ‐‐ ‐‐ 13,674,400
18 May 2009 13,690,800 ‐‐ ‐‐ 13,690,800
18 March 2010 14,845,000 ‐‐ ‐‐ 14,845,000
18 April 2011 43,369,892 ‐‐ ‐‐ 43,369,892
Total 134,789,618 ‐‐ ‐‐ 134,789,618
STOCK GRANT PLANS AT 30 JUNE 2012
Financial instruments in
circulation at start of year
Financial instruments
assigned during the year
Financial instruments
exercised in the year
Financial instruments in circulation at end of
year
No. of Units No. of Units No. of Units No. of Units
Stock Grant Plan 2011
18/04/2011 ‐ Employees 2,820,000 ‐‐ 2,820,000
18/04/2011 ‐ Directors 180,000 ‐‐ 180,000
20/04/2012 ‐ Employees 2,820,000 2,820,000
20/04/2012 ‐ Directors 180,000 180,000
Total 3,000,000 3,000,000 ‐‐ 6,000,000
24.c. Incentive Plans 30 June 2012 (Espresso)
The chart below shows the stock option plans of the Espresso group:
Semi-annual Interim Financial Report 2012 84

STOCK OPTION PLANS FOR EMPLOYEES AT JUNE 30 2012 (ESPRESSO group)
No. of Options
Weighted average
strike price
No. of Options
Weighted average
strike price
No. of Options
Weighted average
strike price
No. of Options
Weighted average
strike price
No. of Options
Average strike price
Average duration (years)
No. of Options
Weighted average strike
Stock Option Plan October 24 2001 72,100 2.51 72,100 2.51
Stock Option Plan March 6 2002 203,000 3.30 203,000 3.30 0.25 203,000 3.30
Stock Option Plan July 24 2002 231,200 3.36 231,200 3.36 0.50 231,200 3.36
Stock Option Plan February 26 2003 340,200 2.86 340,200 2.86 1.25 340,200 2.86
Stock Option Plan July 23 2003 414,600 3.54 414,600 3.54 1.50 414,600 3.54
Stock Option Plan February 25 2004 925,000 4.95 925,000 4.95 2.25 925,000 4.95
Stock Option Plan July 28 2004 935,000 4.80 935,000 4.80 2.50 935,000 4.80
Stock Option Plan February 23 2005 960,000 4.75 960,000 4.75 3.25 960,000 4.75
Stock Option Plan July 27 2005 985,000 4.65 985,000 4.65 3.50 985,000 4.65
Stock Option Plan 2006 - 1st tranche 1,000,000 4.33 1,000,000 4.33 4.50 1,000,000 4.33
Stock Option Plan 2006 - 2nd tranche 1,000,000 3.96 1,000,000 3.96 5.00 1,000,000 3.96
Extraord. Stock Option Plan 2009 - 1st tranche 1,352,500 3.84 1,352,500 3.84 5.25 1,352,500 3.84
Extraord. Stock Option Plan 2009 - 2nd tranche 1,352,500 3.60 1,352,500 3.60 5.75 1,352,500 3.60
Extraord. Stock Option Plan 2009 - 3rd tranche 1,622,500 2.22 1,622,500 2.22 6.25 1,622,500 2.22
Extraord. Stock Option Plan 2009 - 4th tranche 1,166,950 1.37 1,166,950 1.37 6.75 1,004,700 1.37
Ord. Stock Option Plan 2009 - 1st tranche 1,941,150 1.00 15,000 1.00 1,926,150 1.00 7.25 1,404,200 1.00
Ord. Stock Option Plan 2009 - 2nd tranche 2,402,200 1.86 15,000 1.86 2,387,200 1.86 7.75 1,580,550 1.86
Ord. Stock Option Plan 2010 - 1st tranche 2,667,500 2.25 15,000 2.25 2,652,500 2.25 8.25 1,442,700 2.25
Ord. Stock Option Plan 2010 - 2nd tranche 2,619,200 1.58 15,000 1.58 2,604,200 1.58 8.75 1,078,800 1.58
Total 22,190,600 2.81 132,100 2.13 22,058,500 2.82 5.97 17,832,450 3.07
STOCK GRANT PLAN AT JUNE 30 2012
STOCK GRANT 2011Number
unitsWeighted average
strike price
Numberunits
Weighted average
strike price
Numberunits
Weighted average
strike price
Numberunits
Weighted average
strike price
Numberunits
Average strike price
Numberunits
Weighted average
strike priceTime-based Units 705,000 1.81 -- -- 33,750 1.81 -- -- 671,250 1.81 -- --
Performance-based Units 705,000 1.81 -- -- 33,750 1.81 -- -- 671,250 1.81 -- --
STOCK GRANT 2012Number
unitsWeighted average
strike price
Numberunits
Weighted average
strike price
Numberunits
Weighted average
strike price
Numberunits
Weighted average
strike price
Numberunits
Average strike price
Numberunits
Weighted average
strike price
Time-based Units -- -- 948,750 0.98 -- -- -- -- 948,750 0.98 -- --
Performance-based Units -- -- 948,750 0.98 -- -- -- -- 948,750 0.98 -- --
Options exercisable at end of period
Options in circulation at start of period
Options awarded in the period
Options cancelled in the period
Options exercised in the period
Options in circulation at end of period
Units exercisable at end of period
Units in circulation at end of period
Units in circulation at start period
Units awarded during the period
Units cancelled during the period
Units exercised in the period
Units in circulation at start period
Units awarded during the period
Units cancelled during the period
Units exercised in the period
Units in circulation at end of period
Units exercisable at end of period
Semi-annual Interim Financial Report 2012 85

24.b. Incentive Plans 30 June 2012 (Sorgenia)
The chart below shows the incentive plans of the Sorgenia group:
STOCK OPTION PLANS OUTSTANDING AT 30 JUNE 2012
Options in circulation
at start of year
Options assigned during the year
Options exercised in the year
Options in circulation at end of year
No. of options
No. of options
No. of options
No. of options
‐‐
15 April 2003 1,260,000 ‐‐ ‐‐ 1,260,000
25 February 2005 4,972,040 ‐‐ ‐‐ 4,972,040
29 July 2005 20,538,965 ‐‐ ‐‐ 20,538,965
18 April 2006 5,725,140 ‐‐ ‐‐ 5,725,140
2009‐20121 1st Tranche 16,713,381 ‐‐ ‐‐ 16,713,381
2009‐2012 2nd Tranche 13,674,400 ‐‐ ‐‐ 13,674,400
18 May 2009 13,690,800 ‐‐ ‐‐ 13,690,800
18 March 2010 14,845,000 ‐‐ ‐‐ 14,845,000
18 April 2011 43,369,892 ‐‐ ‐‐ 43,369,892
Total 134,789,618 ‐‐ ‐‐ 134,789,618
STOCK GRANT PLANS AT 30 JUNE 2012
Financial instruments in
circulation at start of year
Financial instruments
assigned during the year
Financial instruments
exercised in the year
Financial instruments in circulation at end of
year
No. of Units No. of Units No. of Units No. of Units
Stock Grant Plan 2011
18/04/2011 ‐ Employees 2,820,000 ‐‐ 2,820,000
18/04/2011 ‐ Directors 180,000 ‐‐ 180,000
20/04/2012 ‐ Employees 2,820,000 2,820,000
20/04/2012 ‐ Directors 180,000 180,000
Total 3,000,000 3,000,000 ‐‐ 6,000,000
24.c. Incentive Plans 30 June 2012 (Espresso)
The chart below shows the stock option plans of the Espresso group:
Semi-annual Interim Financial Report 2012 86

STOCK OPTION PLAN FOR EMPLOYEES AT JUNE 30 2012 (KOS group)
No. of Weighted No. of Weighted No. of Weighted No. of Weighted No. of Weighted Average No. of Weighted Vesting Expiryoptions average options average options average options average options average duration options average date date
strike price strike price strike price strike price strike price (years) strike price
Stock Option Plan '07 420,000 3.40 -- -- -- -- -- -- 420,000 3.40 8.3 420,000 3.40 30/09/2010 30/09/2020
Stock Option Plan '10 4,070,000 3.75 -- -- -- -- -- -- 4,070,000 3.75 8.5 1,526,250 3.75 31/12/2014 31/12/2020
Stock purchase Warrants '10 635,000 3.75 -- -- -- -- -- -- 635,000 3.75 8.5 238,125 3.75 31/12/2014 31/12/2020
Total 5,125,000 3.72 5,125,000 3.72 8.5 2,184,375 3.6827
Options exercisedin the period
Maturity ofoptionsin the period at end of period at end of period
Options expiring Options in circulation Options exercisableOptions in circulation Options awardedat start of period in the period
Semi-annual Interim Financial Report 2012 87

24.d. Incentive Plans 30 June 2012 (Sogefi) The following chart shows the total number of options outstanding and refers to the plans of the period 2004-2010 with their average strike prices:
30 June 2012 No. of options Average
strike price Not exercised/not exercisable at the start of the year 7,767,400 3.02
Assigned during the year -- --
Cancelled during the year (136,100) 3.92
Exercised during the year (48,000) 1.04
Not exercised/not exercisable at the end of the year 7,583,300 3,02
Exercisable at the end of the year 5,775,100 3,37
The line “Not exercised/not exercisable at the end of the year” refers to the total amount of the options net of those exercised or cancelled in the year under review or in previous years. The line “Exercisable at the end of the year” refers to the total amount of the options vested at the end of the year but not yet exercised. The following chart shows the breakdown of the number of options exercisable at 30 June 2012:
No. of options outstanding and exercisable at 31 December 2011 5,094,200
Options vested during the year 958,000
Options exercised during the year (229,100)
Options cancelled during the year (48,000)
No. of options outstanding and exercisable at 31 December 2011 5,775,100
The chart below shows the breakdown of the number of phantom stock options at 30 June 2012: 30 June 2012 Not exercised/not exercisable at the start of the year 1,830,000 Assigned during the year -- Cancelled during the year -- Exercised during the year -- Not exercised/not exercisable at the end of the year 1,830,000 Exercisable at the end of the year 1,830,000
24.e. Incentive Plans 30 June 2012 (KOS) The chart below shows the stock option plans of the KOS group:
Semi-annual Interim Financial Report 2012 88
25. Subsequent events Regarding subsequent events, reference should be made to the appropriate paragraph of the Interim Report on Operations. It should be noted that the Semi-Annual Interim Financial Report at 30 June 2011, that includes the Condensed Consolidated Semi-Annual Financial report, was approved by the Board of Directors on 29 July 2011.
26. Significant non-recurring events and transactions and any non-typical and/or unusual transactions
During the half year no non-recurring items of this nature were included in the operating results. Furthermore, note that there were no non-typical and/or unusual transactions.
27. Related party transactions Information showing the percentage of related-party transactions in the balance sheet, the cash flow statement and the net income for the first half of the year are given in the comments on the individual items of the financial statements. The paragraph “Other information” in the interim Report on Operations shows the nature of related-party transactions, the amounts of which are given in the explanatory Notes to the Financial Statements. The chart below gives a summary of economic and equity transactions with related parties:
Semi-annual Interim Financial Report 2012 89

28. Chart showing the key figures of the financial statements for 2011 of the parent company Cofide S.p.A. (Art. 2497 bis paragraph 4 of the Italian Civil Code)
STATEMENT OF FINANCIAL POSITION (in euro)
ASSETS 31.12.2011
NON-CURRENT ASSETS 587,176,989
CURRENT ASSETS 11,357,964
TOTAL ASSETS 598,534,953
LIABILITIES AND EQUITY 31.12.2011
EQUITY 558,473,088
NON-CURRENT LIABILITIES 38,045,069
CURRENT LIABILITIES 2,016,796
TOTAL LIABILITIES AND EQUITY 598,534,953 INCOME STATEMENT (in euro)
%(**) 2011
SUNDRY REVENUES AND INCOME 1,154,757
of which from related parties (*) 1,110,000 96.1
COSTS FOR THE PURCHASE OF GOODS (50,569)
COSTS FOR SERVICES (2,660,168)
of which from related parties (*) (457,380) 17.2
PERSONNEL COSTS (940,977)
OTHER OPERATING COSTS (483,731)
AMORTISATION, DEPRECIATION & WRITE-DOWNS (110,733)
OPERATING RESULT (3,091,421)
FINANCIAL INCOME 467,474
FINANCIAL EXPENSE (1,465,394)
DIVIDENDS 9,094,279
of which from related parties (*) 9,094,279 100.0
GAINS FROM TRADING SECURITIES 2,174,083
LOSSES FROM TRADING SECURITIES (636,713)
ADJUSTMENTS TO THE VALUE OF FINANCIAL ASSETS (4,716,500)
INCOME / LOSS BEFORE TAXES 1,825,808
INCOME TAXES --
NET INCOME (LOSS) FOR THE YEAR 1,825,808 (*) As per Consob Resolution No. 6064293 of 28 July 2006 (**) Percentage impact The financial highlights of the parent company COFIDE S.p.A. illustrated in the above summary chart, as required by Art. 2497-bis of the Italian Civil Code, were extracted from the related financial statements at 31 December 2010. For a correct and full understanding of the equity and financial position of COFIDE S.p.A. at 31 December 2010, and of the results the company achieved at that date, we refer readers to the financial statements in question which, accompanied by the Report of the Statutory Auditors and that of the Independent Auditors, and are available at the company’s registered offices or from Borsa Italiana.
Semi-annual Interim Financial Report 2012 90
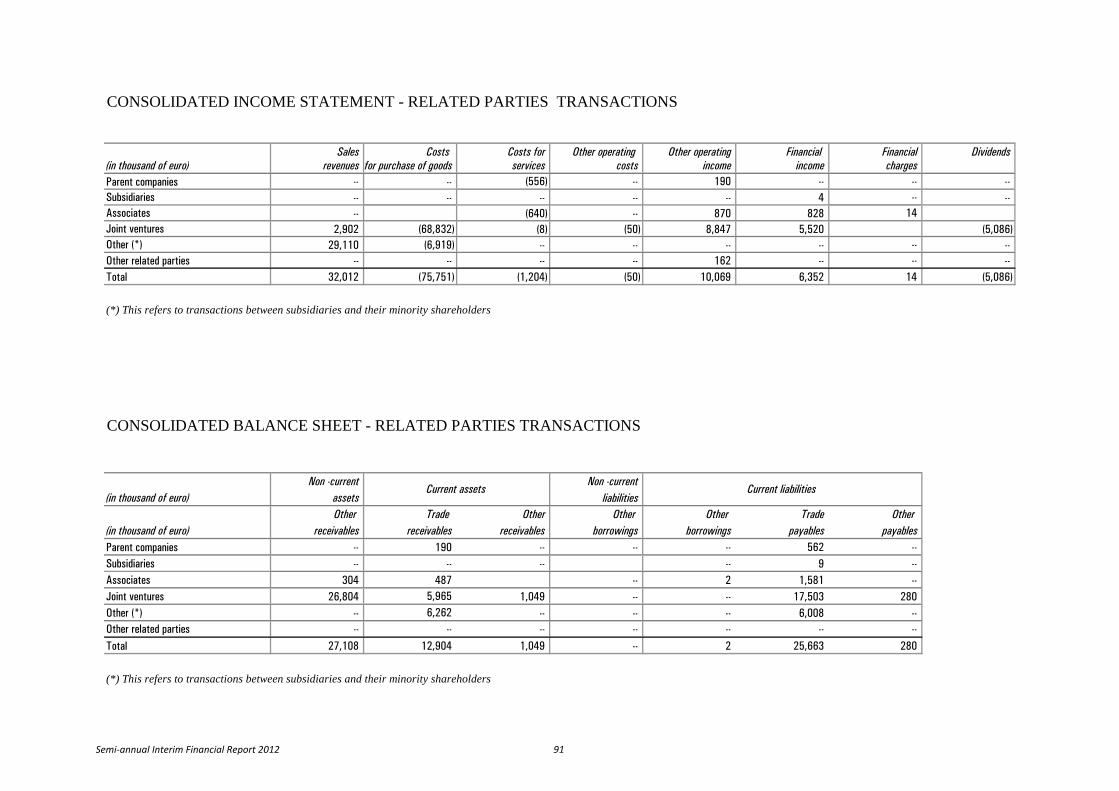
CONSOLIDATED INCOME STATEMENT - RELATED PARTIES TRANSACTIONS
Sales Costs Costs for Other operating Other operating Financial Financial Dividends(in thousand of euro) revenues for purchase of goods services costs income income chargesParent companies -- -- (556) -- 190 -- -- -- Subsidiaries -- -- -- -- -- 4 -- -- Associates -- (640) -- 870 828 14 Joint ventures 2,902 (68,832) (8) (50) 8,847 5,520 (5,086)Other (*) 29,110 (6,919) -- -- -- -- -- -- Other related parties -- -- -- -- 162 -- -- -- Total 32,012 (75,751) (1,204) (50) 10,069 6,352 14 (5,086)
(*) This refers to transactions between subsidiaries and their minority shareholders
CONSOLIDATED BALANCE SHEET - RELATED PARTIES TRANSACTIONS
Non -current Non -current(in thousand of euro) assets liabilities
Other Trade Other Other Other Trade Other (in thousand of euro) receivables receivables receivables borrowings borrowings payables payablesParent companies -- 190 -- -- -- 562 -- Subsidiaries -- -- -- -- 9 -- Associates 304 487 -- 2 1,581 -- Joint ventures 26,804 5,965 1,049 -- -- 17,503 280 Other (*) -- 6,262 -- -- -- 6,008 -- Other related parties -- -- -- -- -- -- -- Total 27,108 12,904 1,049 -- 2 25,663 280
(*) This refers to transactions between subsidiaries and their minority shareholders
Current assets Current liabilities
Semi-annual Interim Financial Report 2012 91

Semi-annual Interim Financial Report 2012 92

CERTIFICATION OF THE STATUTORY FINANCIAL STATEMENTS IN ACCORDANCE WITH ART. 154 BIS OF D. LGS 58/98 1. The undersigned Rodolfo De Benedetti, as Chief Executive Officer, and Gerardo Benuzzi, as Of-
ficer responsible for the preparation of the accounting and corporate documents of CIR S.p.A., do hereby certify, taking into account even the terms of Art. 154-bis, paragraphs 3 and 4, of Legisla-tive Decree no. 58 of February 24 1998:
- that the administrative and accounting procedures for the preparation of the Statutory Fi-
nancial Statements during the period 01 January 2012 - 30 June 2012 were adequate in rela-tion to the size and nature of the business and
- that they were effectively applied. 2. On this subject no aspects emerged that needed to be notified. 3. It is also certified that the Statutory Financial Statements: - were prepared in conformity with the international accounting standards recognized by the
European Union according to the terms of Regulation (EC) No. 1606/2002 of the European Par-liament and of the Council, of July 19 2002;
- correspond to the results of the books and the general ledger; - are suitable to give a true and fair representation of the equity, economic and financial position
of the issuer.
The Semi-annual report at 30 June 2012 includes a reliable analysis of performance and of the result of operations as well as the position of the issuer together with a description of the principal risks and uncertainties to which it is exposed. Milan, July 30 2012 Signed by Signed by Rodolfo De Benedetti Gerardo Benuzzi Chief Executive Officer Officer Responsible
Semi-annual Interim Financial Report 2012 93

Semi-annual Interim Financial Report 2012 94

LIST OF EQUITY INVESTMENTS AT JUNE 30 2012
In accordance with Art.38.2 of D.Lgs. no. 127/91 and art. 126 of Consob Resolution 11971 of May 14 1999
Semi-annual Interim Financial Report 2012 95

SUBSIDIARIES CONSOLIDATES USING THE FULL INTEGRATION METHOD (in euro or foreign currency) Name of Company Registered
office Share
Capital Currency Parent
Companies % of own.
CIR GROUP CIR INTERNATIONAL S.A. Lussemburgo 10,000,000.00 € CIR S.p.A. 100.00 CIRINVEST S.r.l. Italia 121,750.00 € CIR S.p.A. 100.00 CIGA LUXEMBOURG S.A.r.l. Lussemburgo 1,000,000.00 € CIR S.p.A. 100.00 JUPITER FINANCE S.p.A. Italia 2,700,000.00 € CIR S.p.A. 100.00
NEXENTI S.r.l. Italia 50,000.00 € CIR S.p.A. 100.00 JUPITER MARKETPLACE S.p.A. Italia 1,000,000.00 € NEXENTI S.r.l.. 100.00 DEVIL PEAK S.r.l. Italia 65,000.00 € NEXENTI S.r.l. 75.50 FOPPOLO RISORSE S.r.l. Italia 10,000.00 € DEVIL PEAK S.r.l. 76.50 CIR INVESTIMENTI S.p.A. Italia 12,426,162.00 € CIR S.p.A. 100.00 SORGENIA GROUP
SORGENIA HOLDING S.p.A. Italia 137,282,214.00 € CIR S.p.A. 65.03
SORGENIA S.p.A. Italia 9,203,327.00 € SORGENIA HOLDING S.p.A. 79.98
ENERGIA ITALIANA S.p.A. Italia 26,050,000.00 € SORGENIA S.p.A. 78.00
SORGENIA POWER S.p.A. Italia 20,100,000.00 € SORGENIA S.p.A. 100.00
SORGENIA NEXT S.r.l. Italia 10,000.00 € SORGENIA S.p.A. 100.00
SORGENIA PUGLIA S.p.A. Italia 11,150,778.00 € SORGENIA S.p.A. 100.00
SORGENIA BIOENERGY Italia 2,700,000.00 € SORGENIA S.p.A. 100.00
SORGENIA MENOWATT S.r.l. Italia 136,050.00 € SORGENIA S.p.A. 70.00
RACOON S.r.l. Italia 20,000.00 € SORGENIA S.p.A. 100.00
SORGENIA TRADING S.p.A. Italia 10,000,000.00 € SORGENIA S.p.A. 100.00
SORGENIA USA LLC Stati Uniti 22,414,969.00 $USA SORGENIA S.p.A. 100.00
NOVENTI VENTURES II LP Stati Uniti 33,029,543.00 $USA SORGENIA USA LLC 69.47
SORGENIA E&P S.p.A. Italia 32,587,500.00 € SORGENIA S.p.A. 100.00
SORGENIA INTERNATIONAL B.V. Olanda 2,004,000.00 € SORGENIA E&P S.p.A. 100.00
SORGENIA E&P COLOMBIA B.V. Olanda 6,518,000.00 € SORGENIA INTERNATIONAL B.V. 100.00
SORGENIA E&P UK LTD UK 2,487,761.00 £GBP SORGENIA INTERNATIONAL B.V. 100.00
SORGENIA E&P BULGARIA EOOD Bulgaria 11,153,137.00 BGN SORGENIA INTERNATIONAL B.V. 100.00
AZZURRO S.p.A. Italia 1,100,000.00 € SORGENIA S.p.A. 90.00
SORGENIA GREEN S.r.l. Italia 2,000,000.00 € SORGENIA S.p.A. 100.00
ENERGIA LUCANA S.p.A. Italia 50,000.00 € SORGENIA GREEN S.r.l. 100.00
SORGENIA CASTELNUOVO DI CONZA S.r.l. Italia 115,000.00 € SORGENIA GREEN S.r.l. 100.00
SORGENIA SAN GREGORIO MAGNO S.r.l. Italia 110,000.00 € SORGENIA GREEN S.r.l. 100.00
SORGENIA MINERVINO S.p.A. Italia 1,700,000.00 € SORGENIA GREEN S.r.l. 75.00
SORGENIA SAN MARTINO IN PENSILIS S.r.l. Italia 110,000.00 € SORGENIA GREEN S.r.l. 100.00
SORGENIA VENTO S.p.A. Italia 50,000.00 € SORGENIA GREEN S.r.l. 100.00
SORGENIA GEOTHERMAL S.r.l. Italia 10,000.00 € SORGENIA GREEN S.r.l. 100.00
SORGENIA BONEFRO S.r.l. Italia 110,000.00 € SORGENIA GREEN S.r.l. 100.00
SORGENIA CAGGIANO S.r.l. Italia 10,000.00 € SORGENIA GREEN S.r.l. 100.00
SORGENIA CAMPAGNA S.r.l. Italia 110,000.00 € SORGENIA GREEN S.r.l. 100.00
TORRE MAGGIORE WIND POWER S.r.l. Italia 10,000.00 € SORGENIA GREEN S.r.l. 75.00
SORGENIA ROMANIA S.r.l. Romania 16,377,719.00 Ron SORGENIA GREEN S.r.l. 74.98 SORGENIA S.p.A 25.02 100.00
Semi-annual Interim Financial Report 2012 96

Name of Company Registered office
Share Capital
Currency Parent Companies
% of own.
SORGENIA SOLAR S.r.l. Italia 670,000.00 € SORGENIA GREEN S.r.l. 100.00
SOLUXIA SARDA S.r.l. Italia 85,200.00 € SORGENIA SOLAR S.r.l. 85.00
SOLUXIA SARDA III S.r.l. Italia 60,000.00 € SORGENIA SOLAR S.r.l. 90.00
MPX ENERGY LTD UK 549,059.00 £GBP SORGENIA INTERNATIONAL B.V. 74.83
MPX (Oil & Gas) Limited UK 100.00 £GBP MPX ENERGY LTD 100.00
MPX RESOURCES Limited UK 10.00 £GBP MPX ENERGY LTD 100.00
MPX NORTH SEA Limited UK 10.00 £GBP MPX ENERGY LTD 100.00
HANNU NORTH SEA Limited UK 10.00 £GBP MPX ENERGY LTD 100.00
HANNU EXPLORATION Limited UK 10.00 £GBP MPX ENERGY LTD 100.00
SORGENIA FRANCE S.A. Francia 2,000,000.00 € SORGENIA GREEN S.r.l. 100.00
PVP 1 S.r.l. Italia 50,000.00 € SORGENIA SOLAR S.r.l. 100.00
SORGENIA CASTELVETERE S.r.l. Italia 60,000.00 € SORGENIA GREEN S.r.l. 100.00
SORGENIA POLAND B.V. Olanda 18,000.00 € SORGENIA INTERNATIONAL B.V. 100.00
SORGENIA RICIGLIANO S.r.l. Italia 60,000.00 € SORGENIA GREEN S.r.l. 100.00
CAP ENERGIE Francia 10,000.00 € SORGENIA FRANCE S.A. 100.00
ESPRESSO GROUP
GRUPPO EDITORIALE L’ESPRESSO S.p.A. (*) Italia 61,534,498.20 € CIR S.p.A. 53.82
FINEGIL EDITORIALE S.p.A. Italia 128,798,515.00 € GRUPPO EDITORIALE L’ESPRESSO S.p.A. 99.78
EDITORIALE LA NUOVA SARDEGNA S.p.A. Italia 775,500.00 € FINEGIL EDITORIALE S.p.A. 100.00
S.E.T.A. S.p.A. Italia 774,750.00 € FINEGIL EDITORIALE S.p.A. 71.00
A. MANZONI & C. S.p.A. Italia 15,000,000.00 € GRUPPO EDITORIALE L’ESPRESSO S.p.A. 100.00
ROTOCOLOR S.p.A. Italia 23,000,000.00 € GRUPPO EDITORIALE L’ESPRESSO S.p.A. 100.00
SOMEDIA S.p.A. Italia 500,000.00 € GRUPPO EDITORIALE L’ESPRESSO S.p.A. 100.00
ELEMEDIA S.p.A. Italia 25,000,000.00 € GRUPPO EDITORIALE L’ESPRESSO S.p.A. 100.00
RETE A S.p.A. Italia 13,198,000.00 € GRUPPO EDITORIALE L’ESPRESSO S.p.A. 100.00
ALL MUSIC S.p.A. Italia 6,500,000.00 € RETE A S.p.A. 100.00
SOGEFI GROUP
SOGEFI S.p.A. (**) Italia 60,689,715.84 € CIR S.p.A. 56.38
SOGEFI REJINA S.p.A. Italia 21,978,316.00 € SOGEFI S.p.A. 99.88
FILTRAUTO S.A. Francia 5,750,000.00 € SOGEFI S.p.A. 99.99
SOGEFI FILTRATION Ltd UK 5,126,737.00 £GBP SOGEFI S.p.A. 100.00
SOGEFI FILTRATION S.A. Spagna 12,953,713.60 € SOGEFI S.p.A. 86.08 FILTRAUTO S.A. 13.92 100.00
SOGEFI FILTRATION d.o.o. Slovenia 10,291,798.00 € SOGEFI S.p.A. 100.00
ALLEVARD REJNA AUTOSUSPENSIONS S.A. Francia 36,000,000.00 € SOGEFI S.p.A. 99.99
SOGEFI PURCHASING S.a.s. Francia 100,000.00 € SOGEFI S.p.A. 100.00
ALLEVARD SOGEFI U.S.A. Inc. Stati Uniti 20,055,000.00 $USA SOGEFI S.p.A. 100.00
SYSTÈMES MOTEURS S.A-S- Francia 54,938,125.00 € SOGEFI S.p.A. 100.00
SOGEFI FILTRATION DO BRASIL Ltda Brasile 29,857,374.00 Real SOGEFI FILTRATION S.A. 99.99
SOGEFI FILTRATION ARGENTINA S.A. Argentina 10,691,607.00 Pesos SOGEFI FILTRATION DO BRASIL Ltda 91.90 FILTRAUTO S.A. 7.28 SOGEFI REJNA S.p.A. 0.81 99.99
SHANGHAI SOGEFI AUTO PARTS Co., Ltd Cina 13,000,000.00 $USA SOGEFI S.p.A. 100.00
(*) 55,70 % net of own shares held as treasury stock (**) 58,26% net of own shares held as treasury stock
Semi-annual Interim Financial Report 2012 97

Name of Company Registered office
Share Capital
Currency Parent Companies
% of own.
ALLEVARD SPRINGS Ltd UK 4,000,002.00 £GBP ALLEVARD REJNA AUTOSUSPENSIONS S.A. 99.99
ALLEVARD FEDERN GmbH Germania 50,000.00 € ALLEVARD REJNA AUTOSUSPENSIONS S.A. 100.00
ALLEVARD REJNA ARGENTINA S.A. Argentina 600,000.00 Pesos ALLEVARD REJNA AUTOSUSPENSIONS S.A. 89.97 ALLEVARD MOLAS DO BRAZIL Ltda 10.00
99.97
IBERICA DE SUSPENSIONES S.L. (ISSA) Spagna 10,529,668.00 € ALLEVARD REJNA AUTOSUSPENSIONS S.A 50.00
ALLEVARD MOLAS DO BRAZIL Ltda Brasile 37,161,683.00 Real ALLEVARD REJNA AUTOSUSPENSIONS S.A 99.99
ALLEVARD SPRINGS Co. Ltd 0.01
100.00
UNITED SPRINGS Ltd UK 6,500,000.00 £GBP ALLEVARD REJNA AUTOSUSPENSIONS S.A 100.00
UNITED SPRINGS B.V. Olanda 254,979.00 € ALLEVARD REJNA AUTOSUSPENSIONS S.A. 100.00
SHANGHAI ALLEVARD SPRING Co. Ltd Cina 5,335,308.00 € ALLEVARD REJNA AUTOSUSPENSIONS S.A. 60.58
UNITED SPRINGS S.A.S. Francia 10,218,000.00 € ALLEVARD REJNA AUTOSUSPENSIONS S.A. 99.99
LUHN & PULVERMACHER – DITTMANN & NEUHAUS GmbH Germania 50,000.00 € ALLEVARD FEDERN GmbH 100.00
S.ARA COMPOSITE S.a.S. Francia 11,000,000.00 € ALLEVARD REJNA AUTOSUSPENSIONS S.A. 90.91
SOGEFI M.N.R. FILTRATION INDIA Pvt Ltd India 15,940,980.00 Inr FILTRAUTO S.A. 60.00
ALLEVARD IAI SUSPENSIONS PRIVATE Ltd India 129,850,000.00 Inr ALLEVARD REJNA AUTOSUSPENSIONS S.A. 57.74
SOGEFI ALLEVARD S.r.l. Romania 210,000.00 Ron SOGEFI REJNA S.p.A. 100.00 SOGEFI ENGINE SYSTEMS CANADA CORP.
(GIA’ MARK IV AIR INTAKE SYSTEMS CORP.) Canada 39,393,000.00 Cad SYSTÈMES MOTEURS S.A-S 100.00
SOGEFI ENGINE SYSTEMS USA INC.
(GIA’MARK IV SYSTÈMES MOTEURS USA Inc.) Stati Uniti 100.00 $USA SYSTÈMES MOTEURS S.A-S 100.00
SYSTÈMES MOTEURS CHINA S.à.r.l. Lussemburgo 12,500.00 € SYSTÈMES MOTEURS S.A-S 100.00
MARK IV AIR INTAKE INDIA Pvt. Ltd. India 20,684,570.00 Inr SYSTÈMES MOTEURS S.A-S 99.52 SYSTÈMES MOTEURS CHINA S.à.r.l. 0.48
100.00
SYSTÈMES MOTEURS S.r.l. Romania 1,000.00 Ron SYSTÈMES MOTEURS S.A-S 98.02
SOGEFI FILTRATION S.A. 1.98
99.00
SOGEFI ENGINE SYSTEMS HONG KONG Ltd Hong Kong 1,000.00 Hkd SYSTÈMES MOTEURS CHINA S.à.r.l. 100.00
MARK IV (Shanghai) TRADING Co. Ltd Cina 5,000,000.00 Rmb SOGEFI ENGINE SYSTEMS HONG KONG 100.00
KOS GROUP
KOS S.p.A. Italia 8,565,211.70 € CIR S.p.A. 51.26
REDANCIA S.r.l. Italia 100,000.00 € KOS S.p.A. 100.00
OSPEDALE DI SUZZARA S.p.A. Italia 120,000.00 € KOS S.p.A 99.90
MEDIPASS S.r.l. Italia 700,000.00 € KOS S.p.A 100.00
ELSIDA S.r.l. Italia 100,000.00 € MEDIPASS S.r.l. 100.00
MEDIPASS HEALTHCARE LTD Regno Unito 1,000.00 £GBP MEDIPASS S.r.l. 65.00
CLEARMEDI HEALTHCARE LTD India 1,086,850.00 Inr MEDIPASS HEALTHCARE LTD 51.00
RESIDENZE ANNI AZZURRI S.r.l. Italia 27,079,034.00 € KOS S.p.A 100.00
HSS REAL ESTATE S.r.l. Italia 2,064,000.00 € KOS S.p.A 100.00
PARCO IMMOBILIARE S.r.l. Italia 100,000.00 € KOS S.p.A 100.00
ISTITUTO DI RIABILITAZIONE S. STEFANO S.r.l. Italia 2,550,000.00 € KOS S.p.A 100.00
ABITARE IL TEMPO S.r.l. Italia 99,000.00 € ISTITUTO DI RIABILITAZIONE S. STEFANO S.r.l. 55.00
CASA ARGENTO S.r.l. Italia 1,096,500.00 € ABITARE IL TEMPO S.r.l. 90.00
ARIEL TECHNOMEDICAL S.r.l. Italia 10,000.00 € ISTITUTO DI RIABILITAZIONE S. STEFANO S.r.l. 51.00
SANATRIX S.r.l. Italia 843,700.00 € ISTITUTO DI RIABILIT. NE S. STEFANO S.r.l. 76.97
Semi-annual Interim Financial Report 2012 98
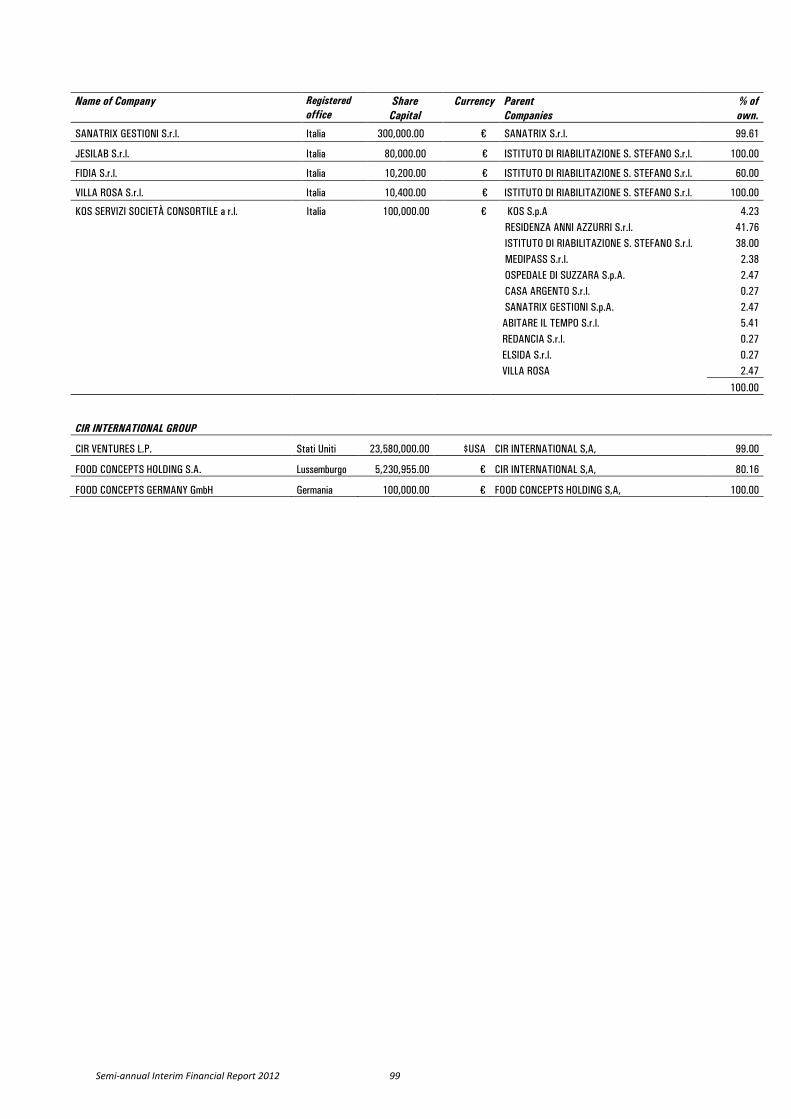
Name of Company Registered office
Share Capital
Currency Parent Companies
% of own.
SANATRIX GESTIONI S.r.l. Italia 300,000.00 € SANATRIX S.r.l. 99.61
JESILAB S.r.l. Italia 80,000.00 € ISTITUTO DI RIABILITAZIONE S. STEFANO S.r.l. 100.00
FIDIA S.r.l. Italia 10,200.00 € ISTITUTO DI RIABILITAZIONE S. STEFANO S.r.l. 60.00
VILLA ROSA S.r.l. Italia 10,400.00 € ISTITUTO DI RIABILITAZIONE S. STEFANO S.r.l. 100.00
KOS SERVIZI SOCIETÀ CONSORTILE a r.l. Italia 100,000.00 € KOS S.p.A 4.23 RESIDENZA ANNI AZZURRI S.r.l. 41.76 ISTITUTO DI RIABILITAZIONE S. STEFANO S.r.l. 38.00 MEDIPASS S.r.l. 2.38 OSPEDALE DI SUZZARA S.p.A. 2.47 CASA ARGENTO S.r.l. 0.27 SANATRIX GESTIONI S.p.A. 2.47 ABITARE IL TEMPO S.r.l. 5.41 REDANCIA S.r.l. 0.27 ELSIDA S.r.l. 0.27 VILLA ROSA 2.47
100.00
CIR INTERNATIONAL GROUP
CIR VENTURES L.P. Stati Uniti 23,580,000.00 $USA CIR INTERNATIONAL S,A, 99.00
FOOD CONCEPTS HOLDING S.A. Lussemburgo 5,230,955.00 € CIR INTERNATIONAL S,A, 80.16
FOOD CONCEPTS GERMANY GmbH Germania 100,000.00 € FOOD CONCEPTS HOLDING S,A, 100.00
Semi-annual Interim Financial Report 2012 99

INVESTMENTS IN JOINT VENTURES AND ASSOCIATES CONSOLIDATED USING THE EQUITY METHOD
(in euro or foreign currency) Name of Company Registered
office Share
capital Currency Parent companies % of
own.
CIR GROUP
LAKE LEMAN INTERNATIONAL SCHOOL S.A. Svizzera 395,000.00 Chf CIR S.p.A. 49.36
SORGENIA GROUP
TIRRENO POWER S.p.A. Italia 91,130,000.00 € ENERGIA ITALIANA S.p.A. 50.00
GICA S.A. Svizzera 4,000,000.00 Chf SORGENIA S.p.A. 25.00
P&F Società agricola S.r.l. Italia 10,000.00 € SORGENIA S.p.A. 50.00
FIN GAS S.r.l. Italia 10,000.00 € SORGENIA S.p.A. 50.00
LNG MED GAS TERMINAL S.r.l. Italia 23,940,655.00 € FIN GAS S.r.l 70.00
SORGENIA FRANCE PRODUCTION S.A. Francia 10,602,360.00 € SORGENIA FRANCE S.A. 50.00
PARC ÉOLIEN DE LA VOIE SACRÉE S.a.s. Francia 2,197,000.00 € SORGENIA FRANCE PRODUCTION S.A. 24.86
PARC ÉOLIEN D’EPENSE S.a.s. Francia 802,000.00 € SORGENIA FRANCE PRODUCTION S.A. 25.00
PARC ÉOLIEN DE HERBISSONNE S.a.s. Francia 37,000.00 € SORGENIA FRANCE PRODUCTION S.A. 50.00
SAPONIS INVESTMENTS SP ZOO Polonia 532,500.00 Zt (PLN) SORGENIA INTERNATIONAL B.V. 26.76
VOLTERRA A.E. Grecia 3,609,402.00 € SORGENIA GREEN S.r.l. 50.00
SOCIÉTÉ FRANÇAISE DES ALIZÉS SARL Francia 580,125.00 € SORGENIA FRANCE PRODUCTION S.A. 100.00
PARC ÉOLIEN DE SAINT CRÉPIN S.a.s. Francia 1,657,000.00 € SORGENIA FRANCE PRODUCTION S.A. 100.00
PARC ÉOLIEN DE L’ARGONNE S.a.s. Francia 2,179,000.00 € SORGENIA FRANCE PRODUCTION S.A. 100.00
PARC ÉOLIEN DE CÔTE DE CHAMPAGNE SUD S.a.s. Francia 802,000.00 € SORGENIA FRANCE PRODUCTION S.A. 100.00
PARC ÉOLIEN DE CÔTE DE CHAMPAGNE S.a.s. Francia 2,179,000.00 € SORGENIA FRANCE PRODUCTION S.A. 100.00
PARC ÉOLIEN DE BERNAY ST MARTIN S.a.s. Francia 2,987,400.00 € SORGENIA FRANCE PRODUCTION S.A. 100.00
HOLDING DES PARCS ÉOLIENS DE LA VOIE SACRÉE S.a.s. Francia 9,757,000.00 € SORGENIA FRANCE PRODUCTION S.A. 100.00
PARC ÉOLIEN DE LONGEVILLE SUR MER S.a.s. Francia 37,000.00 € SORGENIA FRANCE PRODUCTION S.A. 100.00
PARC ÉOLIEN DE L’ORME CHAMPAGNE S.a.s. Francia 37,000.00 € SORGENIA FRANCE PRODUCTION S.A. 100.00
PARC ÉOLIENS DU NORD PAS-DE-CALAIS S.a.s. Francia 400,000.00 € SORGENIA FRANCE PRODUCTION S.A. 100.00
PARC ÉOLIEN DE BOUILLANCOURT EN SÉRY S.a.s. Francia 537,000.00 € SORGENIA FRANCE PRODUCTION S.A. 100.00
PARC ÉOLIEN DE LEFFINCOURT S.a.s. Francia 4,537,000.00 € SORGENIA FRANCE PRODUCTION S.A. 100.00
PARC D’AULNAY L’AÎTRE S.a.s. Francia 37,000.00 € SORGENIA FRANCE PRODUCTION S.A.. 100.00
PARC ÉOLIEN DE BUSSY LE REPOS S.a.s. Francia 10,000.00 € SORGENIA FRANCE PRODUCTION S.A. 100.00
PARC ÉOLIEN DE LA TIERACHE S.a.s. Francia 10,000.00 € SORGENIA FRANCE PRODUCTION S.A.. 100.00
PARC ÉOLIEN DE PLAINCHAMP S.a.s. Francia 3,037,000.00 € SORGENIA FRANCE PRODUCTION S.A. 100.00
PARC ÉOLIEN DE BLOMBAY L’ECHELLE S.a.s. Francia 5,000.00 € SORGENIA FRANCE PRODUCTION S.A. 100.00
PARC ÉOLIEN DE LA VALLE DU DON S.a.s. Francia 5,000.00 € SORGENIA FRANCE PRODUCTION S.A. 100.00
PARC ÉOLIEN DE SOURCE DE L’HERBISSONNE S.a.s. Francia 10,000,00 € SORGENIA FRANCE PRODUCTION S.A. 100.00
PARC ÉOLIEN DE SEUIL MONT LAURENT S.a.s. Francia 10,000.00 € SORGENIA FRANCE PRODUCTION S.A. 100.00
PARC ÉOLIEN DE MAURECHAMPS S.a.s. Francia 1,117,000.00 € HOLDING DES PARCS ÉOLIENS DE LA VOIE SACRÉE S.a.s. 100.00
PARC ÉOLIEN DE RAIVAL S.a.s. Francia 1,117,000.00 € HOLDING DES PARCS ÉOLIENS DE LA VOIE SACRÉE S.a.s. 100.00
PARC ÉOLIEN DE LA VALETTE S.a.s. Francia 1,117,000.00 € HOLDING DES PARCS ÉOLIENS DE LA VOIE SACRÉE S.a.s. 100.00
PARC ÉOLIEN DE VILLER S.a.s. Francia 577,000.00 € HOLDING DES PARCS ÉOLIENS DE LA VOIE SACRÉE S.a.s. 100.00
TIRRENO SOLAR S.r.l. Italia 100,000.00 € TIRRENO POWER S.p.A. 100.00
ILIOFANIA A.E. Grecia 300,000.00 € VOLTERRA A.E. 100.00
Semi-annual Interim Financial Report 2012 100

INVESTMENTS IN JOINT VENTURES AND ASSOCIATES CONSOLIDATED USING THE EQUITY METHOD
(in euro or foreign currency) Name of Company Registered
office Share
Capital Currency Parent Company % of
own.
ESPRESSO GROUP
LE SCIENZE S.p.A. Italia 103,400.00 € GRUPPO EDITORIALE L’ESPRESSO S.p.A. 50.00
EDITORIALE CORRIERE ROMAGNA S.r.l. Italia 2,856,000.00 € FINEGIL EDITORIALE S.p.A. 49.00
EDITORIALE LIBERTÀ S.p.A. Italia 1,000,000.00 € FINEGIL EDITORIALE S.p.A. 35.00
ALTRIMEDIA S.p.A. Italia 517,000.00 € FINEGIL EDITORIALE S.p.A. 35.00
SOGEFI GROUP
MARK IV ASSET (Shanghai) AUTO PARTS Co. Ltd Cina 10,000,000.00 Rmb MARK IV HONG KONG Limited 50.00
CIR INTERNATIONALGROUP
KTP GLOBAL FINANCE S.C.A. Lussemburgo 566,573.75 € CIR INTERNATIONAL S.A. 47.56
SWISS EDUCATION GROUP AG Svizzera 81,886.00 CHF CIR INTERNATIONAL S.A. 19.54
Semi-annual Interim Financial Report 2012 101

INVESTEMENTS IN SUBSIDIARIES AND ASSOCIATES CONSOLIDATED AT COST(*)
(in euro o valuta) Name of company Registered
office Shares capital
Currency Parent Companies % of own.
SORGENIA GROUP
TECNOPARCO VALBASENTO S.p.A. Italia 945,000.00 € SORGENIA S.p.A. 30.00
E-ENERGY S.r.l. Italia 15,000.00 € SORGENIA S.p.A. 20.00
EOLICA BISACCIA S.r.l. Italia 10,000.00 € SORGENIA GREEN S.r.l. 20.00
OWP PARC ÉOLIEN DU BANC DES OLIVES S.a.s. Francia 10,000.00 € SORGENIA FRANCE S.A. 20.00
SORGENIA TRINIDAD & TOBAGO HOLDING LTD Trinidad & Tobago 1,000.00 $USD SORGENIA INTERNATIONAL B.V. 100.00
RSG B.V. Olanda 18,000.00 € SORGENIA INTERNATIONAL B.V. 33.33
PHOTOVOLTAIQUE DE MARVILLE S.a.s. Francia 5,000.00 € SORGENIA FRANCE S.A. 100.00
PVP2 S.r.l. Italia 10,000.00 € SORGENIA SOLAR S.r.l. 100.00
PVP3 S.r.l. Italia 10,000.00 € SORGENIA SOLAR S.r.l. 100.00
ECOPARC DES ENERGIES S.a.s. Francia 10,000.00 € SORGENIA FRANCE S.A. 100.00
EOLIAN MEDGIDIA PESTERA S.r.l. Romania 400.00 RON SORGENIA ROMANIA S.r.l. 97.50
SORGENIA GREEN S.r.l. 2.50
100.00
SORGENIA ASD S.r.l. Italia 10,000.00 € SORGENIA GREEN S.r.l. 100.00
ESPRESSO GROUP
ENOTRYA S.r.l. (in liquidazione) Italia 78,000.00 € ELEMEDIA S.p.A. 70.00
CELLULARMANIA.COM S.r.l. (in liquidazione) Italia 10,400.00 € ELEMEDIA S.p.A. 100.00
KSOLUTIONS S.p.A. (in liquidazione) Italia 1,000,000.00 € ELEMEDIA S.p.A. 100.00
BENEDETTINE S.r.l. (in liquidazione) Italia 255,000.00 € FINEGIL EDITORIALE S.p.A. 35.00
PREMIUN PUBLISHER NETWORK CONSORZIO Italia 53,377.94 € GRUPPO EDITORIALE L’ESPRESSO S.p.A. 20.51
CLUB D.A.B. ITALIA – CONSORTILE S.p.A. Italia 120,000.00 € ELEMEDIA S.p.A. 27.50
KOS GROUP
OSIMO SALUTE S.p.A. Italia 750,000.00 € ABITARE IL TEMPO S.r.l. 25.50
CONSORZIO OSPEDALE DI OSIMO Italia 20,000.00 € ABITARE IL TEMPO S.r.l. 24.70
CIR INTERNATIONALGROUP
PHA – Participations Hotelieres Astor Francia 12,150.00 € CIR INTERNATIONAL S.A. 99.99
KTP GLOBAL FINANCE MANAGEMENT S.A. Lussemburgo 31,000.00 € CIR INTERNATIONAL S.A. 46.00
(*) Investments which are non- significant , non operational or recently acquired, unless stated otherwise
Semi-annual Interim Financial Report 2012 102

INVESTMENTS IN OTHER COMPANIES CONSOLIDATED AT COST(*) (in euro or foreign currency) Name of Company Registered
office Share Capital Currency Parent Companies % of own.
SORGENIA GROUP
EAL COMPOST S.r.l. Italia 4,199,981.00 € SORGENIA BIOENERGY S.p.A. 5.79
ESPRESSO GROUP
AGENZIA A.N.S.A. S. COOP. A.r.l. Italia 11,921,162.64 € GRUPPO EDITORIALE L’ESPRESSO S.p.A. 3.81 FINEGIL EDITORIALE S.p.A. 8.97 EDITORIALE LA NUOVA SARDEGNA S.p.A. 3.17 S.E.T.A. S.p.A. 2.53 18.48
CONSULEDIT S. CONSORTILE a.r.l. Italia 20,000.00 € GRUPPO EDITORIALE L’ESPRESSO S.p.A. 6.64 FINEGIL EDITORIALE S.p.A. 4.86 EDITORIALE LA NUOVA SARDEGNA S.p.A. 0.62 S.E.T.A. S.p.A. 0.49 12.61
IMMOBILIARE EDITORI GIORNALI S.r.l. Italia 830,462.00 € S.E.T.A. S.p.A. 0.17 EDITORIALE LA NUOVA SARDEGNA S.p.A. 0.12 0.29
TRENTO PRESS SERVICE S.r.l. Italia 260,000.00 € S.E.T.A. S.p.A. 14.40
AGENZIA INFORMATIVA ADRIATICA d.o.o. Slovenia 12,767.75 Sit. FINEGIL EDITORIALE S.p.A. 19.00
AUDIRADIO S.r.l. (in liquidazione) Italia 258,000.00 € A. MANZONI & C. S.p.A. 7.50
PRESTO TECHNOLOGIES Inc. (non operativa) Stati Uniti 7,663,998.40 $USA ELEMEDIA S.p.A. 7.83
CERT – CONSORZIO EMITTENTI RADIO TELEVISIVE Italia 177,531.00 € RETE A S.p.A. 6.67
CONSORZIO COLLE MADDALENA Italia 62,224.08 € RETE A S.p.A. 4.17
CONSORZIO ANTENNA COLBUCCARO Italia 180,000.00 € RETE A S.p.A. 8.89
TELELIBERTÀ S.p.A. Italia 2,200,000.00 € FINEGIL EDITORIALE S.p.A. 4.32
SOGEFI GROUP
UMC & MAKKAWI SPRING MANUFACTURING Co., Ltd Sudan 900,000.00 Ls.Pt. SOGEFI REJNA S.p.A. 25.00
AFICO FILTERS S.A.E. Egitto 11,000,000.00 EGP SOGEFI REJNA S.p.A. 22.62
KOSGROUP
FONDO SPAZIO SANITÀ Italia 18,000,000.00 € ISTITUTO DI RIABILITAZIONE S. STEFANO S.r.l. 1.11
FONDO SPAZIO SANITÀ Italia 18,000,000.00 € VILLA ROSA S.r.l. 1.11
FONDO SPAZIO SANITÀ Italia 18,000,000.00 € RESIDENZE ANNI AZZURRI S.r.l. 2.78
(*) Investments of less than 20%
Semi-annual Interim Financial Report 2012 103

INVESTMENTS IN SUBSIDIARIES AND ASSOCIATES AND IN OTHER COMPANIES NOT INCLUDED IN THE CONSOLIDATED FINANCIAL STATEMENTS (in euro or foreign currency) Name of Company Registered
office Share
Capital Currency Parent Comapnies % of
own.
CIR GROUP
FINAL S.A. (in liquidazione) Francia 2,324,847.00 € CIGA LUXEMBOURG S.A.r.l. 47.73
SOGEFI GROUP INTEGRAL S.A. (in liquidazione) Argentina 2,515,600.00 Pesos FILTRAUTO S.A. 93.50 SOGEFI FILTRATION ARGENTINA S.A. 6.50 100.00
Semi-annual Interim Financial Report 2012 104

CIR S.p.A.
Financial Statements of the Parent Company as of June 30 2012
STATEMENT OF FINANCIAL POSITION
INCOME STATEMENT
STATEMENT OF COMPREHENSIVE INCOME
STATEMENT OF CASH FLOW
STATEMENT OF CHANGES IN EQUITY
Semi-annual Interim Financial Report 2012 105

1. STATEMENT OF FINANCIAL POSITION
(in euro)
ASSETS %(**) 30.06.2012 %(**) 31.12.2011
NON-CURRENT ASSETS 1,516,273,763 1,515,143,617 INTANGIBLE ASSETS 64,741 81,051
TANGIBLE ASSETS 2,720,025 2,776,098
INVESTMENT PROPERTY 16,685,045 16,970,956
EQUITY INVESTMENTS 1,183,051,608 1,182,997,824
SUNDRY RECEIVABLES 310,712,108 311,238,606 of which with related parties (*) 310,688,270 100.0 311,214,640 100.0
DEFERRED TAXES 3,040,236 1,079,082
CURRENT ASSETS 337,044,705 334,400,267 SUNDRY RECEIVABLES 13,162,730 27,501,423
of which with related parties (*) 2,598,590 19.7 22,582,074 82.1
FINANCIAL RECEIVABLES 186,382 186,382 of which with related parties (*) 84,477 45.3 84,477 45.3
SECURITIES 170,133,724 169,423,608
CASH AND CASH EQUIVALENTS 153,561,869 137,288,854
TOTAL ASSETS 1,853,318,468 1,849,543,884
LIABILITIES AND SHAREHOLDERS' EQUITY %(**) 30.06.2012 %(**) 31.12.2011
SHAREHOLDERS' EQUITY 948,559,001 946,037,379 ISSUED CAPITAL 396,670,234 396,665,734
less OWN SHARES (24,994,500) (24,994,500)
SHARE CAPITAL 371,675,734 371,671,234
RESERVES 357,607,662 356,316,023
RETAINED EARNINGS/(LOSSES) 199,489,797 217,780,978
NET INCOME FOR THE PERIOD 19,785,808 269,144
NON-CURRENT LIABILITIES 307,626,330 299,107,127 BONDS AND NOTES 306,223,301 297,561,711
PERSONNEL PAYABLES 1,403,029 1,545,416
CURRENT LIABILITIES 597,133,137 604,399,378 BANK OVERDRAFT -- --
BORROWINGS 564,248,109 564,573,109 of which from related parties (*) -- -- 325,000 0.1
OTHER PAYABLES 8,157,579 22,372,289 of which from related parties (*) 4,876,679 59.8 7,622,246 34.1
PROVISIONS FOR RISKS AND LOSSES 24,727,449 17,453,980
TOTAL LIABILIETIES AND SHAREHOLDERS' EQUITY 1,853,318,468 1,849,543,884
(*) As per Consob resolution no. 6064293 of July 28 2006(**) Percentage of the whole
Semi-annual Interim Financial Report 2012 106

2. INCOME STATEMENT
(in euro)
%(**) 1st Half 2012
%(**) 1st Half 2011
SUNDRY REVENUES AND INCOME 3,211,126 3,414,082 of which from related parties(*) 2,871,134 89.4 2,967,396 86.9
COSTS FOR SERVICES (3,297,781) (11,056,705) of which from related parties(*) (556,000) 16.9 (840,000) 7.6
PERSONNEL COSTS (4,228,241) (4,759,939)OTHER OPERATING COSTS (1,360,006) (929,490)AMORTISATION, DEPRECIATION AND WRITEDOWNS (375,258) (404,213)
OPERATING RESULT (6,050,160) (13,736,265)
FINANCIAL INCOME 7,085,507 4,086,048 of which from related parties(*) 4,597,053 64.9 3,225,570 78.9
FINANCIAL EXPENSE (15,979,249) (8,970,094) of which with related parties(*) -- -- -- --
DIVIDENDS 31,183,767 29,307,556 of which from related parties(*) 31,148,856 99.9 29,282,315 99.9
GAINS FROM TRADING SECURITIES 19,410 18,550 LOSSES FROM TRADING SECURITIES -- (141,540)ADJUSTMENTS TO THE VALUE OF FINANCIAL ASSETS 171,224 (985,372)
INCOME/(LOSS) BEFORE TAXES 16,430,499 9,578,883 INCOME TAXES 3,355,309 4,621,763
NET INCOME/ (LOSS) FOR THE PERIOD 19,785,808 14,200,646
BASIC EARNINGS PER SHARE (in euro) 0.0266 0.0190 DILUTED EARNINGS PER SHARE (in euro) 0.0266 0.0189
(*) As per ConsobResolution no. 6064293 of July 28 2006(**) Percentage of whole
Semi-annual Interim Financial Report 2012 107

3. STATEMENT OF COMPREHENSIVE INCOME
(in thousands euro)
1st Half2012
1st Half2011
Net income for the period 19,785,808 14,200,646
Other items of comprehensive income -- --
Other items of comprehensive income for the period,net of tax -- --
TOTAL STATEMENT OF COMPREHENSIVE INCOME FOR THE PERIOD 19,785,808 14,200,646
BASIC COMPREHENSIVE EARNINGS PER SHARE (in euro) 0.0266 0.0190DILUTED COMPREHENSIVE EARNINGS PER SHARE (in euro) 0.0266 0.0189
Semi-annual Interim Financial Report 2012 108

4. STATEMENT OF CASH FLOW
(in euro)
OPERATING ACTIVITY
NET INCOME FOR THE PERIOD 19,785,808 14,200,646 ADJUSTMENTS:AMORTIZATION, DEPRECIATION AND WRITEDOWNS 375,258 404,213 LOSSES (GAINS) FROM SALE OF INVESTMENTS & CURRENT SECURITIES (19,410) 122,990 ACTUARIAL VALUATION OF STOCK OPTION PLANS 1,310,807 2,174,938 PROVISIONS TO LEAVING INDEMNITY FUND 133,074 153,666 ADJUSTMENT TO THE VALUE OF FINANCIAL ASSETS (171,224) 985,372
(INCREASE) REDUCTION IN NET WORKING CAPITAL 9,299,386 9,201,874 of which with related parties 16,912,917 3,938,042
CASH FLOW FROM OPERATING ACTIVITY 30,713,699 27,243,699
of which:- interest received (paid) 2,568,210 938,075 - dividends received 31,183,767 29,307,556 -receipts (payments) of income taxes * 11,180,590 5,408,979
INVESTMENT ACTIVITY
(PURCHASE) SALE OF CURRENT SECURITIES (519,482) 8,785,332 (PURCHASE) SALE OF CAPITAL ASSETS (70,748) (4,273,966)
CASH FLOW FROM INVESTMENT ACTIVITY (590,230) 4,511,366
FUNDING ACTIVITY
DIVIDENDS PAID (18,583,910) (18,726,205)REPAYMENT (DRAWDOWN) LOANS TO SUBSIDIARIES 5,000,000 (157,500,000)INFLOWS FROM CAPITAL INCREASES 8,917 1,145,989 OTHER CHANGES (275,461) (132,472)
CASH FLOW FROM FUNDING ACTIVITY (13,850,454) (175,212,688)
INCREASE (REDUCTION) IN NET CASH & CASH EQUIVALENTS 16,273,015 (143,457,623)
NET CASH & CASH EQUIVALENTS AT START OF PERIOD 137,288,854 171,615,318
NET CASH & CASH EQUIVALENTS AT END OF PERIOD 153,561,869 28,157,695
* The amounts refer to current tax assets received from taking part in tax consolidation
1st Half2012
1st Half 2011
Semi-annual Interim Financial Report 2012 109

(in euro) Issued less Share Reserves Retained earnings Net Income Totalcapital own shares capital (losses) for the period
BALANCE AT DECEMBER 31 2010 396,058,634 (21,537,000) 374,521,634 348,901,164 259,833,508 (14,715,748) 968,540,558
Capital Increases 607,100 -- 607,100 644,827 -- -- 1,251,927
Dividends to Shareholders -- -- -- -- (18,726,205) -- (18,726,205)
Net Income posted to reserves -- -- -- -- (14,715,748) 14,715,748 --
Dividends unclaimed as per Art. 23 of Bylaws -- -- -- 15,222 -- -- 15,222
Adjustment for own share transactions -- (3,457,500) (3,457,500) 3,457,500 (9,682,531) -- (9,682,531)
Notional recognition of stock options -- -- -- 4,369,264 -- -- 4,369,264
Movements between reserves -- -- -- (1,071,954) 1,071,954 -- --
Result for the period -- -- -- -- -- 269,144 269,144
BALANCE AT DECEMBER 31 2011 396,665,734 (24,994,500) 371,671,234 356,316,023 217,780,978 269,144 946,037,379 Capital Increases 4,500 -- 4,500 4,417 -- -- 8,917 Dividends to Shareholders -- -- -- -- (18,583,910) -- (18,583,910)Net Income posted to reserves -- -- -- -- 269,144 (269,144) -- Dividends unclaimed as per Art. 23 of Bylaws -- -- -- -- -- -- -- Adjustment for own share transactions -- -- -- -- -- -- -- Notional recognition of stock options and stock grant -- -- -- 1,310,807 -- -- 1,310,807 Movements between reserves -- -- -- (23,585) 23,585 -- -- Result for the period -- -- -- -- -- 19,785,808 19,785,808
BALANCE ATJUNE 30 2012 396,670,234 (24,994,500) 371,675,734 357,607,662 199,489,797 19,785,808 948,559,001
5. STATEMENT OF CHANGES IN EQUITY
Semi-annual Interim Financial Report 2012 110

Semi-annual Interim Financial Report 2012 111