1H 2018 RESULTS PIRELLI, GLOBAL HIGH VALUE 7 August 2018 · Aeolus Car, Velo, Cyber & digital...
30
PIRELLI, GLOBAL HIGH VALUE 1H 2018 RESULTS 7 August 2018
Transcript of 1H 2018 RESULTS PIRELLI, GLOBAL HIGH VALUE 7 August 2018 · Aeolus Car, Velo, Cyber & digital...

PIRELLI, GLOBAL HIGH VALUE
1H 2018 RESULTS
7 August 2018

PIRELLI, GLOBAL HIGH VALUE
1H 2018 RESULTS
7 August 2018 1
DISCLAIMER_
In General. This disclaimer applies to this document and any oral comments of any person presenting it. This document, taken together with any such oral comments, is referred to herein as the “Presentation”. This document has been prepared by Pirelli & C. S.p.A. (“Pirelli” or the “Company” and, together with its subsidiary the “Group”). The Presentation is being furnished to you for information purposes only and for use in presentations of the results and strategies of the Group.
No distribution of this Presentation. This Presentation is being furnished to you solely for your information and may not be reproduced, in whole or in part, or redistributed to any other individual or legal entity.
Forward-looking statement. ““Forward-looking statements” (which expression shall include opinions, predictions or expectations about any future event) that may be contained in the Presentation are based on a variety of estimates and assumptions by the Group, including, among others, estimates of future operating results, the value of assets and market conditions. These estimates and assumptions are inherently uncertain and are subject to numerous business, industry, market, regulatory, geo-political, competitive and financial risks that are outside of the Group’s control. There can be no assurance that the assumptions made in connection with the forward-looking statements will prove accurate, and actual results may differ materially. The inclusion of the forward-looking statements herein should not be regarded as an indication that the Group considers the forward-looking statements to be a reliable prediction of future events and the forward-looking statements should not be relied upon as such. Neither the Group nor any of its representatives has made or makes any representation to any person regarding the forward-looking statements and none of them intends to update or otherwise revise the forward-looking statements to reflect circumstances existing after the date when made or to reflect the occurrence of future events, even in the event that any or all of the assumptions underlying the forward-looking statements are later shown to be in error.
No update. The information and opinions in this Presentation is provided to you as of the dates indicated and the Group does not undertake to update the information contained in this Presentation and/or any opinions expressed relating thereto after its presentation, even in the event that the information becomes materially inaccurate, except as otherwise required by applicable laws.
Verbal explanation. This Presentation has to be accompanied by a verbal explanation. A simple reading of this Presentation without the appropriate verbal explanation could give rise to a partial or incorrect understanding.
No offer to purchase or sell securities. The information, statements and opinions contained in this Presentation are for information purposes only and do not constitute a public offer under any applicable legislation or an offer to sell or solicitation of an offer to purchase or subscribe for securities or financial instruments or any advice or recommendation with respect to such securities or other financial instruments. None of the securities referred to herein have been, or will be, registered under the U.S. Securities Act of 1933, as amended, or the securities laws of any state or other jurisdiction of the United States or in Australia, Canada or Japan or any other jurisdiction where such an offer or solicitation would be unlawful (the “Other Countries”), and there will be no public offer of any such securities in the United States. This Presentation does not constitute or form a part of any offer or solicitation to purchase or subscribe for securities in the United States or the Other Countries.
Rounding. Due to rounding, numbers presented throughout this Presentation may not add up precisely to the totals provided and percentages may not precisely reflect the absolute figures.
This Presentation has been prepared on a voluntary basis since the financial disclosure additional to the half-year and annual ones is no longer compulsory pursuant to Law 25/2016 in application of Directive 2013/50/EU. Pirelli is therefore not bound to prepare similar presentations in the future, unless where provided by law.
Neither the Company nor any member of the Group nor any of its or their respective representatives, directors, employees or agents accept any liability whatsoever in connection with this Presentation or any of its contents or in relation to any loss arising from its use or from any reliance placed upon it.
Francesco Tanzi, the manager in charge of preparing the corporate accounting documents, declares that, pursuant to art. 154-bis, paragraph 2, of the Legislative Decree no. 58 of February 24, 1998, the accounting information contained herein correspond to document results, books and accounting records.
***
Non-IFRS and Other Performance Measures
This Presentation contains certain items as part of the financial disclosure which are not defined under IFRS. Accordingly, these items do not have standardized meanings and may not be directly comparable to similarly-titled items adopted by other entities.
Pirelli management has identified a number of “Alternative Performance Indicators” (“APIs”). These APIs (i) are derived from historical results of Pirelli & C. S.p.A. and are not intended to be indicative of future performance, (ii) are non-IFRS financial measures and, although derived from the Financial Statements, are unaudited and (iii) are not an alternative to financial measures prepared in accordance with IFRS.
The APIs presented herein are [EBIT, EBIT margin, EBITDA, EBITDA margin, net income and net income margin.
In addition, this Presentation includes certain measures that have been adjusted by us to present operating and financial performance net of any non-recurring events and non-core events. The adjusted indicators are EBITDA adjusted, EBITDA adjusted without start up costs, EBIT, EBIT adjusted, EBIT adjusted without start up costs,, net income adjusted.
In order to facilitate the understanding of our financial position and financial performance, this Presentation contains other performance measures, such as Fixed Assets related to continuing operations, Provisions, Operating Working Capital related to continuing operations, Net Working Capital related to continuing operations, Net Financial (liquidity) / debt Position.
These measures are not indicative of our historical operating results, nor are they meant to be predictive of future results.
These measures are used by our management to monitor the underlying performance of our business and operations. Similarly entitled non-IFRS financial measures reported by other companies may not be calculated in an identical manner, consequently our measures may not be consistent with similar measures used by other companies. Therefore, investors should not place undue reliance on this data.
1

PIRELLI, GLOBAL HIGH VALUE
1H 2018 RESULTS
7 August 2018 2
KEY MESSAGES_
>
>
> FY’18 OUTLOOK
▬ Our Value drivers (Price/Mix and HV volume growth) are keeping the pace in line with our guidance
▬ Top line organic growth expected to be at 7% due to the accelerating reduction on Standard
▬ Profitability and Cash Flow confirmed and supported by higher price/mix contribution and lower cost impact.
1H’18 RESULTS: PIRELLI’S HIGH VALUE BUSINESS MODEL PROVES VERY RESILIENT IN VOLATILE
ENVIRONMENT
▬ High Value Market (HVM) growing faster than expected
▬ Pirelli gaining Market Share in HVM, thanks to very effective homologation pull-through
▬ Pirelli best-in-class in Price/Mix improvement, leading to solid EBIT margin expansion
INTENSIFYING AND ACCELERATING HIGH VALUE PROGRAMS
▬ Major High Value tyre homologation programs launched in China, Japan and Korea with local OEMs
▬ Focused product development innovation in Specialties
▬ Adjusting local High Value Capacity to future regional demand opportunities (e.g. strong High Value growth in
Europe and in China) as well as to increasing tariff dynamics
▬ New integrated organization speeding up digital transformation programs
2

PIRELLI, GLOBAL HIGH VALUE
1H 2018 RESULTS
7 August 2018 3
APPENDIX
1H’18 RESULTS IN DETAIL
AGENDA_
1H’18 RESULTS HIGHLIGHTS & FY’18 OUTLOOK
3

PIRELLI, GLOBAL HIGH VALUE
1H 2018 RESULTS
7 August 2018 4
REVENUES EBIT ADJ.1 w/o start-up costs2
NET INCOME before discontinued operations NET FINANCIAL POSITION
1H 2018 RESULTS HIGHLIGHTS_
2,685
58.2%
-2.0%
High Value
Standard
1H 2018
2,630
64.0%
1H 2017
+7.8%
+698
1H 2018
3,917
FY 2017
3,219
16.5% 18.0% Margin
1. Before amortization of PPA, non-recurring items, restructuring costs and other adjustments; 2. Aeolus Car, Velo, Cyber & digital transformation
182
68
2.7x
1H 2018 1H 2017
€ million
473443
+6.8%
1H 2018 1H 2017
∆ YoY
organic
+12.7%
+5.5%
-4.5%
2.5% 6.9% on Sales
4

PIRELLI, GLOBAL HIGH VALUE
1H 2018 RESULTS
7 August 2018 5
+2.6%
2,021
1H’17
2,074
1H’18
1,130 1,155
42% 44%
1H 2018 PERFORMANCE BY HIGH VALUE REGIONS_
1. Before amortization of PPA, non-recurring items, restructuring costs and other adjustments; 2. Standard & others (including Controlled Distribution & Other)
1H’18 1H’17
19% 19%
14% 16%
SALES
High-teens
Mid-teens
Twenties
adj. margin1
EBIT
+2.3%
-2.9%
+10.6%
YoY %
Δ
▬ Strengthening of High Value
with a strong growth in O.E.
driven by a wide
homologation portfolio
▬ Continued proactive
reduction of Standard in the
less profitable segments, in
favour of higher rims
▬ Increasing High Value sales,
mainly in Replacement, driven
by the appealing product
portfolio and further retail
penetration
▬ Profitability trend still impacted
by FX, but improving vs. 1Q
▬ High Value: strong O.E.
performance, driven by new
homologations and sound
Repl. backed by pull-through
effect
▬ Standard: lower O.E. sales
on less profitable rims; mix
improvement with lower
Aeolus brand sales
KEY HIGHLIGHTS
% on tot. H.V. rev.
92% 93%
+8.7%
EUROPE
NAFTA
APAC
HIGH VALUE REGIONS
SALES
Weight on Group revenues
High Value Standard2
€ million
487 502
390 431
+4.1%
org.
growth
+7.5%
+15.2%
+11.2%
+7.4%
+25.7%
-9.4%
+8.0%
-11.3%
5
PIRELLI, GLOBAL HIGH VALUE
1H 2018 RESULTS
7 August 2018 6
355
456
113 123
89 85
-16.2%
1H’17 1H’18
557
664
17% 14%
1H 2018 PERFORMANCE BY STANDARD REGIONS_
1. Before amortization of PPA, non-recurring items, restructuring costs and other adjustments; 2. Standard & others (including Controlled Distribution & Other)
1H’18 1H’17
5% 4%
3% 3%
SALES
Mid-teens
Mid-single
digit
High-teens
adj. margin1
EBIT
-22.2%
-8.5%
+4.4%
YoY %
Δ
▬ Proactive reduction of
exposure to lower rim sizes
▬ Negative impact of May truck
drivers strike in Brazil
▬ Increased exports to North
America, with demand
supported by Pirelli H.V.
products in the Region
▬ Progressing with the mix
improvement strategy
▬ Currency volatility in the area
(especially in Turkey)
▬ Sound profitability growth led
by mix improvement and a
sound market demand
KEY HIGHLIGHTS
% on tot. H.V. rev.
8% 7%
-2.8%
LATAM
MEAI
RUSSIA
& C.I.S.
STANDARD REGIONS
SALES
Weight on Group revenues
High Value Standard2
€ million
-2.2%
org.
growth
-1.1%
+17.0%
+21.0%
+4.2%
+7.9%
-4.2%
-7.5%
+19.2%
6

PIRELLI, GLOBAL HIGH VALUE
1H 2018 RESULTS
7 August 2018 7
OUR 3 PILLARS STRATEGY IS IN PROGRESS_
PILLAR 1:
HIGH VALUE
I
PILLAR 2:
TRANSFORMATION
PROGRAMS
II
PILLAR 3:
STANDARD
CAPACITY
REDUCTION
III
▬ More than 200 High Value homologations, enriching our portfolio that now accounts 2,350
homologations, o/w 88% High Value
▬ +1.5 million High Value capacity (Europe, NAFTA and LatAm) reaching 58% of total capacity
▬ With Europe representing 46% of total High Value sales volume but 60% of global High Value production,
started new program to create higher local HV in China
▬ Increasing last mile demand coverage: 55% of our sales in 1H made through Car Dealer, Pirelli Retail,
and Tier 1 clients (51% in FY 2017)
▬ Integrated Forecasting: Increasing adoption of Big Data tools for medium term Demand & Supply
Planning
▬ Smart Manufacturing and Flexible Factory: development of digital apps to monitor and improve
processes and lead-time
▬ Prestige: successful prototyping of new geo-localized sales force tool
▬ Supply Chain: increase service level starting from Prestige and key clients
Acceleration in Standard reduction: -2 million tyres Standard capacity (-6% vs. 2017 year end)
▬ ~60% of the reduction in LatAm, the remaining 40% in Europe and MEAI
▬ ~30% of the reduction is actually a conversion into High Value capacity
1H 2018 achievements
7

PIRELLI, GLOBAL HIGH VALUE
1H 2018 RESULTS
7 August 2018 8
OUR COMPETITIVE EDGE BOOSTED BY AN ENHANCED HOMOLOGATION
PORTFOLIO_
1. TIER 1 excluding Nokian; 2. Specialty tyres includes Run-Flat, PNCS and Seal-Inside technologies
PIRELLI YEARLY HOMOLOGATIONS
26 4378
139
176
247
284288
324
273431
~2.5x
2017A
402
2016A
315
2015A
327
2014A
281
2013A
207
2012A
165
Standard Products New Premium Products
1H18A
236
42
194
~2.5x
>1,000
TIER 11 avg
>400
~37% Specialty tyres2 weight
Prestige tyres weight ~16%
+25%
1H18A
2,077
1H17A
1,665
MARKED TYRES HOMOLOGATIONS
Pirelli tot marked portfolio Germany product list vs. Peers
APAC ON-GOING PROJECTS
~50% ≥20” tyres weight
Electric / Hybrid portfolio Δ YoY ~+70%
Working with 19 local OEMs on ≥18” and E-vehicles
1H18 HOMOLOGATIONS ≥18” HIGHLIGHTS
8

PIRELLI, GLOBAL HIGH VALUE
1H 2018 RESULTS
7 August 2018 9
+10% 241
≥+10%
EU, APac,
NAFTA
2018E
94%
Other
regions
2017A
217
94%
2016A
196
95%
million tyres
O.E. + REPLACEMENT ≥18” TYRE MARKET
≥18” OUTGROWING THE STANDARD SEGMENT 10x
Source: Company elaborations based on third party data relative to car market and on data provided by local associations of tyre producers; 2016 A market figures restated
≥+10% +10%
~5x ≤17” growth (+1.9%) ~10x ≤17” growth (almost flat)
APAC
NAFTA
EUROPE
▬ Strong growth (mid-teens), supported by
robust Premium and Prestige car park
increase
▬ High-single digit growth, mainly driven by
solid Replacement demand, O.E. recovering
from 2017, growing at a mid-single digit rate
▬ Almost double-digit growth, driven by
Replacement; high–teen growth confirmed in
the O.E. channel
Standard segment: market lagging mainly due to South America and MEAI
9

PIRELLI, GLOBAL HIGH VALUE
1H 2018 RESULTS
7 August 2018 10
FY 2018 OUTLOOK UPDATE_
1 Before amortization of PPA, non-recurring items, restructuring costs, other adjustments and start-up costs; 2. In accordance with IFRS 15 (starting from January 1st, 2018), some costs for variable
considerations paid or payable to indirect customers and mainly linked to achieving sale targets are recognized as a reduction of revenues
2017A
Revenues
High Value weight
5,352
58%
Adjusted EBIT w/o start-up1 927
Net financial position / Adjusted
EBITDA w/o start-up costs 2.7X
CapEx
Adjusted EBIT 876
High Value weight ~83%
Start-up costs 50
€ million
>€ 1.0 bln
~2.3X
~€ 1.0 bln
~ € 460 mln
>83%
~40
~€ 5.4 bln
>60%
2018E (7 Aug. 2018)
confirmed
(from ≥83%)
confirmed
confirmed
confirmed
Top line impact (Standard Volume and FX) offset by:
▬ Higher P/Mix drop through (68%, ~+€15 mln vs. May guid.)
▬ Lower raw mat. headwind (from -€77 to -€60 mln)
▬ Cost reduction & Brazil recovery plan (~€20 mln)
▬ Volumes: flat (vs. +2% ÷ +2.5 May guid.)
▬ High Value Volumes: ≥+13% (confirmed)
▬ Standard volumes: ~-9% (-6% ÷ -5% May guid.)
▬ Price/Mix: +6.5% ÷ +7.5% (confirmed)
▬ FX: -6% ÷ -5% (-5% ÷ -4.5% May guid.)
▬ IFRS 152: -0.6% (confirmed)
489 confirmed
(from ≥60%)
10

PIRELLI, GLOBAL HIGH VALUE
1H 2018 RESULTS
7 August 2018 11
APPENDIX
1H’18 RESULTS IN DETAIL
AGENDA_
1H’18 RESULTS HIGHLIGHTS & FY’18 OUTLOOK
11

PIRELLI, GLOBAL HIGH VALUE
1H 2018 RESULTS
7 August 2018 12
Net Sales
1H’18
2,630
IFRS 15 impact1
(16)
FX
(186)
Price/Mix
179
Volume
(32)
Net Sales
1H’17
2,685
-1.5%
1H 2018 NET SALES BRIDGE_
1. In accordance with IFRS 15 (from January 1st, 2018), some costs for variable considerations paid or payable to indirect customers and mainly linked to achieving sales targets are recognized as a
reduction of revenues
+7.2% -7.3% -0.6% 1st Quarter -2.2%
-1.2 %
+6.7 %
-6.9% -0.6%
-2.0%
+5.7%
+5.5%
o/w
organic
€ million
o/w
organic -0.9%
+6.2% 2nd Quarter -6.6% -0.6% -1.9% +5.3%
▬ High Value +13.1%
(o/w Car ≥18”+18.3%)
▬ Standard -11.3%
+13.4%
-12.1%
+12.8%
-10.6%
▬ o/w Car ≥18”+18.0%
▬ o/w Car ≥18”+18.6%
Group
Group H.V.
Std.
H.V.
Std.
12

PIRELLI, GLOBAL HIGH VALUE
1H 2018 RESULTS
7 August 2018 13
FX Other
input costs
(23.3) 450.1 (16.9)
2018 Raw Mat.
(11.5)
D&A / Other2
(37.3)
Start-up
costs1
3.6
Efficiencies
19.0
Price/mix
112.8
Volume
(12.5)
2017
416.2
1H / 2Q 2018 OPERATING PERFORMANCE_
1. Aeolus Car, Velo, Cyber & digital transformation; 2. Other costs related to high value development
€ million internal levers ∑ +86 external levers ∑ -52
1H
211.2
50.1
Volume
(4.5)
Price/mix 2017 Other
input costs
Efficiencies Raw Mat. Start-up
costs
(15.9)
D&A / Other
2.3 10.0
0.1
(11.9) (9.7) 231.8
2018 FX
internal levers ∑ +40 external levers ∑ -19
2Q
EBIT adj.
w/o start-up
EBIT adj.
443.0 473.3
16.5% 18.0% margin
EBIT adj.
15.7%
17.6%
margin
EBIT adj.
w/o start-up 223.5 243.9
16.6% 18.5% margin
15.5%
17.1%
margin
13

PIRELLI, GLOBAL HIGH VALUE
1H 2018 RESULTS
7 August 2018 14
Net Income
bef. disc. oper. 1H’18
181.9
Δ Taxes
(62.0)
Δ Financial
income / charges
108.4
Δ Net income /
loss from equity
participations
8.4
Δ EBIT
59.5
Net Income
bef. disc. oper. 1H’17
67.6
1H 2018 NET INCOME BRIDGE_
1. Mainly related to gains from re-pricing of unsecured facilities
Non recurring / restr. costs / other adj. +46 +15
Net income related to
cont. oper. adjusted 233 159
PPA amortization +52 +57
Non recurring fin. expenses +61 -31
182 68 Net Income related to cont. oper.
1H’17 1H’18
€ million
2.5% % on Sales 6.9%
Taxes impact -19 -68
14
PIRELLI, GLOBAL HIGH VALUE
1H 2018 RESULTS
7 August 2018 15
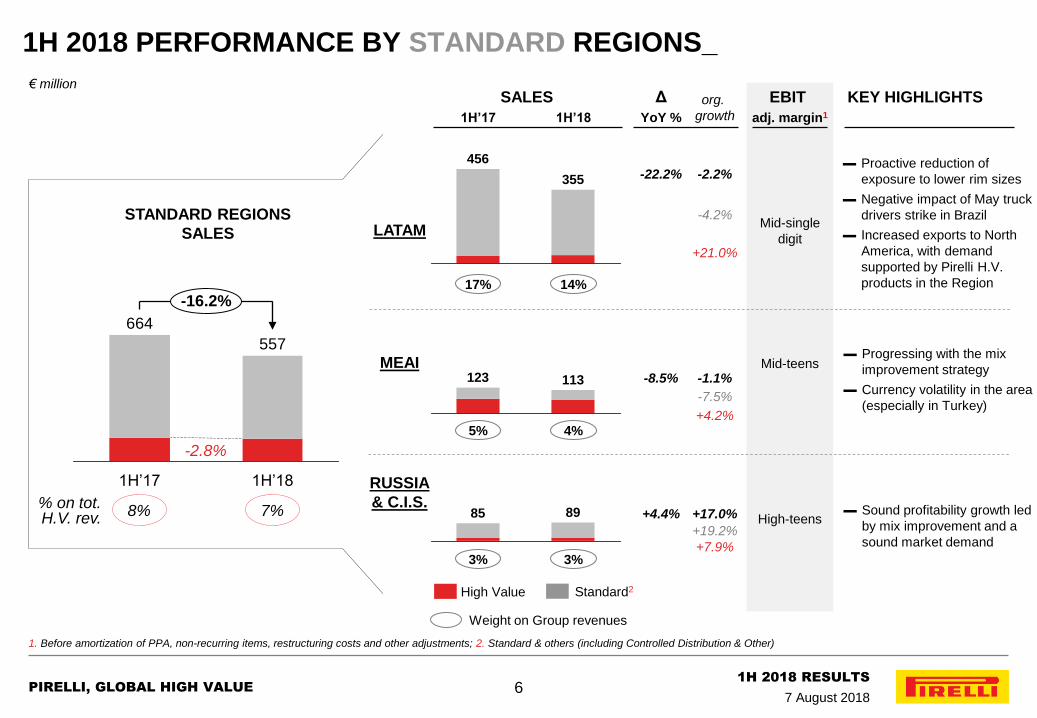
726
Interests Other
63
(155)
NFP
Dec.’17
Operating
Cash Flow
Operating
Cash Flow
(137)
NFP
Mar.’18
Financial
assets sale
Other Interests
55
3,219
3,939 3,917
36
63
Taxes Taxes
31 16
NFP
Jun.’18
1H 2018 CASH FLOW AND NET FINANCIAL POSITION_
1. Before amortization of PPA, non-recurring items, restructuring costs and other adjustments
€ million
▬ EBITDA adjusted1
▬ CapEx
▬ ∆ WC / other
(288)
85
929
▬ Non rec. / restr.
▬ Minorities
▬ FX / other
38
19
6 ▬ EBITDA adjusted1
▬ CapEx
▬ ∆ WC / other
(300)
94
69
▬ Non rec. / restr.
▬ FX / other
12
4
Trade receivables: late start of summer sell-in season
Inventories: Prestige and High Value higher service level;
temporary impact of Brazilian strike
Trade receivables link to the usual seasonality of the business
Trade payables: in line with the trend of previous year and
linked to investments made in the last quarter of the year and
paid in 1Q 2018
Working
Capital
dynamics
Seasonal trend to be reverted in second half
1Q 2018 2Q 2018
15

PIRELLI, GLOBAL HIGH VALUE
1H 2018 RESULTS
7 August 2018 16
Jun-18
3.93%
Jun-17
5.76%
NET FINANCIAL POSITION GROSS DEBT MATURITY
601
592
2023
& beyond
594
2
2022
1,813
21
1,792
2021
3
2020
1,382
3 200
1,179
2019
302
102 200
2018
CURRENT CAPITAL STRUCTURE (JUNE 2018)_
1. Covers ~2.2 years of forthcoming maturities
732
792
Net Fin.
Position
3,917
Fin.
Assets
(188) (590)
Gross
Debt
4,695
3,171
LIQUIDITY PROFILE
Liquidity position
Total committed lines not drawn
Liquidity margin1
590
580
1,170
Loan
Bond
Other
€ million
% on total
Gross Debt
Cash & Cash equivalents
Fin. receivables
& other
13% 29% 0% 39% 13%
COST OF DEBT (LAST 12 MONTHS) BREAK-DOWN BY CURRENCY
EUR 75.2%
MXN 5.7%
other 6.3%
BRL 9.4%
RUB 3.4%
6%
(778)
▬ 3.40% including the accounting
effect of re-pricing
16

PIRELLI, GLOBAL HIGH VALUE
1H 2018 RESULTS
7 August 2018 17
APPENDIX
1H’18 RESULTS IN DETAIL
AGENDA_
1H’18 RESULTS HIGHLIGHTS & FY’18 OUTLOOK
17
PIRELLI, GLOBAL HIGH VALUE
1H 2018 RESULTS
7 August 2018 18
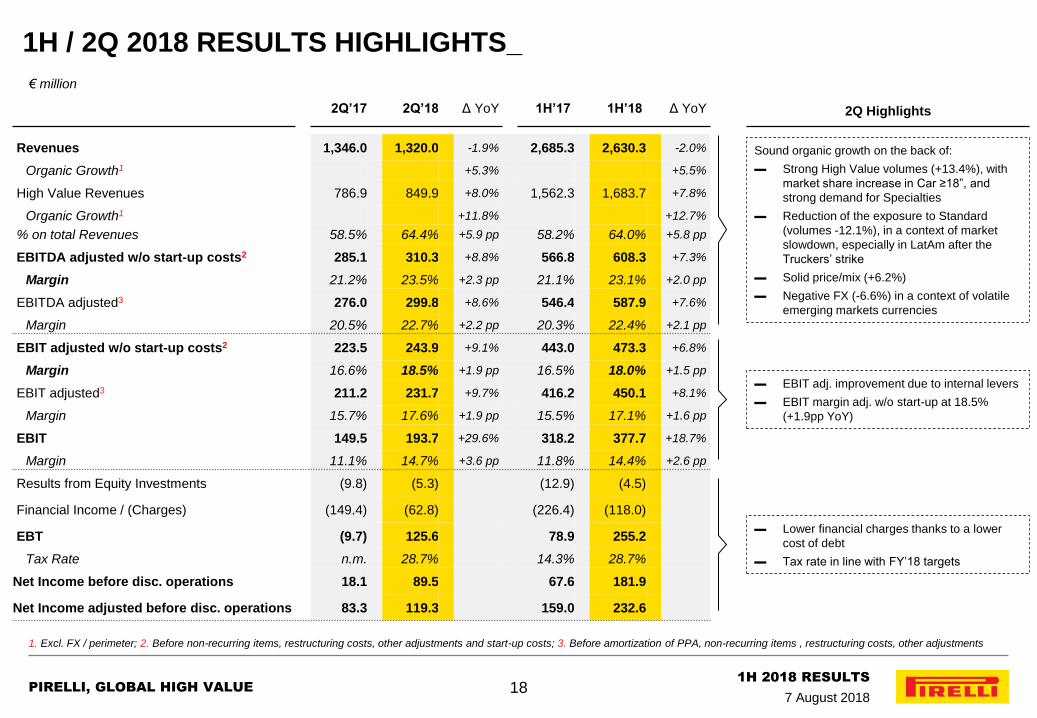
1H / 2Q 2018 RESULTS HIGHLIGHTS_
1. Excl. FX / perimeter; 2. Before non-recurring items, restructuring costs, other adjustments and start-up costs; 3. Before amortization of PPA, non-recurring items , restructuring costs, other adjustments
2Q’17 2Q’18 Δ YoY 1H’17 1H’18 Δ YoY
Revenues 1,346.0 1,320.0 -1.9% 2,685.3 2,630.3 -2.0%
Organic Growth1 +5.3% +5.5%
High Value Revenues 786.9 849.9 +8.0% 1,562.3 1,683.7 +7.8%
Organic Growth1 +11.8% +12.7%
% on total Revenues 58.5% 64.4% +5.9 pp 58.2% 64.0% +5.8 pp
EBITDA adjusted w/o start-up costs2 285.1 310.3 +8.8% 566.8 608.3 +7.3%
Margin 21.2% 23.5% +2.3 pp 21.1% 23.1% +2.0 pp
EBITDA adjusted3 276.0 299.8 +8.6% 546.4 587.9 +7.6%
Margin 20.5% 22.7% +2.2 pp 20.3% 22.4% +2.1 pp
EBIT adjusted w/o start-up costs2 223.5 243.9 +9.1% 443.0 473.3 +6.8%
Margin 16.6% 18.5% +1.9 pp 16.5% 18.0% +1.5 pp
EBIT adjusted3 211.2 231.7 +9.7% 416.2 450.1 +8.1%
Margin 15.7% 17.6% +1.9 pp 15.5% 17.1% +1.6 pp
EBIT 149.5 193.7 +29.6% 318.2 377.7 +18.7%
Margin 11.1% 14.7% +3.6 pp 11.8% 14.4% +2.6 pp
Results from Equity Investments (9.8) (5.3) (12.9) (4.5)
Financial Income / (Charges) (149.4) (62.8) (226.4) (118.0)
EBT (9.7) 125.6 78.9 255.2
Tax Rate n.m. 28.7% 14.3% 28.7%
Net Income before disc. operations 18.1 89.5 67.6 181.9
Net Income adjusted before disc. operations 83.3 119.3 159.0 232.6
2Q Highlights
Sound organic growth on the back of:
▬ Strong High Value volumes (+13.4%), with
market share increase in Car ≥18”, and
strong demand for Specialties
▬ Reduction of the exposure to Standard
(volumes -12.1%), in a context of market
slowdown, especially in LatAm after the
Truckers’ strike
▬ Solid price/mix (+6.2%)
▬ Negative FX (-6.6%) in a context of volatile
emerging markets currencies
▬ EBIT adj. improvement due to internal levers
▬ EBIT margin adj. w/o start-up at 18.5%
(+1.9pp YoY)
▬ Lower financial charges thanks to a lower
cost of debt
▬ Tax rate in line with FY’18 targets
€ million
18

PIRELLI, GLOBAL HIGH VALUE
1H 2018 RESULTS
7 August 2018 19
30/06/20171 31/12/2017 30/06/2018
Fixed assets related to continuing operations 9,132 9,121 8,881
Inventories 937 941 983
Trade receivables 968 653 864
Trade payables (1,140) (1,674) (1,052)
Operating net working capital related to continuing operations 766 (80) 796
Other receivables / payables 190 (42) 113
Net Working Capital related to continuing operations 956 (123) 909
Net invested capital held for sale n.a. 61 39
Total net invested capital 10,087 9,059 9,829
Equity 4,057 4,177 4,323
Provisions 1,853 1,664 1,589
Net Financial Position 4,177 3,219 3,917
Total financing and shareholders’ equity 10,087 9,059 9,829
Attributable net equity 4,000 4,117 4,243
€ million
1H PIRELLI BALANCE SHEET_
1. Carve-out figures
19

PIRELLI, GLOBAL HIGH VALUE
1H 2018 RESULTS
7 August 2018 20
1H PIRELLI GROUP CASH FLOW_
1. Before amortization of PPA, non-recurring items, restructuring costs and other adjustments; 2. 2nd tranche for the acquisition of 36% stake in Pneuac in September 2017 to reach 100% of the company
1H’17 (carve-out)
1Q‘18 2Q‘18 1H‘18
EBIT adjusted1 416 218 232 450
Depreciation & Amortization (excl. PPA amortization) 130 70 68 138
Capital expenditures (216) (85) (94) (179)
Change in working capital / other (768) (929) (69) (998)
Operating Cash Flow (438) (726) 137 (589)
Financial income / (expenses) (226) (55) (63) (118)
Taxes paid (52) (31) (36) (67)
Financial investments (2) - - -
Financial asset disposals - 155 - 155
Purchase of Pneuac shares2 - (19) - (19)
Cash-out for non recurring items and restructuring costs (17) (38) (12) (50)
Minorities (6) - - -
Exchange rates difference / other (16) (12) 6 (5)
Net cash flow before extraordinary operations (757) (726) 33 (693)
Industrial reorganization 352 5 (10) (5)
Capital Increase 1,189 - - -
Net cash flow 784 (720) 22 (698)
€ million
20

PIRELLI, GLOBAL HIGH VALUE
1H 2018 RESULTS
7 August 2018 21
2018E RAW MATERIAL GUIDANCE_
breakdown
1H 2018 A based on
purch. costs
Natural Rubber 14%
Synthetic Rubber 27%
Carbon Black 10%
Steel Reinf. 10%
Textiles 16%
Chemicals 23%
raw mat.
34% on Sales
Raw Mat. subtotal
FX impact ~-46
TOT. IMPACT ~-60
2018E
EBIT impact
€ million
May guidance
-€77 mln
AVERAGE COST OF GOODS SOLD OF COMMODITIES
Natural Rubber TSR20
($ / tonne)
Brent Oil
($ / barrel)
Butadiene EU
(€ / tonne)
2017 A
~1,700
51
~1,100
2018 E Aug. guidance
~1,400
67
~950
∆ YoY
-12%
+35%
-6%
~-14
~+24
~-74
~+36
AVERAGE QUOTATION OF COMMODITIES
2017 A
1,651
54.9
1,112
2018 E Aug. guidance
~1,450
~74
~1,050
May 2018 guidance
Nat. Rubber ~ 1,650
Brent Oil ~75
Butadiene ~1,200
21

PIRELLI, GLOBAL HIGH VALUE
1H 2018 RESULTS
7 August 2018 22
2018E FOREX GUIDANCE_
breakdown
1H 2018 A based on
currency
USD 17%
EUR 38%
other 14%
RUB 3%
GBP 6%
€ million
BRL 10%
CNY 12%
2017 A 2018 E Aug. guidance
∆ YoY 2018E May guidance
3,42
6,34
1,215
MAIN AVERAGE EXCHANGE RATES
EUR / USD 1.130 1.188 -5%
USD / BRL 3.193 3.643 -12%
EUR / GBP 0.876 0.883 0%
EUR / RUB 65.850 72.412 -9%
USD / CNY 6.752 6.494 +4%
74.440
0.880
/
/
/
/
/
TOT. IMPACT ON SALES -5.0 / -6.0 % -4.5% / -5.0%
∆ YoY
vs. EUR
-17%
-1%
-5%
-9%
0%
22

PIRELLI, GLOBAL HIGH VALUE
1H 2018 RESULTS
7 August 2018 23
KEY CAR MARKET TRENDS: EUROPE_
Source: Pirelli tyre market estimates based on main data provider for the Region; historical market data may be subject to restatement
O.E.
Replacement
Total (O.E.+Repl.)
O.E.
Total (O.E.+Repl.)
2Q’17 3Q’17 4Q’17 1Q’18 2Q'18
Replacement
Market trend
∆% YoY FY’17 1H’18
To
tal
Car
ma
rke
t N
ew
Pre
miu
m &
Sta
nd
ard
4 10
14 10 8
12 10
(9) (2)
2
(2) (5)
3
(1)
2
12 13 11
3
20
10
(4) (1)
2 1
(6)
5
(1)
3
11 14
11 5
16 10
(5) (1)
2 0
(6)
5
(1)
(6)
1 5
1
(1)
5 2
(3) 0
3 2
(5)
6 0
(4) 0
4 1
(4)
6 1
≥18”
≤17" ≤17"
23

PIRELLI, GLOBAL HIGH VALUE
1H 2018 RESULTS
7 August 2018 24
KEY CAR MARKET TRENDS: NAFTA_
Source: Pirelli tyre market estimates based on main data provider for the Region; historical market data may be subject to restatement; 1. NAFTA Replacement includes imports
O.E.
Replacement
Total (O.E.+Repl.)
O.E.
Total (O.E.+Repl.)
Replacement1
(1) (8)
0 (1)
4 6 5
(5) (12) (9) (7) (9) (7) (8)
8 9 14
11 10 12 11
(4) (4) (3) (3) (5) (3) 0
4 3 9 6 8 10 9
(4) (6) (4) (4) (6) (1) (4)
(3) (10)
(6) (4) (3) (2) (3)
(2) (2)
1
0 (2)
3 0
(2) (4) (1) (1) (2)
2
0
Market trend
∆% YoY
≤17"
≥18”
≤17"
2Q’17 3Q’17 4Q’17 1Q’18 2Q'18 FY’17 1H’18
To
tal
Car
ma
rke
t N
ew
Pre
miu
m &
Sta
nd
ard
24

PIRELLI, GLOBAL HIGH VALUE
1H 2018 RESULTS
7 August 2018 25
KEY CAR MARKET TRENDS: APAC_
Source: Pirelli tyre market estimates based on main data provider for the Region; historical market data may be subject to restatement
Market trend
∆% YoY
O.E.
Replacement
Total (O.E.+Repl.)
O.E.
Total (O.E.+Repl.)
Replacement
O.E.
Replacement
Total (O.E.+Repl.)
O.E.
Total (O.E.+Repl.)
Replacement
23 23
10 20
14 15 14
(3)
2
(3) (1) (5)
3
(1)
14 15 13 14 12 13 13 4 6 3 5 0 1 1
20 20 11
18 13 15 14
1 4 0 2
(2)
2 0
≥18”
≤17"
1 5
(1)
2
(2)
5 2
5 6 3 5 1 2 2
3 6 1 4
0
3 2
2Q’17 3Q’17 4Q’17 1Q’18 2Q'18 FY’17 1H’18
To
tal
Car
ma
rke
t N
ew
Pre
miu
m &
Sta
nd
ard
25

PIRELLI, GLOBAL HIGH VALUE
1H 2018 RESULTS
7 August 2018 26
KEY MARKET TRENDS: RUSSIA & CIS AND SOUTH AMERICA_
Source: Pirelli tyre market estimates based on main data provider for the Region; historical market data may be subject to restatement; 1. South America Replacement restated to include Brazilian imports
O.E.
Replacement
Total (O.E.+Repl.)
O.E.
Total (O.E.+Repl.)
Replacement1
Market trend
∆% YoY
23 24 18 22 22
10 16
25 20
2
17 14 15 15
24 21
5 17 15 14 15
17 27
16 20 11 8 9
8 13
7 10 2
(7) (3)
9 15
8 12 3
(4) (1)
2Q’17 3Q’17 4Q’17 1Q’18 2Q'18 FY’17 1H’18
Ru
ss
ia &
CIS
S
ou
th A
me
ric
a
26

PIRELLI, GLOBAL HIGH VALUE
1H 2018 RESULTS
7 August 2018 27
RAW MATERIAL COSTS TREND AND MIX_
MAIN RAW MATERIALS PRICE TREND
20
40
60
80
100
120
140
0.50
1.00
1.50
2.00
2.50
3.00
3.50
4.00
4.50
5.00
5.50
3Q 4Q 1Q 2Q 3Q 4Q 1Q 2Q 3Q 4Q 1Q 2Q 3Q 4Q 1Q 2Q 3Q 4Q 1Q 2Q 3Q 4Q 1Q 2Q 3Q 4Q 1Q 2Q
$ / kg $ / barrel
Natural Rubber: Sicom
Brent: www.oilnergy.com Yearly Average Natural Rubber (in $ / kg) Brent Oil (in $ / barrel)
Synth. Rubber
27% (-2ppYoY)
Textiles
16% (0pp YoY)
Steel Reinf.
10% (0pp YoY)
Natural Rubber
14% (-3pp YoY)
34% Raw mat. costs
on sales
Carbon Black
10% (+2ppYoY)
Chemicals
23% (+3pp YoY)
1H 2018 MIX (BASED ON PURCHASING COST)
53.6
1.37 1.38
45.0
1.65
54.8
2011 2012 2013 2014 2015 2016 2017 2018
27
PIRELLI, GLOBAL HIGH VALUE
1H 2018 RESULTS
7 August 2018 28
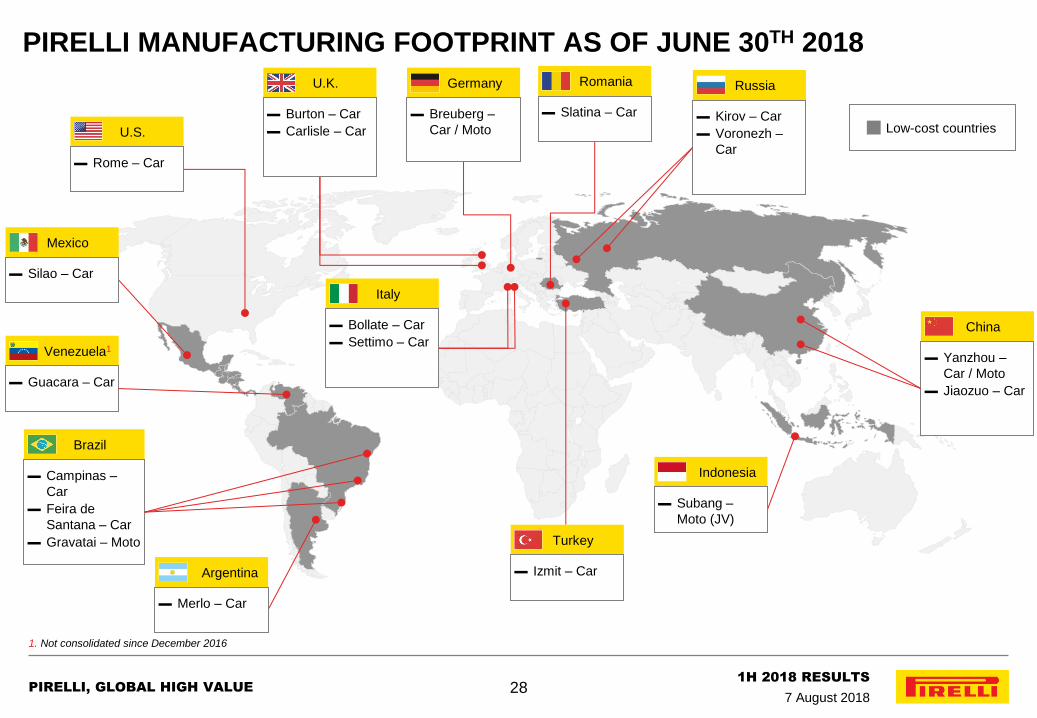
PIRELLI MANUFACTURING FOOTPRINT AS OF JUNE 30TH 2018
1. Not consolidated since December 2016
Low-cost countries U.S.
▬ Rome – Car
Brazil
▬ Campinas –
Car
▬ Feira de
Santana – Car
▬ Gravatai – Moto
Argentina
▬ Merlo – Car
Mexico
▬ Silao – Car
U.K.
▬ Burton – Car
▬ Carlisle – Car
Indonesia
▬ Subang –
Moto (JV)
China
▬ Yanzhou –
Car / Moto
▬ Jiaozuo – Car
Russia
▬ Kirov – Car
▬ Voronezh –
Car
Turkey
▬ Izmit – Car
Italy
▬ Bollate – Car
▬ Settimo – Car
Germany
▬ Breuberg –
Car / Moto
Romania
▬ Slatina – Car
Venezuela1
▬ Guacara – Car
28

PIRELLI, GLOBAL HIGH VALUE
1H 2018 RESULTS
7 August 2018


![PowerPoint 프레젠테이션 · 2019-08-09 · 4 1. 2019년2분기경영실적 2q 2018 2q 2019 증감 1h 2018 1h 2019 증감 매출액 4,413 4,456 1.0% 8,747 8,903 1.8% [총매출액]](https://static.fdocuments.in/doc/165x107/5ecc81b1c487e33d9409992a/powerpoint-eoe-2019-08-09-4-1-2019e2eee-2q-2018.jpg)