1H 2016 RESULTS PRESENTATION › upload › iblock › 0d4 › 0d46d4dac7f993... · 2020-03-21 ·...
22
1H 2016 RESULTS PRESENTATION August 29, 2016
Transcript of 1H 2016 RESULTS PRESENTATION › upload › iblock › 0d4 › 0d46d4dac7f993... · 2020-03-21 ·...

1H 2016 RESULTS PRESENTATION
August 29, 2016

DISCLAIMER
This presentation does not constitute or form part of and should not be
construed as, an offer to sell or issue or the solicitation of an offer to buy or
acquire securities of Mechel PAO (Mechel) or any of its subsidiaries in any
jurisdiction or an inducement to enter into investment activity. No part of this
presentation, nor the fact of its distribution, should form the basis of, or be
relied on in connection with, any contract or commitment or investment
decision whatsoever. Any purchase of securities should be made solely on
the basis of information Mechel files from time to time with the U.S. Securities
and Exchange Commission. No representation, warranty or undertaking,
express or implied, is made as to, and no reliance should be placed on, the
fairness, accuracy, completeness or correctness of the information or the
opinions contained herein. None of the Mechel or any of its affiliates, advisors
or representatives shall have any liability whatsoever (in negligence or
otherwise) for any loss howsoever arising from any use of this presentation or
its contents or otherwise arising in connection with the presentation.
This presentation may contain projections or other forward-looking statements
regarding future events or the future financial performance of Mechel, as
defined in the safe harbor provisions of the U.S. Private Securities Litigation
Reform Act of 1995. We wish to caution you that these statements are only
predictions and that actual events or results may differ materially. We do not
intend to update these statements. We refer you to the documents Mechel
files from time to time with the U.S. Securities and Exchange Commission,
including our Form 20-F. These documents contain and identify important
factors, including those contained in the section captioned “Risk Factors” and
“Cautionary Note Regarding Forward-Looking Statements” in our Form 20-F,
that could cause the actual results to differ materially from those contained in
our projections or forward-looking statements, including, among others, the
achievement of anticipated levels of profitability, growth, cost and synergy of
our recent acquisitions, the impact of competitive pricing, the ability to obtain
necessary regulatory approvals and licenses, the impact of developments in
the Russian economic, political and legal environment, volatility in stock
markets or in the price of our shares or ADRs, financial risk management and
the impact of general business and global economic conditions.
The information and opinions contained in this document are provided as at
the date of this presentation and are subject to change without notice
2

3
CORE MARKETS DEVELOPMENTS AND
OPERATIONAL HIGHLIGHTS
Oleg Korzhov – CEO

KEY MARKET DRIVERS AND FINANCIAL RESULTS
4
Billet FOB Black Sea, US$/t
Spot HCC prices FOB Australia, US$/t
Prices for steel products ramped up at the end of 1Q16 and
maintained at a high levels during 2Q16. Seasonal factors as
well as overheating of market leaded to price correction in 3Q16
HCC market closed at the end of 2015 with a record minimum
spot prices over the previous 11 years at a level of US$75
Starting from the end of 1Q16 prices for HCC demonstrated
growth with a further ramp up starting from beginning of August
with current spot price at US$128
MECHEL demonstrated strong operational performance in 2Q16
vs 1Q16 due to the supportive demand both on a coal and steel
markets
MECHEL’s Operating profit increased by 23% H-o-H and
reached 17.2 bln RUB, with EBITDA* growth by 9% up to 25.7
bln RUB
Mining segment EBITDA increased 10% to 14.4 bln RUB with
EBITDA margin 26% due to the positive impact of cost cutting
initiatives
Steel segment EBITDA remained stable at a level of 9.5 bln
RUB with EBITDA margin 12%
Starting from 1H16 MECHEL has started to supply rails to
Russian Railways and total volume of production reached
122 th tonns during this period
MECHEL maintained secured position as one lowest cash-cost
producer of steel and coal world-wide
MECHEL completed restructuring of its debts with Russian
State Banks with extension of repayment profile up to 7 years
and other lenders which totally represent 76% of Group’s debt
$70
$80
$90
$100
$110
$120
$130
$140
Jan-14 Jul-14 Jan-15 Jul-15 Jan-16 Jul-16
$150
$200
$250
$300
$350
$400
$450
$500
$550
$600
Jan-14 Jul-14 Jan-15 Jul-15 Jan-16 Jul-16
Source: Bloomberg
Source: Metal Courier
* Here and further EBITDA is calculated as Adjusted EBITDA in accordance with definitions in Press release Appendix A

1H 2016 PRODUCTION AND SALES SUMMARY
Product 1H’16 1H’15 % 2Q16 1Q16 %
Run-of-mine
Coal 11,528 11,448 +1 5,864 5,663 +4
Pig Iron 2,044 2,045 0 1,039 1,005 +3
Steel 2,112 2,147 -2 1,067 1,044 +2
Product 1H’16 1H’15 % 2Q16 1Q16 %
Coking Coal 4,470 4,068 +10 2,249 2,221 +1
Steam coal 3,575 3,039 +18 1,863 1,713 +9
Flat Products 253 237 +7 126 128 -2
Long products 1,504 1,367 +10 770 734 +5
5
Sales (th tonns)
Production (th tonns)
Production volumes remained stable H-o-H,
but favorable market supported increase in production in 2Q16 vs. 1Q16
Steady ramp up of Universal rolling mill capacity utilization quarter by quarter resulted
in +175% production volumes increase comparable to 1H15.
Elga coal project production growth was the major driver for overall increase in Group`s
mining volumes
Coking and steam coal sales demonstrated
strong performance H-o-H, reflecting improvement on our major markets
Steel segment sales has grown H-o-H to take advantage of higher pricing and favorable
markets

KEY PROJECTS RESULTS
6
Elga coal project development
Universal mill on Chelyabinsk metallurgical plant
Product 1H’16 1H’15 % 2Q16 1Q16 %
Rails, beams
and shapes 213 78 +175 117 96 +21
Universal rolling mill production (th tonns)
Product 1H’16 1H’15 % 2Q16 1Q16 %
Run-of-mine
coal
2,011 1,864 +8 1,018 993 +3
Elga Coal Complex (th tonns)
From January 2016 Mechel started
supply of rails to Russian railways
Total volume of supply during 1H16 amounted to 122 th tonns, including 99 th
tonns to Russian Railways
Total order from Russian railways for
2016 amounts to 250 mln tonns
Total mill capacity utilization during 2016 is projected at 60% level with further
increase in 2017
Consistent growth of mining volumes
In 1H2016 share of coking coal in total mining volumes exceeded 80%
Utilization of washing capacities at Elga
mine at a level of 75%
8,408
14,947 16,817 17,479
20,087 21,255
24,291
Jan-16 Feb-16 Mar-16 Apr-16 May-16 Jun-16 Jul-16
Sales of rails to Russian Railways in Jan- July 2016 (th tonnes)

OPERATIONAL AND STRATEGIC GOALS ACHIEVEMENTS
7
Conclusion of restructuring with Russian State Banks with up to 7 years amortization
Completion of public debt (ruble bonds) restructuring with 5 years amortization
Start of rails production on Universal rolling mill. In 1H2016 rails market share of 23% was achieved
Growth both in Coking coal mining and sales volumes
Capital expenditures on investment projects amounted to 1,664 mln RUB and maintenance CAPEX -
873 mln RUB (under management accounts)
Completion of transaction for sale of 49% of Elga coal complex to Gazprombank
Reduction of debt by RUB 32.9 bln from the proceeds of Elga coal complex sale resulted in Net Debt /
EBITDA ratio decreased from 11 to 9.5
Port Posiet modernization completed. As a result coal handling volumes in 1H 2016 increased to 3.5 mln tonnes (+50%) (including 374 th tonnes of third-party coal)
KEY FINANCIAL RESULTS
Sergey Rezontov – Chief Financial Officer
8

China 24%
Russia 29% Europe
13%
Asia w/o China
28%
CIS 3%
Middle East
1%
Other 2%
MINING SEGMENT
REVENUE BREAKDOWN BY REGIONS
43,2 37,5
40,1
13,3 14,8
14,7
23% 26% 26%
0%
20%
40%
60%
0,0
20,0
40,0
60,0
1H2015 2H2015 1H2016
Intersegment revenues RevenuesEBITDA(a) margin
REVENUE, EBITDA MARGIN
Strong demand on Asian markets remains the key
for the group for coal sales with increase of its shares from 46% to 52% H-o-H
Domestic sales increased due to partially
replacement of purchase of coal products from third parties
Close control for the operations supports lowest levels cash costs on open pit mines of Yakutugol and Elga
100% of iron ore production is dedicated for internal consumption
13,139 14,438
1,402
3,838
-2,036
-1,482
-423
0
5 000
10 000
15 000
EBITDA1H 2015
Prices ExternalSales
IntragroupSales
Costs Other EBITDA1H 2016
EBITDA
9

STEEL SEGMENT
REVENUE BREAKDOWN BY REGIONS
REVENUE, EBITDA
74 72
78
3 4 4
12% 8%
12%
0%
10%
20%
30%
40%
0
20
40
60
80
1H2015 2H2015 1H2016
Intersegment revenues Revenues EBITDA(a) margin
Russia 68%
Europe 16%
CIS 12%
Asia 2%
Middle East 1% Other
1%
83% of sales from Russian steel plants is
dedicated for domestic market
Most part of European sales comes from distribution business of Mechel Service Global through its
warehouses
Production Cash costs for almost all product range
remain stable
Further utilization of capacities on Universal mill project will support increase of higher margin
products production
10
9,413 9,520
401
3,467
226
-3,354
-633
0
5 000
10 000
15 000
EBITDA1H 2015
Prices ExternalSales
IntragroupSales
Costs Other EBITDA1H 2016
EBITDA

1H 2016 FINANCIAL RESULTS SUMMARY
* For full calculations here and after see our press release
RUB mln 1H 2016 1H 2015 %
Revenue 130,197 130,334 0%
Operating profit 17,200 13,945 23%
EBITDA 25,721 23,602 9%
EBITDA margin, % 20% 18%
Net profit / (loss) attributable to shareholders
of Mechel PAO
8,300 (16,746)
11
Consolidated Revenue to third parties
remains flat H-o-H
Operating profit up 23% on benefits of
vertical integration and costs optimization. 2/3 of Operation profit is attributed for 2Q16
following recovery on both steel and coal
EBITDA increased by 9% with EBITDA
margin reaching 20%.
Group generated Net profit of 8.3 bln RUB - first Net profit for the 6M period since 2011

13,139 14,438
9,413 9,520
1,339 1,299
107 675 2,014
0
5 000
10 000
15 000
20 000
25 000
30 000
Power
Steel
Mining
EBITDA 1H2015
Steel Segment
Mining Segment
Power Segment
EBITDA 1H 2016
CONSOLIDATED REVENUE AND EBITDA DYNAMICS
Mining segment Revenue to 3rd parties
decreased by 7% H-o-H on lower coal prices and softer PCI and Anthracites demand
Steel segment is a major contributor to Consolidated Revenue. After its 3rd party
Revenue increased by 5% on better sales volumes and prices H-o-H, its share increased
from 57% to 60%
Power segment 3rd party Revenue slightly decreased by 7% on lower sales volumes due to maintenance works on equipment
Consolidated EBITDA increased by 9% H-o-H
Mining segment EBITDA increased by 10% H-o-
H due to the positive impact of cost cutting effect
Steel segment EBITDA remained stable H-o-H
Power segment EBITDA increased by 50% H-o-H on operation efficiency
43,168 40,059
73,644 77,604
13,523 12,535
0
20 000
40 000
60 000
80 000
100 000
120 000
140 000
Power
Steel
Mining
-3,109
Revenue
1H2015
Steel
Segment Mining
Segment
Power
Segment
Revenue
1H16
3,960 -988
(30%)
(60%)
(10%)
RUB mln
RUB mln
(33%)
(57%)
(10%)
12

CASH FLOW & TRADE WORKING CAPITAL
CASH FLOW, RUB BLN
TRADE WORKING CAPITAL MANAGEMENT, RUB BLN
79.5
65.6 61.7 60.0 64.9
(69.5) (80.7) (80.6)
(74.2) (70.7)
10.0
(15.1)
(18.9) (14.2)
(5.8)
31.12.2013 31.12.2014 30.06.2015 31.12.2015 30.06.2016
Trade current assets Trade current liabilities Trade working capital
Operating activities almost completely cover
needs for financing investing and financing activities even though fist quarter of 2016 was quite challenging as prices for steel and coal were on their
lows levels
Trade working capital demonstrates further
improvement with increase by almost 7.5 bln RUB and tends to move to positive value
Sale of 49% in Elga supported to raise funds for
partial repayment of debt in amount 32.9 bln RUB 3.1
2.8
19.3
-3.8
-15.8
Cash as of31/12/2015
Operatingactivities
Investingactivities
Financingactivities
Cash as of30/06/2016
32,618 -32,899
19,277 -17,445
-989
31,775
-281
Cash flowfrom
Operations
Net interestpaid,inlc.
overdueinterest
Capitalexpenditure
Investingactivity,
incl. Elga
Free CashFlow
Settlementof loan and
leaseobligations
Free CashFlow to
Firm
FREE CASH FLOW, RUB MLN
13

DEBT STRUCTURE & NET DEBT / EBITDA RATIO DYNAMICS
13.7
11.0 9.5
2014 2015 1H2016
Lease
Long-term debt
Interest payable
Short-term borrowings
Net debt / EBITDA
State banks
67%
ECA 8%
Syndicate 16%
Bonds 4%
Others 5%
RUR 64%
USD 30%
EUR 7%
• As of August 2016 - 76% of Group’s debt is restructured; ruble portion
amounts to 64%; and state banks hold 67% of our debt portfolio.
• Due to partial debt repayment (32.9 bln RUB) and EBITDA increase (up
to 46.6 bln RUB for the previous 12 months) net leverage is consistently decreasing
• Average interest rate through debt portfolio is 10,3% and it trends lower
as ruble rates linked to Central bank key rate and average paid interest
rate (with PIK) 7,7%
RUB 487 bln
14
RUB 406 bln
RUB 445 bln
Restructured loans 76%
In
Restructuring 24%

Op
tio
n 1
Ва
ри
ан
т 2
Всего = $5 132 млн.
FY16 FY17 FY18 FY19 FY20 FY21
FY16 FY17 FY18 FY19 FY20 Просрочено FY21 FY22
Op
tio
n 2
DEBT RESTRUCTURING
DEBT RESTRUCTURING TERMS:
Tenure
Option 1 – grace period till 2017 and repayment
till 2020 Option 2 – grace period till 2020 and repayment
till 2022 subject to acceptance of extension by all 3 Russian State Banks (RSB)
Interest rates
Rates tied to LIBOR and CBR Key rate;
Paid interest under ruble loans with RSB at a level of 8.75% (with PIK for remaining part)
Penalties and fines
Banks have agreed to waive the accrued
penalties and fines after repayment of overdue interest
DEBT REPAYMENT PROFILE:
FY16 FY17 FY18 FY19 FY20 FY21 FY22
15

16
APPENDIX
0.
0.
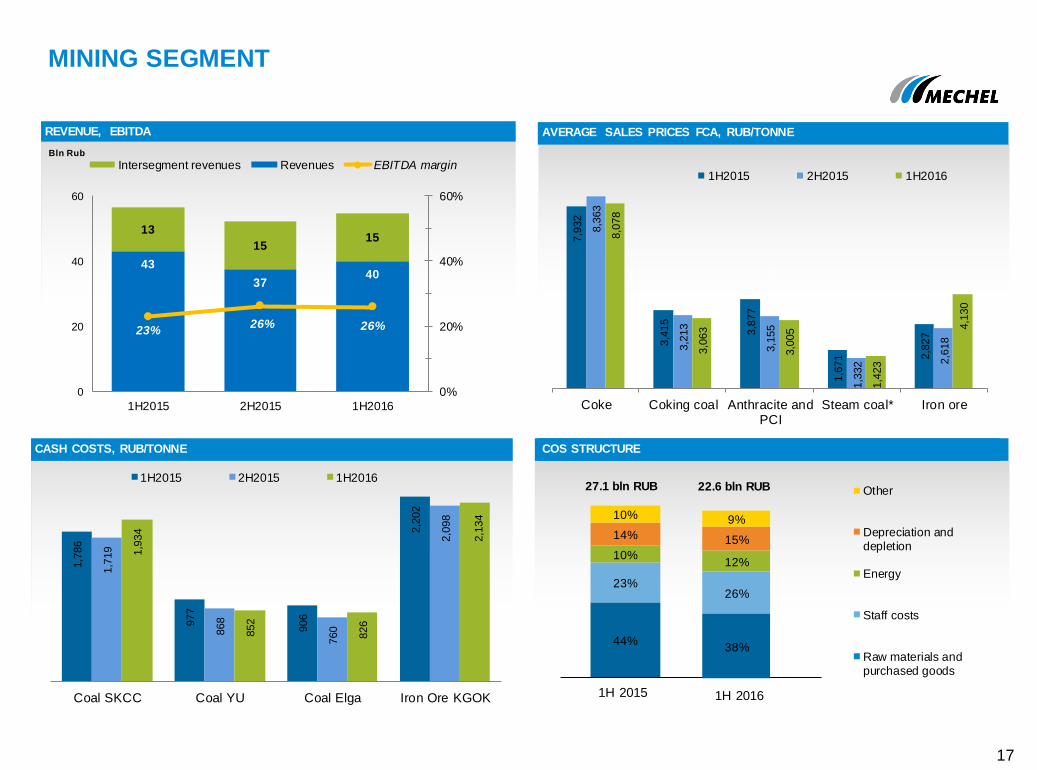
MINING SEGMENT
CASH COSTS, RUB/TONNE
REVENUE, EBITDA AVERAGE SALES PRICES FCA, RUB/TONNE
COS STRUCTURE
44%
23%
10%
14%
10%
Other
Depreciation anddepletion
Energy
Staff costs
Raw materials andpurchased goods
1H 2015 1H 2016
38%
26%
12%
15%
9%
COS STRUCTURE
27.1 bln RUB 22.6 bln RUB
Bln Rub
43
37 40
13
15 15
23% 26% 26%
0%
20%
40%
60%
0
20
40
60
1H2015 2H2015 1H2016
Intersegment revenues Revenues EBITDA margin
1,7
86
977
906
2,2
02
1,7
19
868
760
2,0
98
1,9
34
852
826
2,1
34
Coal SKCC Coal YU Coal Elga Iron Ore KGOK
1H2015 2H2015 1H2016
7,9
32
3,4
15
3,8
77
1,6
71 2,8
27
8,3
63
3,2
13
3,1
55
1,3
32 2,6
18
8,0
78
3,0
63
3,0
05
1,4
23
4,1
30
Coke Coking coal Anthracite andPCI
Steam coal* Iron ore
1H2015 2H2015 1H2016
17

Coking coal 37%
Anthracites and PCI
24%
Steam coal and
middlings 21%
Coke 12%
Coking products
3%
Other 4%
China 24%
Russia 29%
Europe 13%
Asia w/o China 28%
CIS 3%
Middle East 1%
Other 2%
MINING SEGMENT
REVENUE BREAKDOWN BY REGIONS
REVENUE BREAKDOWN BY PRODUCTS
1H 2016
1H 2016
Coking coal 33%
Anthracites and PCI
35%
Coke 11%
Coking products
3%
Steam coal and
middlings 12%
Iron ore 4%
Other 2%
China 27%
Russia 24%
Europe 22%
Asia w/o China 19%
CIS 3%
Middle East 4%
Other 2%
1H 2015
1H 2015
RUB
40 bln
RUB
43 bln
18

69,9
03
66,5
82
66,8
29
23,1
88 34,0
06
31,0
68
32,5
66
20,9
72 3
3,4
40
31,4
88
32,8
53
23,6
83 34,9
61
32,5
50
32,5
11
Rebar Hardware Carbon flat Carbon longproducts
Ferrosilicon
1H2015 2H2015 1H2016
74%
10%
11% 3%
2%
Other
Depreciation anddepletion
Energy
Staff costs
Raw materials andpurchased goods
CASH COSTS, RUB/TONNE
REVENUE, EBITDA
Bln. Rub
AVERAGE SALES PRICES FCA, RUB/TONNE
COS STRUCTURE
74%
10%
12%
3% 1%
COS STRUCTURE
61.9 bln RUB 58.7 bln RUB
1H 2015 1H 2016
STEEL SEGMENT
74 72
78
3 4 4
12%
8%
12%
0%
10%
20%
30%
40%
0
20
40
60
80
1H2015 2H2015 1H2016
Intersegment revenues Revenues EBITDA margin
13,2
39
14,9
00
15,1
60 19,2
02
13,6
83
15,2
78
15,5
90 19,4
81
13,1
49
14,8
09
15,4
68 19,3
19
Billets Wire rod Rebar Carbon Flat
1H15 2H15 1H16
19
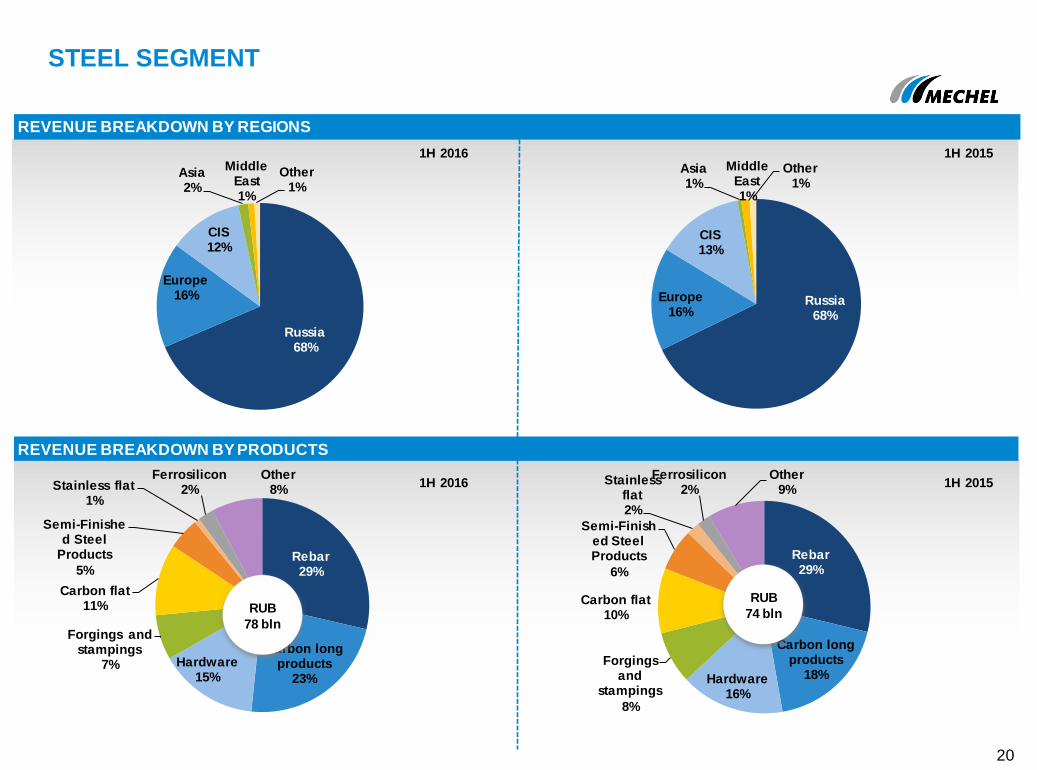
Rebar 29%
Carbon long products
18% Hardware 16%
Forgings and
stampings
8%
Carbon flat 10%
Semi-Finished Steel Products
6%
Stainless flat 2%
Ferrosilicon 2%
Other 9%
Rebar 29%
Carbon long products
23%
Hardware 15%
Forgings and stampings
7%
Carbon flat 11%
Semi-Finished Steel
Products
5%
Stainless flat 1%
Ferrosilicon 2%
Other 8%
Russia 68%
Europe 16%
CIS 13%
Asia 1%
Middle East 1%
Other 1%
Russia 68%
Europe 16%
CIS 12%
Asia 2%
Middle East 1%
Other 1%
REVENUE BREAKDOWN BY REGIONS
REVENUE BREAKDOWN BY PRODUCTS
1H 2016 1H 2015
STEEL SEGMENT
1H 2016 1H 2015
RUB
78 bln
RUB
74 bln
20

MINING AND STEEL EBITDA DYNAMICS
13,139 14,438
1,402
3,838
-2,036
-1,482
-423
0
5 000
10 000
15 000
EBITDA1H 2015
Prices ExternalSales
IntragroupSales
Costs Other EBITDA1H 2016
9,413 9,520
401
3,467
226
-3,354
-633
0
5 000
10 000
15 000
EBITDA1H 2015
Prices ExternalSales
IntragroupSales
Costs Other EBITDA1H 2016
Mining segment EBITDA increased by 10%
Major negative factor was record lowest coal prices during 1Q16
Group has replaced purchase of coals from
third parties with its own production, including Elga coal project
Largest positive impact was from decrease of costs as a results of improvement of efficiency of operations
Steel segment EBITDA remained stable
Growth of revenue is correlated with increase of costs for materials, electricity etc.
Average prices in both half-year periods were
similar and did not have much impact on EBITDA
Mining segment (RUB mln)
Steel segment (RUB mln)
21

POWER SEGMENT
AVERAGE ELECTRICITY SALES PRICES AND CASH COSTS (RUSSIA), RUB/KWH
REVENUE, EBITDA
Bln RUB
809 915 826 799 860
1,692
2,038 2,070
2,381 2,212
2Q15 3Q15 4Q15 1Q16 2Q16
Cash costs Sales price
94%
4%
-1%
1% 2%
1H2015 1H2016
Other
Depreciation anddepletion
Energy
Staff costs
Raw materialsand purchasedgoods
95%
4%
-2%
1% 1%
COS STRUCTURE 15 bln RUB 14 bln RUB
Revenue from external customers decreased by 7%
on additional equipment repair operations. Intersegment Revenue was flat
Lower cash costs and growing prices resulted in 50%
EBITDA increase.
14 13 13
7 8 8
6% 4%
10%
0%
10%
20%
30%
40%
0
10
20
1H2015 2H2015 1H2016
Intersegment revenues Revenues EBITDA margin
22