
1@Dynatrace Tech Blogs on Free Tools on Hosted by: Jeff Fynboh Web/App Performance How to keep...
56
1 @Dynatrace Tech Blogs on http://blog.dynatrace.com Free Tools on http://ajax.dynatrace.com Hosted by: Jeff Fynboh Web/App Performance How to keep you out of the News
-
Upload
annabella-pitts -
Category
Documents
-
view
216 -
download
0
Transcript of 1@Dynatrace Tech Blogs on Free Tools on Hosted by: Jeff Fynboh Web/App Performance How to keep...

1 @Dynatrace
Tech Blogs on http://blog.dynatrace.com
Free Tools on http://ajax.dynatrace.com
Hosted by: Jeff Fynboh
Web/App Performance How to keep you out of the News

2 @Dynatrace
WHY we are here
TODAY…

3 @Dynatrace
Nobody wants this …

4 @Dynatrace
Unless you work for Google or Microsoft

5 @Dynatrace
Nor this …

6 @Dynatrace

7 @Dynatrace
As it leads to this …

8 @Dynatrace
The “War Room”
Facebook – December 2012
The “War Room”
Facebook – December 2012

9 @Dynatrace
And potentially to this …

10 @Dynatrace

11 @Dynatrace
And this …

12 @Dynatrace

13 @Dynatrace
And that’s why Business doesn’t like it
either …

14 @Dynatrace
~80% of problems
caused by ~20% patterns
YES we know this
80% Dev Time in Bug Fixing
$60B Defect Costs
BUT

15 @Dynatrace
5 Situations on
WHY this happened,
HOW to avoid it
5 Situations on
WHY this happened,
HOW to avoid it

16 @Dynatrace

17 @Dynatrace
#Push without a Plan

18 @Dynatrace
Mobile Landing Page of Super Bowl Ad
434 Resources in total on that page:230 JPEGs, 75 PNGs, 50 GIFs, …
Total size of ~ 20MB

19 @Dynatrace
m.store.com redirects to www.store.com
ALL CSS and JS files are redirected to the www domain
This is a lot of time “wasted” especially on high latency mobile
connections
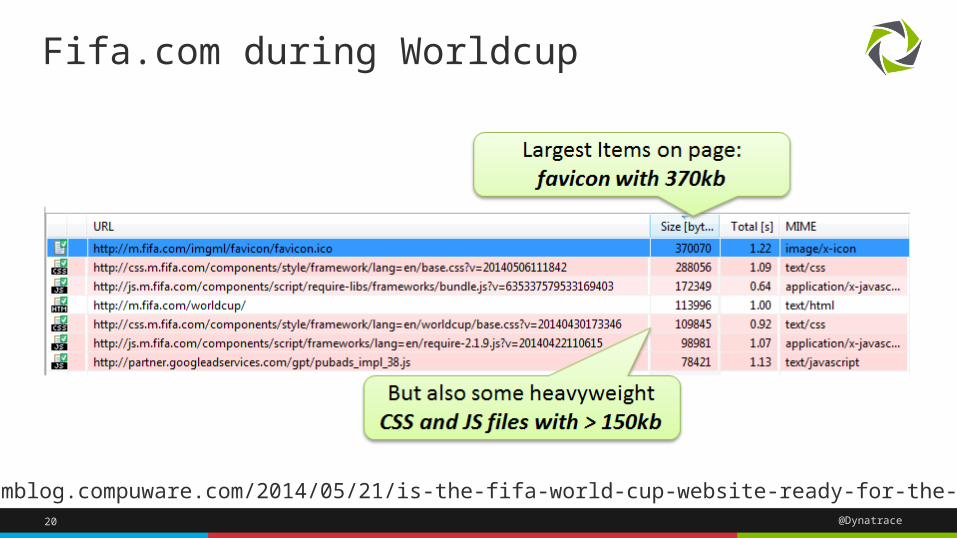
20 @Dynatrace
Fifa.com during Worldcup
http://apmblog.compuware.com/2014/05/21/is-the-fifa-world-cup-website-ready-for-the-tournament/

21 @Dynatrace
# Images# Redirects
Size of Resources

22 @Dynatrace

23 @Dynatrace
#“Blindly” (Re)use Existing
Components

24 @Dynatrace
Requirement: We need a report

25 @Dynatrace
Using Hibernate results in 4k+ SQL Statements to display 3 items!
Hibernate Executes 4k+ Statements
Individual Execution VERY
FAST
But Total SUM takes 6s

26 @Dynatrace
# SQL Executions# of SAME SQLs

27 @Dynatrace

28 @Dynatrace
Architectural Decisions gone
Bad
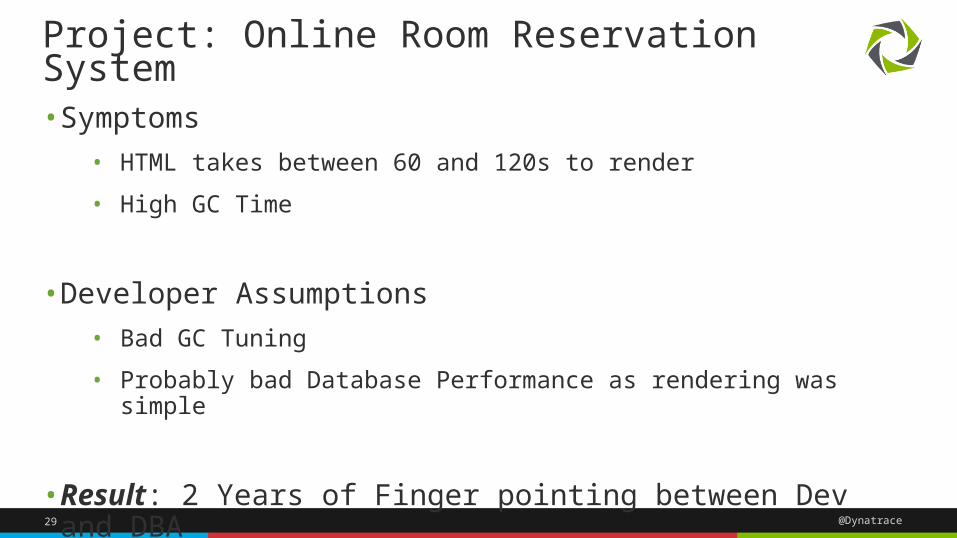
29 @Dynatrace
• Symptoms• HTML takes between 60 and 120s to render
• High GC Time
• Developer Assumptions• Bad GC Tuning
• Probably bad Database Performance as rendering was simple
• Result: 2 Years of Finger pointing between Dev and DBA
Project: Online Room Reservation System

30 @Dynatrace
Developers built own monitoring
void roomreservationReport(int officeId){ long startTime = System.currentTimeMillis(); Object data = loadDataForOffice(officeId); long dataLoadTime = System.currentTimeMillis() - startTime; generateReport(data, officeId);}
Result:Avg. Data Load Time: 45s!
DB Tool says:Avg. SQL Query: <1ms!

31 @Dynatrace
#1: Loading too much data24889! Calls to the
Database API!
High CPU and High Memory Usage to keep all
data in Memory

32 @Dynatrace
#2: On individual connections 12444! individual
connections
Classical N+1 Query Problem
Individual SQL really <1ms

33 @Dynatrace

34 @Dynatrace
Don’t assume
You know the environment

35 @Dynatrace
Distance Calculation Issues
480km biking in 1 hour!
Solution: Unit Test in Live App reports Geo
Calc Problems
Finding: Only happens on certain
Android versions

36 @Dynatrace
3rd Party Issues
Impact of bad 3rd party calls

37 @Dynatrace
# Functional Errors
3rd Party calls

38 @Dynatrace

39 @Dynatrace
Deployment gone bad

40 @Dynatrace
Test Environment
Production Environment
8x slower
3x more SQL

41 @Dynatrace
Test Environment Production Environment
Hibernate, Classloading,
XML – The Key Hotspots
Hibernate, Classloading, XML
– The Key Hotspots
I/O for Web Requests doesn’t
even show up!
That’s Normal: Having I/O for Web
Request as main contributor

42 @Dynatrace
Top Contributor Class.getInterfaces
Called from Hibernates FieldInterceptionHelper
These calls all originate from thousands of calls to
find item by code
43 @Dynatrace
Time Spent in API# Calls into API

44 @Dynatrace
12 000 000 $

45 @Dynatrace
#No “Agile” Deployment

46 @DynatraceAvailability dropped to 0%
Load Spike resulted in UnavailabilityAd on air

47 @Dynatrace
Alternative: “GoDaddy goes DevOps”
Response time improved 4x
1h before SuperBowl KickOff
1h after Game ended

48 @Dynatrace
# of DomainsTotal Size

49 @Dynatrace
•# Images
•# Redirects
•Size of Resources
•# SQL Executions
•# of SAME SQLs
•# Items per Page
•# AJAX per Page
Consider these Metrics
•Time Spent in API
•# Calls into API
•# Functional Errors
•3rd Party calls
•# of Domains
•Total Size

50 @Dynatrace
Commit Stage• Compile• Execute Unit Test• Code Analysis• Build installers
Automated Acceptance
Testing
Automated Capacity Testing
Manual testing• Key showcases• Exploratory testing Release
Unit & Integration Tests
Functional Tests
Performance TestsProductionMonitoring
Functional Tests
(R)Evolutionize Web Performance Optimization

51 @Dynatrace

52 @Dynatrace
Example from Web Diagnostics 282! Objects on that page9.68MB Page Size
8.8s Page Load Time
Most objects are images delivered from your main
domain
Very long Connect time (1.8s) to your CDN

53 @Dynatrace
Example from Server-Side Diagnostics526s to render that
report
1 SQL running 210s!
Lots of time spent in logging to Log4J
Lots of time spent in rendering

54 @Dynatrace
Online Performance Clinics
Every Other week @ bit.ly/onlineperfclinic

55 @Dynatrace
Your Benefits• Free Performance Review
• Extended Dynatrace License
“Share Your PurePath”
bit.ly/sharepurepathMy Benefits
• More blog material for next year
• Gratification that I could help you

56 @Dynatrace
Questions and/or Demo
Get Tools: http://ajax.dynatrace.com
YouTube Tutorials: http://bit.ly/dttutorials
Live Q&A Sessions: http://bit.ly/onlineperfclinic
Contact Me: [email protected]
Read More: http://blog.dynatrace.com