
1A.1 CGE Greenhouse Gas Inventory Hands-on Training Workshop Energy Sector.
44
1A.1 CGE Greenhouse Gas Inventory Hands-on Training Workshop Energy Sector
-
Upload
joel-simon -
Category
Documents
-
view
218 -
download
0
Transcript of 1A.1 CGE Greenhouse Gas Inventory Hands-on Training Workshop Energy Sector.

1A.1
CGEGreenhouse Gas Inventory
Hands-on Training Workshop
Energy Sector

1A.2
Our goal

1A.3
Our goal
To gain knowledge, comprehension, or mastery through experience or study.
Pronunciation: shuey si

1A.4
Outline of course Fuel combustion
References Basic emission processes Methodologies Relationships with other sources and sectors Uncertainty Quality control and completeness

1A.5
Outline of course (continued)
Fugitives References Coal mining and handling Oil and natural gas systems Data issues

1A.6
Survey says…?
Audience poll… Who has prepared a national inventory for your
country? Who has worked on the Energy Sector?
Please share… Problems you have faced in preparing estimates for
the Energy Sector Your plans for the future to improve your inventory

1A.7
Reference materials UNFCCC (COP decisions, reporting guidelines,
etc.) IPCC
Revised 1996 IPCC Guidelines IPCC Good Practice Guidance Emission Factor Database (EFDB) IPCC Working Group I Assessment Reports
Use “old” Second Assessment Report (SAR) Global Warming Potential (GWP) values for reporting
International Energy Agency

1A.8
IPCC guidance Fundamental methods laid out in 1996 Revised
Guidelines IPCC good practice guidance clarifies some
issues (e.g. international bunker fuels) and provides some updated factors…
…but no major changes made for fuel combustion!
2006 IPCC Guidelines will provide new information on Non-Energy Use, new Tier 2 method for oil systems fugitives, guidance on abandoned coal mines

1A.9
Key Category Analysis Level assessment based on share of total national
emissions for each source category
Trend assessment based on contribution of category to changes in emission trends
Qualitative criteria

1A.10
Key Category Analysis Idea of key sources based on a measure of
which sources contribute to uncertainty in inventory
Most if not all source categories in the Energy Sector will be Key Source Categories
Analysis only as good as original emissions data
You probably already know your key categories
1A.11
Energy Sector – Fuel Combustion
Emissions

1A.12
Stationary sources Energy Industries
Extraction, production and transformation Electricity generation, petroleum refining Autoproduction of electricity
Manufacturing Industries and Construction Iron and steel production Non-ferrous metal production Chemical manufacturing Pulp, paper and print Food processing, beverages and tobacco
Commercial/Institutional Residential Agriculture/Forestry/Fisheries

1A.13
Autoproducers
Note: p. 1.32 of the IPCC Guidelines, Reference Manual - Volume 3

1A.14
Mobile sources Civil Aviation Road Transportation
Cars Light duty trucks Heavy duty trucks and buses Motorcycles
Railways Navigation
International Bunker Fuels are reported separately
1A.15
Carbon dioxide (CO2) emissions
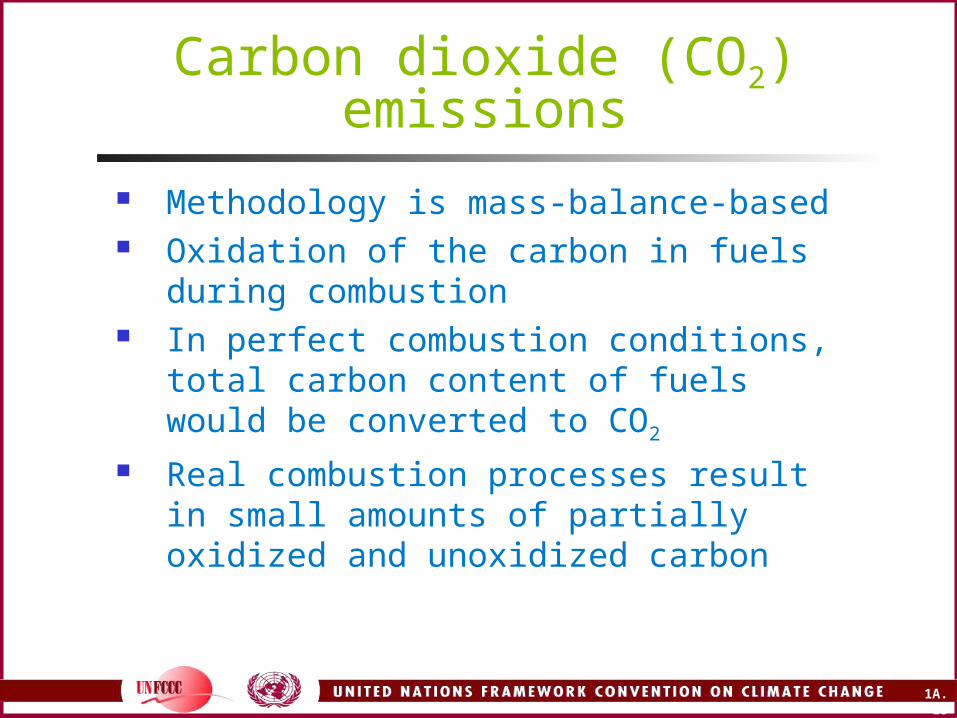
Methodology is mass-balance-based Oxidation of the carbon in fuels during
combustion In perfect combustion conditions, total
carbon content of fuels would be converted to CO2
Real combustion processes result in small amounts of partially oxidized and unoxidized carbon

1A.16
Carbon flow for a typical combustion process
Most carbon is emitted as CO2 immediately
Small fraction emitted as non-CO2 gases CH4, CO, non-methane volatile organic compounds
(NMVOCs) Ultimately oxidizes to CO2 in the atmosphere
Integrated into overall calculation of CO2 emissions Each carbon atom has two atmospheric lifetimes
Remaining part of the fuel carbon is unburnt Assumed to remain as solid (ash and soot) Account by using oxidation factors

1A.17
Non-CO2 emissions
Direct greenhouse gases Methane (CH4) Nitrous oxide (N2O)
Precursors and SO2
Nitrogen oxides (NOx) Carbon monoxide (CO) Non-methane volatile organic compounds
(NMVOCs) Sulfur dioxide (SO2)

1A.18
Require detailed process information
Combustion conditions Size and vintage of the combustion
technology Maintenance Operational practices Emission controls Fuel characteristics

1A.19
Methane (CH4)
Emissions a function of: methane content of the fuel hydrocarbons passing unburnt through engine engine type post-combustion controls
Depends on temperature in boiler/kiln/stove Highest emissions in residential applications
(e.g. small stoves, open biomass burning, charcoal production)
1A.20
Nitrous oxide (N2O)
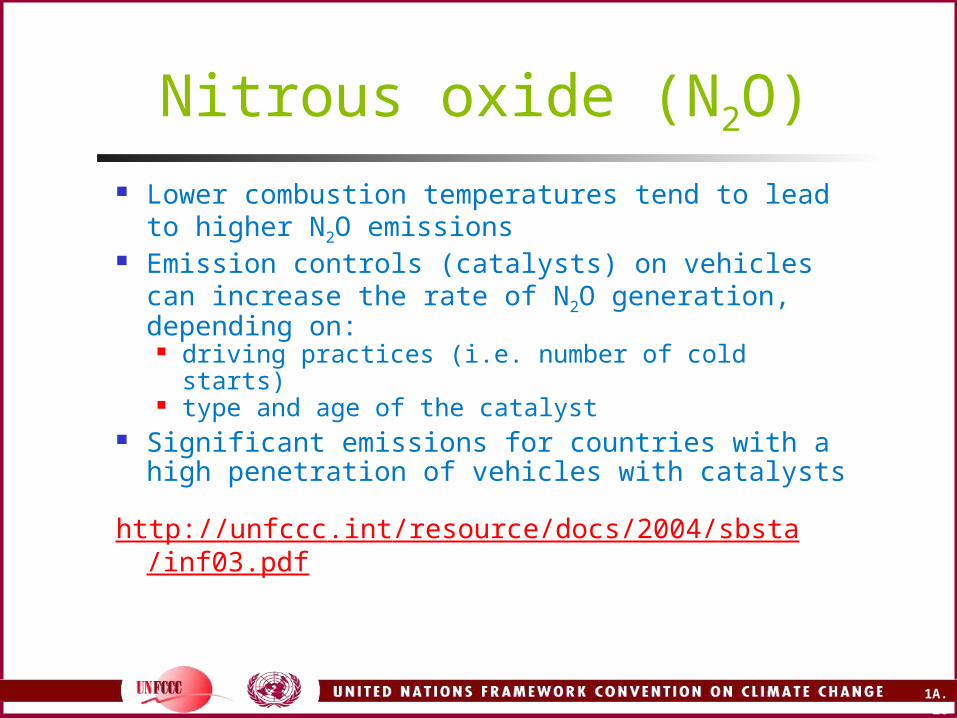
Lower combustion temperatures tend to lead to higher N2O emissions
Emission controls (catalysts) on vehicles can increase the rate of N2O generation, depending on:
driving practices (i.e. number of cold starts) type and age of the catalyst
Significant emissions for countries with a high penetration of vehicles with catalysts
http://unfccc.int/resource/docs/2004/sbsta/inf03.pdf
1A.21
Methods for estimating CO2
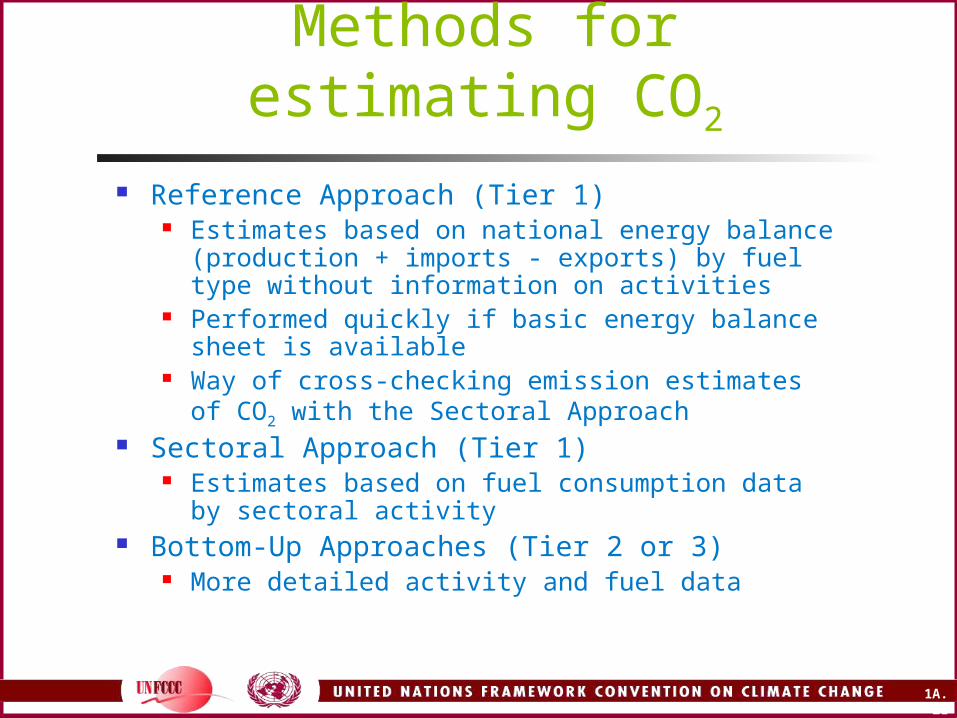
Reference Approach (Tier 1) Estimates based on national energy balance
(production + imports - exports) by fuel type without information on activities
Performed quickly if basic energy balance sheet is available
Way of cross-checking emission estimates of CO2 with the Sectoral Approach
Sectoral Approach (Tier 1) Estimates based on fuel consumption data by sectoral
activity Bottom-Up Approaches (Tier 2 or 3)
More detailed activity and fuel data

1A.22
Fundamental equation

1A.23
Six basic steps
1. Collect fuel consumption data2. Convert fuel data to a common energy unit3. Select carbon content factors for each fossil
fuel/product type and estimate the total carbon content of fuels consumed
4. Subtract the amount of carbon stored in products for long periods of time
5. Multiply by an oxidation factor 6. Convert carbon to full molecular weight of
CO2 and sum across all fuels

1A.24
1. Consumption data Reference Approach
Estimate apparent consumption of fuels within the country
Sectoral Approach Collect actual consumption statistics by fuel
type and economic sector Tier 2 or 3
Collect actual fuel consumption statistics by fuel type, economic sector and combustion technology type
1A.25
Data collection issues
IPCC sectoral approach can still be used even if energy data are not collected using same sector categories
Focus on completeness and use judgement or proxy data to allocate to various subsectors
Biomass combustion not needed for CO2 estimation, but reported for information purposes
Informal sector fuel use is important issue if not captured in energy statistics
Household kerosene use can be approximated based on expert judgement or proxy data

1A.26
2. Common energy unit Convert fuel data to a common energy unit Production and consumption of solid and
liquid fuels in tonnes Gaseous fuels in cubic meters Original units converted into energy units
using calorific values (i.e. heating values) Reference approach: use different calorific
values for production, imports and exports Calorific values used should be reported

1A.27
3. Estimate total carbon content of fuels consumed
Natural gas Depends on composition (methane, ethane, propane,
butane and heavier hydrocarbons) Natural gas flared at the production site will usually be “wet’’
– its carbon content factor will be different Typical: 15 to 17 tonnes C/TJ
Oil Lower carbon content for light refined petroleum products
such as gasoline Higher for heavier products such as residual fuel oil Typical for crude oil is 20 tonnes C/TJ
Coal Depend on coal's rank and composition of hydrogen, sulfur,
ash, oxygen and nitrogen Typical ranges from 25 to 28 tonnes C/TJ
1A.28
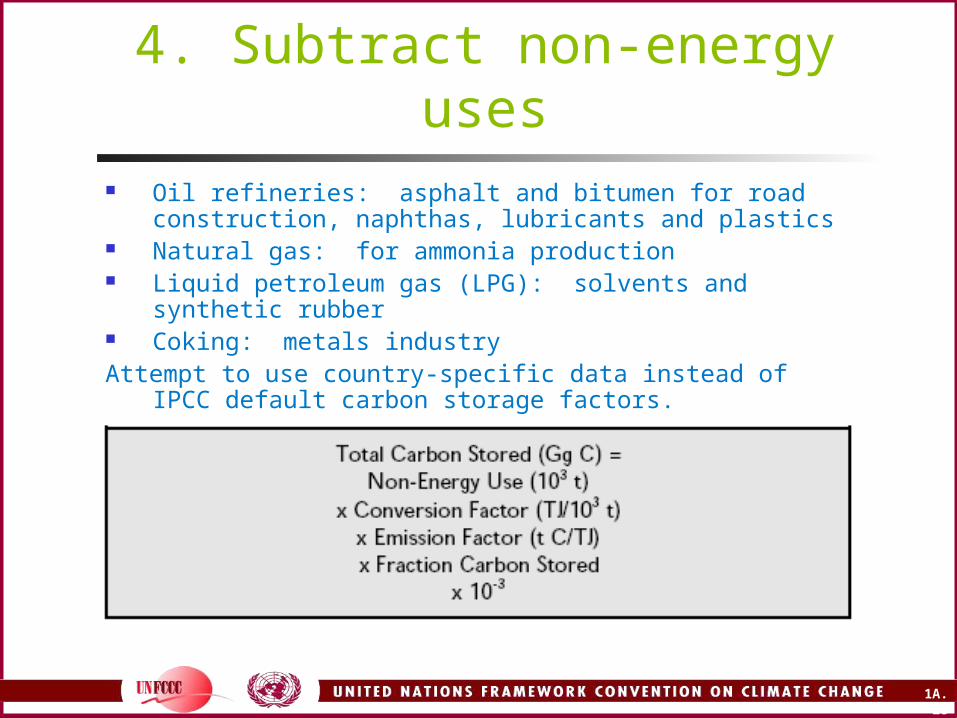
4. Subtract non-energy uses Oil refineries: asphalt and bitumen for road construction,
naphthas, lubricants and plastics Natural gas: for ammonia production Liquid petroleum gas (LPG): solvents and synthetic rubber Coking: metals industryAttempt to use country-specific data instead of IPCC default
carbon storage factors.

1A.29
5. Oxidation factor
Multiply by an oxidation factor to account for the small amount of unoxidized carbon that is left in ash or soot.
Amount of carbon remaining unoxidized should be low for oil and natural gas combustion…
…but can be larger and more variable for coal combustion
When national oxidation factors are not available, use IPCC default factors

1A.30
Oxidation factor valuesNatural gas
Less than 1% left unburnt Remains as soot in the burner, stack or environment IPCC default oxidation factor = 99.5% Higher for flares in the oil and gas industry Closer to 100% for efficient turbines
Oil 1.5 ± 1 per cent left unburnt IPCC default oxidation factor = 99% Recent research has shown 100% in autos

1A.31
Coal Range from 0.6% to 6.6% unburnt Primarily in the form of bottom and fly ash IPCC default oxidation factor = 98%
Biomass Can range widely, especially for open
combustion For closed combustion (e.g. boiler), the range
is from 1% to 10% No IPCC default
Oxidation factor values (cont.)

1A.32
6. Convert to full molecular weight and sum
Convert carbon to full molecular weight of CO2 and add across all fuels
To express the results as CO2, multiply the quantity of carbon oxidized by the molecular weight ratio of CO2 to C (44:12)

1A.33
International bunker fuels
CO2 emissions arising from fuels used in ships or aircraft for international transport, not to be included in the national total
Fuels delivered to and consumed by international bunkers should be subtracted from the fuel supply to the country
Bunker fuel emissions should be mentioned in a separate table as a memo item
See IPCC decision trees on marine and aviation transport emission allocation

1A.34
Biomass fuels CO2 emissions from biomass fuels should not be included
in national emission totals from fuel combustion Reported for information only…
household fuelwood ethanol & biodiesel for transport
Account for mixed fuels (e.g. ethanol blends) Net CO2 emissions implicitly accounted for under the Land
Use Change and Forestry Sector Non-CO2 emissions from biomass combustion should be
estimated and reported under the Energy Sector!

1A.35
Methods for non-CO2 emissions
Tier 1 Multiply fuel consumed by an average emission factor Does not require detailed activity data Rely on widely available fuel supply data that assume an
average combustion technology is used
Tiers 2/3 Multiply fuel consumed by detailed fuel type and technology-
specific emission factors Tier 2 methods use data that are disaggregated according to
technology types Tier 3 methods estimate emissions according to activity types
(km traveled or tonne-km carried) and specific fuel efficiency or fuel rates
Use most disaggregated technology-specific and country-specific emission factors available
1A.36
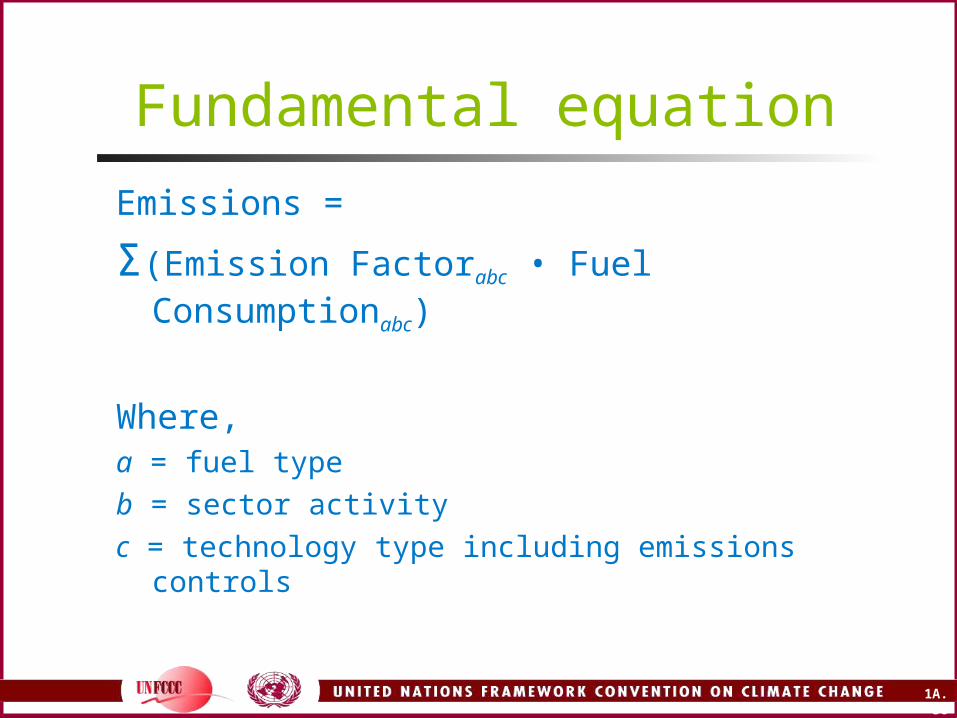
Fundamental equation
Emissions =
Σ(Emission Factorabc • Fuel Consumptionabc)
Where,a = fuel type
b = sector activity
c = technology type including emissions controls

1A.37
Stationary combustion Default emission factors for CH4, N2O, NOx,
CO and NMVOCs by major technology and fuel type are presented in the IPCC Guidelines
Most notable: CH4 emissions from open burning and biomass combustion
Charcoal production is likely to produce methane emissions at a rate that is several orders of magnitude greater than from other combustion processes

1A.38
Mobile combustion Major transport activity (road, air, rail and
ships) Most notable: N2O emissions from road
transportation, affected by the type of emission control technologies
Non-Annex I Parties should focus their efforts on collecting data on the number of vehicles with catalytic emissions control devices that operate in their country

1A.39
Mobile combustion (cont.)
Road transport activity data Assume vast majority of motor gasoline used for
transport Check data with equipment counts or vehicle
sales/import/export data Base assumptions of vehicle type and emission control
technology on vehicle vintage data (i.e. model year of sale) and assumed activity level (i.e. vkt/vehicle)
Consider national emission standards, leaded gasoline prevalence, and compliance with standards
1A.40
Relationships with other sources and sectors
Industrial Processes Sector Non-energy fossil fuel feedstocks data, if
available, may not be reliable Petrochemical “feedstocks” may actually be
used for energy Coal purchased by iron and steel industry
may be used to make coke Focus on petrochemical industry and metal
production (e.g. iron and steel) Conservative estimate: Assume plastics,
asphalt, and some lubricants stored Subtract carbon content from these products

1A.41
Relationships with other sources and sectors (cont.)
Waste Sector Combustion of wastes for energy purposes
included in Energy Sector Incineration of plastics
Land-Use Change and Forestry Sector Biomass carbon implicitly accounted for
Autoproduction of electricity Fuel use for military purposes Mobile sources in agriculture

1A.42
Quality control and completeness checks
All gases (CO2, CH4 and N2O) All source and sub-source categories All national territories addressed Bunker fuels and military operations All fossil-fuel-fired electric power stations Blast furnaces and coke production Waste combustion with energy recovery Black market fuels Non-metered fuel use for pipelines by compressor
stations

1A.43
Uncertainty Uncertainty in carbon content and calorific values for
fuels is related to the variability in fuel composition and frequency of actual measurements. Likely to be small for all countries.
For most non-Annex I Parties the uncertainty in activity data (i.e. fuel consumption data) will be the dominant issue! Effort should focus on collection of fuel consumption data Country-specific carbon content factors are unlikely to
improve CO2 estimates significantly It is important to document the likely causes of
uncertainty and discuss steps taken to reduce uncertainties.

1A.44
IPCC software and reporting tables
Software to aid in preparation of greenhouse gas inventories
Provides IPCC default (i.e. Tier 1) methods National factors can be used where
available