ISES 2013 - Day 3 - Erik Haugane (Former CEO, Det Norske Oljeselskap) - Carbon Fuels

1981 Den norske stats oljeselskap a.s
Annual report and accounts

Den norske stats oljeselskap a.s
Contents Page
3 Statoil's financial result 1872-1981 4 Highlights 5 The consolidated companies 6 The value added o f the consolidated companies
7 Report of the Board of Directors for 1981
19 The consolidated profit and loss statement for 1981
20 Consolidated balance sheet as of 31 December 1981
22 Comments to financial statements 30 Geological detective work 35 Articles of Association 36 Wells drilled on the Norwegian shelf
in 1981 37 Survey of activities for the
consolidated companies 38 Statoil interests in licences allocated
as of 1 January 1982.
I SAFETY, QUALITY
ASSURANCE
Manager K. Klllerud
I RESEARCH ANDDEVELOPMENT
-Manager K A m
I TECHNOLOGY AND
PROJECTS
The Board of Directors Director Finn Lied, Chariman Professor Ole Myrvoll, Vice-Chairman Managing Director Thor AndreassenHousewife Kirsti Lange District Governor Einar H. Moxnes Chartered Engineer Trond Bolstad Chartered Engineer Erling Haug
Alh:rnate members ProfessorH.J.A. Kreyberg Housewife Gerd Schanche Lawyer Lars Bakka Group Leader, Petrophysics, Jan Rafdal P roject Engineer Arve J. Hj0rungnes Senior Secretary Elisabeth Breivik
Auditor Certified Public Accountant Karl-Johan Endresen, Stavanger
Company Assembly Editor Egil Aarvik, Chairman Trade Union Secretary Evy Buverud Pedersen, Vice-Chairman Trade Union Secretary Odd Bakkejord
EXECUTIVE COMMITTEE
President A. Johnsen Sen. Exec. VicePrees: H . Ager-Hanssen
Exec. Vice Pres. e~~\;. Vied Pre.s. Exe<;. Vice Pres. J. M. Wennesland J E11 J. 0 xnevad
I INFORMATION AND
PUBLIC AFFAIRS
MangaerW.H. Olsen
I ECONOMY ANO
FINANCE
Advisor Bodi! Bjartnes Director Egil Flaatin Lord Mayor Arne Rettedal until 13.10. 1981 Construction Worker Harald Schjetne Teacher Grethe Westergaard-Bj0rlo Dr. of Engineering Atle A. Thunes Supervisor, Personnel Accounting, Margot Pedersen Group Leader, Data Processing, Kjell Mork Knudsen Administrative Secretary Kari Faret
Alternate members Trade Union Secretary Harriet Andreassen, from 14. 10. 1981 Administration Manager Johannes Andreassen District Governor AJv Jakob Fostervoll Chartered Engineer Knut Helle Chief Engineer Bj0m Lian Planning Engineer Harald N. Hansen Marine Advisor Jan Holm Chartered Engineer Egil Tveit Senior Secretary Margaret SannerGeologist Oddvar Skarpnes Information Officer Toril Dakka
I
LEGAL AFFAIRS
Manager J.C. Mlddelthon
I ORGANIZATION AND
ADMINISTRATION
Sen. Vice Pres. H.E. Langangen J.E. Langangen (acting)
I I I EXPLORATION & TRANSPORT REFINING AND
PRODUCTION MARKETING
Sen. Vice Pres. J .M. Huslld Sen. Vice Pres. M. Bekkeheien Sen. Vice Pres. T. Espedal Sen. Vice Pres. J.E. Sandvik
Cover photo: In the summer of 1981 Statoil made a considcrublc gns discovery o n block7120/ 8, Tromsonaket. The find is being tested by the «Ross Rig», on 31 August. Both narebooms are used during the production rest.
2
Organization Chart, March 1982.

Statoil' s fmancial result 1972-1981
.
. --
.. , ' .. ,.
-- -
of NOK
1000
800
600
400
200
0
.;.. 200
1972 73 74 75 76 77 78 79 80 400
1981
Statoil's financial result shows a satisfactory development. In 1981 the result is a profit of slightly more than NOK 1billion and in addition, Statoil pays nearly NOK 400 million in taxes during the same period. Previous loss has now been covered, and as a consequence, the
company taxeswill inc1ease in 1982.
3

Highlights Amounts in millions of NOK
Sales
Salaries and social costs
Depreciation
Financial expenditures
Operating result
Financial result
Investments
Total asseto;
Share capital issued as of 31 Dec.
The consolidated companies
1981 1980
13 499 8 593
471 347
679 489
1 734 656
3 839 1 463
1 019 203
3 091 2 610
15 878 14 593
2 944 2 944
Number of employees as of 31 Dec. 2 645 2 335
Revenue
Petrochemical oil and gas products
Refined products
1977 1978 1979 1980 1981 St at oil
4
1980 1981 The consolidated companies
Mill ions of NOK
14000
12000
10000
8000
6000
4000
2000
Statoil
1981 1980 1979 1978 1977
11547 7 125 3 255 2 001 1 686
250 157 96 77 55
531 352 319 133 47
1 565 548 159 88 36
3 679 1 392 13 -97 -77
1 052 223 - 217 -194 - 112
2 953 2 465 2 850 2 046 1 719
14 222 12 952 lO 159 7 795 5 555
2 944 2 944 2 944 2 734 1852
1 362 1 059 745 607 506
Investments
Offshore
Millions Onshore of NOK
3500
3000
2500
2000
1500
1000
500
1977 1978 1979 1980 1981 1980 1981 Statoil The consolidated
companies

The consolidated companies
statoilStatoil's own activities
Headquarters in Stavanger Regional offices in Bergen,Trondheim and Harstad Project offices in Oslo and London • Operator for 8 licences south of Stad • Operator for 2 licences on Troms0flaket • Development of block
34/ 10 • Development of the Statpipe gas transportation system • Crnde oil transportation by ship from the Statfjord field • Supply base in Stavanger • Approx. 1360 employees
Participation in activities • Oil production, Statfjord • Oil production, Murchison • Gas production, Frigg
• Development of Heimdal • Development of North-East Frigg • Petrochemical industry at Bamble • Norpipe transportation system of oil and gas from Ekofisk • Exploration activities in a number of licences • Base activities
on Sotra and in Kristiansund N, Harstad and Ilarnmerfest The company is owned 100 per cent by the state.
• Headquarters in Oslo • Regional offices in Oslo, Drarnmcn, Bergen, Trondheim and Troms0
• Approx. 12 major tank installations, 70 distribution facilities and 200 coastal depots for storage.
• Approx. 600 tank lorries, 85 railway tank wagons and several ships for transportation • Approx. 750 service stations
• Approx. 800 suppliers and 300 OOO registered customers • Approx. 930 employees
The company is owned 73.62 per cent by Statoil and 26.38 per cent by the state.
-- - ---- - - --
RADINOR• Building and operation of the Mongstad refinery.
The production started up in 1975, and the first Statfjord oil was delivered in December 1979 • Upgrading and modernizing of the refinery • Approx. 350 employees
The company is owned 30 per cent by Statoil, 40 per cent by Norol and 30 per cent by Norsk Hydro.
5

Highlights Amounts in millions of NOK
Sales
Salariesand social costs
Depreciation
Financial expenditures
Operating result
Financial result
Investments
Total assets
Share capital issued as of 31 Dec.
The consolidated companies
1981 1980
13 499 8 593
471 347
679 489
1 734 656
3 839 1 463
1 019 203
3 091 2 610
15 878 14 593
2 944 2 944
Number of employees as of 31 Dec. 2 645 2 335
Revenue
Petrochemical Crude oi l and gas products
Refined products
1977 1978 1979 1980 1981 Statoil
4
1980 1981 The consolidated companies
Millions of NOK
14000
12000
10000
8000
6000
4000
2000
St at oil
1981 1980 1979 1978 1977
II 547 7 125 3 255 2 001 1 686
250 157 96 77 55
531 352 319 133 47
1565 548 159 88 36
3 679 I 392 13 -97 -77
1 052 223 - 217 - 194 - 112
2 953 2 465 2 850 2 046 1 719
14 222 12 952 10 159 7 795 5 555
2 944 2 944 2 944 2 734 1 852
1362 1 059 745 607 506
Investments
OffshoreMillions
Onshore ofNOK
3500
3000
2500
2000
1500
1000
500
1977 1978 1979 1980 1981 1980 1981 Statoil The consol idated
companies

The consolidated companies
statoilStatoil 's own activities
• Headquarters in Stavanger • Regional offices in Bergen, Trondheim and Harstad • Project offices in Oslo and London • Operator for 8 licences south of Stad • Operator for 2 licences on Troms0flaket • Development of block
34/ 10 • Development of the Statpipe gas transportation system • Crude oil transportation by ship from the Statfjord field • Supply base in Stavanger • Approx. 1360 employees
Participation in activities • Oil production, Statfjord • Oil production, Murchison • Gas production, Frigg
• Development of Heimdal • Development of North-East Frigg • Petrochemical industry at Bamble • Norpipe transportation system of oil and gas from Ekofisk • Exploration activities in a number of licences • Base activities
on Sotra and in Kristiansund N, Harstad and Hammerfest The oompany is owned 100 per cent by the state.
•Headquarters in Oslo • Regional offices in Oslo, Drammen, Bergen, Trondheim and Troms0
• Approx. 12 major tank installations, 70 distribution facilities and 200 coastal depots for storage
• Approx. 600 tank lorries, 85 railway tank wagons and several ships for transportation • Approx. 750 service stations
• Approx. 800 suppliers and 300000 registered customers • Approx. 930 employees
The company is owned 73.62 per cent by Statoil and 26.38 per cent by the state.
-- - ---- - - ------ ---- ----= -- =
RAFINOR• Building and operation of the Mongstad refinery.
The production started up in 1975. and the first Statfjord oil was delivered in December 1979 • Upgrading and modernizing of the refinery • Approx. 350 employees
The company is owned 30 per cent by Statoil, 40 per cent by Norol and 30 per centby Norsk Hydro.
5

6
The value added of the consolidated companies
Suppliers NOK 7343 million
Total value added 5798 mill. kr.
State, municipality 29.3%
The value added of the consolidated companies was 41.4 per cent of the total revenue, in 1981.
The distribution of the value added is illustrated above.
Ordinary depreciation NOK 679 million
Other expenses 172 mill. kr.

Report of the Board of Directors for 1981
Introduction The consolidated companies have
continued their progress in 1981. The consolidated accounts show a net income of NOK I 019 million compared to NOK 203 million in 1980. Estimated taxes for 1981 of NOK 352 million have been deducted.
Based on the Norwegian Parliament's decision on 10 June 1981, concerning landing of Statfjord gas to Emden via Karst0 and development of block 34/10, Statoil, as operator, has begun these development and operation tasks.
The summer of 1981, Statoil proved a gas find on block 7120/8 off Northern Norway. This discovery confirms the possibility for considerable petroleum reserves on the Norwegian continental shelf north of the 62nd parallel.
Exploration, development and production Statfjord
Production of crude oil from StatfjordA increased from about 120 OOO barrels (about 16000 metric tons) per day in January 1981 to about 210000 barrels (about 28 OOO metric tum;) by the end of the year. In 1981, the total production was 7.8 million metric tons, of which the Statoil share was 3.3 million metric tons. In 1981, Statoil's income from the Statfjord field was about NOK 5.2 billion compared to about NOK 1.9 billion in 1980. The positive result development for Statoil in 1981 is mainly due to a production increase on Statfjord A.
The water injection equipment on Statfjord A was completed and tested in 1981. The total building costs for Statfjord A are within the Statfjord groups' estimates of NOK 7 .5 billion.
Building and commissioning of the Statfjord B platform have been carried out at full speed in 1981. The deck and concrete gravity structure were mated and in August the platform was towed out and positioned on the field. T he building of the loading buoy follows a schedule which supposes tow-out of the buoy to the field in 1982. The extent of the remaining completion work at sea is somewhat larger than previously supposed. The estimates for the total building costs for the B platform have increased by NOK 830 million to slightly more than NOK 10.8 billion. Statoil expects the production of crude oil on Statfjord B to start early in 1983.
The work on the Statfjord C platform is on schedule and all the large contracts have now been signed. The building of the concrete gravity structure has been i progress all through 1981. The deck frames
have been finished and will be mated during tlie first half of 1982.
The cost estimates for the C platform are NOK 12.3 billion. Based on a cost increase for the B platform, the cost estimates for Statfjord C are currently being reviewed.
Murchison The year 1981 has been the first
complete production year on the Murchison field. A total of 3.7 million metric tons of crude oil has been produced. Statoil owns more than eight per cent of the field and ha<; received four cargoes of crude oil (a total of about 0.25 million metric tons) from the Shetland terminal. Murchison made a positive contribution to the Statoil operating result in 1981 .
Frigg In 1981 about 18 billion cubic meters of
gas were produced from the Frigg field. The gas deliveries from the field gave
Statoil sales totalling NOK 404 million in 1981 compared to NOK 284 million in 1980. The Frigg production made a positive contribution to the company result in 1981.
North-East Frigg is a small field adjacent lo Frigg. The development of the field started in 1980 and continues as planned. In 1981, the building of the field control station was started. The drilling of the first of six production wells began at the end of 1981. P roduction start-up is planned in 1984.
Block 34/10 Pursuant to the Norwegian Parliament's
decision on 10 June 1981, the Goverrunent approved on 9 October 1981 the first phase of the development of block 34/10, Delta East.
Phase l includes two platforms and is estimated to cost NOK 18.5 bilUon in fixed 1980 prices. P latform A will be a combined drilling, production and quarters platform with a concrete gravity base structure. The production capacity will be about 12 million metric tons of oil and 1.3 billion cubic meters of gas per year. The platform is planned to go on stream in 1987.
The oil will be loaded on tankers from a loading buoy, whereas the gas will be landed at Karst0 through the Statpipe system. The dry gas will be piped further on to Emden in West Germany through the Statpipe/ Norpipe grid.
The B platform will be a combined drilling and quarters platform which will go on stream in 1989. Statoil is operator with an ownership share of 85 per cent. Norsk Hydro and Saga Petroleum own nine and six per cent respectively. Probable recoverable reserves for the whole Delta
Oil and gas reserves chosen tor development on the Norwegian cont inental shelf.
• The Statoil share
• Other companies' share M.t.o.e.
Statpipe will provide transportation for gas.
7
East field are 200 million metric tons of oil and 24 billion cubic meters of gas.
The pre-engineering for platform A was started in 1981 and will be completed during the first half of 1982. Contracts have been entered into with project services contractor and pre-engineering contractor.
Heimdal On 10 June 1981 the Norwegian Parlia
ment approved the application for development of the H eimdal field. Elf is operator and Statoil owns 40 per cent. The recoverable reserves of the field are estimated at about 33 billion cubic meters of gas and 3 million metric tons of condensate.
The Heimdal field will be developed with a combined drilling, production and quarters platform in steel. The platform is estimated at slightly more than NOK 4.5 billion in fLxed 1980 prices and NOK 7.8 billion in current prices. Production start is planned in July 1986. The gas will be transported through the Statpipe/Norpipe system to the Continent. The Heimdal group has so far not reached a fmal decision concerning a transportation solution for the condensate. The operator has started the pre-engineering of the development.
Exploration for oil and gas An extensive exploration activity on the
Norwegian shelf has been carried out in 1981. As many as 15 drilling rigs have been active at the same time. Altogether 39 new wells were spudded. Statoil was operator of 14 of them. The company has used four drilling rigs. In addition to the exploration drilling, Statoil has also carried out an extensive programme of seismic surveys.
In the fifth round of concessions three new licences were allocated north of the 62nd parallel with Norsk Hydro and Statoil as operators for one block each on
Exploration and delineation wells spudded on the Norwegian continental shelf .
• Where Statoil is operator
• Where Statoil is not operator
Number of wells
' I
I
I I I
I I I I I I I I I I I I I I . . ••• . . .
8
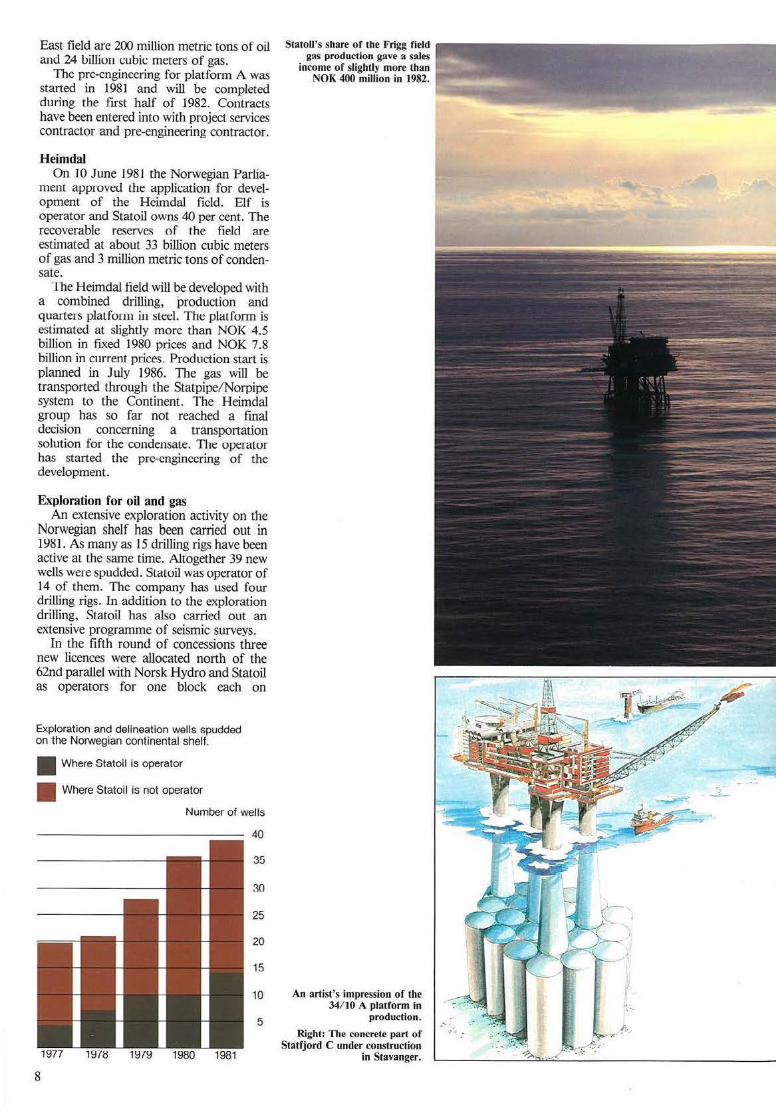
Statoll's share or the Frigg field gas production gave a sales
income of slightly more than NOK 400 million in 1982.
An artist's impression of the 34/ 10 A platform in
production.
llighl: The concrete part of StatJjord C under construction
in Stavanger.
....

Troms0flaket. Saga is operator for a block on Haltenbanken. Altogether eight licences were awarded during the sixth round of concessions. These consist of blocks or parts of blocks in the southern part of the North Sea which have been returned by earlier licensees. Statoil was appointed operator for hlock 8/ 3. The company owns 50 per cent of all iicences which were awarded in 1981.
mock 7120/ 8 During the summer of 1981 Statoil made
a considerable gas find in block 7120/8 on Troms0flaket. The drilling rig «Ross Rig» carried out the drilling and testing. The first result<; indicate that there may be about 100-150 billion cubic meters of gas. More drilling is needed to confirm the size of the discovery.
The blocks 15/ 8 and 15/ 9 (Sleipner area) T11e exploration activity in the Sleipner
area was extensive in 1981 . Altogether six wells were spudded. A promising gas find wao; made in a new structure in the eastern part of block 15/9. Earlier reserve estimates for other gas and condensate structures in the Sleipner area have been confirmed. Stafoil's estimates for recoverable reserves in this area are now about 200 billion cubic meters of gas and 30 million tons of condensate. The work on a commerciality study for the Sleipner field continues. It is probable that the gao; reserves will be commercial.
Block 30/ 6 In the fourth well on block 30/6 oil was
proven. The results indicate that the Alpha structure is a large oil field with gas at the top of the reservoir. The fifth well proved oil in a small separate structure in the ea<;tem part of the block.
On 11 February 1982 the Government decided that the operatorship for block 3016 is to be transferred from Statoil to Norsk Hydro as soon as possible.
Block 31/ 2 In Shell's discovery on block 31/2, the
1981 activity has been concentrated on completing and testing the wells which were started in 1980. Exploration shows that there is a large gas field with a layer of heavy oil underneath. Recoverable reserves are estimated at about 400 billion cubic meters of gas. It is, at the moment, unce1tain whether the oil can be extracted. Statoil owns 50 per cent of block 31/2.
Supply ba..e activities In 1981, the supply base facilities which
Statoil is engaged in had total revenues of about NOK 87 million and an operating result of about NOK 6 million.
The activity was satisfactory for the two bases which serve the activities in the North Sea. This applies to the Coast Center Dase (CCB) on Sotra near Bergen, where Statoil owns 50 per cent, and Statoil's own supply base at Dusavig outside Stavanger.
9


The StatfjordB platformin1981, surrounded by Impressive Norwegian scenery.

Norbase a.s and Vestbase a.s serve exploration activities on Trorns0flaket and Haltenbanken respectively. In 1981, the activity has been restricted to the limited drilling season for exploration north of the 62nd parallel.
Transportation Statpipe
The Norwegian Parliament approved on 10 June 1981 the landing of gas from the Statfjord field. The gas will be piped to Emden via K¬rstß in Northern Rogaland . The transportation company, Statpipe, owns the gas transportation system which, in addition to the gas from the Statfjord field, will transport gas from Heimdal and block 34/10. The transportation system also gives possibilities for tie-in of other fields.
Statoil is operator for Statpipe and owns 60 per cent of the shares.
Statpipe will lay about 850 kilometers of pipeline in the North Sea. A pipeline for transportation of rich gas will be laid from Statfjord to K¬rstß At the K¬rstßterminal, wet gas will be fractionated and made available for Norwegian industry. The dry gas will be transported through a pipeline on to a riser platform in the Sleipner area to Ekofisk and from there on through the Norpipe system to Emden. The total investments in Statpipe are estimated at NOK 12.8 billion in 1980 prices which corresponds to about NOK 19 billion in current prices. The facilities will be ready to go on stream on 1 January 1986.
A contract has been entered into with project services contractor for the pipeline, plus contract for detail engineering of the pipeline and platforms. Contracts for purchase of pipe have been entered into with German and Japanese suppliers.
The construction work at K¬rstß has scarted up and several contractors have been engaged. The progress of the building project is on schedule.
Norpipe The operation of the Norpipe compa
nies' transportation and treatment systems has been satisfactory in 1981. About 16.6 million metric tons of crude oil were piped from Ekofisk to Tccsside. This is a decline of 23 per cent over 1980, which mainly is due to reduced ojJ production in the Ekofisk area. About 13.4 billion cubic meters of gas flowed through the gas pipeline from Ekofisk to Emden in 1981. This was eight per cent less than in the previous year.
1l1c Norpipe companies had a total turnover of NOK 3 252 million and a net income before taxes of NOK 338 million in 1981. Statoil owns 50 per cent of the shares in both companies and received last year a total of NOK 92 million in dividends.
Statfjord Transport In 1981, 75 shipments of crude oil were
lransported from the Statfjord field to
12
various ports in Northern Europe. The loading operations from the field have been carried out satisfactorily. The company has at its disposal three tankers and has entered into a long-term charter agreement for two more tankers to be delivered in 1982 and 1983.
Refining and marketing Sale of crude oil
Statoil's total access to crude oil in 1981 was 5.5 million metric tons. Of this amount, 2.3 million metric tons were royalty oil bought from the state at market price (norm price).
About 2.5 million met1ic tons of Statoil's crude oil were delivered to the refinery at Mongstad. The company sold 3.0 million metric tons of crude oil externally at satisfactory prices.
In 1981, the international market for crude oil was one of low demand and high supply. The low demand was connected with low economic activity, energy conservation and transfer to other sources of energy. In addition a considerable reduction of the oil inventories in the western industrialized countries has taken place. A continuously high level of production in Saudi-Arabia has been an important reason for the abundant supply of crude oil.
The contract price for North Sea oil was about USD 40 per barrel after piice adjustments at the year end 1980. The development on the international oil market Jed to a contract price reduction to just below USD 36 per barrel in June.
In October the OPEC countries agreed on a common reference price for crude oil. It led to a Saudi-Arabian price increase, while the crude oil price from a number of other OPEC countiies was reduced. The contract price for North Sea oil increased by an average of USD 1.50 per barrel from 1 November to USD 37-37.50 per barrel cif North Sea port. However, minor price adjustments have been carried out for a few crude oil types at the turn of the year as a consequence of quality and market conditions. In February 1982 the contract price for North Sea oil was reduced by about USD 1.50 per barrel to about USD 35.50 per barrel cif North Sea port.
The consumption of oiJ products in 1981 was, on a world scale, about five per cent lower than in 1980. The total consumption of oil products in 1982 is expected to be on about the same level as in 1981.
Refining, and sale of refined products The operation of the Mongstad refinery
has been satisfactory with a capacity use of 85 per cent.
The last building stage of the facility which produces propane and butane of surplus gas is now on stream.
To meet the demand of the authorities concerning reduced lead content in petrol, the owner companies have decided to build
Crude oil supplies to the consolidated companies.
Equity oil Purchased oil
Royalty oilM.t.o.e.
Crude oil marketed by the consolidated companies.
Refining
5,0
4,5
4,0
3,5
3,0
2,5
2,0
1,5
1,0
0,5
External sale M.t.o.e.
I I I I
I I I I I I I I
1977 1978 1979 1980 1981
5,0
4,5
4,0
3.5
3.0
2,5
2,0
1.5
1,0
0,5
Norol's most important products, and their share of the domestic market.
Gasoil
- Heavy fuel oil
- Gasoline
- Jet kero
Per cent 40
35
1977 1978 1979 1980 1981 10

The K¬rstß plantin February 1982. Statoilis operator for the development.
The orwegian Parliamentary Committee for Local Government and EnvironmentalProtection visited K¬rstßin Februa ry 1982. From left to right, two members of Parliament KjellbjßrgLunde and H¬konRandal , further Executi ve Vice President Jan M. Wennesland and Project Manager BjßrnWang of Statoi l.
Classes from TysvÞrhave also been given on introduction to the project.
13


a facility forproduction of super petrol with a low lead content. According to schedule the facility will be ready for operation in 1983, and is estimated to cost about NOK 120 million.
A more efficient exploitation of the raw material plus a maximum upgrading to the light and most valuable products is the point of departure for the development plans of the refinery which now is being considered by the owner companies. The plans are scheduled to be presented to the authorities in 1982.
Statoil's export of products from the Mongstad refinery consists of product<; which Norol has no need for in Norway, and includes mainly contract sales of naphtha, gas oils and fuel oils. The export has been distributed between Scandinavia, other Northern European countries and the USA.
In 1981, the international market for petroleum products in Western Europe has generally been marked by reduced consumption, especially for the heavier products.
In 1981 Statoil's total export of products was about 750000 metric tons, a total value of sllghtly more than NOK 1.3 billion.
Norsk Olje In Norway Norsk Olje a.s (Norol)
handles all marketing of the consolidated companies' refined products.
Total domestic sale of oil products in 1981 was 6.6 million metric tons. This is a decrease from 1980 of eight per cent. Norol's indigenous sale in 1981 was I .8 million metric tons, which is 13 per cent lower than the previous year. Norol's reduced share of the market is due to the general market decline plus a planned adjustment to more profitable products and markets.
The sale of petrol and diesel fuel is relatively stable, and Norol strengthened its position in this market in 1981 among other things by increased use of Norol cards and self-service stations. Norol's average market share for sale of refined products in Norway was 26.2 per cent in 1981.
In 1981 Norol's sales amounted to NOK 5 416 million. The accounts show a net income of NOK 81 million. This is a considerable improvement compared with the result for 1980 which showed a deficit of NOK 29 million. The result improvement is, among other things, due to the fact that the price authorities acknowledged an increase of the oil companies' marketing margins in the autumn of 1980, so that in the first months of 1981 there was a better correlation between sale prices for refined products and crude oil prices than in 1980. Besides, there is a continuous internal process to make the operation more efficient.
Norol's total investment in 1981 wasNOK 106 million.
The StatfjordA in production.
Petrochemicals The market situation for plastic raw
maLerials in WesLem Europe b still marked by low prices and low demand. Statoil's share of the revenue for Noretyl and Norpolefin was NOK 561 million. Statoil's share of the petrochemical activities at Bamble gave a negative operating result in 1981.
The market prospects for plastic raw material give no reason to expect considerably higher prices in the future years. The wet gas to Bamble will cost substantially more in 1982, therefore no result improvement is expected. The Board is concerned with reversing this development. In 1982, Statoil, together with the other owner companies, will greatly emphasize the preparation and implementation of steps which may strengthen the operational foundation of the petrochemical plant.
Other activities Research and development
The petroleum activities on the Norwegian continental shelf make large demands on technology and knowledge. This makes it necessary to have a strong engagement in research and developmenl. In 1981, Statoil has increased its efforts considerably in this field.
A large part of Statoil's activity with.in research and development consists of projects related to the so-called Northern Norway programme, which was begun in 1980. Together with other oil companies, Statoil has started several large projects to develop and improve platforms and equipment for development and landing of oil and gas from fields of ocean depths of over 300 meters. Further studies have been started to determine transportation alternatives and exploration possibilities for gas if landing is decided in Northern Norway. The project also includes a survey of possible deliveries of goods and services from Northern Norwegian trade and business, plus other environmental consequences of a landing. The programme is scheduled to be finished in 1984.
A large research programme was started in 1981 aimed at determining the possibilities for an increased use of automation of future offshore installations.
Statoil, together with The Royal Norwegian Council for Scientific and Industrial Research (NTNF), Det Norske Veritas, Norsk Hydro and Saga Petroleum participated in the foundation of the Norwegian Underwater Technology Center.
Safety and quality assurance In 1981, the work with safety and quality
assurance has primarily been concentrated around Statoil's two large development projects, block 34/10 and Statpipe.
The company system for quality assurance has in that connect.ion been put into use and further developed. The aim of this system is to achieve a satisfactory safety and quality assurance in all parts of the
company activities. The company contingency for accidents
has been further developed and several contingency drills have been conducted. Statoil is engaged in research and development projects aimed at reducing the possibilities for blow-outs.
Organization and environment Wage and labour relation
Labour relations on the Norwegian shelf have so far been complicated. The cooperation between the employers who have employees at work on the Norwegian continental shelf has been limited. In 1981 there have been several wild cat strikes on the production platforms and the mobile rigs.
Statoil will continue the work of strengthening the cooperation between the operating companies through the Norwegian Employers' Association for Operating Companies (NOAF). NOAF is member of the Norwegian Employers' Confederation (NAF). From 1982 NAF/NOAF will enter as agreement partners in all agreements between the operator companies and the employee organizations on the Norwegian shelf. These agreements must be based on the regulations which are valid between the main Norwegian trade unions.
In 1981 Statoil has had good cooperation with the four employee organizations, the Norwegian Society of Chartered Engineers (NIF), the Norwegian Oil and Petrochemical Trade Union (NOPEF), the Norwegian Society of Engineers (NITO), and the Norwegian Office Workers' Association (NF) which are represented in the company.
Employees and work environment At the end of 1981 there was a total of
2 645 employed in the consolidated companies. The number of employees iJl
Statoil was 1 362. Statoil has further developed its internal
training. A number of courses within petroleum related subjects and administration have been arranged. As part of the training activities, Statoil has continued the assignment of personnel with other oil companies. A separate grant system has been established for further education of female employees, trying to get more women in higher positions.
The company and work environment committees have had many meetings. A number of cases have been dealt with. The most important ones have been the change of Statoil's main organization and the construction of new office premises.
TI1e Board wishes to thank all employees for the valuable effort and good cooperation throughout 1981.
Organization development Based on among other things the
operator tasks for development and
15

operation of block 34/ 10 and Statpipe, Statoil has further developed its organization. The Executive Committee consists of five people and the company has now four divisions each with their separate result responsibilities. The four divisions are Technology and Development, Exploration and Production, TransPortation, Refining and Marketing.
The plan for Statoil's organization is found on page 2.
East field in block 34/ 10. Statoil has earlier purchased real estate near Hergen Airport, Aesland. Early in 1982, the company will start constructing an office building with office accomodation for slightly more than 700 employees. Offices are scheduled to be ready for occupancy at the beginning of 1985.
ln 1981 Statoil employees in H arstad have moved into new, rented office facilities. Efforts are being made to acquire a
Sea, south of the 62nd parallel. Stage two of the headquarters at Forus is
on Scheduleaud the moving startedat the end of 1981. The construction of the technical service-building at Forus has started. The hnilding will he ready at the end of 1983.
Economy T he accounts for 1981
HM Queen Elizabeth II and HRH the Duke of Edinburgh visited Statoil in May 1981. Statoil's President Arvc Johnsen explains.
The accounts for the consolidated companies, which include Statoil, Norsk Olje and Rafinor, show sales of NOK 13 499 in 1981. Of this NOK 7 495 million was export.
Statoil's sales in 1981 were NOK 11 547 million. This was an increase of 62 per cent compared to the previous year.
The consolidated companies' operating result was NOK 3 839 million in 1981. The annual profit was NOK 1 019 million after deduction of minority interests.
Statoil's accounts show an annual profit of NOK 1 052 million. The accumulated deficit from earlier years is thereby fullycovered.
The Board proposes that the year's net profit is disposed in the following manner: Loss carried forward .. NOK 540 million l<.eserve fund ........ NOK 125 million 12.5 per cent dividend . NOK 368 million Carried forward . . . . . NOK 19 million
NOK I 052 million
In 1981 remuneration to the Board was NOK 99400 and to the Company Assembly NOK 49775. Salary and other compensation to the president was NOK
1 451 855. The consolidated companies invested altogether NOK 3 091 million in 1981, of which Statoil's own investment was NOK 2 953 million. The investments in the Statfjord field were still the major part of the company's total investment with a share of 70 per cent. Reference is made to the accounts with
comments.
Financing The international interest and currency
development in 1981 was strongly marked by the continued low economic growth within OECD plus the American authorities' strict monetary and credit policy.
The Statoil office in Beijing(Peking) wasopened on 22 June 1981 in thepresence of among others Vice Minister Qin Wen-Chai in the middle of the
picture. Vice President Jakob Bleie, Statoil , is second from the right.
The strict monetary policy in Lhe USA Jed to an abnormally high interest level on the dollar. As a consequence of among other things the high interest level , the value of the dollar has increased considerably compared to most European currencies in 1981. Compared to Norwegian kroner the dollar increased from about 5. 13 at the end of the year to about 6.30 in August,a rise of nearly 23 per ceni. By the end of the year 1981, the exchange rate had decreased to about 5.82.
Premises of the activity Statoil has continued the decentrali
zation by moving some of its operative functions out of Stavanger.
One department with the responsibility for exploration activities on the shelf off themiddlepart of Norway has been moved from Stavanger to Bergen.
In 1982 a separate organization related to the Exploration and Production Division will be established in Bergen. This organization will, among other things, be responsible for the operation of the Delta
16
site for the building of a permanent administration centre in the area.
The company has established a district office in Trondheim. The primary task of this office is to coordinate research anti development projects carried out by the research institutions in Trondheim. In addition, a project office in London and an office for advisory services in Peking, have been established.
All headquarters functions will still be in Stavanger. The same applies to Statoil's operative functions related to the North
The most important European countries found it necessary to keep a high rate of interest throughout the whole year, owning to a deficit in their current accounts, a weakened currency development compared to the dollar and high dollar interest rates.

The Rllfinor plant at Mongstad.
The Statoil headquarters in Stavanger.
The company's interest expenses in 1981 was about NOK 995 million. This gives an average interest rate of 11.5 per cent annually.
The largest part of Statoil's currency debt is in dollars. The repayment of these loans will mainly take place during the period 1983-1989. As a consequence of the exchange increase of dollar in 1981, NOK 414 million are set aside to cover unrealized
The free-fall lifeboat is tested. The Dyvi Delta, which is drilling for Statoil, is the world's fi rst drilling rig with this emergency system.
currency losses on lpng-term debt. The high dollar exchange rate gives
increased krone incomes on the petroleum sale. On the whole a strong dollar is advantageous to the company.
Statoil's total need of capital in 1981 was NOK 3051 million. Of this NOK 2710 million came from the operation. Payment on long-term debts was NOK 957 million.
17

In 1981 the company established itself as a borrower on still another important international market, through the placement of a private bond issue in Japan of JPY 10 billion, corresponding to NOK 254 million. The loan has a final maturity of 15 years and the interest rate is 8.7 per cent annually. In 1981 export credits were established in connection with supplies to Statfjord C and North East Frigg.
Prospects The new development projects, block
34/ 10, Statpipe and Heimdal will be of key importance in the consolidated companies' activities in the years to come and will lay the foundation for increased income and considerable net profit for several decades. In the first few years the consolidated
The Statoil Board of Directors visit the Statfjord A and look at the activities on the deck.
companies' total investments will amount to between NOK 7-10 billion yearly.
In 1982 Statoil expects a continued increase in income and operating result, mainly as a consequence of the planned production development of Statfjord A. The consolidated companies' refinery activity is expected to give a positive operating result in 1982. For Statoil's engagement in the petrochemical activity at Bamble, a negative result is still expected. The Board is concerned with finding solutions which will improve the profitability of this activity.
Previous years' accumulated deficit has so far been deducted before taxes. This deficit is now fully covered. Taxes will thus be higher in 1982. The consolidated companies' net income after taxes will consequently be lower than in 1981.
Stavanger, 1March 1982
TI1e Board of Den norske stats oljeselskap a.s
Oil and gas resources on the Norwegian continental shelf south of the 62nd parallel (Statoi l estimate).
Gas resources
Oil resources
M.t.o.e.
Total recoverable Resources which will resources be developed
18
Finn Lied Chairman
Ole Myrvoll Vice-Chairman
'f4 tl..ck~- ~r--.c.. :7 07 ~p0>7,,._,-Tho1 Andreassen Trond Bolstad Erling Haug Einar H. Moxnes
~&~ Kirsti Lange

The consolidated profit and loss statement for 1981 Amounts in millions of NOK
Operating revenue
Sales ..... .. . . . . . . ....... ..... . .. ...... ..... (1) Other revenues .. . . ...... ... . .. . .... .... . .. . . . (2)
Revenue ............. • ... . ...... . .............
Operating costs Direct costs .... ....... . ... .. . ....... . . ... . . . .. . Salaries and social costs . . . ... ...... .......... . . . Other costs . ..... ....... .... . . .. . ......... ... (3) Deprec iation ..... ........ . .. .... .. . . .. . . .... .. . Loss on receivables ... . .... . . ....... . . .. .. . . . .. . Change in inventories . .. .. ... .................. .
Operating costs ....... . . .. • . .......... ... ......
Operating result ....... . . . . .. . . .. ... .. . ....... . .
Financial Income and financial costs Dividends received ... . . .. . ......... .... ....... (4) Interest income and other financial income . ... . ..... . Interest to consolidated companies ..... . . . .... . ... . Interest from consolidated companies . . . . . . . . . .. . . . Interest and other financial costs ....... .... .. (5) (17)
Net financial costs . ..... .
Result before extraordinary items.... . . ......... .. .
Extraordinary income and costs Extraordinary income . . . . . ...... . ....... .. ... . .. . Extraordinary costs . . ......... .. . .. . . . ..... ... (6) Cost of share capi tal increase ....... .......... .. . .
Net extraordinary items .. .... ...... ........... .. .
Result before year end adjustments .... ......... . .. .
Year end adjustments Provision for tax depreciation .. . . .. ....... . ..... (7) Taxation ..... . . . . . . .... . . ..... . ..... .... . . ... . Adjustment ot price-tall risk in inventories ....... .... .
Total year end adjustments . . . . . ... . ... ..... . . ... .
Net income .......... . ......... . .. .. .......... .
Minority interest share . ................. ... . .. . (8)
Consolidated companies' share .... . ... . . . .. . . . . (9)
The consolidated companies
1981 13 499
182
13681
4942 471
3495 679
13 242
9842
3839
92 219
2045
1 734
2105
3 175
- 172
1933
540 352
892
1 041
22
1 019
1980 8593
126
8 719
4 543 347
2133 489
11 -267
7 256
1 463
78 140
874
656 807
11 3 2
6
813
616
617
196
-7 203
1981 11 547
46 11 593
4 769 250
2 305 531
59
7914
3679
92 181
3
1835
1 565
2 114
1 165
-164 1950
548 350
898
1 052
Statoil
1980 7125
26 7 151
4119 157
1 272 352
-141
5 759
1 392
77 119
6 750
548
844
4
4
848
624
625
223
19

Consolidated balance sheet as of 31 December 1981 Amounts in millions of NOK
Assets CURRENT ASSETS
Cash and short-term deposits Cash and short-term deposits ......... .... . .. .. (10)
Short-term receivables Shares ............................. . ........ . Bills of exchange ..................... ......... . Interest earned, not due .................... .... . . Accounts receivable ......... . ..... .......... ... . Receivables of subsidiaries .............. . ....... . Other short-term receivables ................... {1 1)
Inventories Raw materials ...................... .......... . Products for sale .............................. .
Total current assets ............................ .
INVESTMENT CAPITAL
Long-term receivables and investments Shares in subsidiaries ..................... (12) (13) Shares In other companies ................... . (14) Long-term receivables ........ . ................. .
Fixed assets (15) Offshore Facilities in production ......................... . Construction in progress, etc ..................... . Ships ............................ ....... ..... .
Onshore Furniture, equipment, etc .... . ................... . Plants . . ............. ..... ................... . Plants under construction ....................... . Real estate .... . ......... . .. ... ............ . .. .
Total investment capital
Total assets ...... . .... ... .... .. . ... . ... . ..... .
Finn Lied Chairman
20
The consolidated companies
1981
258
4
5 1 317
481
138 646
2 849
488 75
3628 6 237
85
107 2 041
51 317
13 029
15 878
1980
74
4 2 1
1 562
287
356 833
3 119
489 56
4 275 3 853
92
89 2 332
64 224
11 474
14 593
Ole Myrvoll Vice-Chariman
1981
41
2 614 452 516
138 281
2 044
295 486 37
3 628 6 237
98 1 110
32 255
12 178
14 222
Statoil
Thor Andreassen
1980
52
1 918 414 275
353 339
2 352
295 486
18
4 275 3 853
79 1 389
48 157
.10 600
12 952
Stavanger/Oslo,
Trond Bolstad

The consolidated companies Statoil
1981 1980 1981 1980
Liabilities and shareholder's equity
Current liabilities Short-term bank credits . ... . .. .. ....... . . . ... . ... 78 23 1 1 Provisions for taxation ... . . . .. . . ... .............. 353 313 121 123 Interest incurred, not due ... .. . . . . . ............... 121 108 111 97 Suppliers ............ .. . . .. .. ................. 995 1 389 906 1 318 Dept to subsidiaries . .. ....... ... ...... . . . ....... 29 19 Estimated taxes ... . .... . .... . . . ... . ......... . . . 150 149 Other short-term debt ...... ... . . . ... .. . . ... . . . . .. 1 644 1 075 1 444 783 Next year's installment on long-term liabilities ........ 407 208 303 106 Total current liabilities .... .... ... .. .. . . ... ....... 3 748 3 116 3 064 2 447
Long-term debt (16) Export credits .. ..... ........ . .. . . . . .. . . . .. . . . 444 199 436 191 Bank loans . . . . . . ... .. ... . ......... . .. . . . .. . . . . 3 468 4 508 2 892 3969 Bonds and notes outstanding ........ . . ... ... ... . . 2 222 1 986 2 137 1 891 Loans from the Norwegian state .... . . . .. .. . ....... 2 102 2132 2 022 2 052 Currency risk fund . . ............ .. .. .. .... . .. (17) 504 75 477 63 Other long-term debt ........ .. .... . .......... (18) 200 208 30 30 Loan capital liable . .. .. .. . .. ............... ..... 98 119 Next year's installment on long-term liabilities . ..... . . - 407 - 208 - 303 - 106
Total long-termdebt ... . . .. . ......... . . ...... .... 8 631 9 019 7 691 8090
Conditional tax-free allocations Classification fund ... . . . .. . .. . ... . ....... . ...... 1Stock valuation reserve . .... ................... . . 17 17 11 11
Total conditional tax-rree allocations ......... . ... . . 18 18 11 11
Minority interests ... . . . ........ . .. . . .. . ... . .. . . . 145 123
Shareholder's equity Compulsoryshareholder's equity Share capital: 29 435 OOO shares at NOK 100 each .. . .. 2 944 2 944 2944 2944
Free shareholder's equity Accumulated loss as of 1 Jan. 627 830 540 763 Net income . .. .. . . ..... .............. . ... . ... . . 1 019 203 1 052 223
Total shareholder's equity ................. . ...... 3 336 2 317 3 456 2 404
Total liabilities and shareholder's equity ........ .. . . 15 878 14 593 14 222 12 952
Contingent liabilities, joint and several liability,etc ........ . ..... . ...... .. .......... (19) 244 183 207 139
1 March 1982
Erling Haug Einar H . Moxnes Kirsti Lange
Arve Johnsen President
21

Comments to fmancial statements The consolidated financial statements are founded on the same accounting principles as are applied to the parent company. In addition to Statoil, the consolidated financial statements include Norsk Olje a.s, where Statoil has a 73.62 percent share, Raflnor AJS where Statoll and Norsk Olje a.s together own 70 percent, and the limited partnership company Rafinor AJS & Co. where the consolidated companie:; uw11 a total ur 164/230.
From 1981 on the Statoil accounting principles have been altered on the following points: • Treatment of Interest and other financial expenses • Treatment of exploration expenses • Calculation of ordinary depreciation on offshore installations
A more detailed description is found under accounting principles below. In order to arrive at comparable figures, the 1980 figures have been altered accordingly. Beside:;, the numerical effect i:; indicated in notes to financial statements.
Accounting principles The following items are charged to the profit and loss account • Expenditures for research, special studies and development projects. • Interests and other financial expenditures. Interests concerning development projects were earlier capitalized up to
the moment of production start-up. • Expenditures concerning licences in the exploration phase. These expenditures were earlier c.apitali7ed unless
the existence of commercial deposits had not been positively indicated.
The following items are capitalized and subject to later depreciation • Expenditures related to commercial fields where Statoil has exercised its option to participate in field
development.
Depreciation Ordinary depreciation on offshore production facilities is in accordance with the unit of production method. According to this method the annual ordinary depreciation percentage appears as the relation between the rlnnual production amount and the estimated, total recoverable reserves of the field. Further depreciation based on the maximum rate according to the Norwegian Petroleum Revenue Tax Act is found under year end adjustments in the consolidated profit and loss statement and under provision for tax depreciation in the consolidated balance sheet. Earlier, depreciation calculated in accordance with the Norwegian Petroleum Revenue Tax Act. was considered ordinary depreciation and charged to the operating result. Fixed assets onshore are depreciated according to rates recommended by Norwegian tax authorities. Provision for tax depreciation of these assets is booked in the same manner as offshore facilities.
Conversion principles for foreign currency Items in foreign currency are converted into Norwegian kroner (NOK) according to the following principles: • Revenues and expenditures are converted into Norwegian kroner (NOK) according to the prevailing exchange rate at
the time of payment. • Current assets and current liabilities are converted at the rate of exchange prevailing as of 31 December • Fixed assets are entered at the prevailing exchange rate at the time of procurement. • Long-term debts are converted at the exchange rates prevail ing when the loans were drawn. If Lile debt
calculated according to the rates of exchange for all currencies as of 31 December, is higher than the comparable booked debt, a provision is made for an amount equal to the difference, and at the same time the amount is expensed as a financial cost. Realized currency losses are charged under financial costs to the extent they are not covered by previous provisions. Currency gains are charged as income only when such gains are realized in connection with payment of debt.
Partnerships and limited partnerships Statoll's shares in partnerships and limited partnerships are included in the respective items in the statement of profit and loss and in the balance sheet.
In the limited partnerships in which Statoil participates, the partners, according to existing accounting agreements, have the right to audit the operators' accounts within two years after the end ot the financial year. Corrections which miyllt IJe Lile consequence of such audits will, In Statoll's accounts, lead to changes in a later year.
Inventories Inventories of crude oil, petroleum products, and equipment are valued at the lower of purchase/production cost or net market price.
Principles used for consolidating companies • Shares in subsidiaries are eliminated using the past equity method. Possible surplus value which is a result of this
elimination is charged to the corresponding assets and is depreciated accordingly. • Internal current accounts, internal sale, Internal gains, and other Internal transfers are eliminated in the
consolidated balance sheet and the consolidated statement of profit and loss.
22

Notes to financial statements for 1981 1. Sales are distributed as follows (amounts in millions of NOK):
The consolidated companies Statoil 1981 1980 1981 1980 --
Norway Crude oil and gas ............................... 945 249 945 1.232 Refined products ............................... 4.485 3.837 3 431 2.607 Petrochemical products, etc .................. . .... 574 516 219 171 Exports Crude 011 and gas ............................... 5.233 2.644 5 233 2644 Refined products ........... . ................... 1 891 994 1 348 118 Petrochemical products, etc ....................... 371 353 371 353
I 13.499 I 8.593 11.547 I 7.125
2. The item. other revenues refers to rental income, NOK 147 mill ion, sale of drilling equipment, NOK 19 million and sale of seismic data, NOK 16 million. 3. For Statoil the item includes royalty to the state in the amount of NOK 698 million. For the consolidated companies the item also includes NOK 607 million in gasoline tax. Furthermore, exploration costs of NOK 204 mil lion are a part of this item. Based on accounting principles used in previous years, about NOK 133 mill ion of these costs would have been capitalized, and the operating result correspondingly higher.
4. Statoil 's dividends received refers to dividends for the financial year 1980 of NOK 69.5 million from Norpipe a.s and NOK 10.5 million trom Norpipe Petroleum UK Ltd. In addition, advance dividends of NOK 11 .7 million for 1981 from Norplpe Petroleum UK .Ltd. are Included. 5. As uf 1981 a.II inttlrest costs a1e expensed. II the interest on development projects had been capitalized in accordance with previously used principles, about NOK 720 million would have been capitalized, and the result before extraordinary posts correspondingly higher.
6. In Statoil, extraordinary costs apply to charging of booked value for previously capitalized immaterial property in l/S Norpolefin of NOK 129 million. Besides, the item includes previously capitalized exploration expenditure for fields not yet declared commercial. In accordance with new accounting principles for treatment of exploration costs, these are now expensed.
7. Provision for tax depreciation is distributed over the offshore production facilities as follows (see also note 15): Statfjord .. . ................................................................................ NOK '179 mill. Murchison . . . . . . . . . . . . . . . . . . . . . . . . . . . . . . . . . . . . . . . . . . . . . . . . . . . . ............... ....... ..... NOK 41 mill. Frigg ......................................... . ............................................ NOK 28 mill.
Total Statoil ..................... . ............. ...... ........... ... . . .. . . .. . ... .... . ..... ... NOK 548 mill. Norsk Olje ::i.s (rP.t11rn) ...... . . ......... ... . ......... .... ............. . .................... . . - NOK 8 mill.
The consolidated companies ...................... ........ ... .... ........... • ................. NOK 540 mill.
8. This item refers to the following minority interest shares: 26,38% of the income of NOK 81.0 million in Norsk Olje a.s ................. ................. ... . . ... NOK 21.4 mill. 40,55% of the income of NOK 1.3 million in Rafi nor A/S .... ........ . • . • .................... •. .... ... NOK 0.5 mill.
NOK 21.9 mill.
9. The consolidated profit and loss statement of 1981 consists of the following (in millions of NOK):
Statoll net Income .......... . .......... . . ... ... . 1 052 Norsk Olje a.s net income ............ . .......... . 81 Rafinor AJS net income ......................... . 1
Clla11ye in unrealiLed internal income on inventories .. . -86 Depreciation of surplus value in subsidiaries ........ . 7
Minority interest share .......................... .
consolidated companies· share .............. .... .
1981 1980
1 134
93
1 041 22
1 019
223 -29
1
8 7
195
196 - 7
203
10. Short-term deposits in Norwegian kroner include a total of NOK 12 million of withheld employee income tax, payable to the tax authorities. The comparable amount of the consolidated companies is NOK 21 million.
Slatoil's short-term deposits are distributed as follows:
Amounts in millions Currency Exchange I NOK deposit rate
Deutsche marks (DEM) ........................ .. . 1.1 257.65 2.9 U.S. dollar (USO) .... . . ................ . . ....... . 0.4 5.7835 2.5 Pound sterling (GBP) ........... . .. . .. . . . ...... . . 0.1 11. 11 5 1.2 Finnish marks (FIM) .... ............... . ... . . .. . . 0.8 133.05 1.0 Norwegian kroner (NOK) ....................... . . 21.0
28.6 I
23

11. Other short-term receivables for Statoil include NOK 5.0 million in short-term financing related to sale of houses to employees.
12. Shares in subsidiaries consist of the following items (amounts in 1000 NOK):
Book Par Number Ownership Total company value value of shares interest share capital
Norsk Olje a.s .... . .... . . . .... . ... . 291 !:>OU 213 500 213 500 73,62% 290 OOO Rafinor A/S ...... ......... ........ 3 OOO 3 OOO 3 OOO 30% 10 OOO
294 500 216 500
13. In the consolidated balance sheet, the surplus value from the purchase of shares in Norsk Olje a.s., totall ing NOK 110.8 million, is distributed among the assets it is expected to affect, and it is depreciated accordingly. See principles of consolidation.
14. The distribution of shares is as follows (amounts in 1000 NOK and GBP):
Book Par Number Ownership Total company value value of shares interest share capital
Norpipe a.s . . ....... .... ....... • .. 390 OOO 390 OOO 3 900 OOO 50% 780 OOO Coast Center Base A/S .......... . .. 27• 27 110 50% 55 Statfjord Transport a.s . .... . ... • ... . 420 420 840 932 42.04% 1 OOO Vestbase a.s ............ . _ ... . .... 160 160 160 40% 400 Norbase a.s ... ........... . . . .. ... 200 200 200 50% 400 Norpipe Petroleum UK Limited ....... 95 751 £6 250 6 250 OOO 50% £12 500 Norpolefin (UK) Limited .......... .. . 35 £3 3 333 33%% £ 10
486 593 The shares are recorded at cost. The subsidiary, Norsk Olje a.s owns shares in other companies amounting to a total booked value of NOK 6 million of whic:h NOK 4 mill ion is included under current assets. The consolidated companies' total booked value of shares amounts to NOK 492 million.
15. Specification of fixed assets (in millions of NOK):
Investment Additions Disposed Accumulated Book value as of during of during depreciation as as of
1 Jan. 81. the year the year · of 31 Dec. 81 31 Dec. 81.
Statoil Offshore Facil ities in production . . ... . ... .. .. 5 379 238 1 989 3 628 Construction in progress, etc ... . .. ... 3 853 2 460 40 36 6 237
Onshore Furniture, equipment etc . ........... 113 37 52 98 Plants ............... . ... . ...... . 1 849 23 1 761 1 110 Plants under construction ... .. .. . . . . 48 76 92 32 Real estate .................... . .. 166 119 17 13 255
11 408 2 953 150 2 851 11 360
The consolidated companies Offshore Facilities in production ... . ...... .. . 5 379 238 1 989 3 628 Construction in progress .... . ....... 3 853 2 460 40 36 6 237 Ships ....... . .... . . .............. 124 3 42 85
Onshore Furniture, equipment, etc ........... . 180 42 3 112 107 Plants ........... . ............... 3 637 145 9 1 732 2 041 Plants under construction ......... . _ 67 84 96 4 51 Real estate . . ..................... 234 119 18 18 317
13 474 3 091 166 3 933 12 466
Provision for tax depreciation is NOK 1307 mi llion of the accumulated depreciation in Statoil. The corresponding figure for the consolidated companies is NOK 1368 (see also note 7).
24
I

Investments distributed by year (in mi llions of NOK):
1977 1978 1979 1980 1981 Total invest· ments as of
31 Dec. 81 and
before
Statoil Offshore Facilities in production ........ 428 89 4 164 698 238 5 617 Construc tion in progress ....... 2 331 1 564 - 1 678 1 636 2 420 6 273
Onshore Furniture. equipment etc ....... 32 17 40 23 37 149 Plants . .. . ... .......... . .... 530 577 685 58 22 1 872 Plants under construc tion ...... 961 - 229 -598 - 86 - 16 32 Real estate ... .. ... .. . .. ..... 28 1 5 132 102 268
4310 2 019 2 618 2 461 2 803 14 211
The consolidated companies As of 1 Jan. 80 Offshore Facilities in production . . ... . . . 4 601 690 230 5 617 Construction in progress etc . . .. 2 217 1 636 2 420 6 273 Ships .. . .. . . . ........ . ...... 105 19 3 127
Onshore Furniture, equipment etc . . ..... 155 25 39 219 Plants .. . . ............ .. . .. . 3 430 207 136 3 773 Plants under construction ...... 171 - 104 - 12 55 Real estate ...... .. . . . . ... . .. 109 125 101 335
lU 868 2 606 2 \:l25 I 16 399
The book value of the above mentioned fixed assets is distributed by project as fo llows (amounts in millions of NOK):
Ownership Net book Addit ions Depre· Book value interest value as of in 1981 ciation as of
in per cent 1 Jan. 1981 in 1981 31 Dec. 1981
Offshore activi ties Statfjord ................. . .... .. . 42.04661 6 808 2 079 714 8 173 Frigg . . ....................... . .. 3.041 339 23 92 270 Murchison . . ............. ....... . 8.125 445 23 79 389 Heimdal ..... ......... . .. .... . .. . 40.000 68 16 84 North East FriQQ ......... . . .... . ... 3.000 1 9 10 Ula ..... ... . ... . .. ·" ........ . . . .. 12.500 11 34 45 Production licence 050 .. . ... . ... . .. 85.000 420 349 769 Production licence 0!:>2 •••• • •• ' j ' •••• 50.000 4 4 Production licence 053 ..... J .. ..... 50.000 13 13 Product ion licence 054 . . . . "\ .1.-~\ ... . 50.000 9 9 Production licence 057 ..... .. ...... 50.000 10 10 Statpipe . . . .. . ....... . ....... . .. . 60.000 125 1?5
Onshore Activities Rafi nor ...... . ... . ....... . ...... . 30 377 16 42 351 Noretyl .. . . ... ................ . . . 33 450 11 62 399 Norpolefin ......... .. .... . . . .. . . . 33 '13 528 4 195 337 AJS Coast Center Base ............. 50 24 I 1 24 Other . .. . ..... . .. . ....... . ... . .. . 100 294 113 23 384
9 801 2 803 1 244 11 360
Depreciation is expensed as ordinary depreciation· NOK 531 million, extraordinary costs· NOK 165 million (see note 6) and under year end adjustments . NOK 548 million (see note 7).
25

16. The long-term debt of the consolidated companies is distributed by currencies as follows:
in millions
U.S. dollar (USD) ............ .. ............... . Deutschemark (DEM) ......................... . Swiss franc (CHF) ........................... . Pound sterling (GBP) ..... .... . ... . .. . .... .... . French franc (FRF) .. . .. .. . .. . ... .. .. . ... . .... . Japanese yen (JPY) .......... . .. . ...... .. .... . Currency risk fund (NOK) . ... .. ............. . . . Norwegian kroner .................... . ...... . Next year's installment on long-term liabilit ies ... .
Currency value
722.4 347.9 150.5 21.5 83.7
10 000.0
Average rate of exchange
5.1635 266.561 299.105 10.571
110.449 2.542
Book value in NOK
3 729 927 449 228
93 254 504
2 853 - 407
I 8630
Of the subsidiaries' domestic long term debt, NOK 25 million is obtained by using as security vessels with a booked value of NOK 82 million, and NOK 275 million is obtained by using as security installations, real estate, and housing with a booked value of NOK 822 million.
17. In 1980 the Statoil currency risk fund has been increased by NOK 414 million to cover the currency loss which would have occurred if the total debt had been repaid at the exchange rates of 31 December 1981. The amount is charged to the profit and loss statement.
I
18. Other long-term Statoil debts include financing which the partners in the Heimdal f ield have carried tor Statoil, and which includes the costs incurred prior to the option being exercised. The debt will be repaid by credit ing to the partners future income from sales from Heimdal. If the debt is not repaid by the time the production licence expires, the outstanding debt will be cancelled. Statoil has the option of prepaying the debt. 19. Together with the other partners in llS Noretyl and llS Norpolefin, Statoil has a joint and several liability for the debt incurred in the name of the partnerships. This is mainly accounts payable in the amount of about NOK 207 million.
The consolidated companies are responsible for guarantees to employees and customers for a total of NOK 37 million.
The consolidated companies have an uncovered obligation for pension in connection with early retirement and a pension age of 65 years for certain groups of employees. Liability and insurance In connection wilh the activities on the continental shelf, including transportation systems, Statoil has, like all other licensees, an unlimited liability for possible claims for damages. The company has taken out insurance for this liability for damages up to a total of approximately NOK 570 million for each incident. Statoil has a principle tt1at it insures company assets at their estimated replacement value. Because of a lack of capaci ty on the insurance market, this has not been possible for the Statfjord A platform. However, the insured amount is higher than the net book value of the platform. Charter agreements Statoil has signed charter agreements for a total of four drilling rigs. Charter periods vary from three to eight years. Furthermore, Statoil has chartered six supply vessels and four stand-by vessels to service these rigs. Statoil has a contract for seismic data collection over the period 1982-1986. As partner in a partnership, Statoil, together with the other partners, is responsible for agreements signed by the partnership.
Operating result for the consolidated • comparues, by area and activity Amounts in millions Operating Operating Ordinary Operating of NOK revenue costs depreciation result
1981 1980 1981 1980 1981 1980 1981 1980 Statfjord .. . ........ 5 203 2 008 1 339 620 235 109 3 629 1 279 Murchison ...... . .. 408 74 100 36 39 8 269 30 Frigg .... . . ........ 404 284 88 81 64 53 252 150 Exploration expenses etc., other licences ... 69 45 551 66 22 13 - 504 - 34 Production of oil and gas .... . .... 6 084 2 41 1 2 078 803 360 183 3 646 1 425 Refining and marketing ........ .. 11 983 7 678 11 596 7 486 191 178 196 14 Petrochemical activities . . . .-.. .... . 561 504 436 352 128 128 -3 24 Internal del iveries ... - 4 947 - 1 874 - 4947 - 1 874 Total ....... . ..... 13 681 8 719 9 163 6 767 679 489 3 839 1 463
26

Source and applications of funds The consolidated companies Statoil
Amounts in millions of NOK 1981 1980 1981 1980 Source of funds: Result before year end adjustments ........ ... . . ... . . 1 933 813 1 950 848 Depreciation ........................... .... .. .. .. 851 489 696 352 Currency risk fund ...................... . ... . ... . . 429 57 414 59 Taxation .............. . ................ . ... . ... . . -352 - 350
Total internal financing ................... . ...... . . 2 861 1 359 2 710 1 259 New long-term loans ............ .. ....... .. ...... . . 416 2 109 341 1 873
TOTAL SOURCE OF FUNDS . . . ........... . ... . . . .. . 3 277 3 468 3 051 3 132
Application of funds: Investment in fixed assets ........ . ........... . ..... 2 946 2 610 2 822 2 465 Repayment of long-term loans ... .. .................. 1 034 825 95( 517 Change in working capital .......................... - 703 33 - 728 150
TOTAL APPLICATION OF FUNDS .... ................ 3 277 3 468 3 051 I 3 132
Specification of change in working capital: Cash and term deposits ............... . ............ 184 - 91 - 11 - 82 Short-term receivables .. ..... . ... . ................. -49 879 - 24 730 Inventories . . . .... ..... ..... ... . ................. -405 449 -273 472 Current liabi lities ........... ... . ....... .. . . .. ... . . - 433 - 1 204 - 420 - 970
Change in working capital . ... .... ............... . .. - 703 33 I - 728 150
Result analysis for the consolidated companies
1981
Net operating margin 28.1 %
Gross profit margin 15.4%
Total rate of return 27.2%
1980
17.0%
9.4%
12.7%
Definition
Operating result
Operating revenue
Result before extraordinary items
Operating revenue
Result before extraordinary items + f inancial costs
Average total capital
27

Value added statement Amounts in millions of NOK The consolidated companies
1981 1980 Operating revenue ............................... . 13 681 8 719 ... purchased goods and services used .............. . 7 343 5 520 - gross value added from own activities ............ . 6 338 3 199 + ordinary depreciation .............. .... ...... . . . 679 489
= net value added from own activities .......... ..... . 5 659 2 710 financial income ......... . .................... . 311 218 net extraordinary items ............ ......... .... . - 172 6
= value added for distribution from own activities ..... . 5 798 2 934
= total value added for distribution .... ........ ..... . 5 798 2 934
Which is distributed as fo llows:
EMPLOYEES Gross salaries and social benefits ...... ............ . 471 8.1% 347 11.8% (including income tax) ........ ........ ............ . (127) (101) LENDERS Financial costs (currency risk fund not included) ....... . 1 616 27.9% 815 27.8% STATE, MUNICIPALITY Royalties, taxes and gasoline tax, etc ....... ......... . 1 701 29.3% 900 30.7% THE COMPANY Withheld for future value added (this year's net income, tax depreciation and currency risk fund) ........... ... . 2 010 34.7% 872 29.7%
Total value added for distribution ................... . 5 798 100% 2 934 100%
Current cost accounting Al tinie:; wllen there is a strong inflation, traditional financial accounts with costs based on historical purchase value do not provide satisfactory information about the development of a company's profitability and financial slantli11y. Ttte current cost accounts below are prepared according to the British Statement of Standard Accounting Practice (SSAP 16). In short, the method measures the costs (costs of goods sold and depreciation) based on replacement value. The resulting corrections are adjusted for financinQ in foreign currencies because the debt is nominally fixed and independent of inflation. In the balance sheet fixed assets and inventories are adjusted to replacement value. These adjustments appear as an individual item· cost reserve · under shareholder's equity in the balance sheet below. The adjustments which are included i11 Ll1e µrufit 1::1nd lu:;:; statement below, are called realized cost reserves, and the corrections in the balance sheet, unreal ized cost reserves. The table below is based on Statoil's ordinary operating result (in millions of NOK):
Current cost profit and loss account for 1981
1981 1980 Historical cost operating result ... ............. ..... . 3 679 1 392 Current cost adjustments: Depreciation ................................... (1) - 261 - 106 Costs of goods ................................. (2) - 24 - 40 Monetary working capi tal .. .. . ........... ....... . (3) -4 - 289 23 - 123
Current cost operating result ... ...... .... .... ...... . 3 390 1 269 Net lin1::1ncial costs ............................... . 1 565 548 Gearing adjustment .............................. . 159 75
Result before extraordinary items ................... . 1 984 796 Extraordinary items ......................... ..... . -164 4 Taxation .......... .......... ................... . - 350 Movement in deferred taxation ........ ......... ... (4) - 465 - 530
Current cost net income attributable to the shareholder (5) 1 005 270
28

Current cost balance sheet as of 31 Dec. 81. 1981 1980
Assets: Cash and short-term deposits ... . .... ... . .......... . 41 52 Shon-term receivables ... .. .. . .. .................. . 1 584 1 608 Inventories .. .. .. . . .. .... . . ..... ................ . 445 697 Long-term receivables .. .. . .. . ... ................. . 818 799 Fixed assets . ...................... .. . . . ...... .. . 16 723 13 256
Total assets . ..... . ........... . . .. ... .. .. .. .. .... . 19 611 16 412
Liabili ties and shareholder's equity: Current liabilities .. . .. .. .... .. . .. . ... . . .. . . . ..... . 3064 2 447 Long-term debt . . . . .. ................ .... . . . . .... . 7 691 8 090 Deferred taxation .......... .. . .................. (4) 1 110 645 Shareholder's equity as of 1 Jan . .. .. . ...... . ... .. ... . 2 430 2 160 Net income ........... .. . . . ... .. ... ... . ... . ..... . 1 005 3 435 _ml 2 430 Cost reserve . . . . . . . . . . . . . . . . . . . . . . . . . . . . . . . . . . . (5) 4 311 2 800
Total liabili t ies and shareholder's equity . ........ . . . . . 19 611 16 412
Notes: 1. The calculation of replacement cost of fixed assets is based on price indexes for offshore and onshore installations,
respectively. Indexes are based on relevant price indexes for groups of investments in the national financial statement.
2. The cost of goods for certain product groups is adjusted to the replacement value at the time of sale.
3. The monetary working capital adjustment (customer claims-supplier debt) are linked to the prices of the product groups.
4. Realizat ion of fixed assets at values recorded in the current cost balance sheet would have resulted in a tax rP.sponsibili ty of about NOK 1110 million per 31 Dec. 1981. The responsibility occurs as a consequence of provisional tax depreciation booked in the company's financial accounts.
5. Corresponds to net income sufficient to maintain the company's funds in real terms.
6. Specification of cost reserve:
Unrealized: Revaluation of fixed assets .... . ... .. .. . ............ . Revaluation for stocks
Realized: Depreciat ion adjustments . .. ..... ...... . . .. . . . .. . . . Cost of sales adjustments ... ... . .. ......... . .. . ... . Monetary working capital adjustment . ... . . .. . . . .... . . Gearing adjustment ...... . .......... . ............ .
Auditor's report for 1981 to the Shareholder of Statoil, Den norske stats oljeselskap a.s
I have audited the accounts for the 1981 fi scal year according to generally accepted auditing standards. I have also audited the accounts for the consolidated companies for 1981.
The annual financial statements for the company and the consolidated companies are in compliance with the Companies Act, and in my opinion present the result of the year and the financial posit ion of the company and the consolidated companies on the basis of generally accepted accounting principles.
The Board's proposal for application of the company's net income complies with the Companies Act.
The statement of profit and loss and the balance sheet submitted for the company and for the consol idated companies may be adopted as the accounts of the company and the consol idated companies for 1981.
Stavanger, 2 March 1982
jd:./. f 1'-h•1 i~d<..:fM,_, Karl-Johan Endresen
Certified Publlc Accountant (Norway)
1981
4 056 26
418 64
- 19 - 234
4 311
1980
2 696 5
157 40
- 23 - 75
2 800
Recommendation from the Company Assembly The recommendation of the Company Assembly to the General Meeting regarding the annual report and accounts for 1981 .
At the meeting on 15 March 1982 the Statoil Company Assembly discussed the annual report and accounts tor 1981 of the Board of Directors for Den norske stats oljeselskap and for the Statoil Group.
The Company Assembly recommends that the General Meeting approve the annual report submitted, and establish the accounts in accordance with the draft made by the Board of Directors.
The Company Assembly approved the recommendation of the Board of Directors that the 1981 net income of NOK 1052 mill ion be used to: cover the loss carried forward, NOK 540 million; allocate to reserve fund, NOK 125 million; pay 12.5 per cent dividend, NOK 368 mill ion; and carry forward, NOK 19 million.
Oslo, 15 March 1982
~~ Egil Aarvik
Chairman, Company Assembly 29

30

ln 1969 the first seismic section profiles over areas in the northern part of the Norwegian shelf were shot. The same year, Norway's first oil field, Ekofisk, was diswvt:rc::d.
In 1980 a few areas on the northern shelf were opened for exploration drilling. A year later Statoil made a considerable gas find in its third well on Troms0fla ket.
It was no coincidence that gas was found in the north such a short time after exploration drilling had started. The background was a conscientious, expensive piece of detective work which was carried out in the years from 1969 to 1981 by geologists, geophysisists and their co-workers.
A large amount of information was collected and grouped. Theories were worked out and tested. Some hypotheses were rejected, others were approved. In the end, the spot was chosen and the final test started - the actual drilling. First condition
The earliest geophysical surveys show that there are large amounts of sedimentary rocks in the northern part of the shelf. Sedimentary rocks are those which consist of weathered material - gravel, sand, clay and so on - which is carried towards the sea and deposited in layers over a long period of time. Only in such rocks is there hope of finding oil and gas.
The surveys, which were made by the Norwegian Petroleum Directorate, NDP, showed that the sediments were thick enough for oil and gas to be generated. It also meant that condition number one for finding oil or gas existed.
This discovery led to extensive seismic surveys. By shooting a closer grid of seismic profiles, it was possible to identify the most interesting areas. The work led to a partition of the shelf into areas, and it was decided that exploration drilling should start on Troms00akt:l aml Haltenbanken. Later, Tnenabanken will also be added.
With the authorities' permission, the StatoiJ company shot a relatively fine seismic grid over Troms0flaket in 1975.
In this way the Statoil geophysisists obtained better
Impermeable shale
Sand grains Gas-filled pores
WatP.r-filled pores
information enabling them to make interpretations and draw maps of the various geological formations in the area.
Finally, in 1977 it was decided that a larger sebmic programme should be started in order to obtain an even more detailed survey of Troms0flaket. This work was done in cooperation hetween St.atoil, 'Norsk Hydro ancf Saga Petroleum.
The thorough interpretations which cou!d be done after this new material had been collected, formed the basis for Statoil's application for new blocks when the area was announced by the Department of Petroleum and Energy in the autumn of 1979. Principles
A basic principle on which all oil exploration is based is that oil and gas are lighter than water and will therefore migrate upwards, displacing water from available pore space.
If oil and gas are to be formed, there must be a source rock, for example shale, in the sedimentary layers. The source rock contains organic material such as dead micro-organisms and plant debris. The source rock must have been exposed to a temperature high enough to start chemical reactions which produce oil or gas from the organic debris.
Oil and gas must be able to migrate from the source rock to a reservoir rock, for instance sandstone which has pores where storage may take place.
Above the reservoir rock there must be a cap rock, this means a rock type which is impermeahle. It must have a shape so as to form a seal over the reservoir rock which hinders oil and gas from migrating further upwards. Thus, oil and gas are caught in a trap. The boundary between the reservoir and cap rock defines the geological structure. Detailed mapping of the structure is vital in oil exploration.
But even if one has managed to find and draw accurate maps over a structure which looks prospective by help of seismic surveys, it is not certain that the reservoir rock contains anything hut water. The trap may have heen formed so late that oil and gas already have escaped, or if the trap was there on time - fissures in the otherwise impermeable cap rock may have created a leak further up.
Geological studies To find out more about the various types of rocks which
were anticipated on the northern shelf, Statoil geologists started studies of areas with corresponding exposed rock types.
The islands Andeya, Bj0rneya and Svalbard are smaller emerged parts of the shelf. There you find sedimentary rock
Section of gas/oil-filled hydrocarbon trap of the type found in 7120/8.
Cap rock
Source rock
5km I
Fault
~ Gas migrating through sandstone due to b11oyanr.y in water
~ Gas migrating from shale to sandstone
Dri llers' depth
31

types which may tell something about what has happened in the area.
But perhaps East Greenland was the most interesting study area even if it today lies 1500 kilometers away from Troms0-flaket. It appears that Greenland for a long time was situated near to Norway. Over long periods the island was probably separated from Northern Europe by a shallow ocean which wa<; only a couple of hundred kilometers wide. Therefore, there was reason to believe that the rock types on Troms0flaket and on East Greenland would show great similarities.
Large amounts of published material on these areas were gathered and all this knowledge was systematized. The picture formed on the basis of this literature fitted well with the seismic interpretation which was done on Troms0flaket.
A geological report was worked out for Troms0flaket based on the seismics and various other surveys. The report concluded by saying that all conditions indicated oil and gas in the area. Both source rock, reservoir rock and promising geological structures seemed to be present. First attempt
In the autumn of 1979 the first blocks north of Stad were announced by the Department of Petroleum and Energy. This applied to six blocks on Hallenbanken and 20 blocks on Troms0flakct. Statoil had its priority ready. On Troms0flaket block 7119/12 was considered the most favourable because it contained several different types of structures and had a favourable position for the trapping of oil and gas. In the spring of 1980 it was decided that Statoil should be operator for block 7119/12 or production licence 060.
The participants of this licence were the following: Scatoil . . . . . . . . . . . . . . . . . . . . . 50% Esso, teclmical assistam ....... 25% Norsk Hydro ........... .. ... lOOJo Saga Petroleum . . . . . . . . . . . . . . 5% Hispanoil . . . . . . . . . . . . . . . . . . 5% Deminex . . . . . . . . . . . . . . . . . . . 5 OJo
The drilling of the first well in the block started on 14 June 1980. The result from the well verified most of what had been predicted, but on one important point the result was disappointing: The oil and gas which probably once had been in the reservoir rock were gone. Apparently, there had been a leak along a fault.
In the autumn of 1980, when the authorities asked the company to update its applications based on the first drillings, it was obvious what main problems existed in the area.
Experiences from the first well indicated that the reservoir sandstone in the area seemed to have a very low porosity. The reason for this could be that the rock had been exposed to a very high pressure and temperature.
The solution lo thh problem was co find a structure where the sand particles in the reservoir rock had been exposed to a somewhat lower pressure and temperature. A shallower structure had to be found. Simultaneously the new structure ought to be large enough to compensate for the fact that the reservoir rock in the area had a relatively low pore volume.
Further it seemed as though the faults in the area leaked rather than helped to seal. The reason could be movements along the fault planes. It should be possible to avoid the problem by studying the seismics in greater detail.
New attempts After a new evalution Statoil reached the conclusion that
block 7120/8 seemed to meet the demand and an updated application for this block was hantletl in.
Early in 1981 production licence 064, block 7120/ 8, was awarded with Statoil as operator. The participants of this licence are: Statoil . . . . . . . . . . . . . . . . . . 50 per cent Esso, technical assistant ..... 25 per cent Norsk Hydro .. ........ . .. 15 per cent Elf Aquitaine Norge . . . . . . . 5 per cent Phillips Petroleum . . . . . . . . . 5 per cent
32
What well 1 on block 7120/8 indicated.
This survey should be read from bottom to top, which wil l give the best understanding of the development.
Dri llers· Pleistocene and Tertiary: 65 million years depth before our time up to the present.
The area is once more transgressed by the ocean and material from glaciers is deposited, among them hard moraines. Ice mountains make deep plowmarks in the seabed. The whole area emerQes above the sea level. Large amounts of sedimentary rocks are eroded and deposited in deeper lying areas, west towards the Norwegian Sea. Greenland is separated from Norway. An unstable period of high volcanic activity. Sediments of ash and cloy.
Cretaceous: 141·65 million years before our time. The sea basin has tree access to other ocean areas. Some clay Is deposited. Repeatedly, the country emerges above the sea level and is eroded by the forces of nature.
The sea basin is opened. Fresh and oxygenated water is introduced. Large amounts of clay are transported into the ocean, and are quickly deposited in thick layers. ln between there are thin layers of limestone, built up of organisms. Tensions in the earth's crust cause intense earthquakes and large fau lts.
Jurassic: 195-141 million years before our time. The continental shelf is flooded by a closed, shallow sea. Organic material is deposited together with clay. The ocean transgresses the shore. Ocean currents transport and deposit sand along the coast. The ocean transgresses low coastal plains. Ttie deposits of clay and sand often interchange. Traces of coal and plant roots can be found in these sediments.
Triassic: 225-195 million years before our time. Large rivers deposit sand on low, argil laceous coastal plains. The ocean transgresses the continent from time to time and deposits material which later turns to shale and limestone.

.. Continuous measurements on oil and gas properties are taken
when a well is tested for production. 33

North Se Basin
East Greenland
This is tiOY(.W~magine the area from Scandinavia to Greenland was a~tlrHO llllon years ago. We do natl know the exact position of the ; nd area In relation to each other, ~ut we do know that the areas re much closer to each oth,i?'than·today with a shallow ocean in between circleS in icat~ 1are'as with rocks of the same age as those in Troms . ""
For various reasons weU numher two wac; drilled ir. biock 71 19/ 12 before the new block was spudded. The hopes to block 71 19/ 12 still remained in spite of suspicion concerning certain shortcomings in a few of the proven structures.
The suspicion was confirmed - the oil which once had filled the pore room in this reservoir had been replaced by salt water. Still another leaking fault had been found.
A positive feature was that the porosity in this sandstone was much higher than in the first well on the block. Experience from well number two indicated that the priority of 7120/8 a.c; a promising block was right.
Now, drilling on the new block could start. Already while the drillbit made its way down through the upper unconsolidated rock types the first positive sign was seen: This time it was not small, shallow gas pockets which were found. In the first block gas pockets had been found is high up as two to three hundred meters under the seabed, gas which had escaped from the reservoir through the leaking faults.
The reservoir was reached after about one month of drilling. This was sandstone, about 170 million years old, deposited in the middle Jurassic period. The excitement was great and therefore the disappointment was even greater among the oil explorers when they could detect no sign of oil or gas in the
34
sandstone. The most pessimistic thought that once again there was an empty reservoir while the optimists pointed at the fact that perhaps the heavy drillmud had pressed possible oil or gas away from the well and therefore, further into the reservoir. More infonnation.
Tu get more information from the reservoir, core drilling was started. Cylinder shaped core samples of a diameter of about ten centimeters and lengths of about 18 meters were taken up. The first of these rock samples showed a few indications that gas was present. After more tests had been taken, the signs started showing: Sandstone reflected flourescent light. This indicated that the stone was covered by a very thin film of oil or gas.
Optimism increased once more. The final answer would be found by logging the well. The 1esistai1ce against electric current between points in the wall of the well had to be measured. In reality it is the resistance of the pore contents which is measured. Least resistance is acQuired if the pores are filled with salt water, slightly higher if the content is fresh water, and even higher if there is oil in the pores and the maximum resistance is found if the pores contain gas.
When the interpretation of the logging was ready, there was no doubt anymore: The reservoir was filled with gas.
Estimates were made to find out how much gas could be expected from the structure, and the result was that the reserves seemed to be considerable. If the find had been made on shallow waters in the North Sea it would probably have been declared commercial just as it was. ln the present situation, additional discoveries are probably needed before the gas field can be developed.
How the field came into existence. The well material shows that the reservoir sandstone had
been deposited mainly as sand bars along a coastline which existed in this area about 170 million years ago. The coa:;tlim: stretched all around the shallow ocean between Greenland and Northern Europe. There are layers of sand deposited by storms and there are bed which are clearly deposited by tidal currents.
There are also traces of life that existed at that time: carbonized tree debris, whole layers of coal, a lot of bioturbation, various types of mollusc, worms and other organisms.
The origin or gas is probably organic material, dead animals and plants, plancton and spores, which have sunk down to the bottom of a closed sea basin. This sea covered most of the Norwegian continental shelf in upper Jurassic. The organic debris was buried together with large amounts of clay particles and hermetically sealed.
The weight of the clay made the whole area subside slowly at the same time as more clay was deposited. When the organic material had been buried deep enough - about 2500 meters -the temperature reached 60 - 70 degrees Centigrade, and this was hot enough for the organic material to start producing gas. The gas migrated from the shale over to the reservoir sandstone and was trapped under the roof of the shale which was overlying the sandstone.
The pore.~ of sandstone are tilled with gas. Most of the sandstone is washed clean by the waves. It contains little clay which can block the microscopic channels between the pores. This means that perhaps you can recover as much as 80 per cent ot: the gas in the reservoir and this would be a very good result.
Conclusion. ·1 he generation and migration of gas took 50 - 60 million
years. A turning poim came in 1981, when the gas flame from the «Ross Rig» for the fi.rst time lit up Troms0flaket. This gas flame introduced the new era in our Northern seas.
We knew that all the conditions were present for oil and gas to he generated and trapped in the~e area~.
The discovery in block 7120/8 is the proof that large amounts of oil and gas really had been generated here. The question is how much is trapped here and in which areas oil and gas are found. Future drilling will give us the answer.

Articles of Association Art. 1
The corporate purpose of Den norske stats oljeselskap a.s is either by itself, or in participation or cooperation with other companies, to carry out exploration, production, transportation, refining and marketing of petroleum and petroleum-derived products, as well as other activities reasonably related thereto.
Art. 2 The registered seat of the Company is in Stavanger.
Art. 3 The share capital of the Company is NOK 2 943 500 OOO divided into 29 435 OOO shares of NOK 100 each.
Art. 4 The Board of Directors of the company shall be composed of seven directors. Five of the directors, including chairman and vice-chairman, are elected by the General Meeting. Two of the directors are elected by and among the employees in accordance with regulations made under provisions of the Companies Act concerning the rights of employees to be represented on the board of directors and in the company assembly of companies limited by shares.
Four alternate directors shall be elected in respect of the two directors elected by and among the employees, and these alternates shaU be summoned in the order in which they are elected. Two alternate directors shall be elected in respect of the other directors, one first alternate and one second alternate. The normal term of office for the directors is two years.
Art. 5 Any two directors jointly may sign for the Company. The Board may grant power of procuration.
Art. 6 The Board shall appoint the Company's President and stipulate his salary.
Art. 7 The company shall have a Company Assembly consisting of 12 members. Members and alternates shall be elected for two years at a time. The General Meeting shall elect eight members and three alternate members for these eight. Four members and alternates for these four are to be elected by and among the employees of the Company in accordance with regulations made under provisions of the Companies Act concerning Lhe rights of employees to be represented on the board of directors and in the company assembly of companies limited by shares.
The Company Assembly elects a chairman and a vice-chairman from among its members.
The Company Assembly shall hold at least twQ meetings annually.
Art. 8 The ordinary General Meeting shall be held each year before the end of June. General Meetings are held in Stavanger or in Oslo. Extraordinary General Meetings shall be summoned whenever so demanded by the Shareholder, the Board, or two members of the Company Assembly.
Art. 9 The ordinary General Meeting shall deal with and decide the following matters:
a) Adoption of the statement of profit and loss and the balance sheet.
b) Application of the annual profit or coverage of loss as shown in the adopted balance sheet, and the declaration of dividends.
c) Adoption of the consolidated statement of profit and loss and the consolidated balance sheet.
d) Any other matters which are referred to the General Meeting by statute or the Articles of Association.
Art. 10 The Board shall submit to the General Meeting, ordinary or extraordinary, all matters which are presumed to involve significant political questions or questions of principle and/or which may have important effects on the nation and its economy.
Such matters shall be deemed to include, inter alia:
a) Plans for the next following year with economic surveys, including plans to cooperate with other companies.
b) Essential changes of such plans as mentioned in a) above.
c) Plans for future activities, including participation in activities of major importance in other companies or joint ventmes in which the Company participates or plans to participate.
d) Matters which seem to necessitate additional appropriation of Government funds.
e) Plans for establishing new types of activity and localization of important elements of the Company's operations.
f) Plans Lo participate in the exploitation of petroleum reserves in or outside Norway, including the exercise of state participation option rights.
g) Semi-annual reports on the Company's activities, including activities of subsidiaries and important joint ventures with other companies.
Matters which the Board submits to the General Meeting pursuant to this Article and, if possible, matters which the Ministry has announced that it wishes to consider at such a General Meeting, shall, if possible, be presented in writing and delivered to the Ministry in good time prior to the General Meeting.
If there has been no opportunity to submit the above-mentioned matters iu advance to the General Meeting, the General Meeting shall promptly be notified of the Board's re~olution.
Whenever possible, matters as mentioned in a) and g) above should be submitted to the Company Assembly for comments.
The General Meeting decides whether to take note of the Board's proposals under this Article, to approve them or to alter them.
Art. 11 The prov1s1ons of the Companies Act shall be supplementary to these Articles of Association.
35

Wells drilled on the Norwegian shelf in 1981
Operator · Block 1 St qtr. 2nd qtr. 3rd qtr .. 4th qtr.
Operated by Statoil
Statoil 34110-11 I I 34110-12 I 34(10-14
34/10 Ross Rig Nordraug Ross Rig
34110-13 .... Deepsea Saga
3013 30/3'2 I
oss• 151!1-7 1519-9 I I 1519-10 II 1519-12
15/9 Nordraug Nordraug Nordraug Nordraug
I 1519-8 I 1519-11 I Nortrym I Ross Rig
15/8 I 15/S.1 Gtomar Bla<:ay II
24/12 24112·2 Dyvl Delta
3016 I 30/S.4 II 30/S.5 I Doepa.ea Soga Deepoea Saga
7119/12 I 7119112°2 Ross Rig
7120/8 7120/S.1 I ROH Rig
Partner operated licences
Norsk Hydro 31/4 3114-4 I I 31/4-5 I Nortrym Nortrym
33/5 I 3315-2 I Nontym
15/2 I 1512·1~ N.'
30/7 30/7·8, 1asi 1 I 30/7-8, l ase II Treeaur:e Seokor Treasure Seeker
7120/12 7120/12·2 I Treasure Seeker
Saga 34/4 I 3414-3 Oyvl Alpha
35/3 3513-4 Byford Dolphin
6507/12 11507/12·2
Byford Dolphin
6507/11 1 8507/11·1 Weal Venture
Elf 3/7 I 317.2
JI 317.3 I Dyvl Alpha Dyvl Alpha
15/3 I 1513-4 es.o.•
25/4 2514-5 I Dyvl Alpha
Shell 31/2 3112-4 II 31/2·5 B D • II 3112-6 ll 31/2·1 B D ·I Amoco
BP
Conoco
Gulf
Es so
Phillips
Es so
D.S.S. * = Deepsea Saga B.D. * = Borgny Dolphin G.B.* = Glomar Biscay II BS.D. = Borgsten Dolphin N. • = Nortrym S.704. • = Sedco 704
36
Borgny Dolphin Test · ·
2/11
34/2 3412-2 II 3412 3 Sedco 703 Sedco 703
I 7/12·5 I Borgot.., Dolphin 7/12
I 7/12-6 Sedco 707
29/6
24/9 2419-3 I Sedco 704
35/8 3518-1 S.704'
25/10 2r.l~0-41 C.B. • l:~.H 25/8 I 2518-3 I G.e.•
Wells in which Statoil has not participated
217
25/11
217-19 I es.o.· ~11-101 25111-11 I I G.e.· I G.e.·
25/1M21t25111-fi3 b.e.· II G.e.·~
e.o.· Test · ·
I 2/11-6 se&:o 703
I
I I 2916-1
Sedco 707
I 3518-2 Sedco 704
25110-5 I G.e. ·

Survey of activities for the consolidated .
compames Activity Company/licence Operator Location The consolidated Type of
companies' share activity
Exploration Prod. licence 038 St a toil Blocks 6/3, 15/11, 15/12 50% Exploration
Prod. licence 044 Statoil Block 1/9 50% Evaluation Prod. licence 045 St a toil Blocks 24/11,
24/12 50% Exploration Prod. licence 046 Statoil Blocks 15/8, 15/9 50% Evaluation Prod. licence 051 Statoil Block 30/2 50% Exploration Prod. licence 052 Staloil Block 30/3 50% Exploration Prod. licence 053 Statoil Block 30/6' 50% Exploration Prod. licence 060 Statoil Block 7119/12 50% Exploration Prod. licence 064 Statoil Block 7120/8 50% Exploration Prod. licence 071 Statoil Block 8/3 50% Exploration
Production and Statfjord Prod. licence 037 Mobil Blocks 33/9, 33/12 50% Oil production Transportation Murchison Prod. licence 037 Conoco Block 33/9 50% Oil production
Frigg Prod. licence 024 Elf Block 25/1 5% Gas production North East Frigg Prod. licence 024 Elf Block 25/1 5% Gas Prod. licence 050 Statoil Block 34/10 85% Oil/gas Ula Prod. licence 019 BP Block 7/12 12.5% Oil/gas Heimdal Prod. licence 036 Elf Block 25/4 40% Gas l/S Statpipe Statoil Karst0 60% Gas transporta
tion system Norpipe a.s Separate adm. Stavanger 50% Pipelines Norpipe Petroleum UK Ltd. Separate adm. Teesside 50% Oil terminal K/S Statfjord Transport a.s & Co. Statoil Stavanger 42.04661 % Transportation
of crude oil
Refining and Rafi nor Separate adm. Mongstad 70% Refinery marketing Norsk Olje a.s Separate adm. Oslo 73.62% Marketing
l/S Noretyl Norsk Hydro Bamble 33% Petrochemicals l/S Norpolefin Saga PetroKjemi Bamble 331/3% Petrochemicals
Service· Coast Center BaseA/S & Co. Separate adm. Sotra 50% Supply base companies Vestbase a.s Separate adm. Kristiansund N 40% Supply base
Norbase a.s Separate adm. I larstad 50% Supply base
•Norsk Hydro operator as from 1 April 1982.
37

Statoil interests in licences allocated as of 1 January 1982 Production licence Statoil share in % Type of Type of and yeor ollocoted Block Operotor Ordinary Maximum agreement• discovery Field
Norwegian continental shelf
005 -1965 7/3 Union 10 Returned in 1981
008 - 1965 18/10, 216 Elf 2 Gye
019A - 1965 7/12 BP 12.5 Oi l/gas Ula
019B -1977 2/1, 7/12 BP 50 72 Oi l
020 -1965 16/8 BP 12.5
022 -1965 213, 3/5 Gulf 11 1
023 -1969 3/7 Elf 5 2
024 -1969 25/1 Elf 5 4 Gas Frigg, NE Frigg
025 -1969 15/3 Elf 6 2 Gas
026 -1969 25/2 Elf 5 2 Gas E Frigg, SE Frigg
027 - 1969 25/8 Es so 17.5 3 Oil Balder
028 -1969 25/10 Es so 17.5 3 Oil Balder
029 -1969 15/6 Es so 17.5 3 Gas/condens. Sleipner
030 -1969 30/10 Es so 17.5 3 Gas Odin, NE Frigg
031 -1969 2/10 Phill ips 17.5 2
032 -1969 2/9 Amoco 10 3
033 -1969 2/11 Amoco 10 3 Oi l/gas Vall hall/Hod
036 - 1971 25/4 Elf 40 4 Gas/condens. Heimdal
037 -1973 33/9, 33/12 Mobil 50 4 Oi l/gas Statfjord/Murchison
038 • 1974 6/3, 15/11 , 15/12 Statoil 50 75 1
039 - 1974 24/9 Conoco 50 75
040 -1974 29/9, 30/7 Norsk Hydro !'iO 66 Gas/condens.
041 - 1974 35/3 Saga 50 70 1 Gas
043 -1976 29/6, 30/4 BP 50 70 1 Gas/condens.
044 -1976 1/9 Statoil 50 75 1 Oil/gas
045 -1976 24/11 , 24/12 Statoil 50 75 5
046 -1976 15/8, 15/9 Statoil 50 75 Gas/condens. Sleipner
047 - 1977 33/2, 33/5 Norsk Hydro 50 66
048 -1977 15/2, 15/5 Norsk Hydro 50 75 Gas/condens.
049 -1977 33/6 Agip 50 70
050 -1978 34/10 Statoil 85 85 5 Oil/gas
051 - 1979 30/2 Statoil 50 75 1
052 -1979 30/3 Statoil 50 75 5 Oil
053 · 1979 30/6 Statoil 50 80 5 Oil/gas
054 - 1979 31/2 Shell 50 75 5 Oil/gas
055 -1979 31/4 Norsk Hydro 50 75 5 Oil
056 -1979 34/2 Amoco 50 75 1
057 -1979 34/4 Saga 50 75 5 Oil
058 - 1979 35/8 Gulf 50 70 1 Gas/oil
059 -1980 6507/12 Saga 50 80 5
060 -1980 7119/12 Statoil 50 80 5
061 -1980 7120/12 Norsk Hydro 50 80 5 Gas
062 - 1981 7607/11 Saga 50 5 Gas
063 -1981 7119/9 Norsk Hydro 50 5
064 -1981 7120/8 Statoil 50 5 Gas
065 -1981 1/3 Elf 50
38

Production licence Statoil share in % and ye~r allocated Block Operator Ordinary Maximum
Norwegian continental shelf
066 - 1981 212 Saga 50
067 - 1981 215 Shell 50
068 - 1981 218, 2/11 Norsk Hydro 50
069 - 1981 7/8 Conoco 50
070 - 1981 7/11 Norsk Hydro 50
071 - 1981 813 Statoil 50
072 - 1981 16/7 Es so 50
Dutch continental shelf
U16- B-1968 K/18, U16 Conoco 7.5
*1) Carried interest 2) Option for direct part ic ipation 3) Net profit 4) Option exercised 5) Statoil covers a percentage of exploration costs.
Trcenabanken I
H•l"obaokon ·~
Type of Type of aQreement' discO\'ery
5 Returned in 1981
5
5
5
5
Oil
r.;
Field
Photos: Leif Berge. Statoil Lay·out consultant: Ottesen·Bates als Printers: Bryne Offset aJs
39

Den norske slats oljeselskap a.s P.O.Box 300, Forus, N-4001 Stavanyer, Norway
Telephone (04} 57 70 00. Telex 33326 state n