16.Dynamic Simulation Services External
20
Asset Management Services Dynamic Simulation Services Germanischer Lloyd – Service/Product Description
-
Upload
rahul281081 -
Category
Documents
-
view
218 -
download
0
Transcript of 16.Dynamic Simulation Services External
7/31/2019 16.Dynamic Simulation Services External
http://slidepdf.com/reader/full/16dynamic-simulation-services-external 1/20
Asset Management Services
Dynamic Simulation Services
Germanischer Lloyd – Service/Product Description

7/31/2019 16.Dynamic Simulation Services External
http://slidepdf.com/reader/full/16dynamic-simulation-services-external 2/20
Contents
Service Description and Values Generated
Detailed Method Statement
The detailed method statements explain how thework is conducted, which inputs are required andwhich outputs and results can be expected.
Transient Pipeline Operations (Ramp Up/RampDown)
Slugcatcher Sizing
Hydrate Remediation
Wax Prediction
HIPPS
Flare/Vent Modelling
Surge Analysis
Sphereing Operations
Case Studies and Examples
FEED Study
Late Life Studies
Hydrate Control
Riser Slugging
Subsea Tieback Feasability Study
Wax and Asphaltene Deposition Assessment
Page 3
Pages 4 - 11
a:
b:
c:
d:
e:
f:
g:
h:
Pages 12 - 19
a:
b:
c:
d:
e:
f:
Dynamic Simulation Services
Service Title: Asset Management Services
Lead Practice: GL Asset Management (UK)
Germanischer Lloyd – Service/Product Description
2

7/31/2019 16.Dynamic Simulation Services External
http://slidepdf.com/reader/full/16dynamic-simulation-services-external 3/20
Service Description
and Values Generated:Flow assurance is about ensuring the safe and economical supply,transport and processing of multiphase mixtures of gas, oil and water.As hydrocarbon production now increasingly comes from ageingreservoirs, marginal or deep water fields all with long subsea pipelinesand commingling of fluids under extreme conditions, the need forflow assurance is more crucial than ever.
Germanischer Lloyd (GL) offers a multi-disciplinary consultancy service,based upon dynamic pipeline simulations, to predict the behaviourof produced fluids as they travel along pipeline. These can then beused to highlight any issue that could impact on production capacityand availability. Issues typically addressed include pipe sizing, liquid
handling capacity and materials selection. Operating strategies tominimise liquid hold up and solids deposition (wax, hydrates or scale)can then be evaluated to determine their cost effectiveness. The block diagram in Figure 1 illustrates the areas that could be examinedduring a typical flow assurance modelling exercise. Each flowassurance exercise is tailored to meet the client’s exact requirementsas these will vary depending on the composition of the producedfluids and whether the exercise is part of the design for a new field,a tieback to an existing system or a change of operating conditions.
Figure 1: Simplified block diagram of GL’s flow assurance capabilities
3
SERVICE DESCRIPTION

7/31/2019 16.Dynamic Simulation Services External
http://slidepdf.com/reader/full/16dynamic-simulation-services-external 4/20
a. Transient Pipeline Operations (Ramp Up/Ramp Down)
GL can evaluate the operability issues associated with the start up andramp up or ramp down and shut down of pipelines using transientsimulations. To do this GL would:
Input fluid compositions into HYSYS or PVTSim togenerate representative model field and pipeline fluidswith the correct liquid dropout characteristics
Set up an OLGA model with the appropriate well, pipelineand processing configuration
Run a parametric series of transient simulations todetermine the effects of ramp up and ramp down on:
- The pipeline flow and operating regimes illustrated inFigures 2 and 3
- Liquid hold up and the variation in liquid delivery thatmay occur
- The maximum aqueous and condensate delivery ratesand the resulting slugcatcher capacity and draw offrates required
- Possible inhibitor starvation during flow ramp down
- The performance of the export system in the event ofa gas leak
- Safe operating envelope limits, shown in Figure 4
4
DETAILED METHOD STATEMENT
Figure 2: Flow regime map

7/31/2019 16.Dynamic Simulation Services External
http://slidepdf.com/reader/full/16dynamic-simulation-services-external 5/20
Figure 3: Pipeline operating regimes
Figure 4: Safe pipeline operating envelope
b. Slugcatcher Sizing
Significant savings on CAPEX can be made by reducing the size of theslugcatcher needed to prevent liquid surges from pipelines upsettingprocessing equipment and halting production. To select the mostappropriate slugcatcher, GL would:
Use a compositional simulator such as PVTSim togenerate representative model pipeline fluids that giverealistic liquid dropouts
Set up an OLGA pipeline model with the appropriatepipeline topography, materials of construction andinsulation
Run a series of OLGA pipeline simulations to:
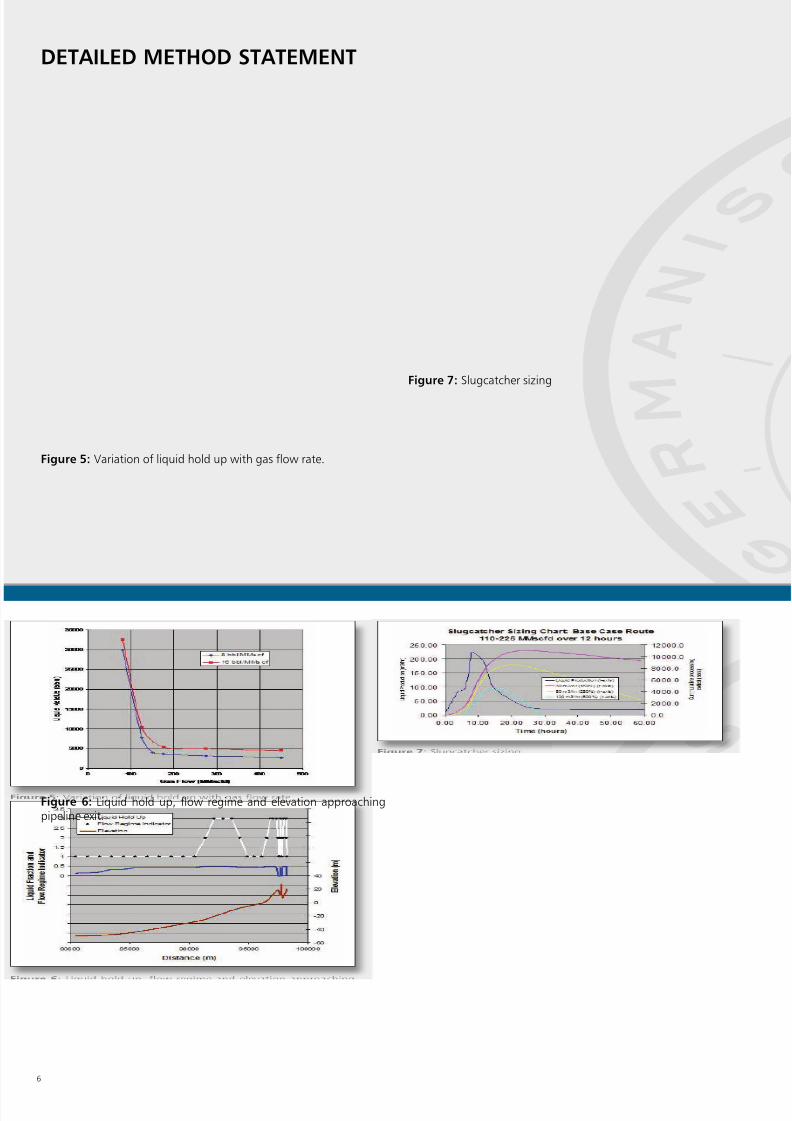
- Determine variations in liquid hold up as a functionof flow rate as shown in Figure 5
- Calculate liquid arrival rates
- Compare liquid hold up, flow regime and elevation asillustrated in Figure 6 to show if slugging is predictedin the inclined sections of pipe
- Run OLGA simulations with slugtracking to determinethe liquid surge volumes at the pipe exit for variousflow rates
- Use the predicted surge volumes and arrival times, asillustrated in Figure 7, with different flow rates todetermine minimum slugcatcher size requirements
5
DETAILED METHOD STATEMENT
150
120
90
60
30
0
0 30 60 90 120 150
Total Atlantic Flow, MMscfd
C r o m a r t y F l o w ,
M M s c f d
OPERATING
ENVELOPE
7/31/2019 16.Dynamic Simulation Services External
http://slidepdf.com/reader/full/16dynamic-simulation-services-external 6/20
Figure 5: Variation of liquid hold up with gas flow rate.
Figure 6: Liquid hold up, flow regime and elevation approachingpipeline exit.
Figure 7: Slugcatcher sizing
6
DETAILED METHOD STATEMENT

7/31/2019 16.Dynamic Simulation Services External
http://slidepdf.com/reader/full/16dynamic-simulation-services-external 7/20
c. Hydrate Remediation
Hydrates can block pipelines, restricting production and increasingpipeline pressures, or they can block valves preventing the correctfunctioning of safety equipment. To assess whether hydrateformation is likely to be a problem, GL uses Infochem’s Multiflashprogramme to generate a hydrate dissociation curve. This is thencompared to the pipeline temperatures and pressures to determine ifhydrate formation is likely, as illustrated in Figure 8 below. Softwarepredictions can be validated by laboratory testing for hydrates underpipeline conditions in GL’s hydrates test facilities.
The information generated can then be used to determine theamount of insulation or chemical inhibitor required (as illustrated inthe Figure 8) to prevent hydrate formation.
Figure 8: Hydrate Curves for a North Atlantic pipeline
d. Wax Prediction
Wax deposition can seriously reduce production rates, increase lineor pumping pressures and prevent correct functioning of safety valvesand other equipment. To prevent this from happening, the first stepis to identify whether or not wax precipitation is likely to occur.
To do this our approach is to input fluid composition data into eitherindustry standard or state of the art modelling software such asPVTSim or TUWAX to generate a wax phase line for that particularfluid. Ideally this wax phase line is then tuned to measure fluid wax appearance temperatures. The potential for wax to form in linesthroughout field life is then assessed by comparing the actual orsimulated pipeline temperature and pressure profiles, as illustrated inthe Figures 9 and 10 below.
Figure 9: Likelihood of wax formation in production lines in early life
Figure 10: Probability of wax formation in production lines in latelife
7
DETAILED METHOD STATEMENT

7/31/2019 16.Dynamic Simulation Services External
http://slidepdf.com/reader/full/16dynamic-simulation-services-external 8/20
Once the waxing tendency of the pipeline fluid is established,GL can then run pipeline simulators such as OLGA Wax or TUWAXPRO to calculate the location and thickness of wax build up as afunction of time. The effect of wax build up on pressure duringnormal operations and following shut in can also be determined asshown in the Figure 11 below. The requirement for pipelineinsulation, heating or chemical injection to prevent wax depositioncan then be systematically investigated to determine the best mostcost effective means of controlling wax deposition.
Figure 11: Wax deposition in pipeline simulations
e. HIPPS
Traditionally all subsea facilities were designed to withstand pressureequal to the maximum wellhead shut in pressure. For high pressure,deep water applications this meant using thicker walled moreexpensive pipe. By protecting process trains from overpressure in theevent of restrictions in the export flowlines, High Integrity PressureProtection Systems (HIPPS) allow flowlines and risers to be rated tolower pressures, enabling high pressure, deeper water fields to bedeveloped more cost effectively.
To protect the system the HIPPS trigger pressures need to be set belowthe relief pressure but high enough above the normal operatingpressure to avoid spurious shut downs and loss of production.
GL uses dynamic modelling to simulate the effects of shutting down
gas flows from wells into the process chain when high pressure isdetected. Trigger pressures can then be optimised for maximumproductivity with least risk to the integrity of the system. The resultsin Figure 12 show that the HIPPS set point needs to be 1330 psig toprotect the vent system from pressure relief at 1300 psig. If, howeverthe header operating pressure is reduced to 1280 psig, then the HIPPSwould no longer protect the system.
Figure 12: HIPPS trigger pressure calculations
8
DETAILED METHOD STATEMENT

7/31/2019 16.Dynamic Simulation Services External
http://slidepdf.com/reader/full/16dynamic-simulation-services-external 9/20
f. Flare/Vent Modelling
Increasing hydrocarbon production is a way of increasing revenuesbut this may only be safely achieved if the vent and flare systems inplace are able to cope with the additional throughput in the event ofa blocked outlet.
GL uses transient modelling to determine the response within flaresystems resulting from the action of the pressure safety valves (PSV)on production separators opening and closing. To do this we wouldset up an OLGA model, illustrated in Figure 13, of:
Flowing wells, associated pipework, chokes and SubseaSafety Valves (SSV)
Separator and PSV
Gas lines linking wells to vessels and on to the export line
HP flare system
The model is then benchmarked by comparing the calculated pressuredrops across the flare tip against pressure data as in Figure 14.Pressures in Figure 15 (and temperatures) in the flare system inresponse to opening and closing of safety valves for various increasedproduction scenarios can then be calculated. This information canthen be used to determine the safe operating limits for the maximumproduction rate for a given PSV configuration.
Figure 13: Complete OLGA model
Figure 14: Comparison of pressures across vent tip
Figure 15: Pressure variation in the flare system
9
DETAILED METHOD STATEMENT
7/31/2019 16.Dynamic Simulation Services External
http://slidepdf.com/reader/full/16dynamic-simulation-services-external 10/20
10
DETAILED METHOD STATEMENT
g. Surge Analysis
Surge Control
GL offers advice on normal operating procedures such as start up,shut down, manifold switch and valve operation to minimise thepressure surge magnitude. MASP violations (and possible ruptures)can be avoided by having the correct operational procedure.
Surge ProtectionSurge protection is required to protect the system integrity againstfailure under events beyond the operator’s control (power failure,emergency valve operation, accidents, operator error). GL’s HydraulicConsulting team can simulate these events and the relief devices thatare required to avoid MASP violations using SPS. We can recommendthe device that best suits your needs (relief valve, rupture disk, rupturepin, surge tank) and the set pressures needed to protect your pipeline.
GL can help you save money by preventing MASP violations (which arereportable incidents) and possible pipe failure. We can also help youdetermine the most cost-effective solution for your pipeline.
Figure 16: Inspecting a surge relief valve
Batch TrackingGL can run different batches (gasoline, jet fuel, crude, etc.) in thesame pipeline simulator. This feature allows surge studies to takeplace for different equilibrium conditions. It can also be used fortiming the batches in the pipeline so that the flying switches arecorrectly calibrated and product loss is kept to a minimum.
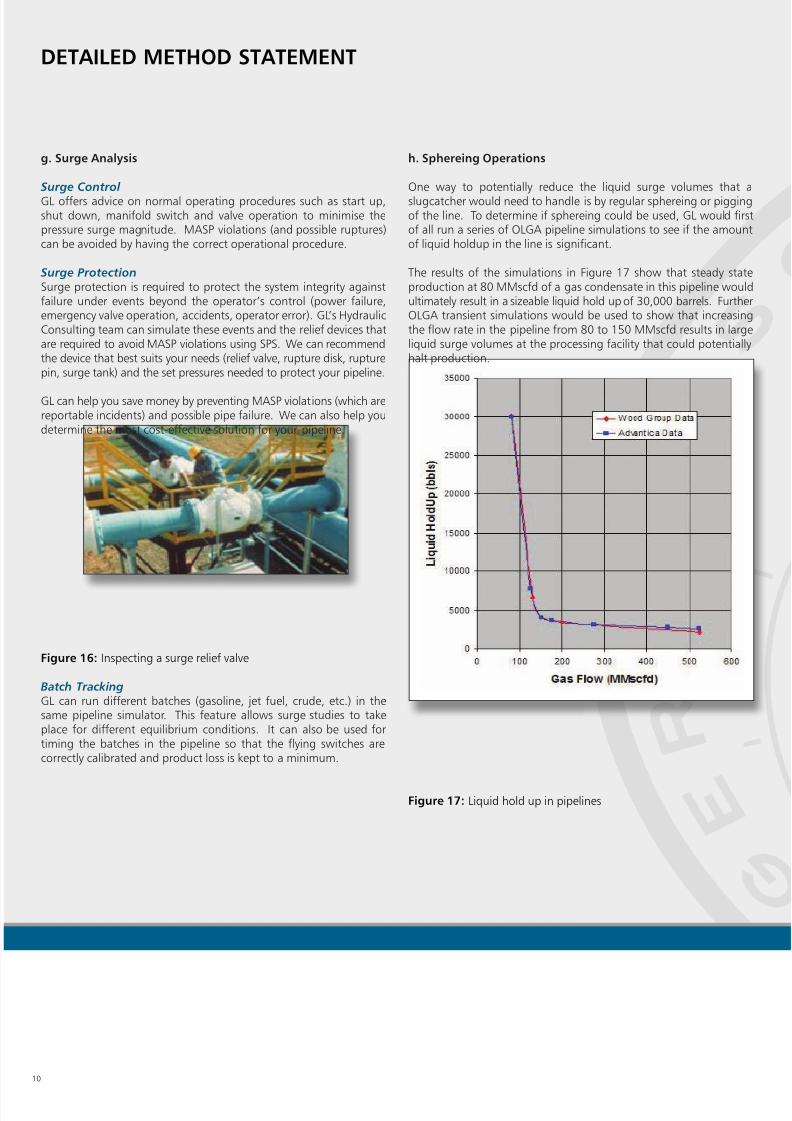
h. Sphereing Operations
One way to potentially reduce the liquid surge volumes that aslugcatcher would need to handle is by regular sphereing or piggingof the line. To determine if sphereing could be used, GL would firstof all run a series of OLGA pipeline simulations to see if the amountof liquid holdup in the line is significant.
The results of the simulations in Figure 17 show that steady stateproduction at 80 MMscfd of a gas condensate in this pipeline wouldultimately result in a sizeable liquid hold up of 30,000 barrels. FurtherOLGA transient simulations would be used to show that increasingthe flow rate in the pipeline from 80 to 150 MMscfd results in largeliquid surge volumes at the processing facility that could potentiallyhalt production.
Figure 17: Liquid hold up in pipelines

7/31/2019 16.Dynamic Simulation Services External
http://slidepdf.com/reader/full/16dynamic-simulation-services-external 11/20
11
DETAILED METHOD STATEMENT
Then, to determine if regular pigging of the line could effectivelyreduce the liquid surge volume and therefore the slugcatcher sizerequirements, GL would carry out a parametric study using the OLGAtransient pipeline simulator to determine:
Slug size
Optimum sphere size for bypass pigging
Sphereing interval required to keep slug size below theslugcatcher volume
Maximum flow rate at which sphereing can be effectivelyused to maintain liquid surge volumes within theminimum slugcatcher limits
The results of such a parametric study, illustrated in Figure 18 below,suggest that for spheres of less than 22.1 inches in diameter, theliquid discharge will not exceed the minimum slugcatcher volume of1500 barrels when flowing at up to 150 MMscfd.
Figure 18: Sphere sizing
GL can also use WAXPRO or OLGA wax to estimate piggingfrequencies for sphereing to remove wax deposits. As Figure 19below illustrates, wax build up is likely to cause the pipeline pressureto fall below the minimal arrival pressure after 6 months so regularremoval of wax at intervals of less than 6 months is needed.
Figure 19: Estimating pigging frequencies based on arrival pressures

7/31/2019 16.Dynamic Simulation Services External
http://slidepdf.com/reader/full/16dynamic-simulation-services-external 12/20
12
CASE STUDIES
a. FEED Case Study
Date: 2004-06Customer: North Sea OperatorSavings: Fully operational pipeline system
Issue:
A North Sea operator requested a flow assurance FEED study for theirgas condensate field to identify optimum pipeline sizes and toinvestigate aspects of flow assurance within the infield and exportpipelines.
GL were required to benchmark the current models against thoseused in previous studies and optimise the pipeline sizes given the lat-est reservoir models and hydrate control philosophy.
Methodology & Results:
The OLGA models previously created by the operator were reviewedand modifications made now that the design phase had progressed.The study demonstrated that the optimum pipeline sizes were a 16”
export line and a 12” infield flowline. This was a change from theprevious study undertaken where an 18” export line and 10” infieldline had been recommended.
Having identified the optimum pipeline sizes steady state andtransient simulations were performed to determine:
The pipeline flow regimes and the variation in liquiddelivery that may occur during slug flow
The maximum aqueous and condensate delivery rates
onshore and the resulting slugcatcher capacity anddraw-off rates required The possibility for MEG starvation during flow ramp down
cases The performance of the export system in the event of a
gas leak
Slugging was predicted in the offshore section of the pipeline andalthough these slugs do not completely dissipate, the slug volume iswell within the capacity of the slugcatcher.
A condensate processing rate of 38.4 m3/h was predicted to beadequate to limit the surge volume in the slugcatcher during flowramp-ups and to process hydrocarbon liquids delivered at the
maximum flow of 230 MMscfd.

7/31/2019 16.Dynamic Simulation Services External
http://slidepdf.com/reader/full/16dynamic-simulation-services-external 13/20
13
CASE STUDIES
OLGA predictions showed that Joule-Thompson cooling in thepipeline would lead to low gas temperatures (lower than 4°C ambientsea temperature). The hydrate curve predicted by Multiflash and thetemperature/pressure profile through the export line were plotted toidentify the potential for hydrate formation.
When ramping down the flow from 230 to 100 MMscfd, more waterbecomes condensed at the chokes, rather than along the pipeline asat the higher flow. Although this would cause dilution of the MEGat the start of the export pipe, this drop in MEG concentration wouldnot be sufficient to lead to hydrate formation.
A leak of 24 MMscfd from a 21.6 mm hole should be reliably detectedby the difference in gas flow readings at the wellhead wet gas metersand onshore fiscal metering.
A smaller leak of 5.3 MMscfd from a 10 mm hole is unlikely to bedetected by either the offshore / onshore flow difference or pressurebased systems.
In addition, further simulations were conducted to evaluate the MEGinjection pipelines and to determine the size and capacity of the MEGstorage and regeneration facility onshore.
Benefits:
The reduction in the 80km export pipeline diameter to 16” decreasedthe initial CAPEX of the development.
The transient simulations showed that the existing slugcatcher atshore was sufficient to handle the expected ramp-up rates withoutany modifications required.
GL were able to provide a continued support to the project and alsoworked on examining HAZOP actions, operating guidelines, hydrateinhibition strategy, new development options and ramp-up rates forreduced flow from one well only.
7/31/2019 16.Dynamic Simulation Services External
http://slidepdf.com/reader/full/16dynamic-simulation-services-external 14/20
14
CASE STUDIES
b. Life Studies
Date: 2008Customer: North Sea OperatorSavings: Prolonged operation at lower flow rates
Issue:
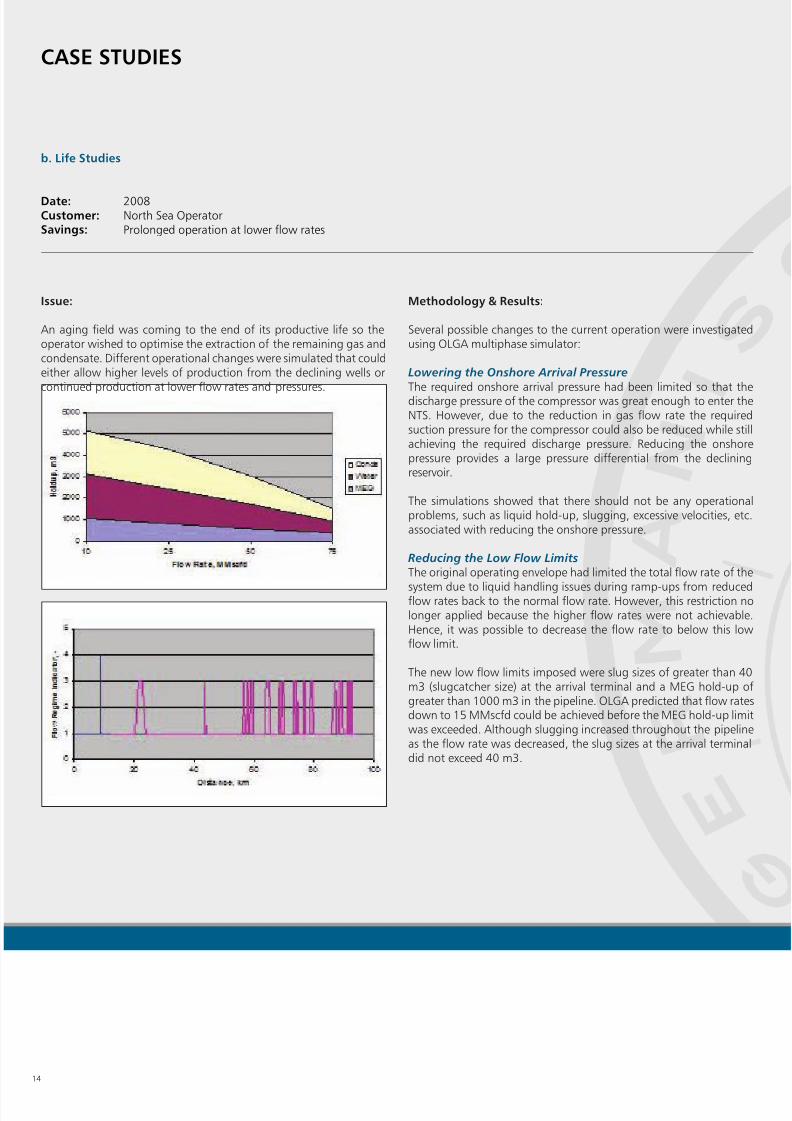
An aging field was coming to the end of its productive life so theoperator wished to optimise the extraction of the remaining gas andcondensate. Different operational changes were simulated that couldeither allow higher levels of production from the declining wells or
continued production at lower flow rates and pressures.
Methodology & Results:
Several possible changes to the current operation were investigatedusing OLGA multiphase simulator:
Lowering the Onshore Arrival Pressure
The required onshore arrival pressure had been limited so that thedischarge pressure of the compressor was great enough to enter theNTS. However, due to the reduction in gas flow rate the requiredsuction pressure for the compressor could also be reduced while stillachieving the required discharge pressure. Reducing the onshorepressure provides a large pressure differential from the decliningreservoir.
The simulations showed that there should not be any operationalproblems, such as liquid hold-up, slugging, excessive velocities, etc.associated with reducing the onshore pressure.
Reducing the Low Flow LimitsThe original operating envelope had limited the total flow rate of the
system due to liquid handling issues during ramp-ups from reducedflow rates back to the normal flow rate. However, this restriction nolonger applied because the higher flow rates were not achievable.Hence, it was possible to decrease the flow rate to below this lowflow limit.
The new low flow limits imposed were slug sizes of greater than 40m3 (slugcatcher size) at the arrival terminal and a MEG hold-up ofgreater than 1000 m3 in the pipeline. OLGA predicted that flow ratesdown to 15 MMscfd could be achieved before the MEG hold-up limitwas exceeded. Although slugging increased throughout the pipelineas the flow rate was decreased, the slug sizes at the arrival terminaldid not exceed 40 m3.

7/31/2019 16.Dynamic Simulation Services External
http://slidepdf.com/reader/full/16dynamic-simulation-services-external 15/20
15
CASE STUDIES
Periodic Gas PiggingTo achieve manageable surge volumes at the slugcatcher and lowerFWHPs at reduced production rates, “gas pigging” can be employedto control the pipeline inventory. The pipeline can be operated at alower flow rate then ramped-up at short notice if the pipeline liquidhold-up is not allowed to reach steady-state at the lower flow rate.
A “gas pigging” cycle of 2 days would be required to prevent thesurge volume from becoming too great during ramp-up.
FWHP during 2 day “Gas Pigging” cycle
Pressure Recovery Shutting in production from a reservoir allows the pressure in thatreservoir to partially recover. Upon restart of flow from the reservoir,higher production rates can be achieved before the pressure beginsto decline further.
The simulations performed investigated the effect on the pipelineoperation of shutting in one or both reservoirs for one week and thenrestarting production. When all the wells are shut-in or when onlythe richer wells are shut-in no problems were predicted with aninstantaneous restart. However, when the leaner wells were shut-infor pressure recovery a 2 day restart was required to prevent theslugcatcher from slugging.
MEG ReductionThe current MEG requirement of 4 m3/h was defined to protect themain export pipeline from hydrates under a water breakthrough caseof 400 bpd and worst case shut-in conditions. During currentoperation, the onshore terminal was experiencing a water arrival rateof ~100 bpd. Whilst it was still a valid strategy to protect against 400
bpd, at the late stage of field life protecting against a smaller marginabove the current water production rate could have been moreappropriate.
Hydrate calculations were performed in Multiflash and predicted thata MEG injection rate of 1.3 m3/h was required to protect against 100bpd of produced water. This lower injection rate results in the liquidinventory of the system increasing slower during flow rate reductionand hence would result in a longer “gas pigging” frequency.
Benefits:
After completing the study the operator decided that the lowering of
the arrival pressure and reduction in the low flow limits would providethem with the continued production for another 3-6 months.
7/31/2019 16.Dynamic Simulation Services External
http://slidepdf.com/reader/full/16dynamic-simulation-services-external 16/20
c. Hydrate Control
Date: 2004-06Customer: North Sea OperatorSavings: Reduced MEG requirement
Issue:
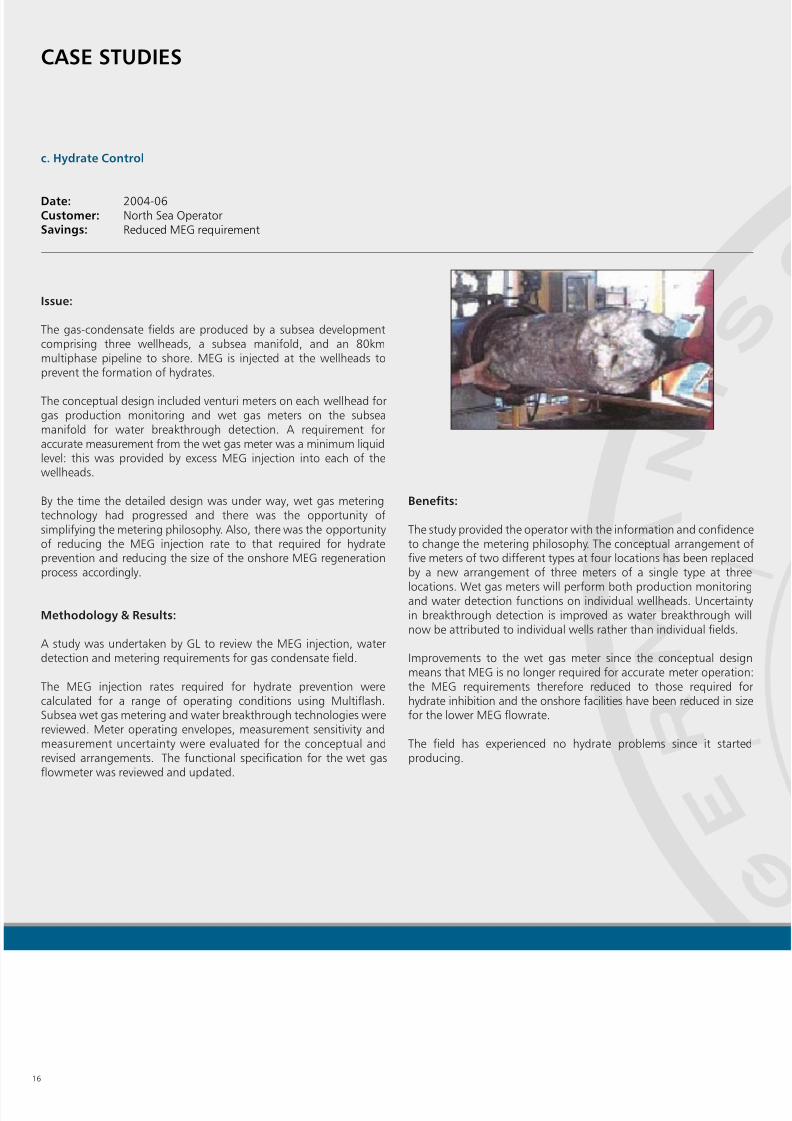
The gas-condensate fields are produced by a subsea developmentcomprising three wellheads, a subsea manifold, and an 80kmmultiphase pipeline to shore. MEG is injected at the wellheads toprevent the formation of hydrates.
The conceptual design included venturi meters on each wellhead forgas production monitoring and wet gas meters on the subseamanifold for water breakthrough detection. A requirement foraccurate measurement from the wet gas meter was a minimum liquidlevel: this was provided by excess MEG injection into each of thewellheads.
By the time the detailed design was under way, wet gas meteringtechnology had progressed and there was the opportunity ofsimplifying the metering philosophy. Also, there was the opportunityof reducing the MEG injection rate to that required for hydrateprevention and reducing the size of the onshore MEG regenerationprocess accordingly.
Methodology & Results:
A study was undertaken by GL to review the MEG injection, waterdetection and metering requirements for gas condensate field.
The MEG injection rates required for hydrate prevention werecalculated for a range of operating conditions using Multiflash.Subsea wet gas metering and water breakthrough technologies werereviewed. Meter operating envelopes, measurement sensitivity andmeasurement uncertainty were evaluated for the conceptual andrevised arrangements. The functional specification for the wet gasflowmeter was reviewed and updated.
Benefits:
The study provided the operator with the information and confidenceto change the metering philosophy. The conceptual arrangement offive meters of two different types at four locations has been replacedby a new arrangement of three meters of a single type at three
locations. Wet gas meters will perform both production monitoringand water detection functions on individual wellheads. Uncertaintyin breakthrough detection is improved as water breakthrough willnow be attributed to individual wells rather than individual fields.
Improvements to the wet gas meter since the conceptual designmeans that MEG is no longer required for accurate meter operation:the MEG requirements therefore reduced to those required forhydrate inhibition and the onshore facilities have been reduced in sizefor the lower MEG flowrate.
The field has experienced no hydrate problems since it startedproducing.
16
CASE STUDIES

7/31/2019 16.Dynamic Simulation Services External
http://slidepdf.com/reader/full/16dynamic-simulation-services-external 17/20
d. Riser Slugging
Date: 2004Customer: North Sea OperatorSavings: Reduced topside shutdowns
Issue:
A North Sea operator was experiencing problems with slugging intheir risers coming up to an FPSO. The slugging was leading to 5-10bar pressure oscillations at the top of the risers and 2-3 bar in the firststage separator. The accompanying swings in gas and liquid flow rates
caused process trips and lost production.
Methodology & Results:
There are three types of slugging problems:
Transient slugs generated by a rapid increase in gasflowrate and the liquid surge
Hydrodynamic slugging arises from the flow regime in thepipeline
Terrain/Severe Slugging due to the topography of thepipeline and flow conditions
GL created an OLGA model simulating the system. The model was
run to match process data for the periods of slugging seen in the ris-ers and the pressure drops throughout the system. Initialsimulations failed to predict slugging – this suggested that theslugging was hydrodynamic rather than riser slugging and the OLGAslug tracking model was used in subsequent simulations.
This successfully reproduced process conditions and the model wasthen used to perform a parametric study which varied:
Total liquid rate Water rate Gas lift rate Friction rate (to simulate effect of a drag reducing agent)
A further series of simulations looked at use of chokes at the top ofthe risers as a means of reducing the slugging severity.
Benefits:
The study demonstrated that the pressure swings seen at the top ofthe risers was being cause by hydrodynamic rather than severe/terrainslugging and that the separator could handle liquid surges provided
it was left in automatic control (it was currently being operated inmanual).
High gas and liquid flowrates would be released from the separatorfor short periods which could cause operational problemsdownstream of the separator.
Mean slug sizes could be reduced by setting the topside chokes to20%, but this would need to be offset against production losses.
It was demonstrated that the use of drag reducing agents hadminimal effect on the slug sizes at the top of the risers.
17
CASE STUDIES
7/31/2019 16.Dynamic Simulation Services External
http://slidepdf.com/reader/full/16dynamic-simulation-services-external 18/20
e. Subsea Tieback Feasibility Study
Date: 2007Customer: North Sea OperatorSavings: Optimum pipeline design
Issue:
A North Sea operator commissioned GL to evaluate a range ofdevelopment options for the production of a Gas-Condensatediscovery. The field was located in an area where there is both existinginfrastructure and a number of undeveloped discoveries.
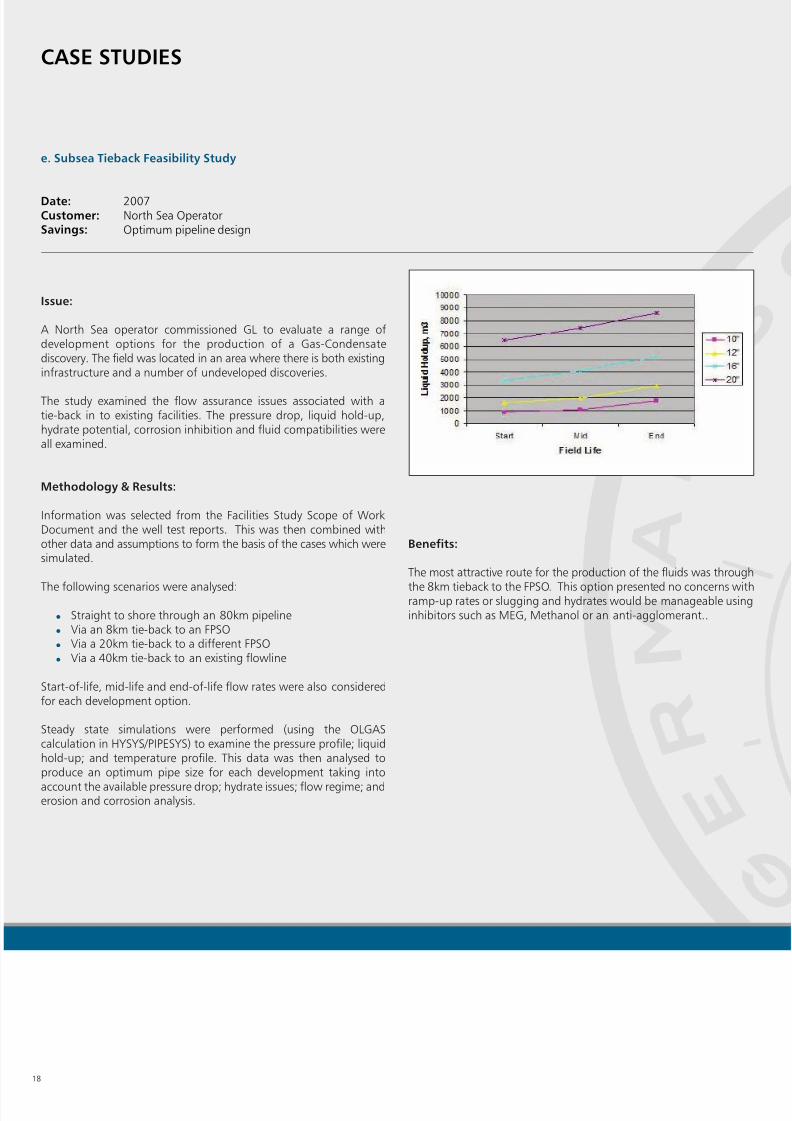
The study examined the flow assurance issues associated with atie-back in to existing facilities. The pressure drop, liquid hold-up,hydrate potential, corrosion inhibition and fluid compatibilities wereall examined.
Methodology & Results:
Information was selected from the Facilities Study Scope of Work Document and the well test reports. This was then combined withother data and assumptions to form the basis of the cases which weresimulated.
The following scenarios were analysed:
Straight to shore through an 80km pipeline Via an 8km tie-back to an FPSO Via a 20km tie-back to a different FPSO Via a 40km tie-back to an existing flowline
Start-of-life, mid-life and end-of-life flow rates were also consideredfor each development option.
Steady state simulations were performed (using the OLGAScalculation in HYSYS/PIPESYS) to examine the pressure profile; liquidhold-up; and temperature profile. This data was then analysed toproduce an optimum pipe size for each development taking into
account the available pressure drop; hydrate issues; flow regime; anderosion and corrosion analysis.
Benefits:
The most attractive route for the production of the fluids was through
the 8km tieback to the FPSO. This option presented no concerns withramp-up rates or slugging and hydrates would be manageable usinginhibitors such as MEG, Methanol or an anti-agglomerant..
18
CASE STUDIES
7/31/2019 16.Dynamic Simulation Services External
http://slidepdf.com/reader/full/16dynamic-simulation-services-external 19/20
f. Wax and Asphaltene Deposition Assessment
Date: 2008Customer: Caspian Region Field OperatorSavings: Recommendation of mitigation strategy for pipeline
operations
Issue:
GL was commissioned to assess the potential for wax andasphaltene deposition to occur in support of the Front-EndEngineering Design (FEED) of a new phase in the development of theexisting gas-oil-condensate field.
The Phase development required the installation of a new gatheringsystem, which consists of 65 wells connected to 13 remote manifoldstations (RMS) each with a dedicated trunkline back to receptionfacilities. The existing export pipeline was also modified to cope withthe increased production from the new development.
The study concentrated on the formation potential of waxes andasphaltenes on the pipelines and process equipments and subsequentrecommendation of mitigation strategies and pipeline operatingphilosophy.
Methodology & Results:
Well fluid compositional data and pipeline operating conditions weresupplied by the client, and were combined with other data andassumptions to get the input data required for the modelling.
The modelling was conducted for start-of-life, mid-life andend-of-life compositions under summer and winter conditions. Theanalysis entailed:
Wax Appearance Temperature (WAT) calculations for therepresentative field fluid streams using Tulsa Wax (TUWAX)
Generating wax phase lines (WAT as a function ofpressure)
Determination of pressure and temperature profiles usingPIPEFLO for the flowlines, trunklines, infield lines andexport line
Identification of pipelines at risk of wax deposition. Wax deposition calculations for pipelines identified to be
at risk using MSI WaxPro Wax deposition mitigation sensitivity modelling looking
at the effect of wax deposition inhibitors Asphaltene precipitation prediction using Multiflash
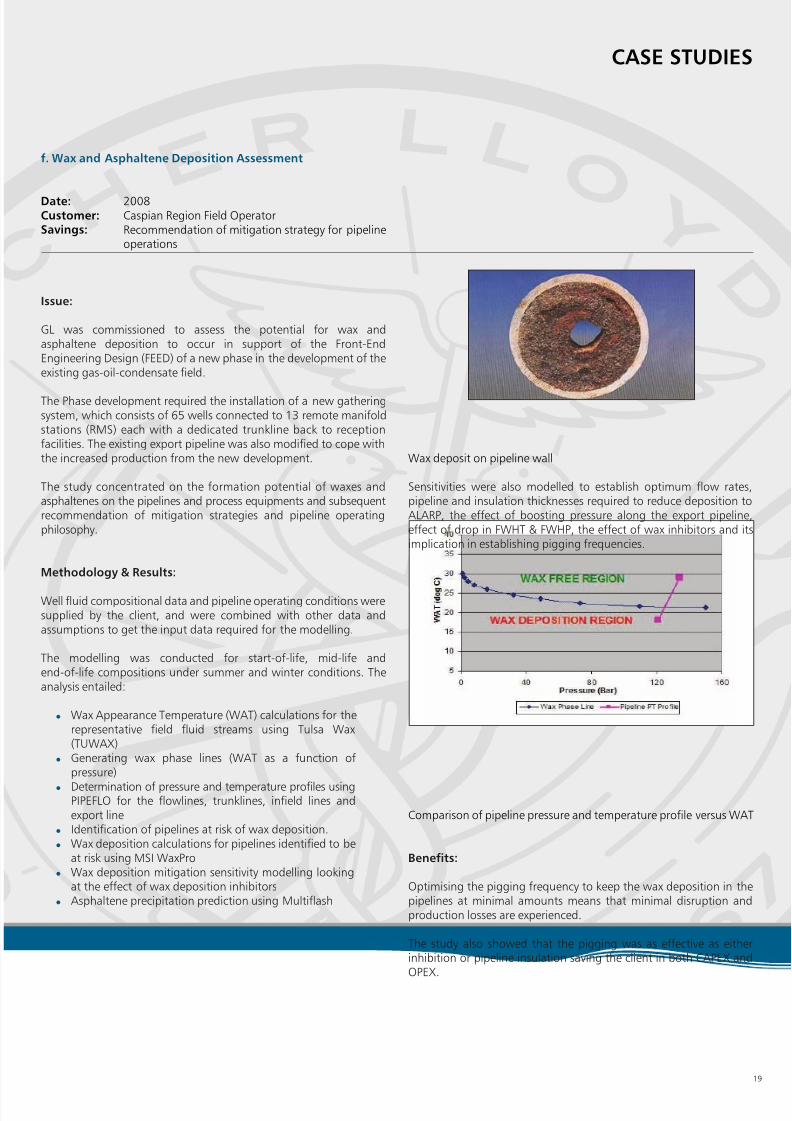
Wax deposit on pipeline wall
Sensitivities were also modelled to establish optimum flow rates,pipeline and insulation thicknesses required to reduce deposition toALARP, the effect of boosting pressure along the export pipeline,effect of drop in FWHT & FWHP, the effect of wax inhibitors and itsimplication in establishing pigging frequencies.
Comparison of pipeline pressure and temperature profile versus WAT
Benefits:
Optimising the pigging frequency to keep the wax deposition in thepipelines at minimal amounts means that minimal disruption andproduction losses are experienced.
The study also showed that the pigging was as effective as eitherinhibition or pipeline insulation saving the client in both CAPEX andOPEX.
19
CASE STUDIES

7/31/2019 16.Dynamic Simulation Services External
http://slidepdf.com/reader/full/16dynamic-simulation-services-external 20/20
Germanischer Lloyd does not warrant or assume any kind of liability for theup-to-date nature, accuracy, completeness or quality of the information provided.Liability claims against Germanischer Lloyd arising out of or in connection withmaterial or non-material loss or damage caused by the use or non-use of information
provided, including the use of incorrect or incomplete information, are excludedunless such loss or damage is caused by the proven wilful misconduct or grosslynegligent conduct of Germanischer Lloyd.All offers are subject to alteration and are non-binding. Germanischer Lloyd expresslyreserves the right without notice to change, supplement or delete parts of the pagesor the entire offer or to stop the publication temporarily or definitively.
Germanischer Lloyd
Industrial Services GmbH
Oil and Gas
Steinhöft 9
20459 Hamburg, Germany
Phone +49 40 36149-7700
Fax +49 40 36149-1781
www.gl-group.com/glis
Asset Management Services
Plant Integrity Management Services
Pipeline Integrity Management Services
Production Optimisation (Includes RAMand Gas Processing)
Dynamic and Steady State Simulation
Rotating Equipment Performance &
Condition Monitoring includingEmissions Reporting
Gas Quality and Interchangeability