DYNAMIC MODELLING, IDENTIFICATION AND SIMULATION OF INDUSTRIAL ROBOTS
Dynamic Simulation Modelling
Presented by: Declan Alcock MSc MIEI 20th May 2014

Varming International Alliance
Dublin London Sydney Copenhagen Hong KongCork Edinburgh CanberraRoscommon
La Grande ArcheParis
Tate GalleryLondon
The British Library London
Opera HouseSydney
Government BuildingsDublin
AMNCH Tallaght HospitalDublin

Background
Project Director (Sustainability) - VarmingMSc Energy & Sustainable Building DesignCertified European PassivHaus DesignerIES level 3&4 Energy AssessorNon-Domestic BER AssessorDisplay Energy Certificate (DEC) Assessor
15 years experience in Sustainability in the Built Environment.Project Analysis on 150+ projects
Director Engineers Without Borders (EWB-Ireland)www.ewb-ireland.orgMember of Engineers Ireland BIM Working Groupwww.engineersireland.ieMember of CITA Skillnet Steering Committeewww.cita.ie
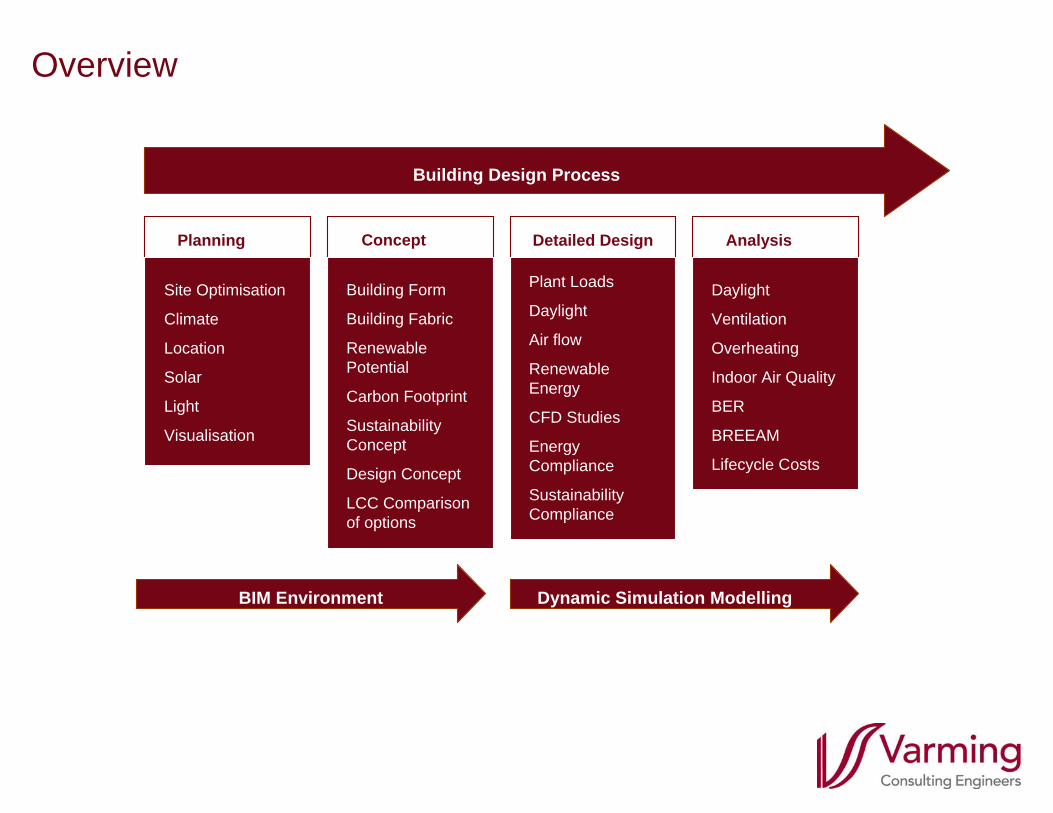
Overview
Building Design Process
Site Optimisation
Climate
Location
Solar
Light
Visualisation
Planning
Building Form
Building Fabric
Renewable Potential
Carbon Footprint
Sustainability Concept
Design Concept
LCC Comparison of options
Concept Detailed Design
Plant Loads
Daylight
Air flow
Renewable Energy
CFD Studies
Energy Compliance
Sustainability Compliance
Analysis
Daylight
Ventilation
Overheating
Indoor Air Quality
BER
BREEAM
Lifecycle Costs
BIM Environment Dynamic Simulation Modelling
Building Performance Analysis
Sustainable Building Design and Simulation• Sustainable Building Design requires an understanding of how a building
will perform which in turn requires computer-based simulation software for building analysis.
Dynamic thermal simulation can provide• Insight into energy use• Environmental performance impact• Thermal comfort analysis• Life cycle costing information
Design Process• Iterative by nature • Room functions and adjacencies change• Model follows building geometry changes.
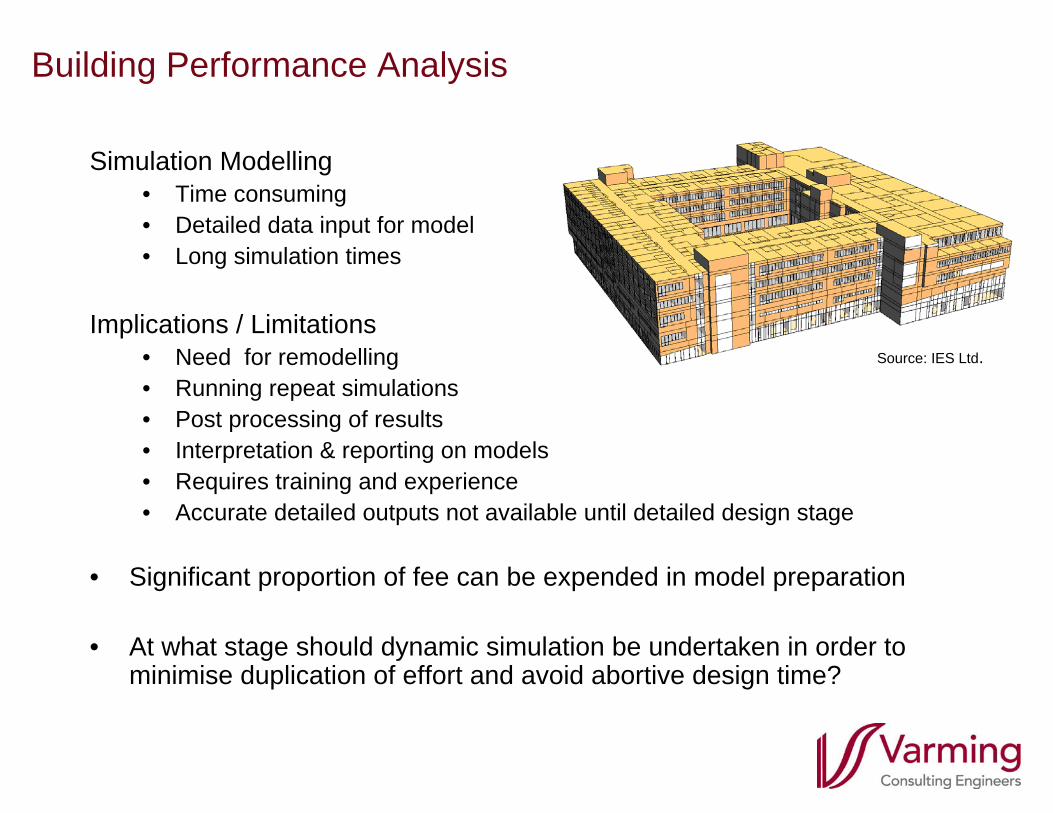
Building Performance Analysis
Simulation Modelling• Time consuming • Detailed data input for model• Long simulation times
Implications / Limitations• Need for remodelling• Running repeat simulations• Post processing of results• Interpretation & reporting on models • Requires training and experience • Accurate detailed outputs not available until detailed design stage
• Significant proportion of fee can be expended in model preparation
• At what stage should dynamic simulation be undertaken in order to minimise duplication of effort and avoid abortive design time?
Source: IES Ltd.
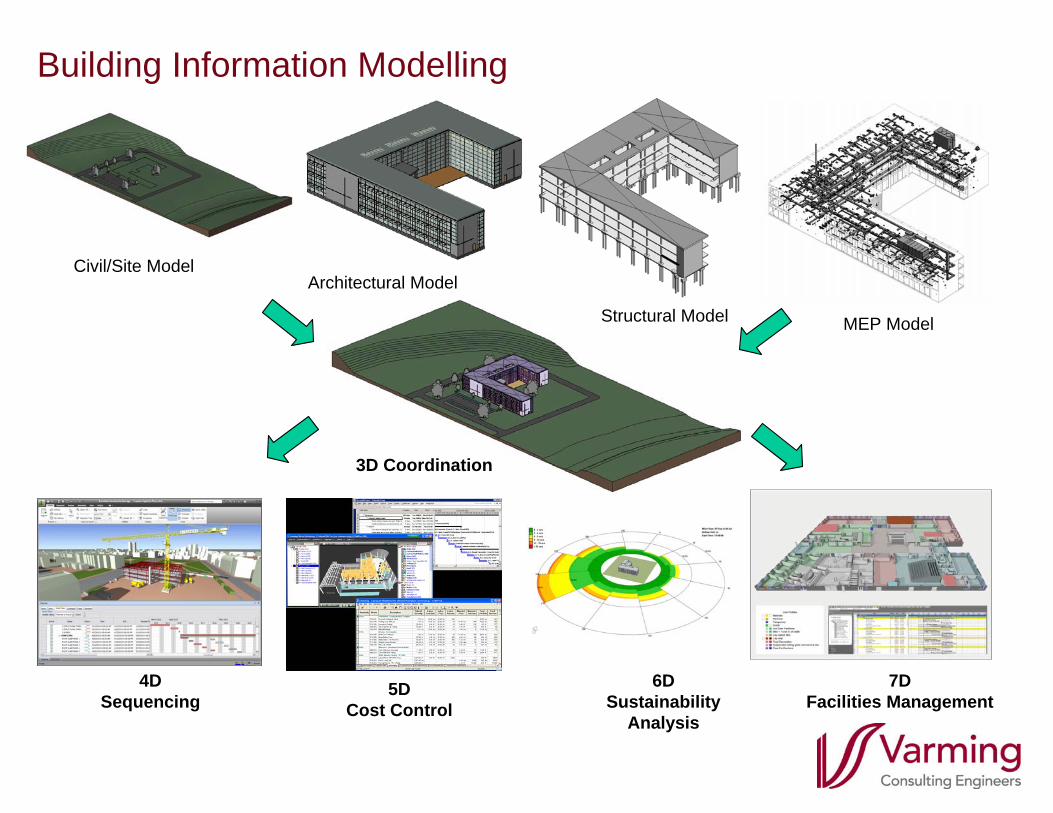
Building Information Modelling
Civil/Site ModelArchitectural Model
Structural Model MEP Model
3D Coordination
4D Sequencing
5D Cost Control
6D Sustainability
Analysis
7DFacilities Management
BIM for Architecture
BIM is a process, not a software package.
• Architecture• Autodesk Revit Architecture• Graphisoft ArchiCAD• Nemetschek Allplan Architecture• Gehry Technologies – Digital Project Designer• Nemetschek Vectorworks Architecture• Bentley Architecture• 4MSA IDEA Architectural Design (IntelliCAD)
BIM for Sustainability
• Sustainability• Autodesk Ecotect• Autodesk Green Building Studio• Graphisoft Eco Designer• IES Virtual Environment (VE-Pro)• Bentley TAS, • Bentley Hevacomp• Design Builder• Vasari
Building Performance Analysis – IES VE-Pro
Detailed Design Stage Analysis - IES Virtual Environment (VE-Pro)
• Most commonly used software• Knowledge and confidence in use• Can model systems and control strategies with accuracy
• Temperature, C02, humidity set points etc• External and internal conditions
• Provides a high degree of control over inputs• Can Interrogate the model and results in detail
Early Stage Analysis – Vasari, IES Toolkits
The choice of software depends on the required output, level ofaccuracy and stage of project
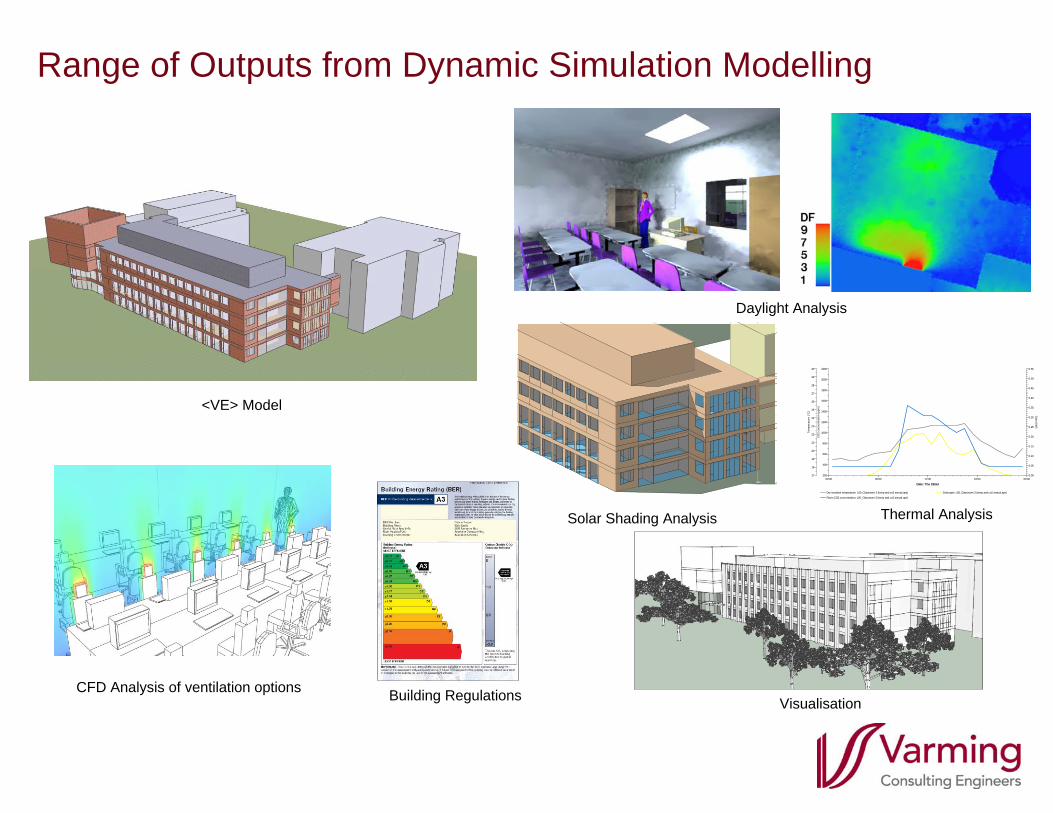
Range of Outputs from Dynamic Simulation Modelling
Thermal Analysis
CFD Analysis of ventilation options
<VE> Model
Solar Shading Analysis
00:00 06:00 12:00 18:00 00:00
30
29
28
27
26
25
24
23
22
21
20
19
18
17
Tem
pera
ture
(°C
)
0.55
0.50
0.45
0.40
0.35
0.30
0.25
0.20
0.15
0.10
0.05
0.00
Gain (kW
)
2200
2000
1800
1600
1400
1200
1000
800
600
400
200
CO
2 co
ncen
tratio
n (p
pm)
Date: Thu 19/Jul
Dry resultant temperature: L00_Classroom 3 (temp and co2 annual.aps) Solar gain: L00_Classroom 3 (temp and co2 annual.aps)
Room CO2 concentration: L00_Classroom 3 (temp and co2 annual.aps)
Daylight Analysis
Building Regulations Visualisation
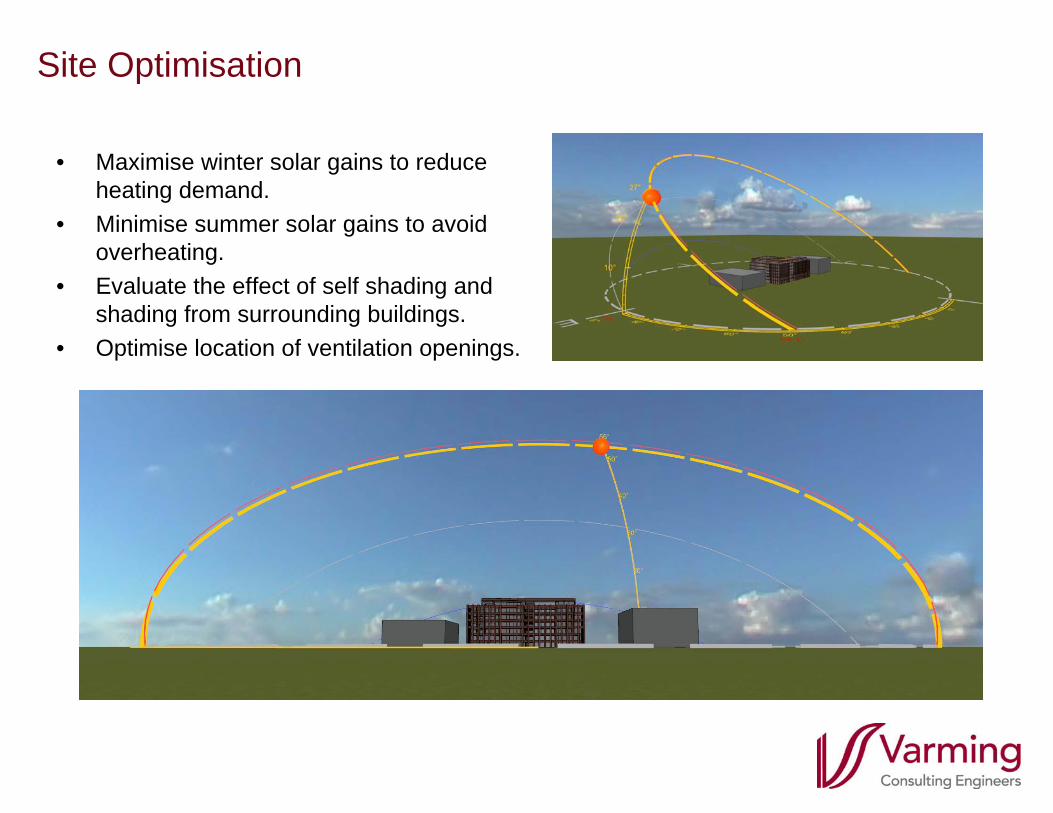
Site Optimisation
• Maximise winter solar gains to reduce heating demand.
• Minimise summer solar gains to avoid overheating.
• Evaluate the effect of self shading and shading from surrounding buildings.
• Optimise location of ventilation openings.
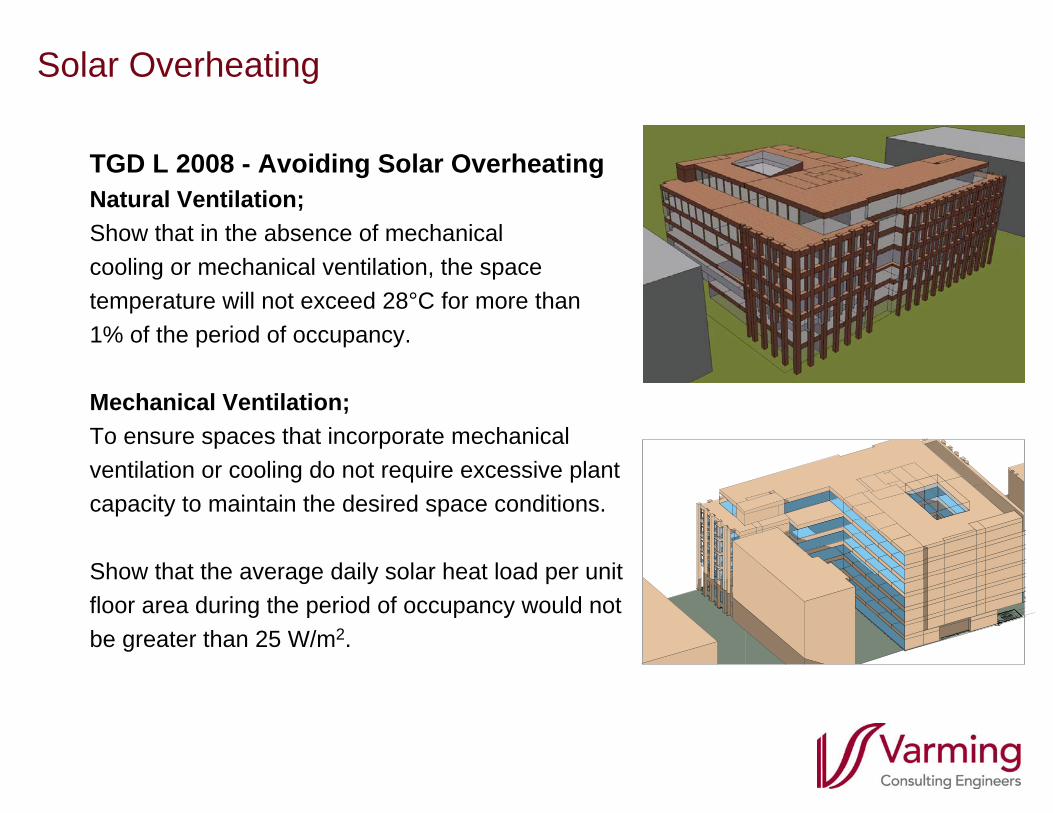
Solar Overheating
TGD L 2008 - Avoiding Solar OverheatingNatural Ventilation;Show that in the absence of mechanicalcooling or mechanical ventilation, the spacetemperature will not exceed 28°C for more than 1% of the period of occupancy.
Mechanical Ventilation;To ensure spaces that incorporate mechanicalventilation or cooling do not require excessive plantcapacity to maintain the desired space conditions.
Show that the average daily solar heat load per unitfloor area during the period of occupancy would notbe greater than 25 W/m2.
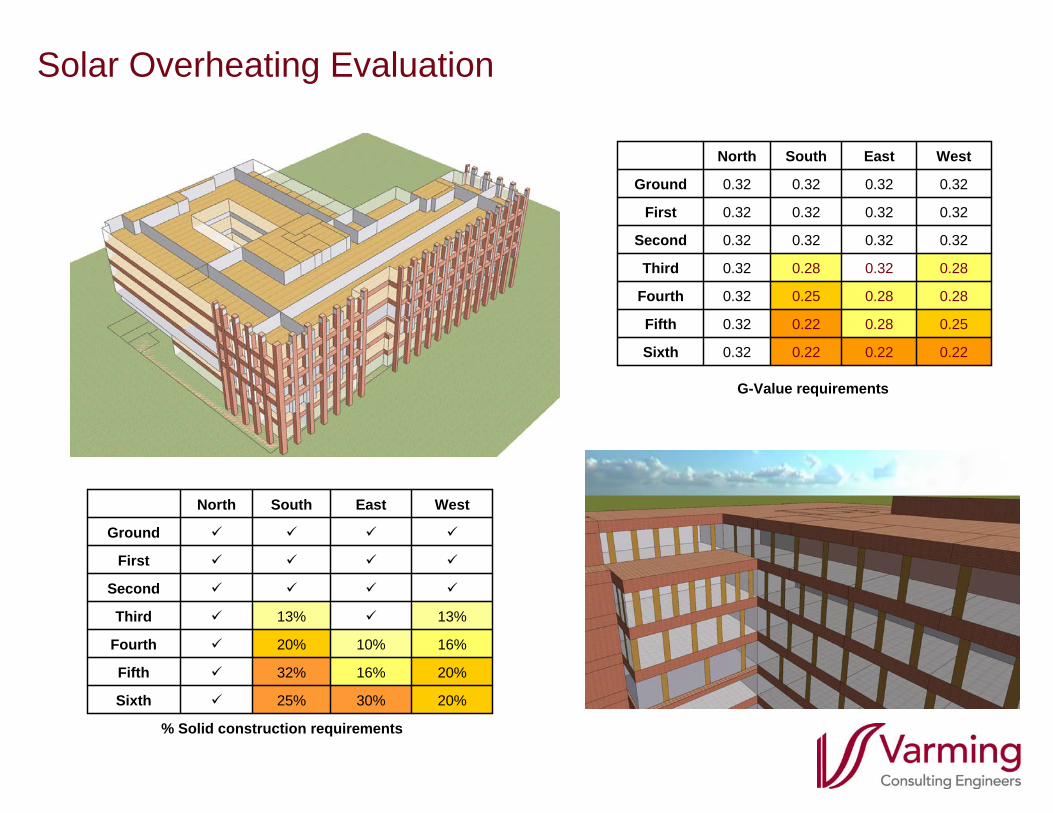
Solar Overheating Evaluation
20%30%25%Sixth
20%16%32%Fifth
16%10%20%Fourth
13%13%Third
Second
First
Ground
WestEastSouthNorth
0.220.220.220.32Sixth
0.250.280.220.32Fifth
0.280.280.250.32Fourth
0.280.320.280.32Third
0.320.320.320.32Second
0.320.320.320.32First
0.320.320.320.32Ground
WestEastSouthNorth
G-Value requirements
% Solid construction requirements
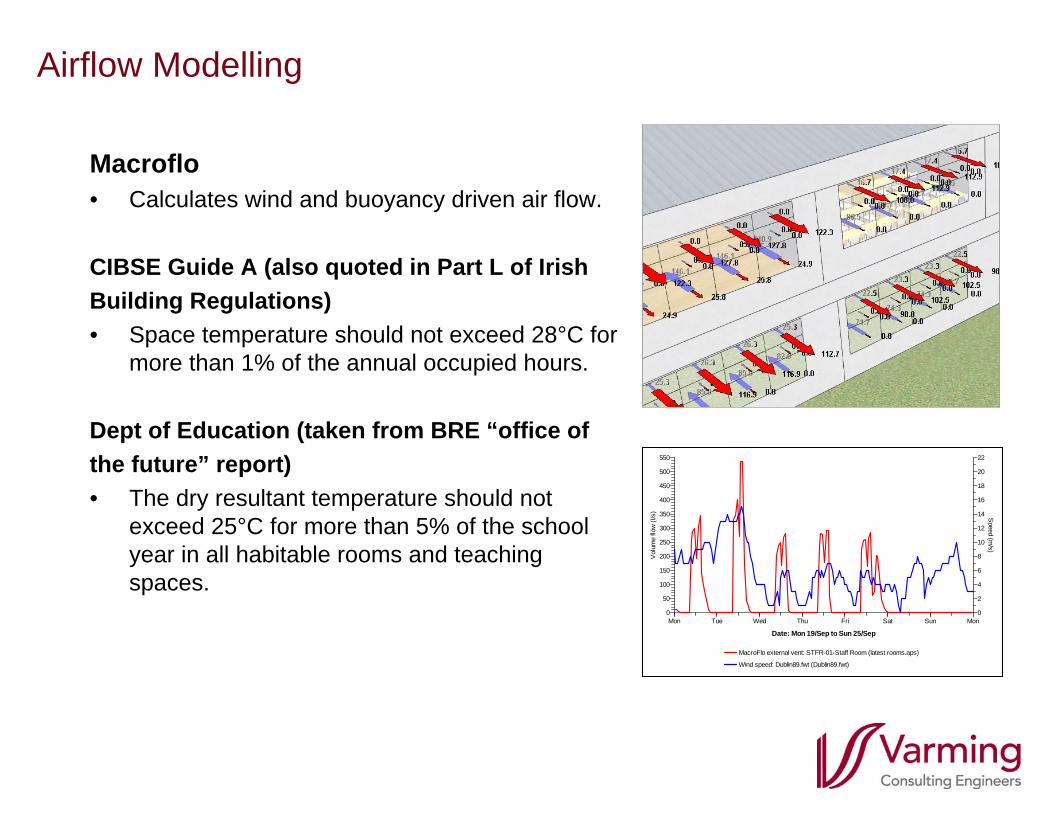
Airflow Modelling
Macroflo• Calculates wind and buoyancy driven air flow.
CIBSE Guide A (also quoted in Part L of IrishBuilding Regulations)• Space temperature should not exceed 28°C for
more than 1% of the annual occupied hours.
Dept of Education (taken from BRE “office ofthe future” report)• The dry resultant temperature should not
exceed 25°C for more than 5% of the school year in all habitable rooms and teaching spaces.
Mon Tue Wed Thu Fri Sat Sun Mon
550
500
450
400
350
300
250
200
150
100
50
0
Vol
ume
flow
(l/s
)
22
20
18
16
14
12
10
8
6
4
2
0
Speed (m
/s)
Date: Mon 19/Sep to Sun 25/Sep
MacroFlo external vent: STFR-01-Staff Room (latest rooms.aps)
Wind speed: Dublin89.fwt (Dublin89.fwt)
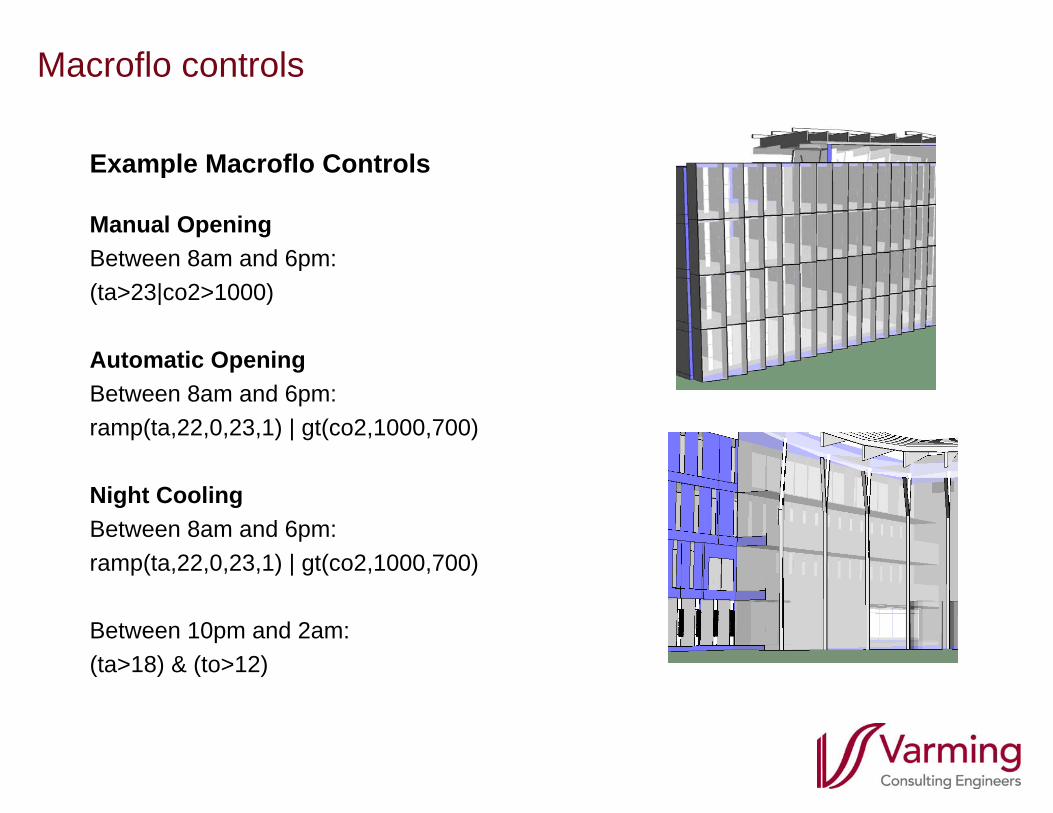
Macroflo controls
Example Macroflo Controls
Manual OpeningBetween 8am and 6pm:(ta>23|co2>1000)
Automatic OpeningBetween 8am and 6pm:ramp(ta,22,0,23,1) | gt(co2,1000,700)
Night CoolingBetween 8am and 6pm:ramp(ta,22,0,23,1) | gt(co2,1000,700)
Between 10pm and 2am:(ta>18) & (to>12)
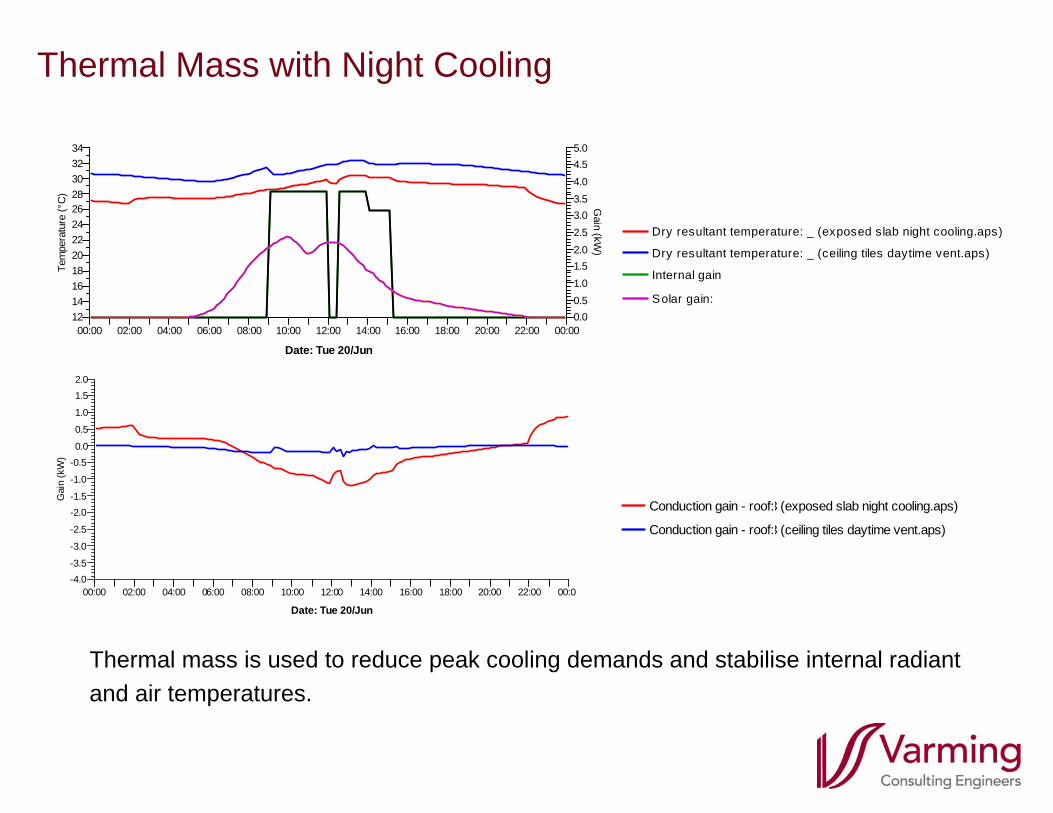
Thermal Mass with Night Cooling
00:00 02:00 04:00 06:00 08:00 10:00 12:00 14:00 16:00 18:00 20:00 22:00 00:00
2.01.5
1.0
0.5
0.0-0.5
-1.0
-1.5-2.0
-2.5
-3.0
-3.5-4.0
Gai
n (k
W)
Date: Tue 20/Jun
3 (exposed slab night cooling.aps)
3 (ceiling tiles daytime vent.aps)
00:00 02:00 04:00 06:00 08:00 10:00 12:00 14:00 16:00 18:00 20:00 22:00 00:00
343230282624222018161412
Tem
pera
ture
(°C
)
5.04.54.03.53.02.52.01.51.00.50.0
Gain (kW
)
Date: Tue 20/Jun
Dry resultant temperature: _ (exposed slab night cooling.aps)
Dry resultant temperature: _ (ceiling tiles daytime vent.aps)
Solar gain:
Internal gain
Conduction gain - roof:
Conduction gain - roof:
Thermal mass is used to reduce peak cooling demands and stabilise internal radiantand air temperatures.
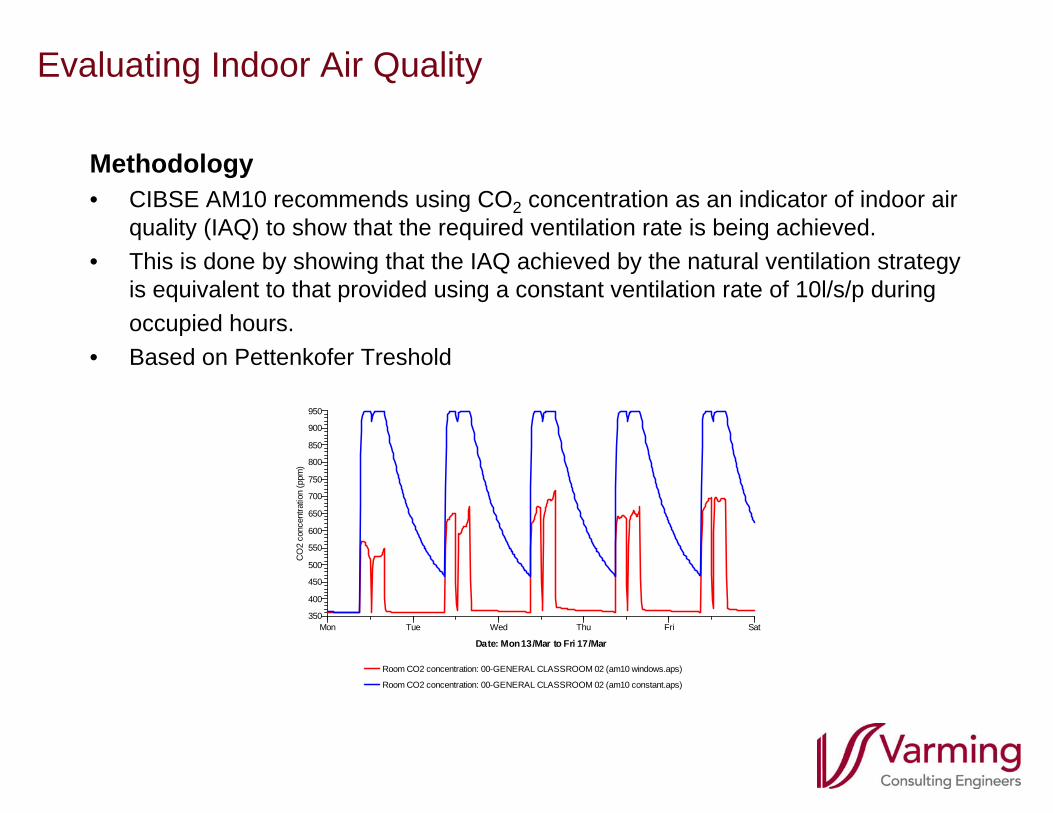
Evaluating Indoor Air Quality
Methodology• CIBSE AM10 recommends using CO2 concentration as an indicator of indoor air
quality (IAQ) to show that the required ventilation rate is being achieved. • This is done by showing that the IAQ achieved by the natural ventilation strategy
is equivalent to that provided using a constant ventilation rate of 10l/s/p duringoccupied hours.
• Based on Pettenkofer Treshold
Mon Tue Wed Thu Fri Sat
950
900
850
800
750
700
650
600
550
500
450
400
350
CO
2 co
ncen
tratio
n (p
pm)
Date: Mon 13/Mar to Fri 17/Mar
Room CO2 concentration: 00-GENERAL CLASSROOM 02 (am10 windows.aps)
Room CO2 concentration: 00-GENERAL CLASSROOM 02 (am10 constant.aps)
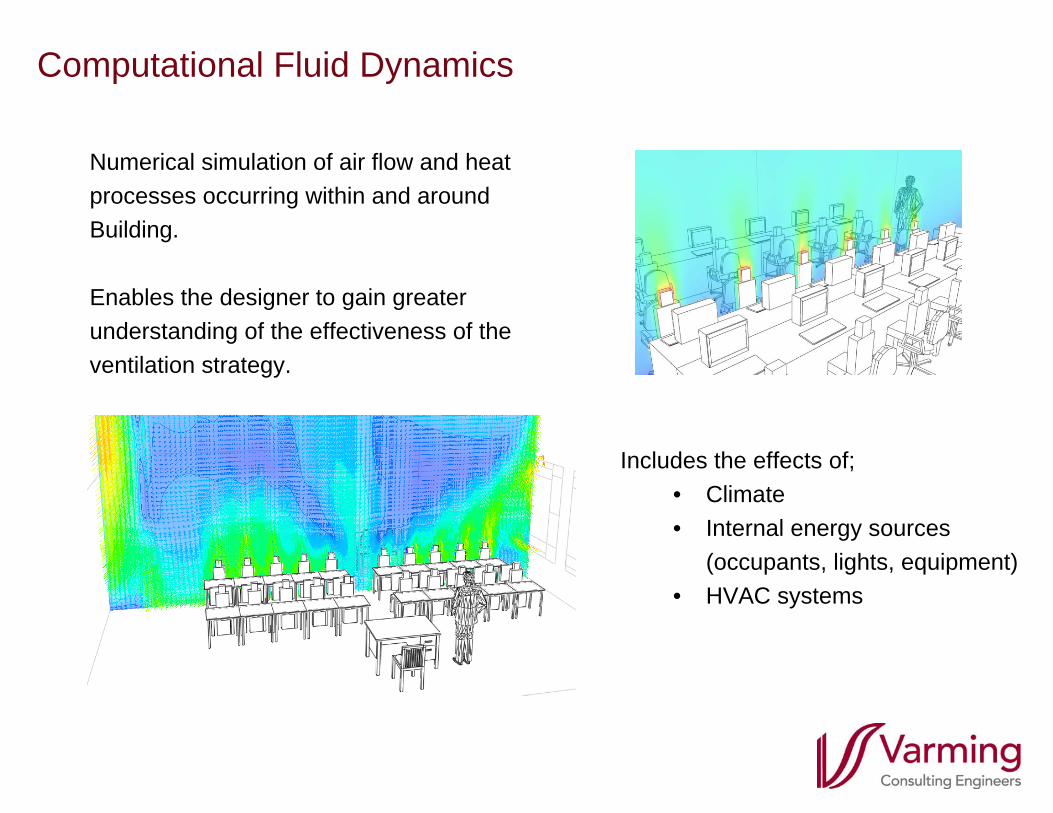
Computational Fluid Dynamics
Numerical simulation of air flow and heatprocesses occurring within and aroundBuilding.
Enables the designer to gain greaterunderstanding of the effectiveness of theventilation strategy.
Includes the effects of;• Climate• Internal energy sources
(occupants, lights, equipment)• HVAC systems
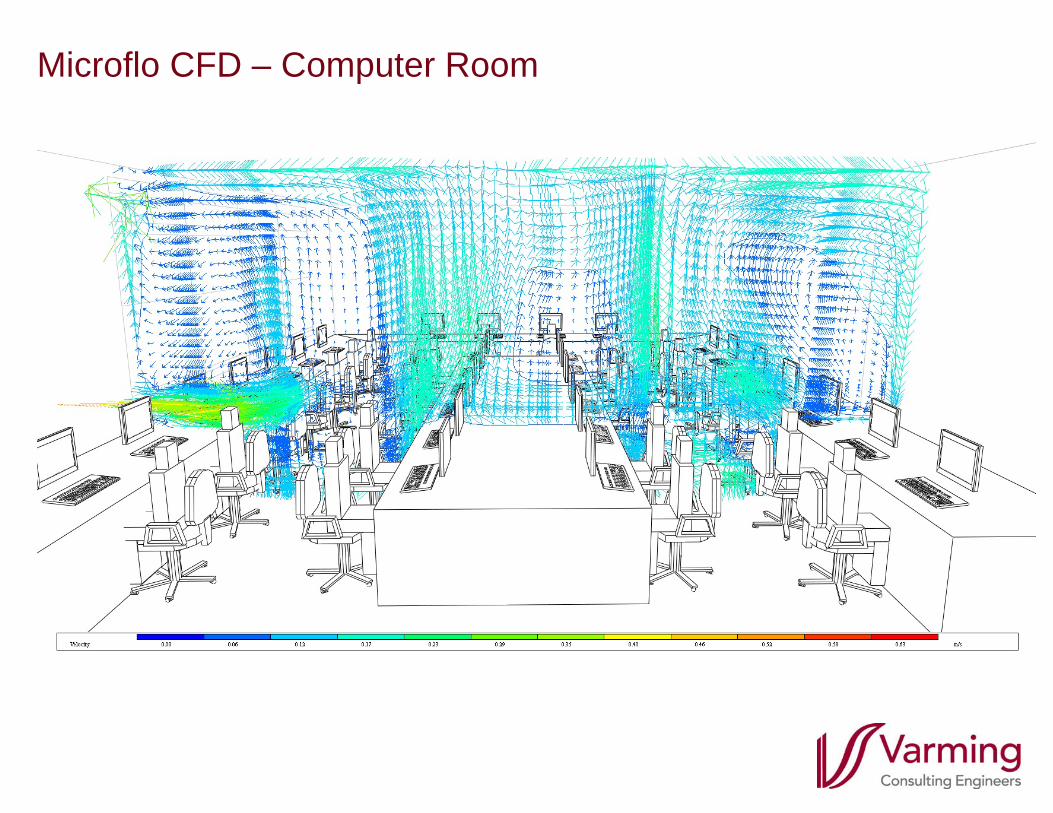
Microflo CFD – Computer Room
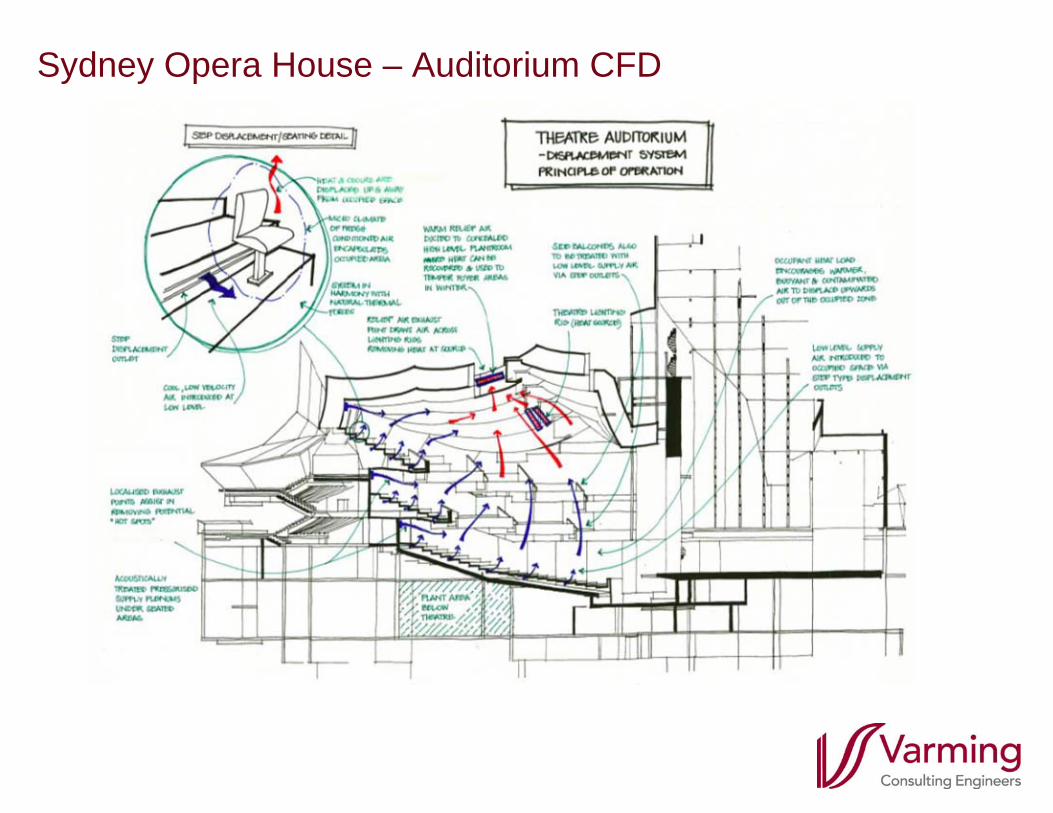
Sydney Opera House – Auditorium CFD
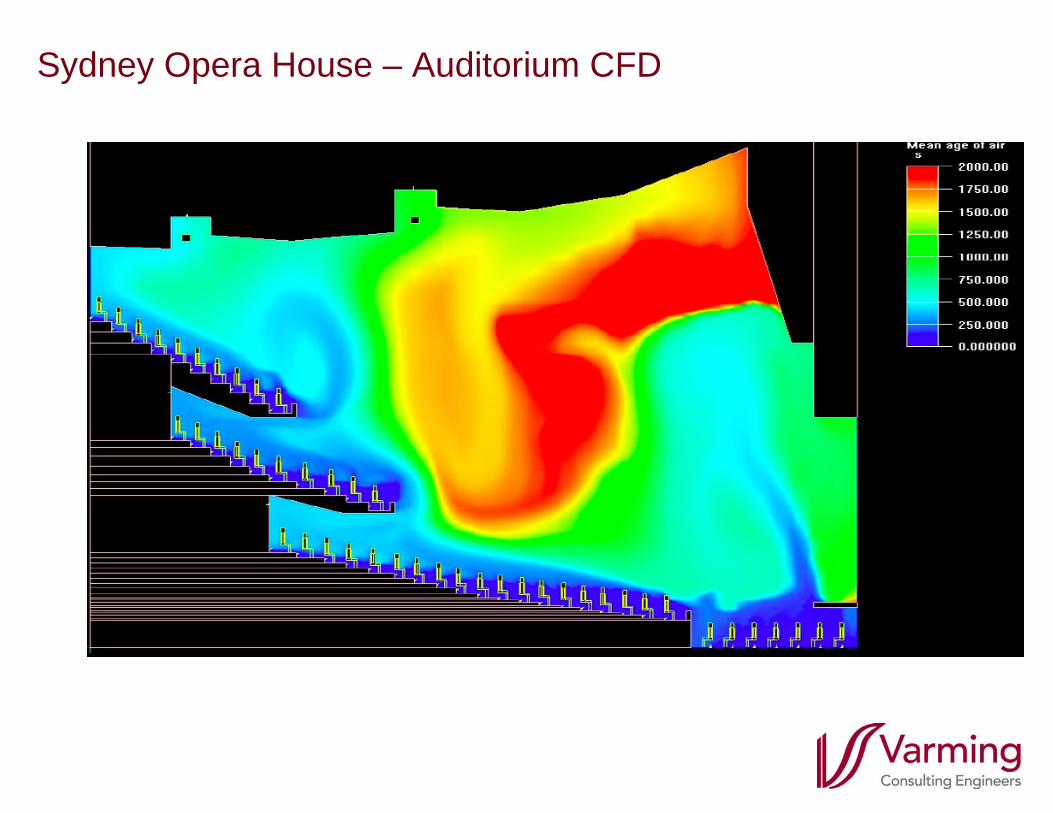
Sydney Opera House – Auditorium CFD
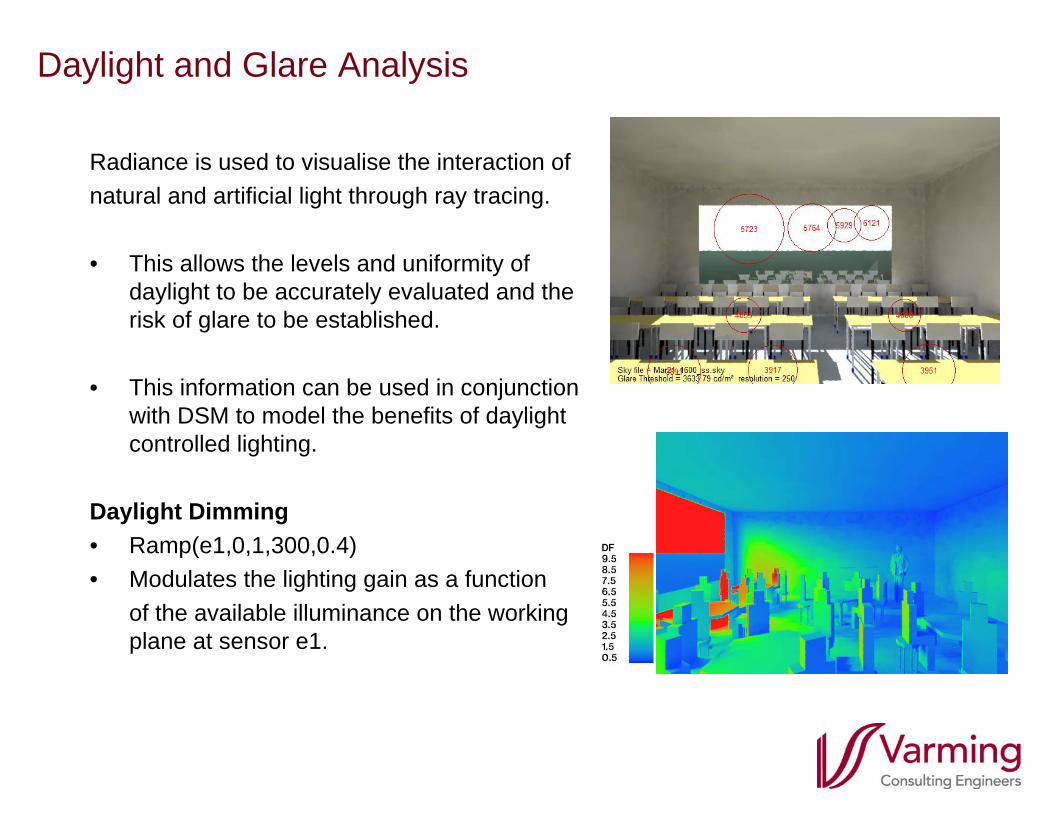
Daylight and Glare Analysis
Radiance is used to visualise the interaction ofnatural and artificial light through ray tracing.
• This allows the levels and uniformity of daylight to be accurately evaluated and the risk of glare to be established.
• This information can be used in conjunction with DSM to model the benefits of daylight controlled lighting.
Daylight Dimming• Ramp(e1,0,1,300,0.4)• Modulates the lighting gain as a function
of the available illuminance on the working plane at sensor e1.
Energy Analysis – MVEC Multi-User Campus
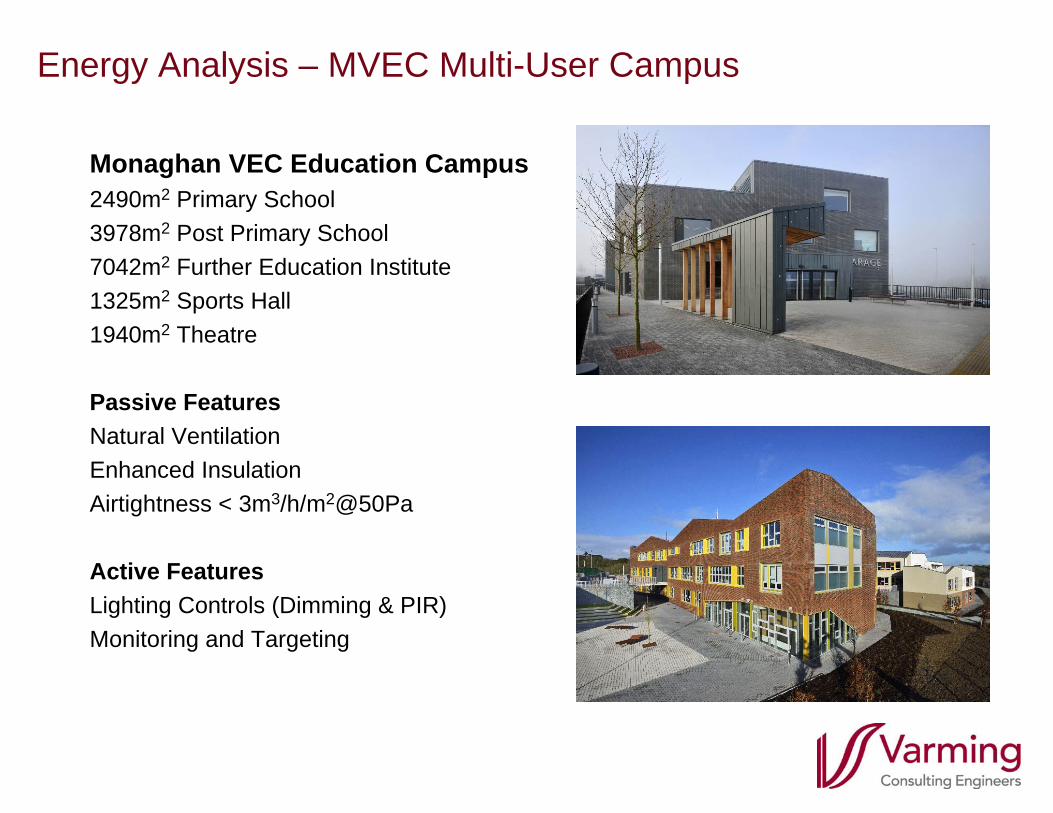
Monaghan VEC Education Campus2490m2 Primary School3978m2 Post Primary School7042m2 Further Education Institute1325m2 Sports Hall1940m2 Theatre
Passive FeaturesNatural VentilationEnhanced InsulationAirtightness < 3m3/h/m2@50Pa
Active FeaturesLighting Controls (Dimming & PIR)Monitoring and Targeting
Energy Analysis – MVEC Multi-User Campus
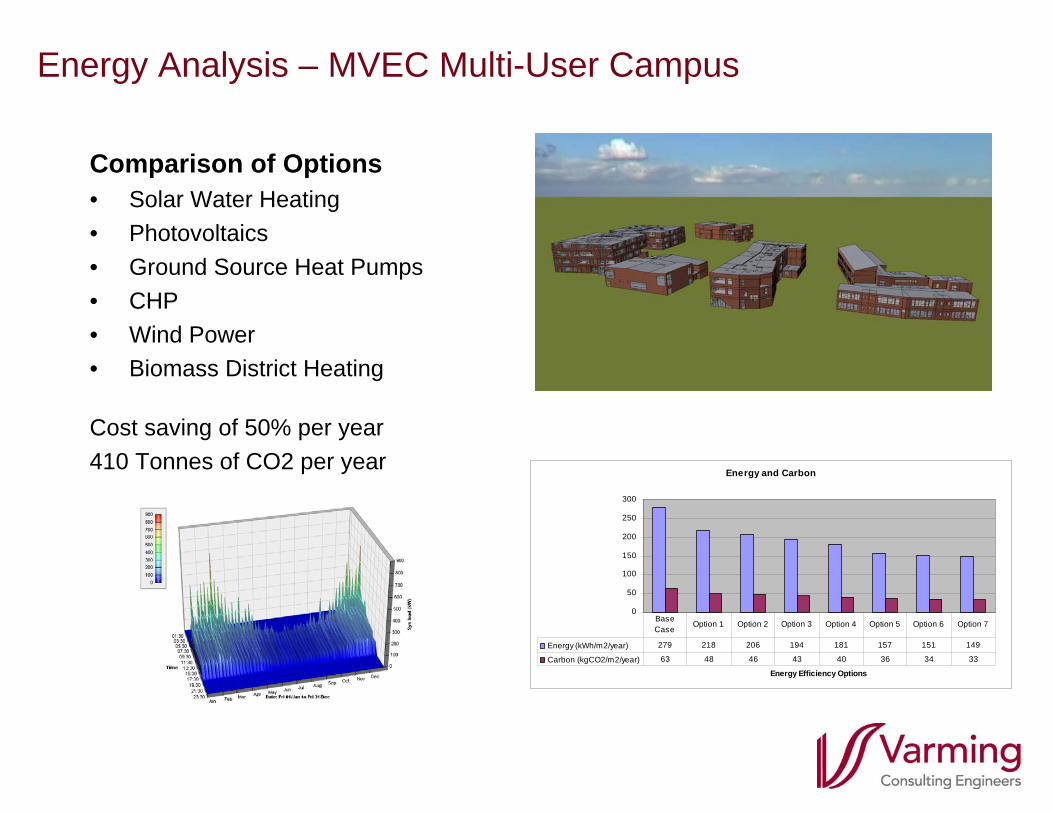
Comparison of Options• Solar Water Heating• Photovoltaics• Ground Source Heat Pumps• CHP• Wind Power• Biomass District Heating
Cost saving of 50% per year410 Tonnes of CO2 per year
Energy and Carbon
0
50
100
150
200
250
300
Energy Efficiency Options
Energy (kWh/m2/year) 279 218 206 194 181 157 151 149
Carbon (kgCO2/m2/year) 63 48 46 43 40 36 34 33
Base Case
Option 1 Option 2 Option 3 Option 4 Option 5 Option 6 Option 7
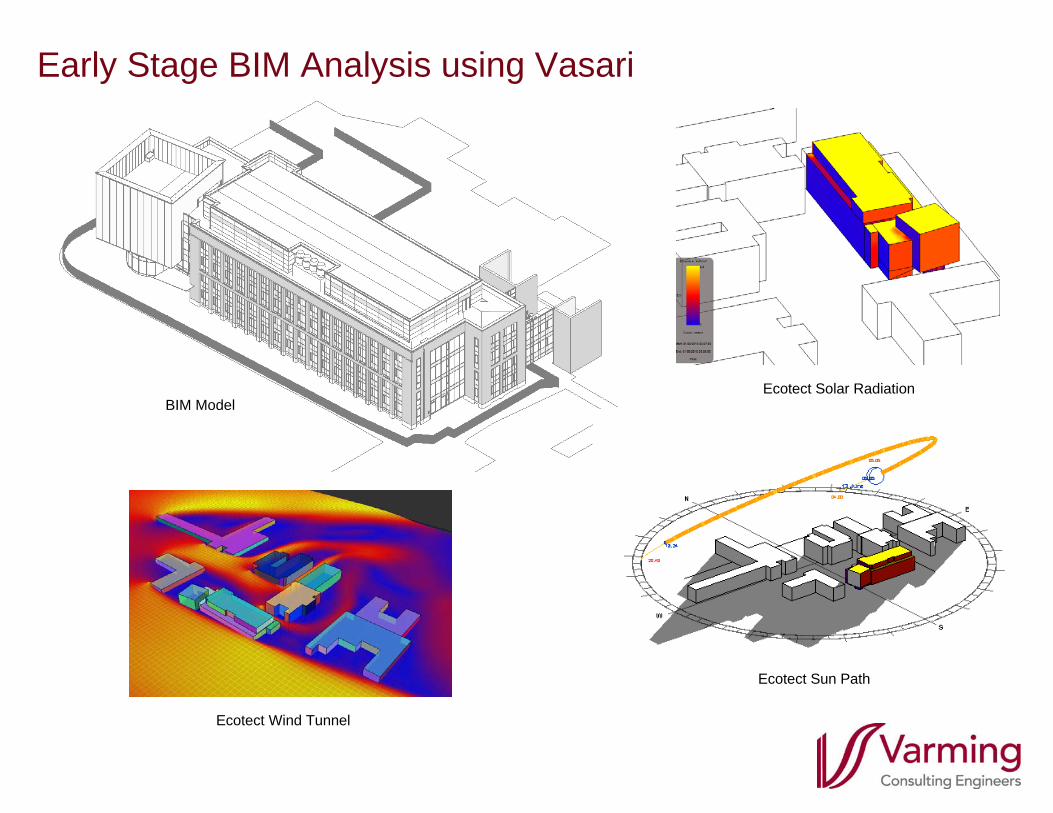
BIM Model
Ecotect Wind Tunnel
Ecotect Sun Path
Ecotect Solar Radiation
Early Stage BIM Analysis using Vasari
Early Stage BIM Analysis using Vasari
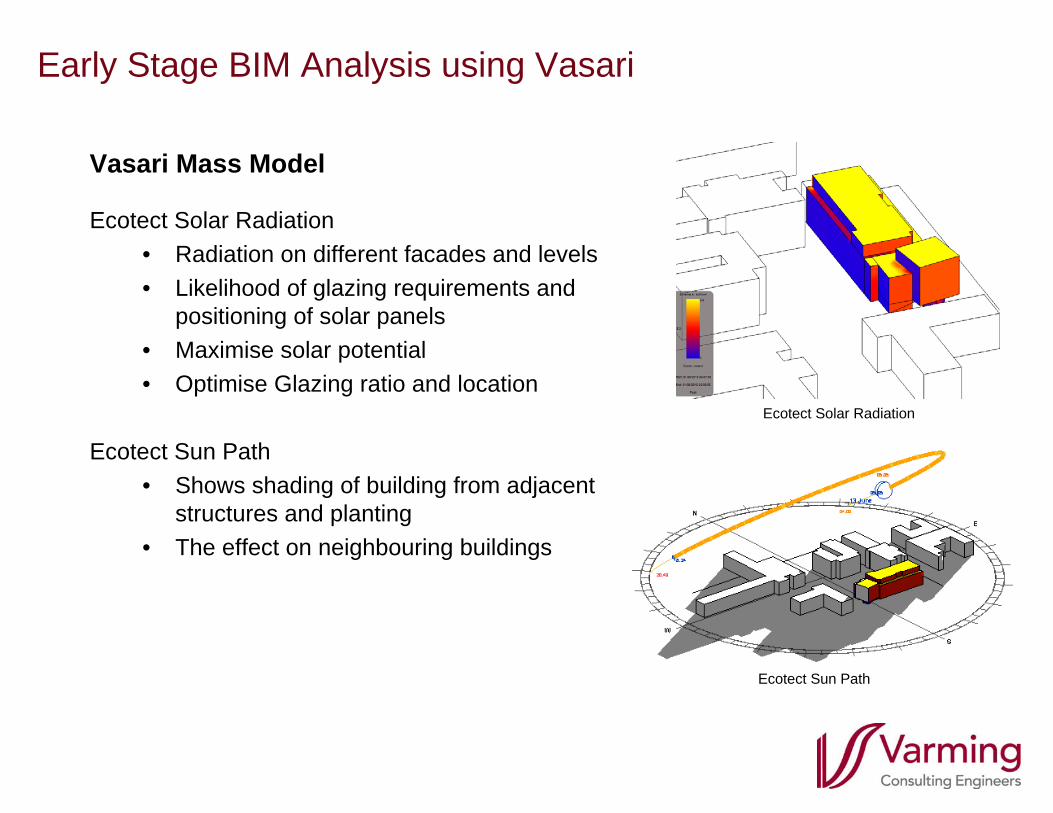
Ecotect Sun Path
Ecotect Solar Radiation
Vasari Mass Model
Ecotect Solar Radiation• Radiation on different facades and levels• Likelihood of glazing requirements and
positioning of solar panels• Maximise solar potential• Optimise Glazing ratio and location
Ecotect Sun Path• Shows shading of building from adjacent
structures and planting• The effect on neighbouring buildings
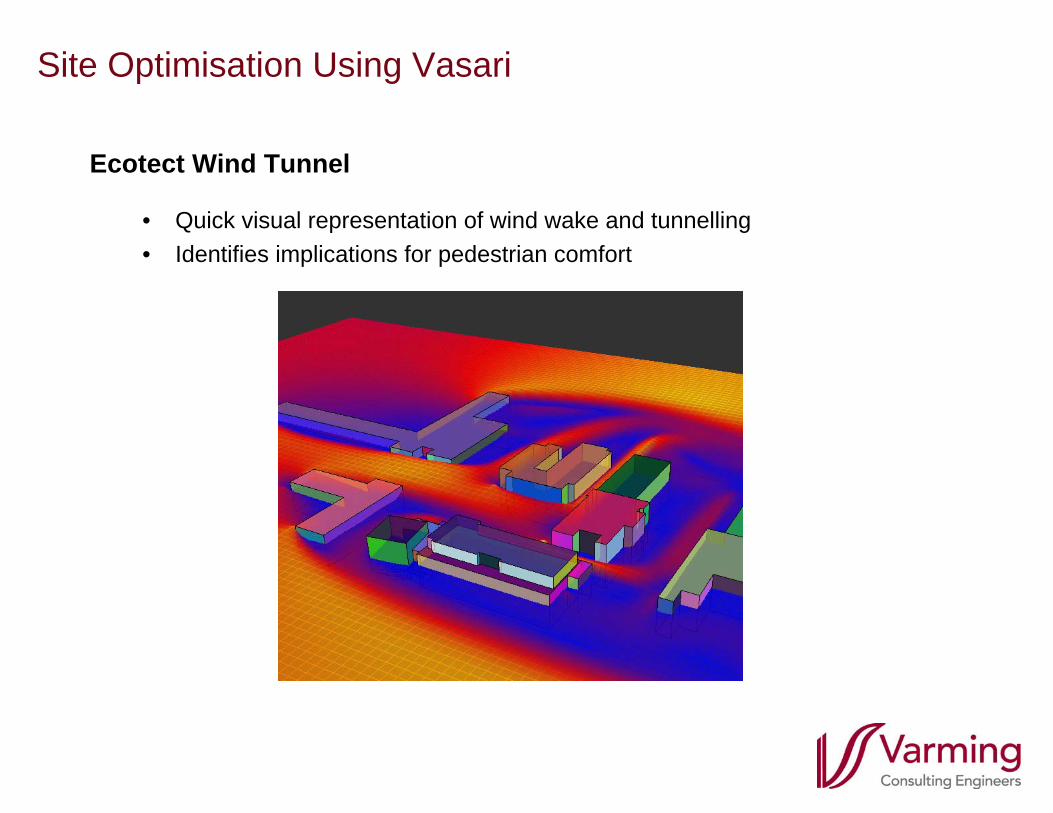
Site Optimisation Using Vasari
Ecotect Wind Tunnel
• Quick visual representation of wind wake and tunnelling• Identifies implications for pedestrian comfort
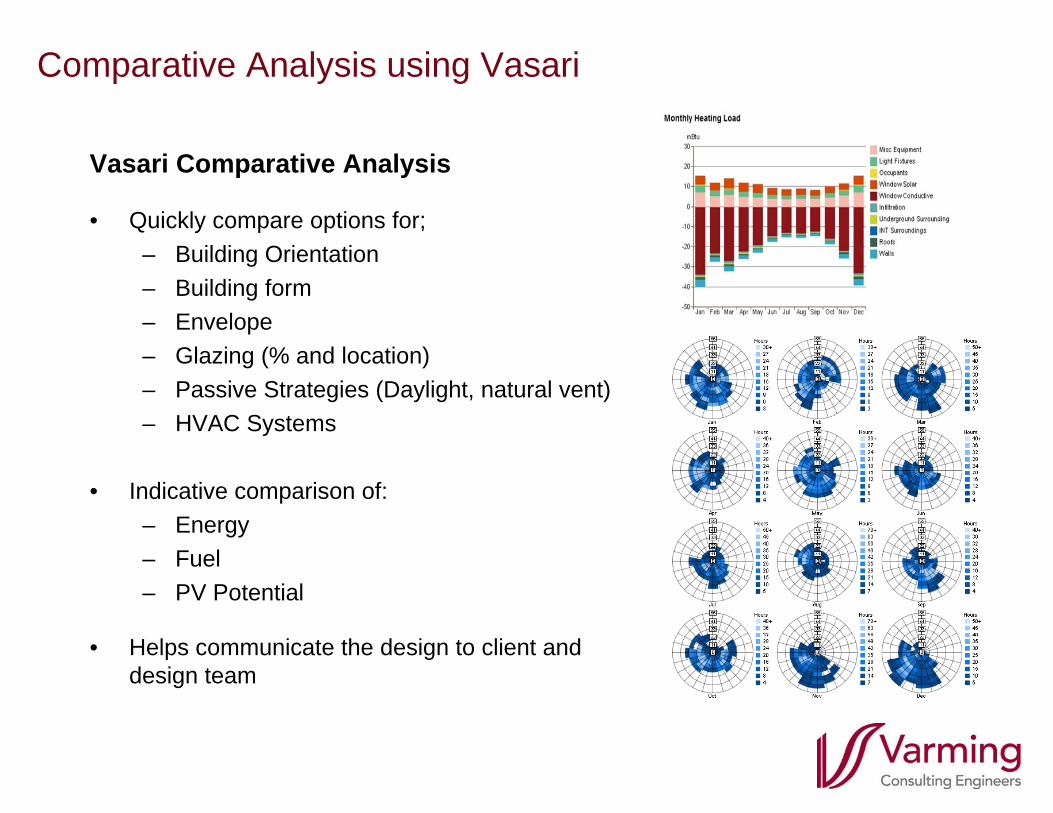
Vasari Comparative Analysis
• Quickly compare options for;– Building Orientation– Building form– Envelope– Glazing (% and location)– Passive Strategies (Daylight, natural vent)– HVAC Systems
• Indicative comparison of:– Energy– Fuel– PV Potential
• Helps communicate the design to client and design team
Comparative Analysis using Vasari
BIM Based Analysis Tools
Objectives and Limitations
Key Objectives• Obtain quick response to design options• Seek to influence and direct early stage building design. • Identifyy areas for final validation and fine tuning• Produce early documentation for code compliance• Promote inclusive design team collaborative working
Main Limitations and Barriers • Needs to rely on generic inputs for the analysis of systems, fabric and
occupancy for use• Performed at Concept Stage and leads only to indicative evaluation
BIM Based Analysis Tools
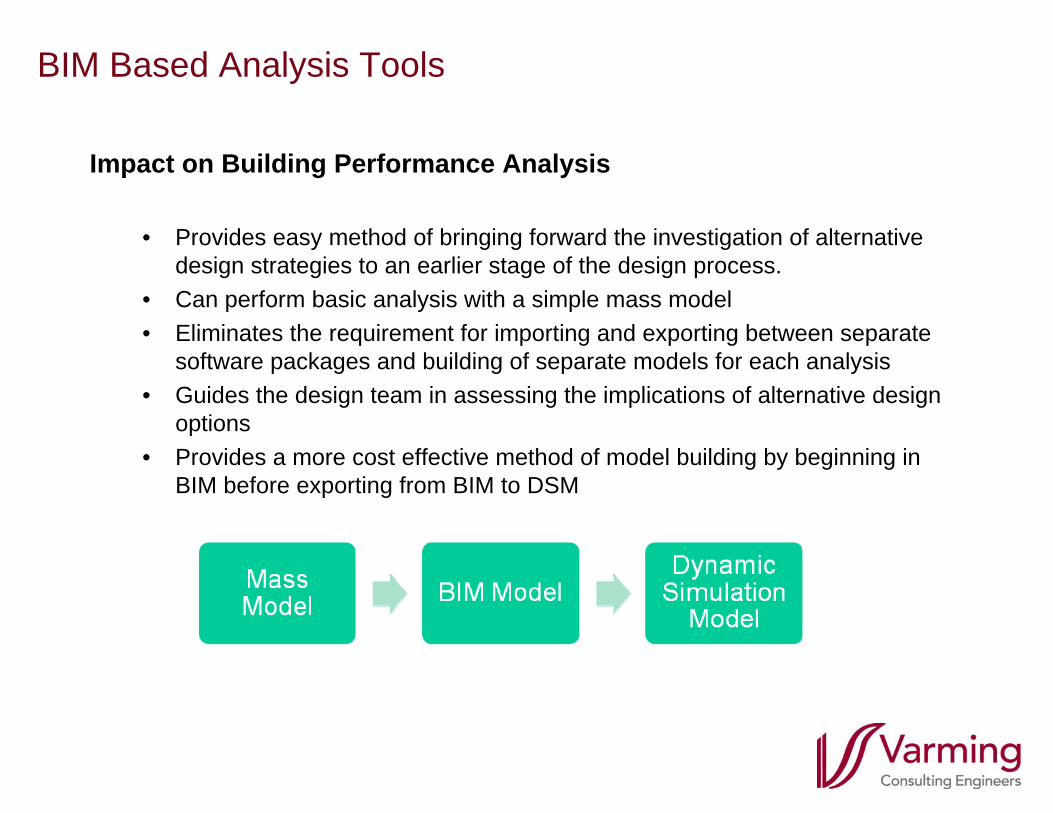
Impact on Building Performance Analysis
• Provides easy method of bringing forward the investigation of alternative design strategies to an earlier stage of the design process.
• Can perform basic analysis with a simple mass model• Eliminates the requirement for importing and exporting between separate
software packages and building of separate models for each analysis• Guides the design team in assessing the implications of alternative design
options• Provides a more cost effective method of model building by beginning in
BIM before exporting from BIM to DSM
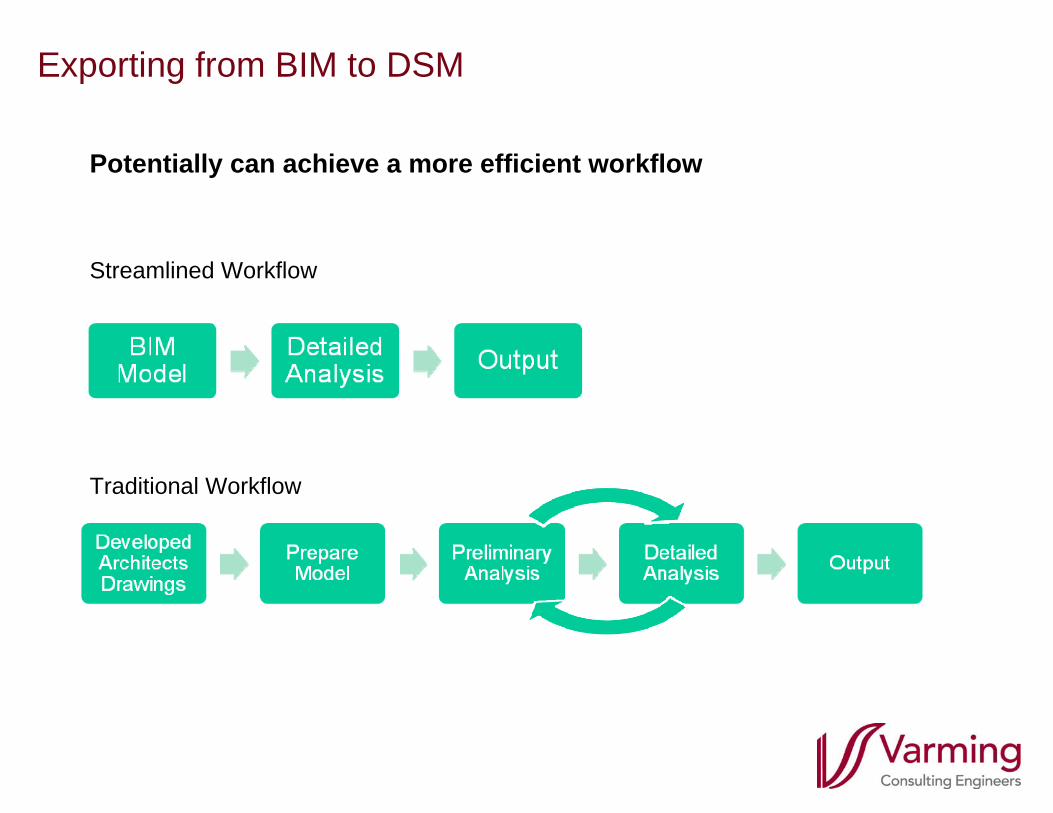
Exporting from BIM to DSM
Potentially can achieve a more efficient workflow
Traditional Workflow
Streamlined Workflow
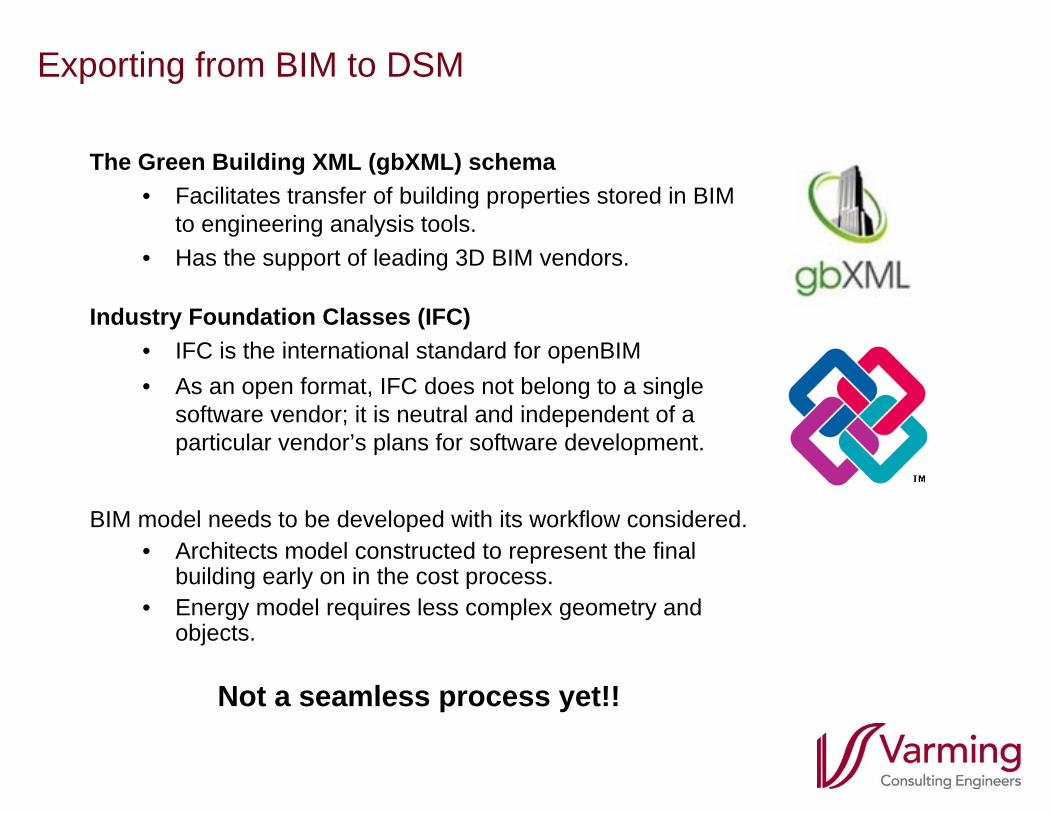
Exporting from BIM to DSM
The Green Building XML (gbXML) schema• Facilitates transfer of building properties stored in BIM
to engineering analysis tools. • Has the support of leading 3D BIM vendors.
Industry Foundation Classes (IFC)• IFC is the international standard for openBIM• As an open format, IFC does not belong to a single
software vendor; it is neutral and independent of a particular vendor’s plans for software development.
BIM model needs to be developed with its workflow considered.• Architects model constructed to represent the final
building early on in the cost process.• Energy model requires less complex geometry and
objects.
Not a seamless process yet!!
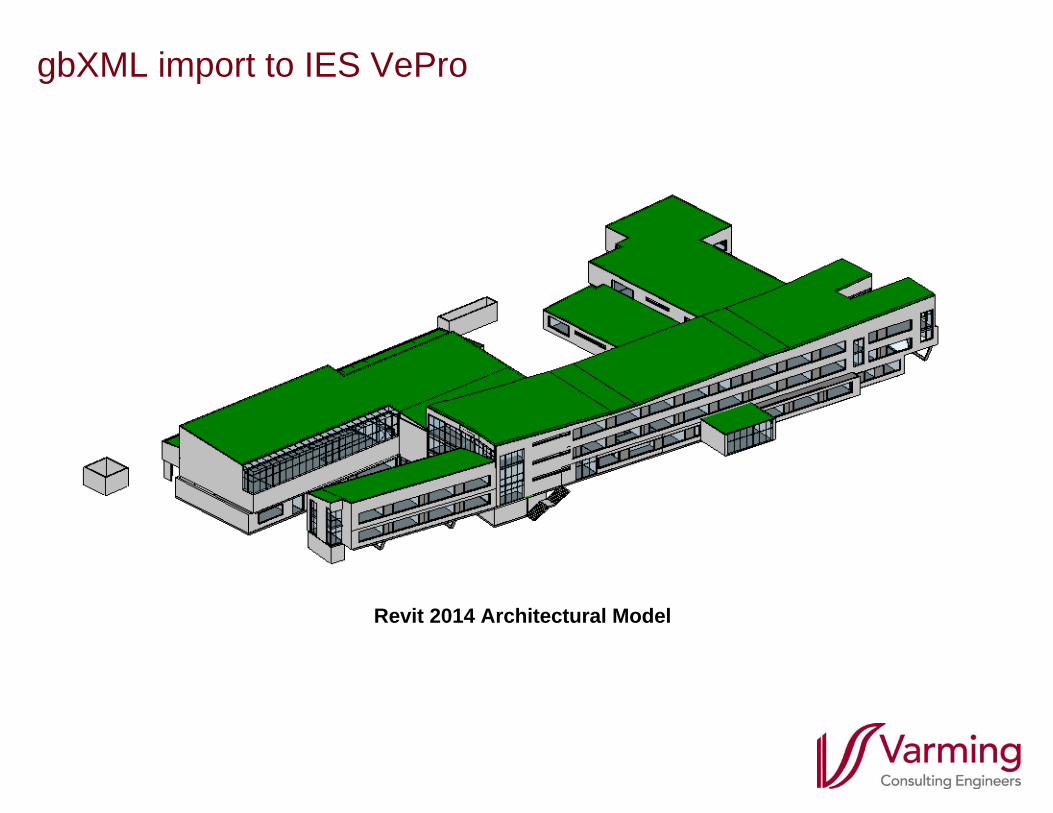
gbXML import to IES VePro
Revit 2014 Architectural Model
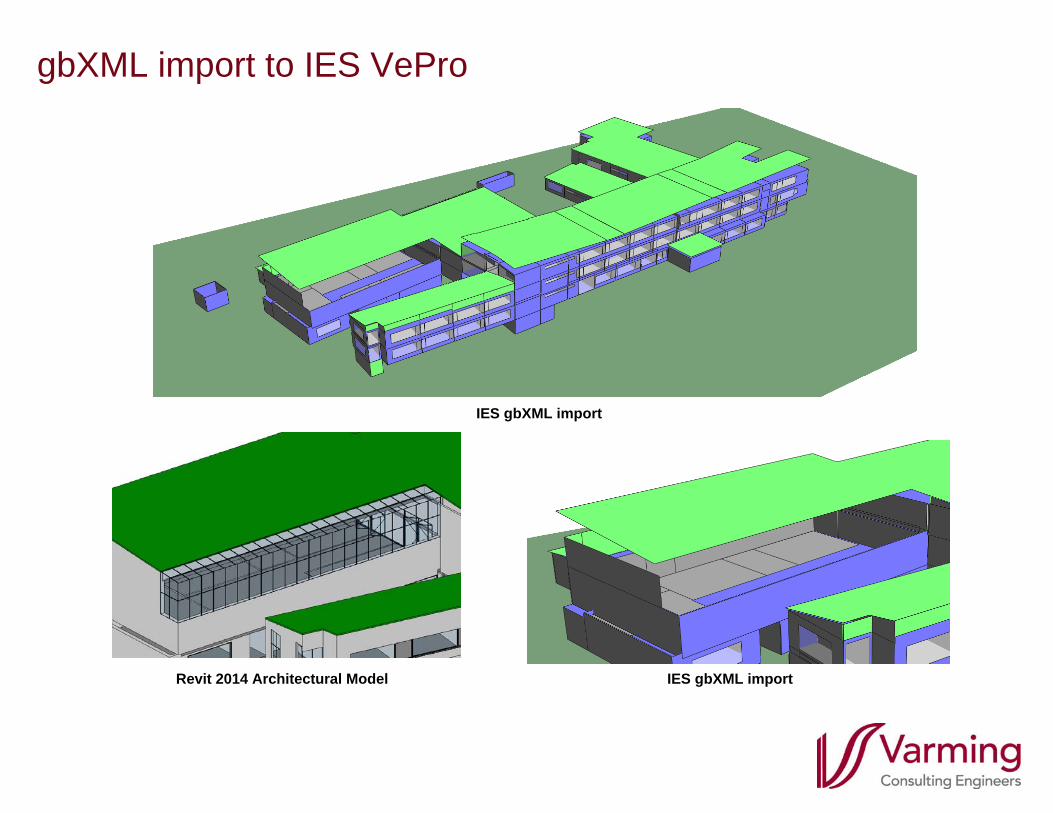
gbXML import to IES VePro
Revit 2014 Architectural Model IES gbXML import
IES gbXML import
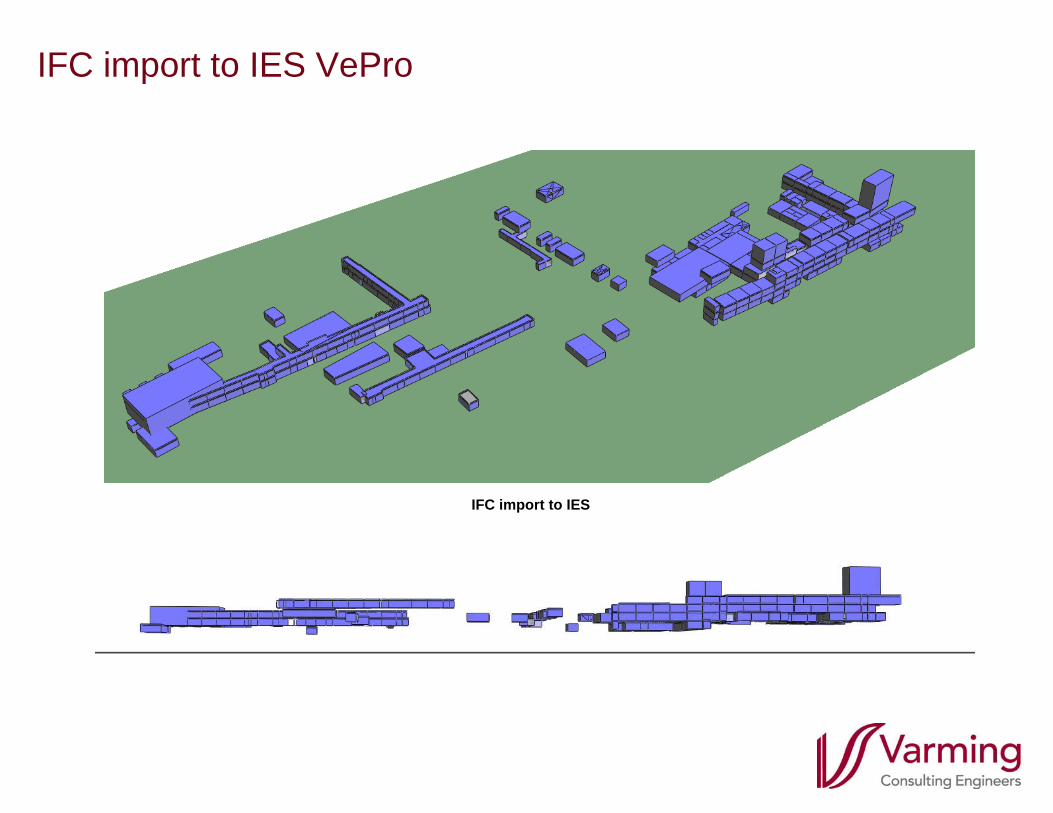
IFC import to IES VePro
IFC import to IES
Exporting from BIM to DSM
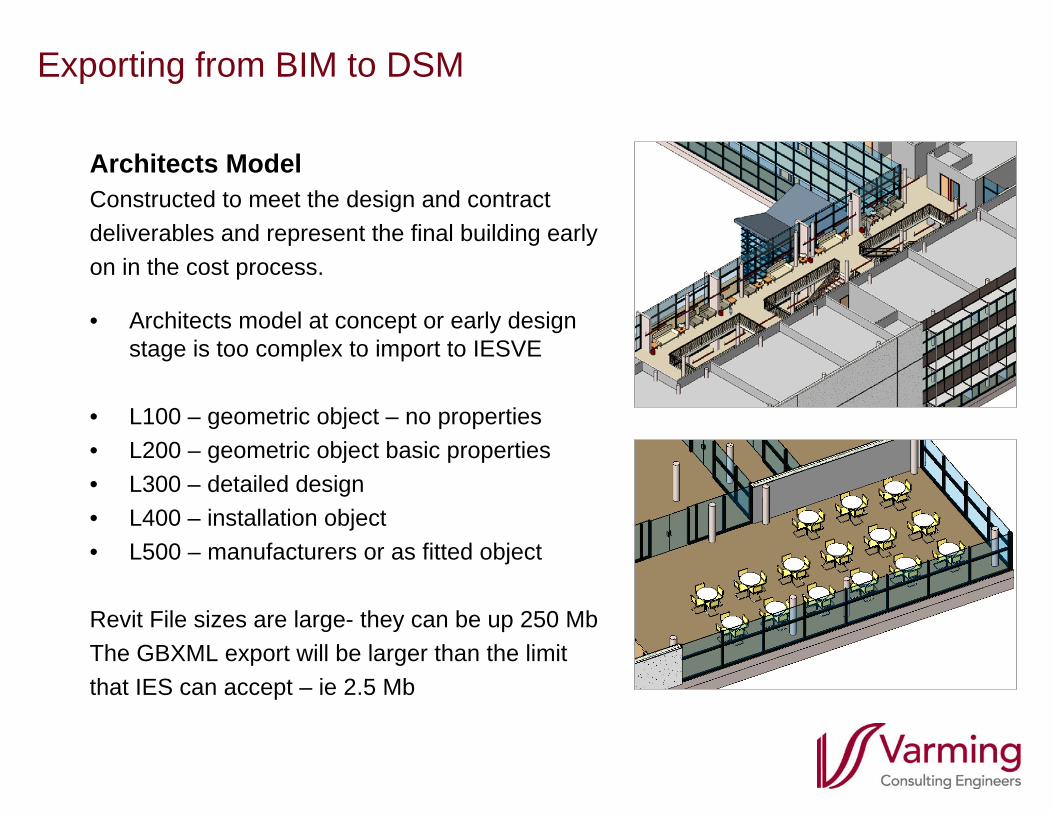
Architects ModelConstructed to meet the design and contractdeliverables and represent the final building earlyon in the cost process.
• Architects model at concept or early design stage is too complex to import to IESVE
• L100 – geometric object – no properties• L200 – geometric object basic properties• L300 – detailed design• L400 – installation object• L500 – manufacturers or as fitted object
Revit File sizes are large- they can be up 250 MbThe GBXML export will be larger than the limitthat IES can accept – ie 2.5 Mb
Exporting from BIM to DSM
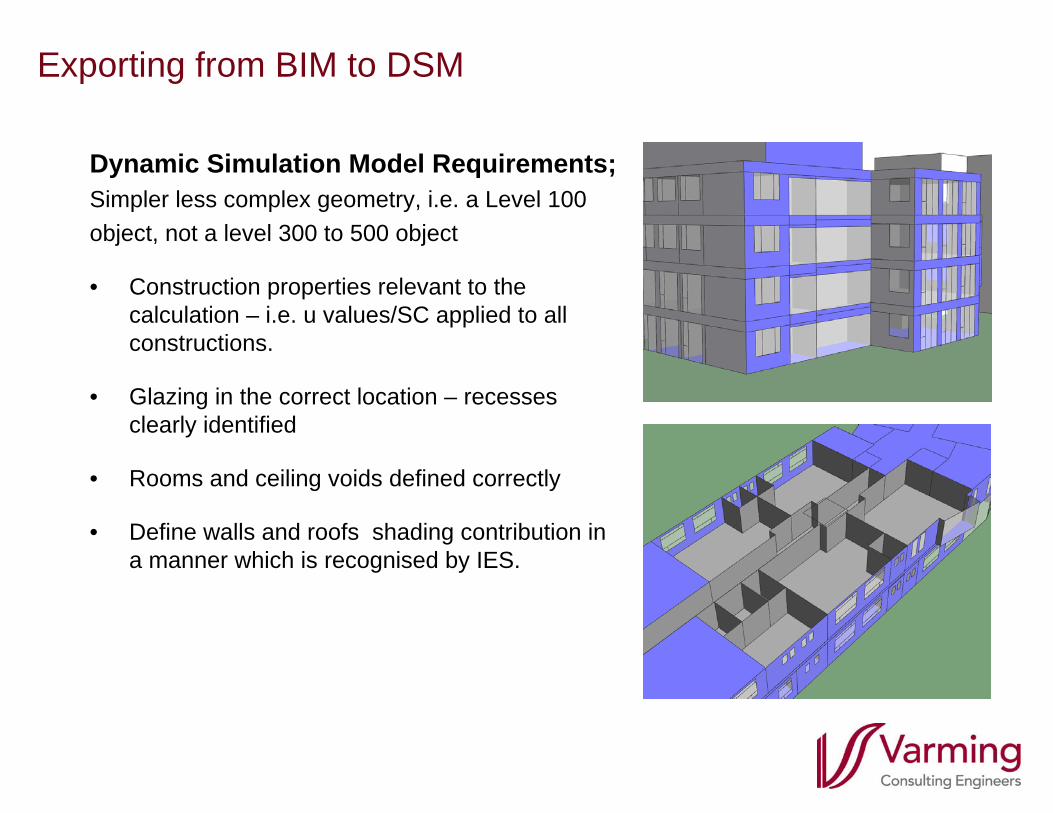
Dynamic Simulation Model Requirements;Simpler less complex geometry, i.e. a Level 100object, not a level 300 to 500 object
• Construction properties relevant to the calculation – i.e. u values/SC applied to all constructions.
• Glazing in the correct location – recesses clearly identified
• Rooms and ceiling voids defined correctly
• Define walls and roofs shading contribution in a manner which is recognised by IES.
Building Regulations Compliance / Energy Analysis
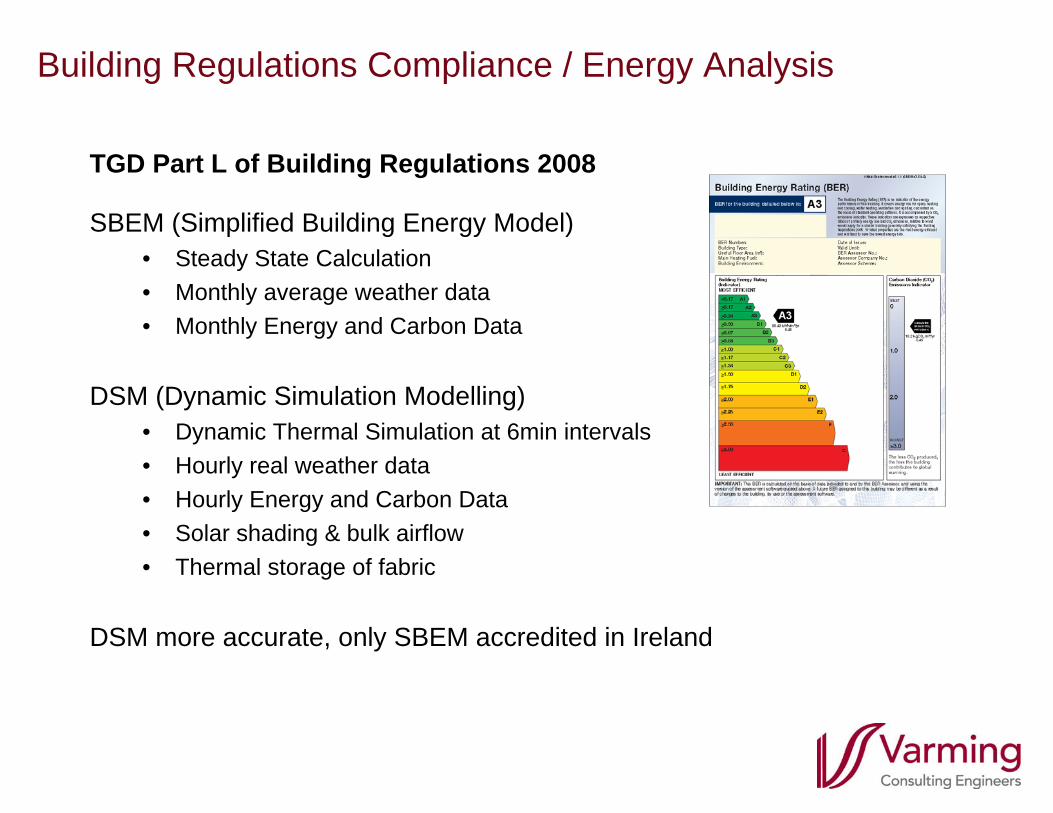
TGD Part L of Building Regulations 2008
SBEM (Simplified Building Energy Model)• Steady State Calculation• Monthly average weather data• Monthly Energy and Carbon Data
DSM (Dynamic Simulation Modelling)• Dynamic Thermal Simulation at 6min intervals• Hourly real weather data• Hourly Energy and Carbon Data• Solar shading & bulk airflow• Thermal storage of fabric
DSM more accurate, only SBEM accredited in Ireland
Energy Analysis/ Building Energy Rating
Compliance Calculation
Includes regulated energy use• Heating• Hot Water• Cooling• Lighting• Ventilation• Fixed occupancy and operating hours
Does not include unregulated energy use• ICT (servers, telecoms etc)• Small power• Lifts, medical equipment etc• Extended operating hours or occupant density
Energy Analysis - The Performance Gap
0
20
40
60
80
100
120
140
160
180
Car
bon
Emis
sion
s - k
gCO
2/m2 /y
ear
General Office Schools UniversityCampus
Hospitals
Sectors
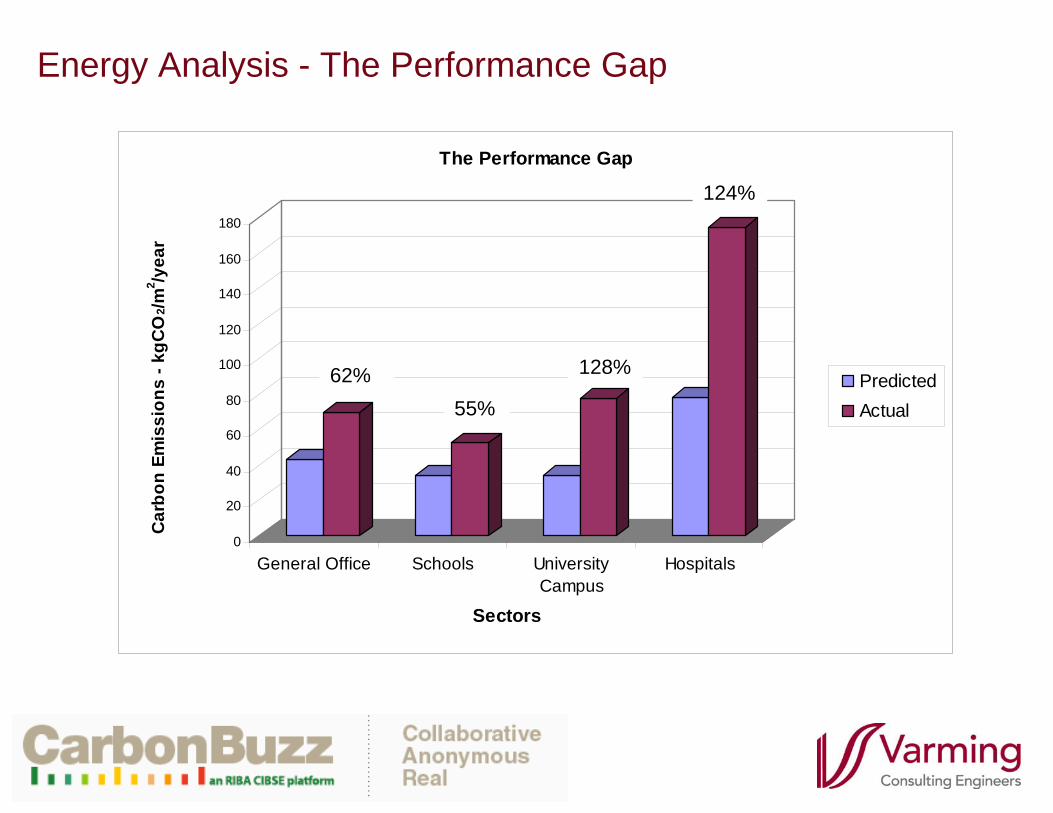
The Performance Gap
PredictedActual
62%55%
128%
124%
Energy Analysis - The Performance Gap
Causes of The Performance Gap
Use of Simplified Models• Assumptions at early stage• Simplified Calculation
Building changes during Design Process• Building fabric, extent of services and controls• Workmanship• Hours of Operation
Occupants• Uncertainties associated with occupant behaviour
Commissioning, Controls, Energy Management• Control of building systems
IES Research Projects
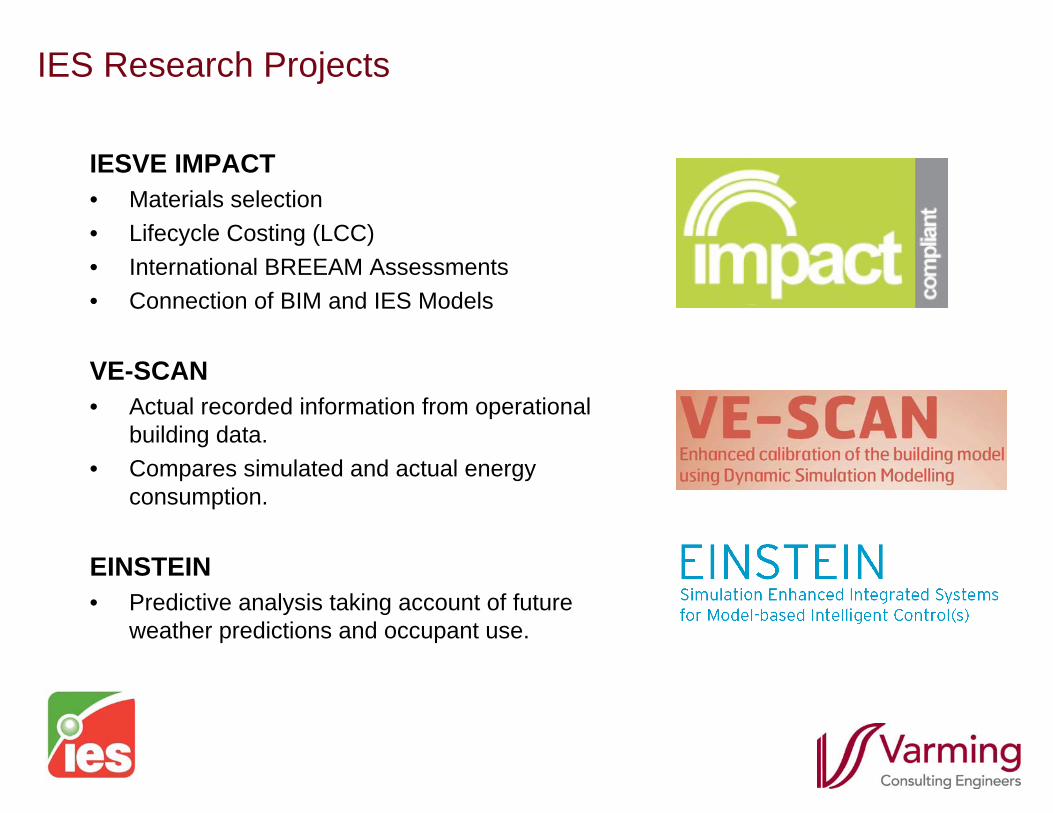
IESVE IMPACT• Materials selection• Lifecycle Costing (LCC)• International BREEAM Assessments• Connection of BIM and IES Models
VE-SCAN• Actual recorded information from operational
building data.• Compares simulated and actual energy
consumption.
EINSTEIN• Predictive analysis taking account of future
weather predictions and occupant use.
Conclusions
The BIM paradigm can accommodate earlier building performance analysisinput but is not suited to using Dynamic Simulation Modelling software fordetailed analysis at Concept Stage.
However, during early planning and concept stages, the opportunity exists forresults obtained from BIM based comparative analysis to evaluate thefeasibility of design concepts, allowing earlier engagement with the designand documentation process.
At detailed design stage Dynamic Simulation Modelling can then be used in acost effective manner for the testing, validation, fine-tuning and incorporationof design features established earlier.
In future there is potential for Dynamic Simulation and BIM models to be usedfor post-occupancy energy monitoring and predictive evaluation of futureweather scenarios.