15th Fiscal Period 17, 2014 1. 15th FP Performance 4. Characteristics of NRF Ø 15th FP Financial...
43
PROUD FLAT Kamata II PROUD FLAT Kawaramachi PROUD FLAT Tsurumi II PROUD FLAT Shinotsuka (Ended May 31, 2014) Analyst Meeting Presentation Material July 17, 2014 15th Fiscal Period
Transcript of 15th Fiscal Period 17, 2014 1. 15th FP Performance 4. Characteristics of NRF Ø 15th FP Financial...
PROUD FLAT Kamata II
PROUD FLAT Kawaramachi PROUD FLAT Tsurumi II PROUD FLAT Shinotsuka
(Ended May 31, 2014)
Analyst Meeting Presentation Material
July 17, 2014
15th Fiscal Period

July 17, 2014
1. 15th FP Performance 4. Characteristics of NRF
・15th FP Financial Statement Overview 2 ・ Characteristics of NRF 23
・Highlights of the 15th Fiscal Period 3 ・ Rental Housing Investment Characteristics 24
・ Priority Investment in Key Segments 25
・ Rental Housing Investment Characteristics 26
2. Performance and Future Management Policy ・ Utilization of Diverse Sourcing Routes 27
・ Continuing Implementation of Strategy for 5 ・ Portfolio Status 28
Replacing Properties ・ Changes in Revenue 29
・ Portfolio Occupancy Rate 6 ・ Portfolio Map(Greater Tokyo Area) 30
・ Changes in Leased Units and Rent Level 7 ・ Portfolio Map(Other Areas) 31
・ Changes in Rent per Tsubo: Map by Area ① 8 ・ Portfolio 32~36
・ Changes in Rent per Tsubo: Map by Area ② 9 ・ Changes in Financial Performance 37
・ Unification of Property Names and Merger of 10 ・ Interest-bearing Debts 38
Property Management Companies ・ Fund Profile 39
・ Financial Status 11 ・ Asset Management Company Overview 40
・ Management Strategies 12
APPENDIX
3. Details of the Financial Results
・ Income statement 15
・ Balance Sheet 16
・ Forecasts for the 16th Fiscal Period 17
・ Changes in Asset Size 18
・ Unitholders 19
・ Appraisal Value Status 20
・ Changes in Investment Unit Price and Cash 21
Distribution
Contents
1
15th FP Performance
PROUD FLAT Kamata II

8,000
9,000
10,000
11,000
12,000
13,000
第14期分配金(2013年11月期)
保有物件 一棟貸テナント退去
物件売却 その他 第15期分配金(2014年5月期)
保有物件 一棟貸リテナント
物件売却 その他 圧縮積立金 第16期分配金(2014年11月期)
(円/口)
2
¥5,406 million
¥1,965 million
¥12,221
¥2,558 million
¥5,594 million
¥1,955 million
¥12,161
¥2,513 million
+ 3.5 %
- 0.5 %
- 0.5 %
- 1.7 %
¥5,406 million
¥1,825 million
¥11,600
¥2,382 million
- 3.3 %
- 6.7 %
- 4.6 %
- 5.2 %
・ Rent and Common
–area Fees
- ¥ 51
・ Key Money and
Renewal Fees
+ ¥ 304
・ Expenses on
Commission Fees,
etc.
- ¥ 209
・ Repair and
Maintenance
- ¥ 315
・Other
- ¥ 53
・ 4th PO acquisition
properties full-period
contribution ※2.
+ ¥ 816
・ Consumption tax
increase
- ¥ 110
・ Other
+ ¥ 150
・ PROUD FLAT
Kamioooka
- ¥ 296
・ PRIME URBAN
Nishi Waseda
- ¥ 49 ・ Provision for reserve
for reduction entry
+ ¥ 249
・ Periodic revenue
- ¥ 164
・ Disposition revenue
Difference
(previous period)
- ¥ 82 ※
※15FP Disposition
revenue
¥ 232 ( )
※2. 4th PO acquisition properties refer to “URBAN STAGE Ebisu,” “URBAN STAGE Meguro Aobadai,” “URBAN STAGE Gakugei Daigaku,” “URBAN STAGE Nihonbashi Hamacho,” “URBAN STAGE Kagurazaka,” “URBAN STAGE Ikebukuro” and
“URBAN STAGE Sakaisuji Honmachi” that were acquired in September 2014.
15th FP Financial Statement Overview
Financial Statement Overview
14th Fiscal Period
(ended Nov. 30, 2013)
15th FP Forecasts
(ending May 31, 2014)
Difference
(previous period) 16th FP Forecasts
(ending Nov. 30, 2014)
Difference to
15th FP Results
(Forecast)
(Forecast)
(Forecast)
(Forecast)
(Forecast Announced in Jan. 2014: ¥12,050/unit)
Operating Revenues
Net Income
Cash Distribution Per Unit
Operating Profits
Difference in Cash Distribution
+ ¥492 - ¥345
¥12,221 - ¥246
+ ¥40 ¥12,161 - ¥263
・ Rent and Common
–area Fees
- ¥ 32
・ Key Money and
Renewal Fees
- ¥ 352
・ Expenses on
Commission Fees,
etc.
+ ¥ 371
・ Repair and
Maintenance
+ ¥ 108
・ Tax and public
dues
- ¥ 193
・Other
- ¥ 164
・ PROUD FLAT
Kamioooka
+ ¥ 119
・ PRIME URBAN
Nishi Waseda
+ ¥ 6
・ Periodic revenue
- ¥ 187
・ Disposition revenue
Difference
(previous period)
- ¥ 194 ※
※16FP Disposition
revenue
¥ 38 ( )
・ Consumption tax
increase
- ¥ 166
・ Other
+ ¥ 125
+ ¥125
+ ¥249
- ¥381
- ¥291 ¥11,600 (Forecast)
(yen/unit)
14th FP Cash Distribution
Other 15th FP
Cash Distribution Provision for reserve
for reduction entry
16th FP Cash Distribution
Move-out by sole tenant
Property Disposition Move-out by sole
tenant Property Disposition Other
※1. Cash distribution per unit for the 15th fiscal period (ending May 2014) shown in the chart is the forecast as of July 15, 2014. Actual figures may change due to the acquisition or sales of properties, changes in real estate markets, and other
conditions surrounding NRF. NRF does not guarantee the cash distribution per unit predicted in this forecast.

0
20
40
60
80
100
120
140
160
15th… 17th… 19th… 21st… 23rd… 25th… 27th… 29th… 31th…
(
1.37% → 1.27%¥9.2billion
95.7 96.0 96.3 97.3 96.6 95.8
80
85
90
95
100
Dec. Jan. Feb. Mar. Apr. May
Total Portfolio(%)
3
※. The building age is as of the point of acquisition or sale of each property.
Management Finance
Total Portfolio
(14th FP)
(+0.1pt)
(+0.2pt)
(- 0.4pt)
→
→
→
Acquisition
Properties disposition
16th
URBAN STAGE Ikegami
・ Disposition Price : ¥1,445 million
・ Building Age : 20.2 years
Unification of Property Names
1.16%
(+0.3years)
→
2.9years
1.17% (-0.01pt)
PRIME URBAN
URBAN STAGE
PRIME URBAN
Properties planned/developed by companies
other than Nomura Real Estate Development
<Age of Building: Approx.1 year or more>
Properties planned/developed by companies
other than Nomura Real Estate Development
<Age of Building: Approx. 1 year or less>
Primarily properties planned/
developed by companies
Other than Nomura Real
Estate Development
Other Areas
Greater Tokyo Area
96.2%
95.7%
97.4%
96.3%
97.0%
95.9%
3.2years
Continuing strategy for replacing properties Maintain high occupancy rate Refinancing approx. ¥9.2 billion
Highlights of the 15th Fiscal Period
URBAN STAGE Machiya
・ Disposition Price : ¥ 230 million
・ Building Age : 26.1 years
URBAN STAGE Minami Gyotoku IV
・ Disposition Price : ¥ 256 million
・ Building Age : 21.2 years
Asset Size : ¥160.24 billion
Portfolio NOI Yield : 5.2 %
Building Age : 10.4 years
[Portfolio at May 31, 2014 (153 properties)]
End-14th FP : 96.2% → End-15th FP : 95.8%
[Period average occupancy rate]
(15th FP)
・Elongation/fixation of debt financing
・Diversification of repayment date
・Lower interest costs
(15th FP) (14th FP)
Weighted Average
Interest Rate
Average Remaining
Duration of Interest-
bearing Debt →
Debts Bonds Refinance
Maintain High Occupancy Rate + +
Continuing Stable Cash Distribution
Improving Portfolio Quality Effective Refinancing
16
14
12
10
8
6
4
2
0 15th 17th 19th 21th 23th 25th 27th 29th 31th

4
Performance and Future Management Policy
PROUD FLAT Kamata II

5
7
7.17
6.2
4.7
Cumulative results
※3.
※4.
16th 15th
Cumulative results (as of the date of this document)
13 4.3
※2.
※1.
6.06 19.9
Continuing Implementation of Strategy for Replacing Properties
✓ Have been transferring properties, taking building age, merchantability, etc. into consideration,
since the 8th Fiscal Period (transfer of 2 properties (total: 1,670 million yen) in the 15th Fiscal Period)
✓ Create acquisition capacity with funds from the transfers
Creation of
acquisition capacity
Acquisition
Disposition
URBAN STAGE Ikegami
・ Disposition Price : ¥1,445 million
・ Building Age : 20.2 years
URBAN STAGE Machiya
・ Disposition Price : ¥ 230 million
・ Building Age : 26.1 years
URBAN STAGE Minami Gyotoku IV
・ Disposition Price : ¥ 256 million
・ Building Age : 21.2 years
Number of
Properties
Property
Price
Average
NOI Yield
Average
Building Age
Properties
Billion yen
%
Years
Number of
Properties
Property
Price
Average
NOI Yield
Average
Building Age
Properties
Billion yen
%
Years
・Aging of buildings
・Decrease of
profitability
・Low building age
・High profitability
Reinvestment with funds from sale
Portfolio NOI Yield
Number of
Properties
Property Price
Properties
Billion yen
%
Years
Portfolio at 15th Fiscal Period End
Average Building Age
Increase of the portfolio’s
quality and profitability
153
160.24
5.2
10.4
※1. The average NOI yield is the NOI in the appraisal report weighted by the acquisition price.
※2. The average building age is weighted by acquisition price.
※3. The average NOI yield is weighted by acquisition price.
※4. The average building age is weighted by acquisition price.
※5. Properties acquired with the 3rd and 4th public offerings are not included as they are not part of the strategy for replacing properties.

95.7 96.0 95.4 95.8 95.8 96.2 95.9 95.7 95.8
97.5 96.7 96.4 96.7 96.4 96.2 96.1 95.9 96.2 95.7 96.0 96.3
97.3 96.6 95.8
90.0
94.7
80
85
90
95
100
Jun Jul Aug Sep Oct Nov Dec Jan2013
Feb Mar Apr May Jun Jul Aug Sep Oct Nov Dec Jan2014
Feb Mar Apr May
6
(%)
(Days)
※2.
✓ Maintained high occupancy rate (average occupancy rate in the 15th fiscal period: 96.3%)
✓ Occupancy rate of the 7 properties acquired upon previous year’s public offering increased to 94.7%
(+4.7pt from that at time of acquisition)
12th Fiscal Period Average: 95.8%
13th Fiscal Period Average: 96.3%
14th Fiscal Period Average: 96.2%
15th Fiscal Period Average: 96.3%
4th PO acquisition properties ※1. Other Area
Greater Tokyo Area Total Portfolio Portfolio Occupancy Rate
Number of Move-ins and Move-outs Average Vacancy Period
861 1,179 9311,303
-896 -1,140 -926-1,334
-35
39 5
-31
-1,500
-1,000
-500
0
500
1,000
1,500
12th FP End(Nov. 30, 2012)
13th FP End(May 31, 2013)
14th FP End(Nov. 30, 2013)
15th FP End(May 31, 2014)
(cases)
65
6965
60
40
50
60
70
80
12th FP End
(Nov. 30, 2012)
13th FP End
(May 31, 2013)
14th FP End
(Nov. 30, 2013)
15th FP End
(May 31, 2014)
※1. 4th PO acquisition properties refer to “URBAN STAGE Ebisu,” “URBAN STAGE Meguro Aobadai,” “URBAN STAGE Gakugei Daigaku,” “URBAN STAGE Nihonbashi Hamacho,” “URBAN STAGE Kagurazaka,” “URBAN STAGE Ikebukuro” and
“URBAN STAGE Sakaisuji Honmachi” that were acquired in September 2014.
※2. The average vacancy period is the average period between the moving out of tenants and the contracting of new tenants.
Portfolio Occupancy Rate
Move-in
Move-out
Increase and Decrease

-0.02
-0.26-0.40
-0.06
-1.5
-1.0
-0.5
0.0
0.5
1.0
12th FP End(Nov. 30, 2012)
13th FP End (May 31, 2013)
14th FP End (Nov. 30, 2013)
15th FP End (May 31, 2014)
7
(%)
※1. The rate of change of rent per property based on properties owned as of the end of the previous fiscal period is indicated.
※1.
Increase Flat Decrease
100
0
50
(%)
100
0
50
(%)
✓ Rate of decline in rent per tsubo largely improved
✓ Ratio of increase in rent in new tenant turnover also significantly up
Rate of decline
improved
Ratio of
increase up
Changes in Leased Units and Rent Level
Performance Rate of Change in Rent per Property
Rent Change at Lease Renewals Rent Change Before Move-out and After Move-in
2.6 2.9 1.1 5.7
97.4 95.7 98.0 94.1
0.0 1.4 0.9 0.2
12th FP End(Nov. 30, 2012)
13th FP End (May 31, 2013)
14th FP End (Nov. 30, 2013)
15th FP End (May 31, 2014)
Increase Flat Decrease
49.9 45.9 46.638.6
15.3 19.4 20.8
17.7
34.7 34.7 32.643.7
12th FP End(Nov. 30, 2012)
13th FP End (May 31, 2013)
14th FP End (Nov. 30, 2013)
15th FP End (May 31, 2014)

8
114
84
86 85
67
66
51
54 55
111
107 53
50 56
57
49 52
109
110 11
33
37 4
2
3 27
28
46
45
47 43
24
34 36
5
58 59
62
64
88
13
115
22
21
112 65
80 18
87
44
104
103 105
81
98
68 69
48 8
41
42
30 40
83
7 70
15 17
75
74 71
76
77 78
79
91 116
117 119
96
118
94 93
92 95
97
9
14
10
29
31
108
35
32
60
61
63
12
90
20
26
25
23
1
39
38
19 82
73
72
16
123 124 125 126 128
130 131 132 133 142 143
127 129
120 121
134 135
144
136 137 138
145 146
122 139 140
141 147
149 150 151 152 153
6
89
48 / 152 Properties (31.6%)
Changes in Rent per Tsubo: Map by Area ①
Comparison of rent per tsubo at end of 12th FP stable turnover season
(end of Nov. 2012)
at end of 13th FP frequent turnover season
(end of May 2013)
Performance of frequent turnover season in previous year
Rent increasing in southern part of Tokyo
and along lines with high convenience,
mainly along the JR Keihin-Tohoku Line.
Number of properties with increase
Trend
※2.Properties acquired after the end of May 2013 and
properties transferred by the end of May 2014 are
not plotted on the map.
※1.Please check with page 30-31 for property numbers.
Legend
100 Increase
100 Flat / Decrease
※3.Frequent turnover season refers to a period that includes
January to March when there is active tenant turnover.
Stable turnover season refers to a period that does not
include the abovementioned period.
(2013)
9
114
84
86 85
67
66
51
54 55
111
107 53
50 56
57
49 52
109
110 11
33
37 4
2
3 27
28
46
45
47 43
24
34 36
5
58 59
62
64
88
13
115
22
21
112 65
80 18
87
44
104
103 105
81
98
68 69
48 8
41
42
30 40
83
7 70
15 17
75
74 71
76
77 78
79
91 116
117 119
96
118
94 93
92 95
97
9
14
10
29
31
108
35
32
60
61
63
12
90
20
26
25
23
1
39
38
19 82
73
72
16
100
101 6
99
102
106
113
136 137 138
145 146
122 139 140
141 147 148
149 150 151 152 153
123 124 125 126 128
130 131 132 133 142 143
127 129
89
On the previous year (+5.0pt)
120 121
134 135
144
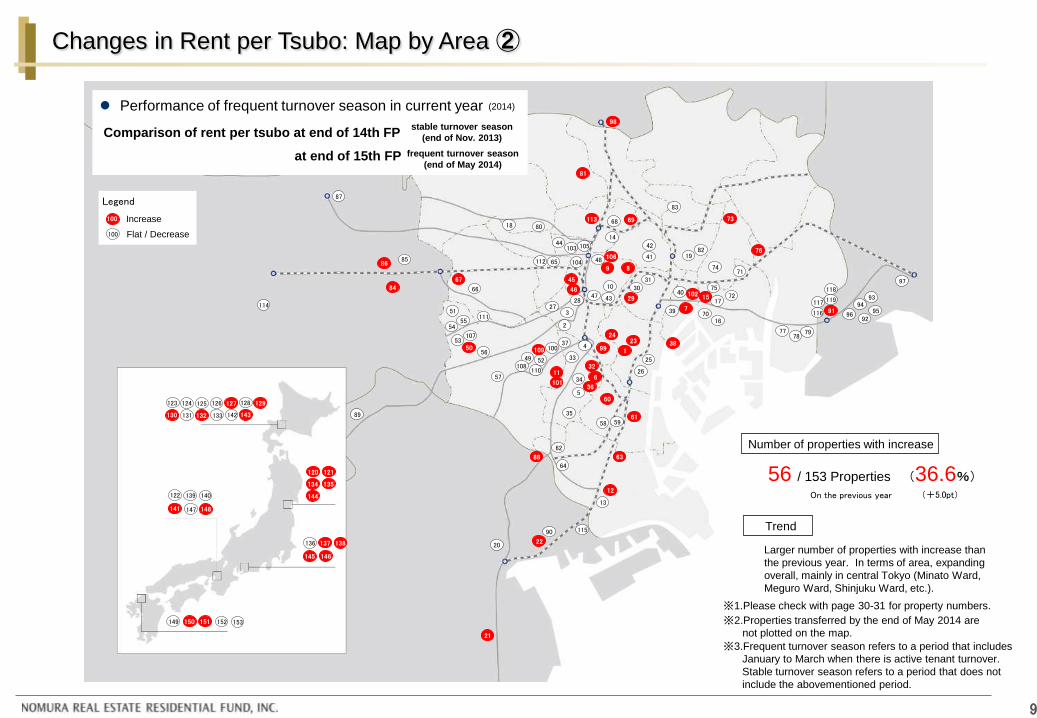
Larger number of properties with increase than
the previous year. In terms of area, expanding
overall, mainly in central Tokyo (Minato Ward,
Meguro Ward, Shinjuku Ward, etc.).
Comparison of rent per tsubo at end of 14th FP stable turnover season
(end of Nov. 2013)
at end of 15th FP frequent turnover season
(end of May 2014)
Performance of frequent turnover season in current year (2014)
Legend
100 Increase
100 Flat / Decrease
Number of properties with increase
Trend
56 / 153 Properties (36.6%)
※2.Properties transferred by the end of May 2014 are
not plotted on the map.
※1.Please check with page 30-31 for property numbers.
※3.Frequent turnover season refers to a period that includes
January to March when there is active tenant turnover.
Stable turnover season refers to a period that does not
include the abovementioned period.
Changes in Rent per Tsubo: Map by Area ②

Unification of Property Names
URBAN STAGE
PRIME URBAN
Properties planned/developed by companies
other than Nomura Real Estate Development
<Age of Building: Approx.1 year or more> PRIME URBAN Shibaura LOFT PRIME URBAN Yoga PRIME URBAN Shinkawa
Major properties
10
Expected effect in the
future Unification
Merger of Sponsor Group Property Management Companies
・ Facility management, repair work and
property management services for
office buildings, etc.
・ Management of housing, mainly PROUD
・ Property management services for
rental condominiums
Merger
Unification of Property Names and Merger of Property Management Companies
✓ Names of properties planned/developed by companies other than Nomura Real Estate Development will be
unified to “PRIME URBAN”
✓ Sponsor group property management companies “Nomura Living Support” and “Nomura Building Management”
merged to form “Nomura Real Estate Partners”
Property management
utilizing operational know-how
accumulated by
comprehensive real estate
management company
Enhancement of
market recognition of
portfolio properties
・Building management business
・Condominium management business
・Building interior business
・Property management business … etc.
Real estate management company with
capability to perform overall management
Properties planned/developed by companies
other than Nomura Real Estate Development
<Age of Building: Approx. 1 year or less>
Primarily properties planned/developed by companies
Other than Nomura Real Estate Development
PRIME URBAN
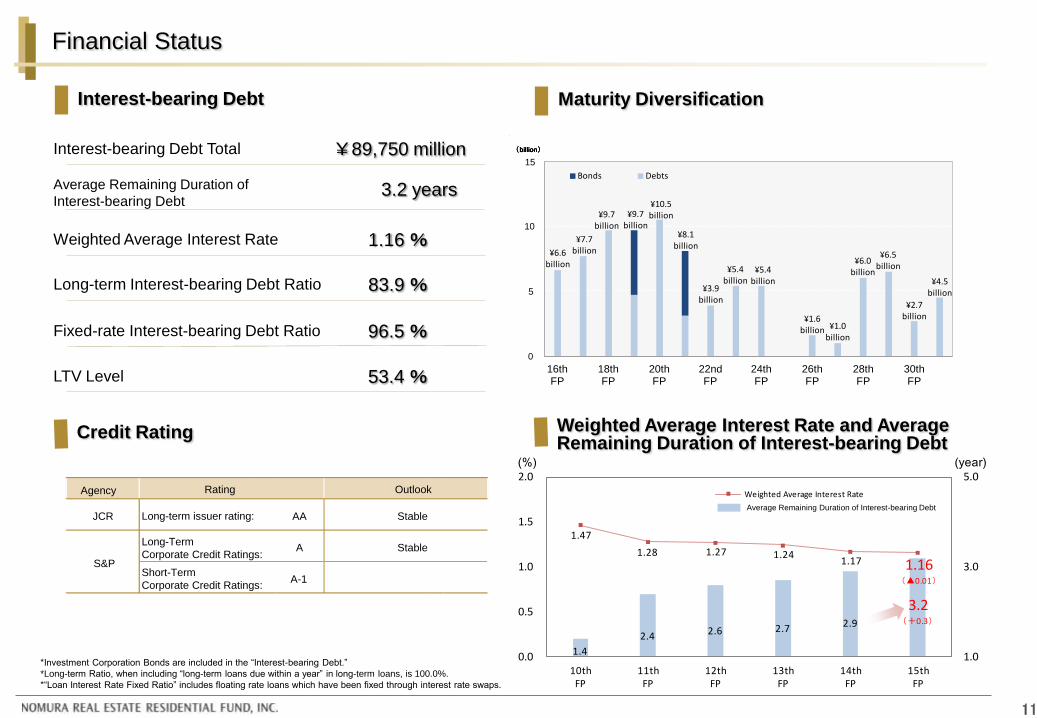
1.4
2.4 2.6 2.7 2.9
3.2(+0.3)
1.47
1.28 1.27 1.241.17 1.16
(▲0.01)
1.0
3.0
5.0
0.0
0.5
1.0
1.5
2.0
10thFP
11thFP
12thFP
13thFP
14thFP
15thFP
Weighted Average Interest Rate
(%) (year)
¥6.5 billion
¥6.6 billion
¥7.7 billion
¥9.7 billion
¥9.7 billion
¥10.5 billion
¥8.1 billion
¥3.9 billion
¥5.4 billion
¥5.4 billion
¥1.6 billion ¥1.0
billion
¥6.0 billion
¥2.7 billion
¥4.5 billion
0
50
100
150
16thFP
18thFP
20thFP
22ndFP
24thFP
26thFP
28thFP
30thFP
Bonds Debts
(
(billion)
(
(billion)
(
(billion)
(
(billion)
3.2 years
53.4 %
83.9 %
96.5 %
1.16 %
¥89,750 million
11
Financial Status
Weighted Average Interest Rate and Average Remaining Duration of Interest-bearing Debt
*Investment Corporation Bonds are included in the “Interest-bearing Debt.”
*Long-term Ratio, when including “long-term loans due within a year” in long-term loans, is 100.0%.
*“Loan Interest Rate Fixed Ratio” includes floating rate loans which have been fixed through interest rate swaps.
Interest-bearing Debt
Average Remaining Duration of
Interest-bearing Debt
LTV Level
Credit Rating
Long-term Interest-bearing Debt Ratio
Fixed-rate Interest-bearing Debt Ratio
Weighted Average Interest Rate
Interest-bearing Debt Total
Maturity Diversification
Agency
JCR AA Stable
Long-Term
Corporate Credit Ratings: A Stable
Short-Term
Corporate Credit Ratings: A-1
S&P
Rating Outlook
Long-term issuer rating:
15
10
5
0
Average Remaining Duration of Interest-bearing Debt

12
Retention of favorable relationships
Shortening of vacancy period
✓ Continuous implementation of
conservative financial strategy
Proactive management considering situations
of each area and property
Increasing property transactions
Downward trend of yields
Real Estate Investment Market
Acquisition
Improving Portfolio Quality
Selling properties that are aged, or
whose profitability is lowered
✓ Promoting property
replacement continuously
Acquiring properties utilizing acquisition
capacity
Rental Market
Management
Enhancing Portfolio Profitability
Continuation of tight supply-demand
environment
Early leasing up of property vacated by sole
tenant
✓ Maintain high occupancy
✓ Improving lease conditions
Promote the continuation of monetary
easing policy Risk of rising interest rates
Financial Market
Finance
Improving Borrowing Conditions
Control interest costs
Elongation/fixation of debt financing
Maintaining a Stable Level of Cash Distribution
Management Strategies

13
A P P E N D I X
PROUD FLAT Kamata II

14
PROUD FLAT Kamata II
Details of the Financial Results

1. Real Estate Rental Business Revenues : ¥3,103,140 thousand
(from previous FP : ¥-2,874 thousand)
2. Incidental Revenues
2. Key Money : ¥79,221 thousand
2. Renewal Fee : ¥103,355 thousand
3. Other Real Estate Rental Revenues
4. Renovation Expenses
4.Repair Expenses : ¥300,325 thousand
4.Capital Expenditure : ¥95,742 thousand
Total : ¥396,067 thousand
5. Tax and Public Dues (152 properties at FP End)
5.Subject Property : 146 properties
5.Excluded Property : 7 properties
Total : 153 properties
6. Other Operating Expenses
6.Duty Entrustment Fee : ¥40,023 thousand
6.Directors Fee, etc. : ¥4,800 thousand
7. Other Non-Operating Expenses
7.Loan Related Expense, etc. : ¥30,523 thousand
3.Revenue from reversal of provision for loss on disaster,
cellphone antennae, vending machines, etc.
14th Fiscal Period 15th Fiscal Period
From Jun. 1, 2013 From Dec. 1, 2013
To Nov. 30, 2013 To May 31, 2014
Amount
(¥000)
Amount
(¥000)
Difference
(¥000)
Difference
(%)
Operating Revenue 5,406,759 5,594,013 187,254 3.5
Real Estate Rental Business Revenues *1 5,356,185 5,556,649 200,463 3.7
Rental Business Revenues 5,013,520 5,143,831 130,311 2.6
Other Rental Business Revenues 342,665 412,817 70,152 20.5
Parking Lot Revenue 134,455 134,802 346 0.3
Incidental Revenue *2 140,643 199,126 58,483 41.6
Other Real Estate Rental Revenues *3 67,566 78,889 11,322 16.8
Real Estate Disposition Revenue 50,573 37,364 -13,208 -26.1
Operating Expense 2,848,657 3,080,309 231,652 8.1
Real Estate Rental Business Expenses *1 2,250,171 2,453,509 203,337 9.0
Repair Expenses *4 225,277 300,325 75,047 33.3
Tax and Public Dues *5 260,682 263,900 3,218 1.2
Depreciation and Amortization 1,012,451 1,053,355 40,904 4.0
Other Rental Business Expenses 751,760 835,927 84,167 11.2
Asset Management Fees 383,288 399,676 16,388 4.3
Other Operating Expenses *6 215,198 227,124 11,926 5.5
2,558,101 2,513,704 -44,397 -1.7
4,052 4,173 120 3.0
596,069 561,381 -34,687 -5.8
Interest Expenses 465,349 464,894 -454 -0.1
Investment Corporation Bond Interest 55,751 56,071 319 0.6
Other Non-Operating Expenses *7 74,968 40,415 -34,553 -46.1
1,966,085 1,956,496 -9,588 -0.5
1,966,085 1,956,496 -9,588 -0.5
951 974 22 2.4
1,965,133 1,955,522 -9,611 -0.5
67 64 -2 -4.3
1,965,201 1,955,587 -9,614 -0.5
1,965,136 1,955,488 -9,648 -0.5
Corporate Income Tax, etc.
Net Income
Retained Earnings Brought Forw ard
Retained Earnings at Fiscal Period End
Ordinary Income
Non-Operating Revenues
Total Cash Distribution
Non-Operating Expenses
Net Income Before Tax
Operating Profits
Difference from
Previous Period
(14th FP - 15th FP)
15
Income statement
(Figures are rounded down to the nearest thousand)
*Reference [15th Fiscal Period]

Amount
(¥000)
Ratio
(%)
Amount
(¥000)
Ratio
(%)
Current Assets 7,711,933 4.6 10,083,755 6.0
Cash and Cash Equivalents 6,791,327 4.0 9,400,388 5.6
Cash and Cash Equivalent in Trust 802,795 0.5 565,037 0.3
Other Current Assets 117,810 0.1 118,329 0.1
Fixed Assets 160,267,808 95.4 157,824,052 94.0
Tangible Fixed Assets *1 160,228,831 95.4 157,793,123 94.0
Real Estate 126,536,617 75.3 135,258,525 80.5
59,364,412 35.3 61,457,903 36.6
67,172,205 40.0 73,800,621 43.9
Real Estate in Trust 33,683,356 20.0 22,534,598 13.4
10,762,391 6.4 7,324,455 4.4
22,920,964 13.6 15,210,142 9.1
8,857 0.0 - -
Intangible Fixed Assets 2,058 0.0 1,537 0.0
Other Intangible Fixed Assets 2,058 0.0 1,537 0.0
Investment and Other Assets 36,918 0.0 29,391 0.0
Security Deposits 10,819 0.0 10,879 0.0
Long-term Repaid Expenses 26,098 0.0 18,512 0.0
Deferred Assets 39,972 0.0 32,702 0.0
39,972 0.0 32,702 0.0
168,019,715 100.0 167,940,510 100.0
Construction in Progress
Land in Trust
Total Assets
Investment Corporation Bond Issuing Expenses
Building in Trust
Land
Building
as of Nov. 30, 2013 as of May 31, 2014
15th Fiscal Period14th Fiscal Period
16
Balance Sheet
Assets Liabilities and Net Assets
*2 Loans (long-term loans due whithin a year are included in the short-term loans)
Balance of interest-bearing debts (millions of yen) 89,750
Short-term loans+bonds+Long-term loans
Total asset interest-bearing debt ratio total assets 53.4%
Bonds+Long-term loans
Long-term interest-bearing debt ratio Short-term loans+bonds+Long-term loans 83.9%
Amount
(¥000)
Ratio
(%)
Amount
(¥000)
Ratio
(%)
Current Liabilities 17,410,010 10.4 15,966,300 9.5
Trade Accounts Payable 259,584 0.2 313,873 0.2
Long-term Loan Due Within One Year *2 15,950,000 9.5 14,450,000 8.6
Other Accounts Payable 342,714 0.2 295,373 0.2
Taxes Payable 753 0.0 51,893 0.0
Accrued Expenses 129,601 0.1 115,670 0.1
Rent Received in Advance 722,407 0.4 725,084 0.4
Deposits Payable 4,949 0.0 14,403 0.0
Fixed Liabilities 75,373,449 44.9 76,747,569 45.7
Investment Corporation Bonds *2 10,000,000 6.0 10,000,000 6.0
Long-term Loans *2 63,890,000 38.0 65,300,000 38.9
Security Deposits 1,101,348 0.7 1,175,682 0.7
Security Deposits in Trust 382,100 0.2 271,886 0.2
92,783,459 55.2 92,713,869 55.2
Unitholders Equity 75,236,255 44.8 75,226,641 44.8
Unitholders Capital 73,231,053 43.6 73,231,053 43.6
Retained Earnings 2,005,201 1.2 1,995,587 1.2
75,236,255 44.8 75,226,641 44.8
168,019,715 100.0 167,940,510 100.0
15th Fiscal Period
as of May 31, 2014as of Nov. 30, 2013
14th Fiscal Period
Total Liabilities
Total Liabilities and Net Assets
Total Net Assets
*1 Tangible Fixed Asset
Acqisition
Price
Accumulated
Depreciation
(Depreciation for
current FP)
Book value
at FP end
Real Estate, etc. 169,119 11,326 (1,053) 157,793
Building 70,982 9,524 (925) 61,457
Land 73,800 - - 73,800
Building in Trust 9,126 1,801 (127) 7,324
Land in Trust 15,210 - - 15,210
Construction in Progress 8 - - 8
(unit : million of yen)
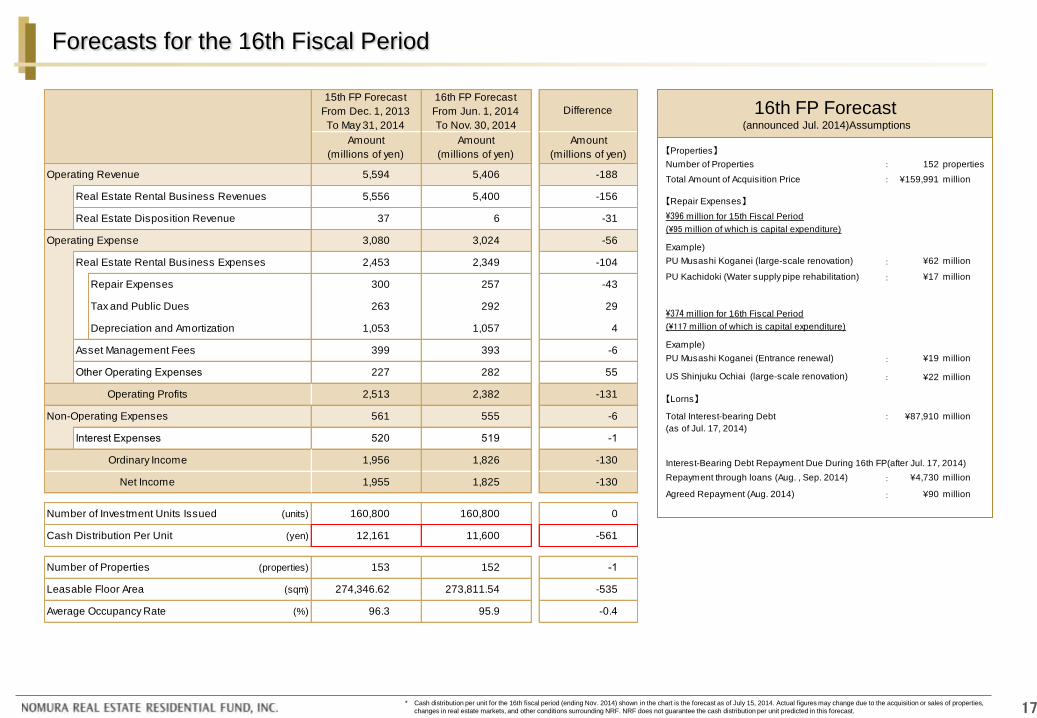
Operating Revenue 5,594 5,406 -188
Real Estate Rental Business Revenues 5,556 5,400 -156
Real Estate Disposition Revenue 37 6 -31
Operating Expense 3,080 3,024 -56
Real Estate Rental Business Expenses 2,453 2,349 -104
Repair Expenses 300 257 -43
Tax and Public Dues 263 292 29
Depreciation and Amortization 1,053 1,057 4
Asset Management Fees 399 393 -6
Other Operating Expenses 227 282 55
2,513 2,382 -131
Non-Operating Expenses 561 555 -6
520 519 -1
1,956 1,826 -130
1,955 1,825 -130
(units) 160,800 160,800 0
(yen) 12,161 11,600 -561
(properties) 153 152 -1
(sqm) 274,346.62 273,811.54 -535
(%) 96.3 95.9 -0.4
Amount
(millions of yen)
DifferenceFrom Dec. 1, 2013
15th FP Forecast
To May 31, 2014
Amount
(millions of yen)
Number of Properties
Leasable Floor Area
Average Occupancy Rate
Operating Profits
Interest Expenses
Ordinary Income
Net Income
Number of Investment Units Issued
Cash Distribution Per Unit
From Jun. 1, 2014
To Nov. 30, 2014
Amount
(millions of yen)
16th FP Forecast
17
【Properties】
Number of Properties : 152 properties
Total Amount of Acquisition Price : ¥159,991 million
Example)
: ¥62 million
: ¥17 million
Example)
: ¥19 million
: ¥22 million
【Lorns】
Total Interest-bearing Debt : ¥87,910 million
(as of Jul. 17, 2014)
Interest-Bearing Debt Repayment Due During 16th FP(after Jul. 17, 2014)
: ¥4,730 million
: ¥90 million
【Repair Expenses】
PU Musashi Koganei (large-scale renovation)
(\95 million of which is capital expenditure)
PU Kachidoki (Water supply pipe rehabilitation)
(\117 million of which is capital expenditure)
PU Musashi Koganei (Entrance renewal)
US Shinjuku Ochiai (large-scale renovation)
Repayment through loans (Aug. , Sep. 2014)
Agreed Repayment (Aug. 2014)
\396 million for 15th Fiscal Period
\374 million for 16th Fiscal Period
Forecasts for the 16th Fiscal Period
16th FP Forecast (announced Jul. 2014)Assumptions
* Cash distribution per unit for the 16th fiscal period (ending Nov. 2014) shown in the chart is the forecast as of July 15, 2014. Actual figures may change due to the acquisition or sales of properties,
changes in real estate markets, and other conditions surrounding NRF. NRF does not guarantee the cash distribution per unit predicted in this forecast.

0
200
400
600
800
1,000
1,200
1,400
1,600
1,800
1st FP End 2nd FP End 3rd FP End 4th FP End 5th FP End 6th FP End 7th FP End 8th FP End 9th FP End 10th FP End 11th FP End 12th FP End 13th FP End 14th FP End 15th FP End
18
160,247 million
approx. 29.9 sqm
153 properties
approx. 97 thousand
274,346.62 ㎡ 9,149 units
Changes in Asset Size
Acquisition Price
Portfolio Overview (15th Fiscal Period End)
Number of Properties
Average Leasable
Floor Area Per Unit
Leasable Units
Average Rent Per Unit
Total Leasable Floor Area
Stable Growth of Portfolio
✓ Focused investment in properties targeting single and DINKs households
✓ The portfolio has grown steadily to approx. 2.4 times the size at the time of listing
#3 PO
¥7,161 million
#2 PO
¥8,029 million
#1 PO
¥12,514 million
IPO
¥30,257 million
#4 PO
¥4,269 million
Other Areas: 19.0%
Greater Tokyo Area: 81.0%
(billions of yen)
89 properties
¥67.03 billion
97 properties
¥75.42 billion
131 properties
¥110.33 billion
134 properties
¥115.93 billion
139 properties
¥121.48 billion
139 properties
¥121.48 billion
143 properties
¥131.46 billion
144 properties
¥133.41 billion
143 properties
¥132.89 billion
145 properties
¥135.04 billion
152 properties
¥149.86 billion
153 properties
¥150.58 billion
152 properties
¥150.96 billion
155 properties
¥161.91 billion
0.0
20.0
40.0
60.0
80.0
100.0
120.0
140.0
160.0
180.0
153 properties
¥160.24 billion
*The graph is based on the total acquisition price as of each fiscal period end (rounded down to the nearest 10 million).

0
40,000
80,000
120,000
160,000
12th FP 13th FP 14th FP 15th FP
(Units)
150,936units160,800units
58.0% 55.5%58.9% 62.5%
13.4% 13.6%
13.1% 13.1%12.2%
10.4%
8.4% 6.1%
16.4% 20.4%19.5% 18.3%
19
Unitholders
Changes in Ratio of Units Held by Unitholders
Top 10 Unitholders
[Financial Institutions]
Total 87,600 units 58.0% 83,769 units 55.5% 94,734 units 58.9% 100,494 units 62.5%
Banks 15,222 units 10.1% 15,155 units 10.0% 15,348 units 9.5% 17,616 units 11.0%
Trust Banks 61,213 units 40.6% 56,422 units 37.4% 65,650 units 40.8% 68,606 units 42.7%
Life Insurance
Companies2,991 units 2.0% 3,397 units 2.3% 3,627 units 2.3% 3,610 units 2.2%
Non-Life Insurance
Companies830 units 0.5% 1,595 units 1.1% 3,801 units 2.4% 4,984 units 3.1%
Securities
Companies, etc.1,539 units 1.0% 1,401 units 0.9% 1,160 units 0.7% 680 units 0.4%
Other 5,805 units 3.8% 5,799 units 3.8% 5,148 units 3.2% 4,998 units 3.1%
Individuals/Others
( 29,409 unit 10,180 unitholders )
Foreign Corporations, etc.
( 9,826 unit 124 unitholders )
Domestic Corporation (excluding Financial Institutions)
( 21,071 unit 190 unitholders )
Financial Institutions (including Securities Companies)
( 100,494 unit 101 unitholders )
# Unitholders # Unitholders
1 Japan Trustee Services Bank, Ltd. 45,540 28.32 6 The Fuji Fire and Marine Insurance Co., Ltd. 3,212 2.00
2 Nomura Real Estate Development Co., Ltd. 15,240 9.48 7 Trust & Custody Services Bank, Ltd. 3,010 1.87
3 The Nomura Trust and Banking Co., Ltd. 8,049 5.01 8 The Joyo Bank, Ltd. 2,502 1.56
4 The Master Trust Bank of Japan, Ltd. 5,076 3.16 9 The Fukui Bank,Ltd. 1,987 1.24
5 Trust & Custody Services Bank, Ltd. 5,036 3.13 10 The Hokuriku Bank, Ltd. 1,867 1.16
91,519 56.91Total
Units Ratio (%) Units Ratio (%)
(Note) The Ratio is calculated as the percentage of Total Number of Owned Investment Units divided by Total Number of Issued Investment Units.

Increase 136 properties
Flat 4 properties
Decrease 13 properties
20
:
:
Appraisal Value Status
Appraisal Value
15th FP End Appraisal Value (B)
14th FP End Appraisal Value (A)*
Difference (B)-(A)
[Reference]
Appraisal Value Details
Total 153 properties
( 088.9 %)
( 0 2.6 %)
( 0 8.5 %)
( 100.0 %)
¥156,322 million
¥154,018 million
+ ¥2,304 million
BPS
NAV per Unit
¥467,827
¥458,678
*14th FP End Appraisal Value” excludes the appraisal value of 2 property disposed during the 15th FP.
Range of Cap Rate and Book-to-Market Ratio
5.57 5.55
5.47 5.465.41 5.34
5.29
5.17
0.90 0.910.92
0.940.95 0.96
0.970.99
0.85
0.90
0.95
1.00
1.05
1.10
1.15
1.20
4.50
4.70
4.90
5.10
5.30
5.50
5.70
8th FP 9th FP 10th FP 11th FP 12th FP 13th FP 14th FP 15th FP
Average Cap Rate Book-to-Market Ratio(%)
( - 0.07)
(x )
( - 0.05)
( - 0.12)
(+ 0.01)
(+ 0.02)
(+ 0.01)

8,102
14,005
12,127
14,144 13,910 13,631
11,046 12,068 11,674 11,770 12,302 12,424 12,170 12,221 12,161 11,600
0
4,000
8,000
12,000
16,000
20,000
1st FP 2nd FP 3rd FP 4th FP 5th FP 6th FP 7th FP 8th FP 9th FP 10th FP 11th FP 12th FP 13th FP 14th FP 15th FP 16th FP
(yen)
[Forecast]
0
300
600
900
1,200
1,500
1,800
2,100
2,400
2,700
3,000
0
200,000
400,000
600,000
800,000
1,000,000
20
07
/02
/14
20
07
/04
/14
20
07
/06
/14
20
07
/08
/14
20
07
/10
/14
20
07
/12
/14
20
08
/02
/14
20
08
/04
/14
20
08
/06
/14
20
08
/08
/14
20
08
/10
/14
20
08
/12
/14
20
09
/02
/14
20
09
/04
/14
20
09
/06
/14
20
09
/08
/14
20
09
/10
/14
20
09
/12
/14
20
10
/02
/14
20
10
/04
/14
20
10
/06
/14
20
10
/08
/14
20
10
/10
/14
20
10
/12
/14
20
11
/02
/14
20
11
/04
/14
20
11
/06
/14
20
11
/08
/14
20
11
/10
/14
20
11
/12
/14
20
12
/02
/14
20
12
/04
/14
20
12
/06
/14
20
12
/08
/14
20
12
/10
/14
20
12
/12
/14
20
13
/02
/14
20
13
/04
/14
20
13
/06
/14
20
13
/08
/14
20
13
/10
/14
20
13
/12
/14
20
14
/02
/14
20
14
/04
/14
Investment Unit Price TSE REIT Index
Mar. 29, 2007
Highest Price: ¥979,000
Nikkei Stock Average
Mar. 10, 2009Lowest: 7,054.98
Septermber 2008Lehman Brothers
Bankruptcy
Oct. 5, 2010BOJ Announces
Purchase of J-REITs
Jan. 15, 2009Lowest Price:
¥287,600
Mar. 11, 2011Great Eastern Japan Earthquake
Mar. 14, 2011BOJ Announces
Additional Purchase of J-REIT
1st PO¥12.5 billion
2nd PO¥8.0 billion
3rd PO¥7.1 billion
Apr. 27, 2012BOJ Announces
Additional Purchase of J-REIT
Feb. 14, 2012Enhancement of Monetary Easing
4th PO¥4.2 billion
Investment Unit Price (yen)
21
Changes in Investment Unit Price and Cash Distribution
Changes in Cash Distribution
Stability and Growth of Cash Distribution
Changes in Investment Unit Price
May 30, 2014
¥570,000
BPS ¥467,827
1st FP 2nd FP 3rd FP 4th FP 5th FP 6th FP 7th FP 8th FP 9th FP 10th FP 11th FP 12th FP 13th FP 14th FP 15th FP
May. 31 Nov. 30 May. 31 Nov. 30 May. 31 Nov. 30 May. 31 Nov. 30 May. 31 Nov. 30 May. 31 Nov. 30 May. 31 Nov. 30 May. 312007 2007 2008 2008 2009 2009 2010 2010 2011 2011 2012 2012 2013 2013 2014
Feb. 142007

22
PROUD FLAT Shirokane Takanawa PRIME URBAN Chitose Funabashi
PRIME URBAN Naka Meguro Characteristics of NRF
Characteristics of NRF
23
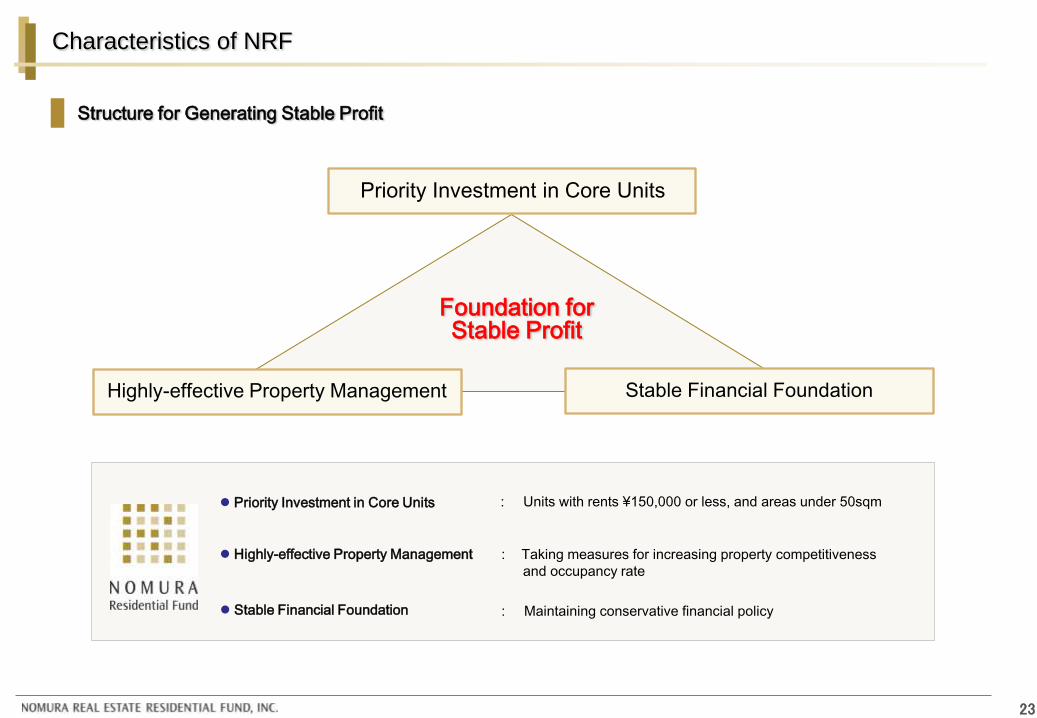
Structure for Generating Stable Profit
Priority Investment in Core Units
Priority Investment in Core Units : Units with rents ¥150,000 or less, and areas under 50sqm
Highly-effective Property Management
: Taking measures for increasing property competitiveness
and occupancy rate
Stable Financial Foundation : Maintaining conservative financial policy
Foundation for Stable Profit
Highly-effective Property Management Stable Financial Foundation
70
80
90
100
110
1st FP End(May 31, 2012)
3rd FP End(May 31, 2012)
5th FP End(May 31, 2012)
7th FP End(May 31, 2012)
9th FP End(May 31, 2012)
11th FP End(May 31, 2012)
13th FP End(May 31, 2013)
(%)
Rental Housing Investment Characteristics
24
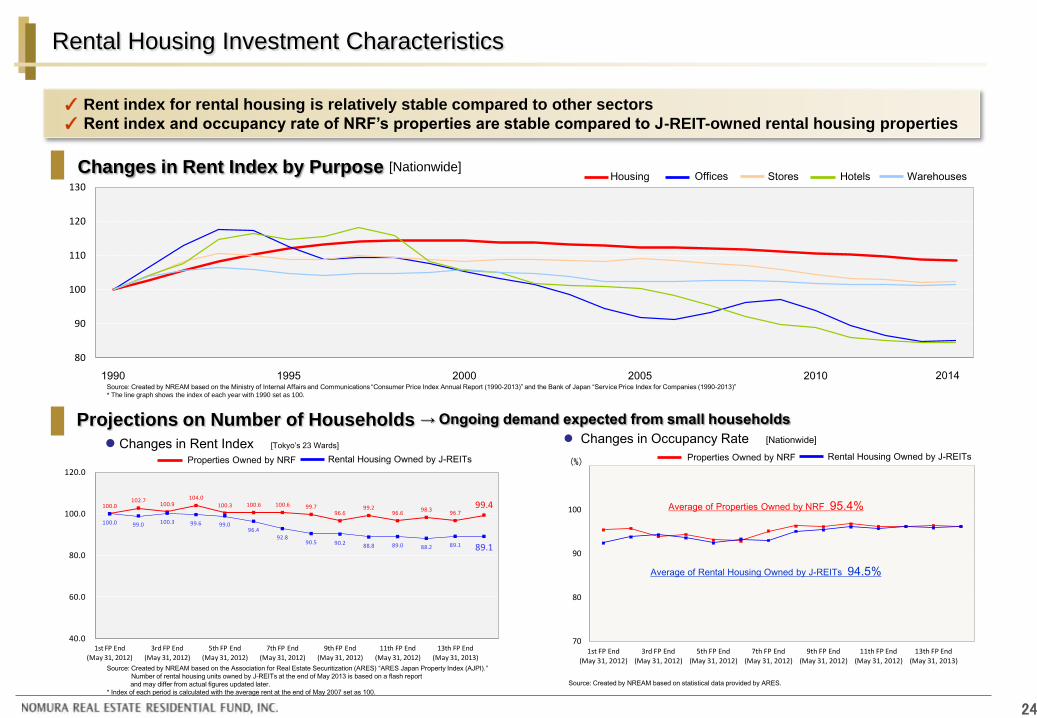
Changes in Rent Index by Purpose [Nationwide]
Source: Created by NREAM based on the Ministry of Internal Affairs and Communications “Consumer Price Index Annual Report (1990-2013)” and the Bank of Japan “Service Price Index for Companies (1990-2013)”
* The line graph shows the index of each year with 1990 set as 100.
Projections on Number of Households → Ongoing demand expected from small households
Properties Owned by NRF Rental Housing Owned by J-REITs
Changes in Rent Index [Tokyo’s 23 Wards] Changes in Occupancy Rate [Nationwide]
Properties Owned by NRF Rental Housing Owned by J-REITs
Source: Created by NREAM based on the Association for Real Estate Securitization (ARES) “ARES Japan Property Index (AJPI).”
Source: Number of rental housing units owned by J-REITs at the end of May 2013 is based on a flash report
and may differ from actual figures updated later.
* Index of each period is calculated with the average rent at the end of May 2007 set as 100.
Source: Created by NREAM based on statistical data provided by ARES.
Average of Properties Owned by NRF 95.4%
Average of Rental Housing Owned by J-REITs 94.5%
Stores Hotels Warehouses Housing Offices
✓ Rent index for rental housing is relatively stable compared to other sectors
✓ Rent index and occupancy rate of NRF’s properties are stable compared to J-REIT-owned rental housing properties
80
90
100
110
120
130
1990 1995 2000 2005 2010 2014
100.0 102.7
100.9 104.0
100.3 100.6 100.6 99.7 96.6
99.2 96.6
98.3 96.7
99.4
100.0 99.0 100.3 99.6 99.0 96.4
92.8 90.5 90.2 88.8 89.0 88.2 89.1 89.1
40.0
60.0
80.0
100.0
120.0
1st FP End
(May 31, 2012)
3rd FP End
(May 31, 2012)
5th FP End
(May 31, 2012)
7th FP End
(May 31, 2012)
9th FP End
(May 31, 2012)
11th FP End
(May 31, 2012)
13th FP End
(May 31, 2013)

0
4
8
12
16(%)
(income)
25
Priority Investment in Key Segments
12,318
13,157
13,757
14,91815,253 15,414 15,415 15,268
80
100
120
140
160
180
200
10,000
12,000
14,000
16,000
1995 2000 2005 2010 2015 2020 2025 2030
Investment in the segments with high demand for rental properties
(Thousand Households)
Source: Created by NREAM based on the National Institute of Population and Social Security Research (IPSS) “Number of Households by Family Type,
Source: Age (five-year groups), and Sex group.”
* The line graph shows changes in number of single or couple-only households and total number of households with 1995 set as 100.
(%)
Changes in Number of Households (“Total ””Singles””DINKs”) [Greater Tokyo Area]
Singles/
DINKs
(158%)
Total
Number of
Households
(124%)
Over 50% of the total
number of households
Peak of Number
of Households
Core Units (rent ¥150,000 or less, floor area under 50 sqm)
Relative Frequency Distribution of Number of Households by Income [Nationwide]
Changes in Occupancy Rate of Core Units
Source: The Ministry of Health, Labour and Welfare (MHLW) “Overview of National Livelihood Survey 2012”
(For reference) Total NRF portfolio
* Figures do not include data on stores.
approx. ¥97 thousand
approx. 29.9 sqm ・Average Leasable Floor Area Per Unit
・Leasable Units 9,149 units ・Average Rent Per Unit
Main target tenant classes
⇒Annual Income ¥4 million~¥9 million
( approx. 50% of total household)
At 15th Fiscal Period End
Core Units
Units with rent ¥150,000 or less and floor area under 50 sqmLowRent
HighRent
Small Area
Large Area
¥150,00050 sq. meters
:
:
:
Unit Ratio
(Occupancy Rate
Characteristics
Number of subject
housing units
%
%)
Single/DINKs units
in Greater Tokyo Area
Unit Ratio
(Occupancy Rate
Characteristics
Number of subject
housing units
%
%)
Family units
in Major Regional Cities
%
%)
Family units
in Central Tokyo/Suburbs
%
%)
Expensive units
in Central Tokyo
86.996.1
Unit Ratio
(Occupancy Rate
Characteristics
Number of subject
housing units
Unit Ratio
(Occupancy Rate
Characteristics
Number of subject
housing units
:
:
:
:
:
:
:
:
:
6.5
95.42.5
96.0
4.1
92.8
592 units
373 units
230 units
7,909 units
96.9 96.2 96.4 96.4 94.4 93.6
95.8 96.5 96.3 96.7 96.7 96.0 96.4 96.6 96.1
40
60
80
100
1st FPEnd
2nd FPEnd
3rd FPEnd
4th FPEnd
5th FPEnd
6th FPEnd
7th FPEnd
8th FPEnd
9th FPEnd
10th FPEnd
11th FPEnd
12th FPEnd
13th FPEnd
14th FPEnd
15th FPEnd
Average 96.1 %
(%)

4.0
4.5
5.0
5.5
6.0
6.5
2008/04 2009/04 2010/04 2011/04 2012/04 2013/04 2014/04
(%)
-1,000
-500
0
500
1,000
1,500
2,000
2,500
3,000
3,500
4,000
2008/04 2009/04 2010/04 2011/04 2012/04 2013/04 2014/04
(billions of yen)
Rental Housing Investment Characteristics
26
Acquisition amount Sale amount Net change
Source: Created by NREAM based on the Investment Trust Association, Japan’s Statistics on Real Estate Investment Corporations and public
documents of listed J-REITs.
Change in J-REIT Real Estate Acquisition and Sale Amount Change in Expected Yield
Source: Japan Real Estate Institute’s Real Estate Investor’s Survey
Expected yield of single-room apartments
(Jonan area (Meguro and Setagaya wards))
Expected yield of single-room apartments
(Joto area (Sumida and Koto wards))
Source: Created by NREAM based on the MLIT’s “Housing Start Statistics. The above are the totals of building starts of residences for rent
classified as apartment buildings of steel-framed reinforced concrete or reinforced concrete structure in the Housing Start Statistics
from January to December of each year.
Supply of New Properties (Number of Building Starts) Projections on Number of Households
✓ Real estate acquisition and sale amounts increased in 2013 and expected yields have decreased
✓ The supply of new properties continues to be at a low level and demand from single and DINKs households is expected to be stable
73,879
144,060
96,81792,667
57,013 57,367 54,029
70,525
0
20,000
40,000
60,000
80,000
100,000
120,000
140,000
160,000
2006 2007 2008 2009 2010 2011 2012 2013
(unit)
0
6,000
12,000
18,000
2005 2010 2015 2020
Number of single and DINKS households Number of households with parents and children Number of other general households Total number of households
(thousand households)
7,500,000
households
8,730,000
households
Source: Created by NREAM based on the National Institute of Population and Social Security Research (IPPS)
“Household Projections for Japan (by Prefecture)” (projections as of December 2009).

Utilization of Diverse Sourcing Routes
27
Breakdown of Acquired Properties by Sourcing Route
PRIME URBAN
Meguro Ohashi Hills
URBAN STAGE
Shibaura LOFT
PROUD FLAT
Shirokane Takanawa
PROUD FLAT
Asakusa Komagata
Sponsor Pipeline
59.6%
Properties owned by
Nomura Real Estate
Development
23.4%
Properties acquired through
information from or with
brokerage of Nomura Real Estate
Development
36.3%
Properties acquired
through information
from outside
40.4%
PRIME URBAN

*In the above graphs, “floor area per unit” as of the end of May 2014 is based on the number units while other figures are based on acquisition price.
28
Portfolio Status
Selection focusing on
accessibility to the nearest
railway stations
Greater Tokyo Area 70% or more
Other Areas 30% or less
Improve portfolio stability
through promotion of
diversification
⇒Top 10 Properties 19.4%
⇒Greater Tokyo Area 81.0%
⇒Within 10 min. 93.7 %
Investing in properties with
strong lease-up potential in a
short timeframe
Investing in properties targeting
single/DINKS/young family
households for the
foreseeable future
Considering the combination of
various building age to avoid the
bias of large-scale repair
expenses
⇒Average Building Age
10.4 Years
⇒Under 50 sqm 90.5%
⇒Average Unit Per Property
59 Units
Investment Area Floor Area Per Unit
Building Age Diversification Within Assets
Nearest Station on Foot Units Per Property
Top 5 Properties
¥17.43 billion
Top 10 Properties
¥31.01 billion
Other 143 Properties
¥129.23 billion
Other Areas
Other Areas (Kanagawa,
Chiba, Saitama)
Tokyo (23 wards)
Within 5 min.
Tokyo (excluding the 23 wards)
Over 10 min.
5-10 min.
3-5 years Over 10 years
5-10 years
Over 70 sqm Retail & Office
50-70 sqm
30-50 sqm Under 30 sqm
Over 100 Units Under 30 Units
50-100 Units 30-50 Units

Changes in Revenue
29
Changes in Rent per Tsubo and Occupancy Rate (12th FP End-16th FP End (forecast))
[Rent per Tsubo]
[Occupancy Rate]
12th FP End
(Nov. 30, 2012)
13th FP End
(May 31, 2013)
14th FP End
(Nov. 30, 2013)
15th FP End
(May 31, 2014)
15th FP End
(May 31, 2014)
Rent
per TsuboTotal ¥10,653 ¥10,644 ¥10,737 ¥10,736 ¥10,694
Greater
Tokyo¥12,280 ¥12,264 ¥12,349 ¥12,366 -
Other
Areas¥7,306 ¥7,302 ¥7,360 ¥7,366 -
12th FP End
(Nov. 30, 2012)
13th FP End
(May 31, 2013)
14th FP End
(Nov. 30, 2013)
15th FP End
(May 31, 2014)
15th FP End
(May 31, 2014)
Occupancy
RateTotal 96.2% 96.4% 96.2% 95.8% 95.7%
Greater
Tokyo95.7% 96.1% 95.9% 95.7% -
Other
Areas97.0% 97.2% 96.6% 96.1% -
(Reference)
12th FP End
(Nov. 30, 2012)
13th FP End
(May 31, 2013)
14th FP End
(Nov. 30, 2013)
15th FP End
(May 31, 2014)
15th FP End
(May 31, 2014)
Turnover
RatioTotal 9.7% 13.2% 10.0% 14.2% 11.1%
Details
Details
¥10,653 ¥10,644 ¥10,737 ¥10,736
(Forecast)
¥10,694
5,000
7,500
10,000
12,500
15,000
12th FP End(Nov. 30, 2012)
13th FP End(May 31, 2013)
14th FP End (Nov. 30, 2013)
15th FP End(May 31, 2014)
16th FP End [forecast](Nov 30, 2014)
Rent/Tsubo (Greater Tokyo Area) Rent/Tsubo (Other Areas) Rent/Tsubo (Total)(Rent per Tsubo)
Total
96.2% 96.4% 96.2%95.8%
(Forecast)
95.7%
90.0
92.5
95.0
97.5
100.0
12th FP End(Nov. 30, 2012)
13th FP End(May 31, 2013)
14th FP End (Nov. 30, 2013)
15th FP End(May 31, 2014)
16th FP End [forecast](Nov 30, 2014)
Occupancy Rate (Greater Tokyo Area) Occupancy Rate (Other Areas) Occupancy Rate (Total)(%)
Total

30
Greater Tokyo Area 121 Properties
Portfolio Map ( Greater Tokyo Area )
1 PROUD FLAT Shirokane Takanaw a
2 PROUD FLAT Yoyogi Uehara
3 PROUD FLAT Hatsudai
4 PROUD FLAT Shibuya Sakuragaoka
5 PROUD FLAT Gakugei Daigaku
6 PROUD FLAT Meguro Gyoninzaka
7 PROUD FLAT Sumida Riverside
8 PROUD FLAT Kagurazaka
9 PROUD FLAT Waseda
10 PROUD FLAT Shinjuku Kaw adacho
11 PROUD FLAT Sangen Jaya
12 PROUD FLAT Kamata
13 PROUD FLAT Kamata II
14 PROUD FLAT Shinotsuka
15 PROUD FLAT Kiyosumi Shirakaw a
16 PROUD FLAT Monzen Nakacho II
17 PROUD FLAT Monzen Nakacho I
18 PROUD FLAT Fujimidai
19 PROUD FLAT Asakusa Komagata
20 PROUD FLAT Yokohama
21 PROUD FLAT Kamioooka
22 PROUD FLAT Tsurumi II
23 PRIME URBAN Azabu Juban
24 PRIME URBAN Akasaka
25 PRIME URBAN Tamachi
26 PRIME URBAN Shibaura LOFT
27 PRIME URBAN Hatagaya
28 PRIME URBAN Yoyogi
29 PRIME URBAN Bancho
30 PRIME URBAN Chiyoda Fujimi
31 PRIME URBAN Iidabashi
32 PRIME URBAN Ebisu
33 PRIME URBAN Naka Meguro
34 PRIME URBAN Gakugei Daigaku
35 PRIME URBAN Senzoku
36 PRIME URBAN Meguro Riverside
37 PRIME URBAN Meguro Ohashi Hills
38 PRIME URBAN Kachidoki
39 PRIME URBAN Shinkaw a
40 PRIME URBAN Nihonbashi Yokoyamacho
41 PRIME URBAN Hongo Ikizaka
42 PRIME URBAN Hakusan
43 PRIME URBAN Yotsuya Gaien Higashi
44 PRIME URBAN Ochiai
45 PRIME URBAN Nishi Shinjuku I
46 PRIME URBAN Nishi Shinjuku II
47 PRIME URBAN Shinjuku Naitomachi
48 PRIME URBAN Nishi Waseda
49 PRIME URBAN Sangen JayaⅢ
50 PRIME URBAN Chitose Karasuyama
51 PRIME URBAN Karasuyama
52 PRIME URBAN Sangen Jaya
53 PRIME URBAN Minami Karasuyama
54 PRIME URBAN Karasuyama Galleria
55 PRIME URBAN Karasuyama Court
56 PRIME URBAN Chitose Funabashi
57 PRIME URBAN Yoga
58 PRIME URBAN Shinagaw a Nishi
59 PRIME URBAN Oimachi
60 PRIME URBAN Osaki
61 PRIME URBAN Oimachi II
62 PRIME URBAN Yukigaya
63 PRIME URBAN Omori
64 PRIME URBAN Denenchofu Minami
65 PRIME URBAN Nakano Kamitakada
66 PRIME URBAN Takaido
67 PRIME URBAN Nishi Ogikubo
68 PRIME URBAN Otsuka
69 PRIME URBAN Komagome
70 PRIME URBAN Monzen Nakacho
71 PRIME URBAN Kameido
72 PRIME URBAN Sumiyoshi
73 PRIME URBAN Mukojima
74 PRIME URBAN Kinshi Koen
75 PRIME URBAN Kinshicho
76 PRIME URBAN Hirai
77 PRIME URBAN Kasai
78 PRIME URBAN Kasai II
79 PRIME URBAN Kasai East
80 PRIME URBAN Ekoda
81 PRIME URBAN Itabashi Kuyakushomae
82 PRIME URBAN Asakusa
83 PRIME URBAN Machiya South Court
84 PRIME URBAN Musashi Koganei
85 PRIME URBAN Musashino Hills
86 PRIME URBAN Koganei Honcho
87 PRIME URBAN Kumegaw a
88 PRIME URBAN Musashi Kosugi comodo
89 PRIME URBAN Shinyurigaoka
90 PRIME URBAN Tsurumi Teraya
91 PRIME URBAN Urayasu
92 PRIME URBAN Gyotoku I
93 PRIME URBAN Gyotoku II
94 PRIME URBAN Gyotoku Ekimae
95 PRIME URBAN Gyotoku EkimaeⅡ
96 PRIME URBAN GyotokuⅢ
97 PRIME URBAN Nishi Funabashi
98 PRIME URBAN Kaw aguchi
99 URBAN STAGE Ebisu
100 URBAN STAGE Meguro Aobadai
101 URBAN STAGE Gakugei Daigaku
102 URBAN STAGE Nihonbashi Hamacho
103 URBAN STAGE Naka Ochiai
104 URBAN STAGE Shinjuku Ochiai
105 URBAN STAGE Mejiro
106 URBAN STAGE Kagurazaka
107 URBAN STAGE Roka Koen
108 URBAN STAGE Kamiuma
109 URBAN STAGE Sangen Jaya II
110 URBAN STAGE Komazaw a
111 URBAN STAGE Kamikitazaw a
112 URBAN STAGE Nakano
113 URBAN STAGE Ikebukuro
114 URBAN STAGE Hino
115 URBAN STAGE Kaw asaki
116 URBAN STAGE Urayasu
117 URBAN STAGE Minami Gyotoku II
118 URBAN STAGE Minami Gyotoku III
119 URBAN STAGE Minami Gyotoku IV

31
Portfolio Map ( Other Areas )
Sendai 5 Properties
Sapporo 13 Properties
Nagoya 5 Properties
Fukuoka 5 Properties
Osaka 6 Properties
120 PROUD FLAT Itsutsubashi
121 PROUD FLAT Kaw aramachi
122 PROUD FLAT Shin Osaka
123 PRIME URBAN Yamahana
124 PRIME URBAN Kita Juyo Jo
125 PRIME URBAN Odori Koen I
126 PRIME URBAN Odori Koen II
127 PRIME URBAN Kita Juichi Jo
128 PRIME URBAN Miyanosaw a
129 PRIME URBAN Odori Higashi
130 PRIME URBAN Chiji Koukan
131 PRIME URBAN Maruyama
132 PRIME URBAN Kita Nijuyo Jo
133 PRIME URBAN Sapporo Idaimae
134 PRIME URBAN Nagamachi Icchome
135 PRIME URBAN Yaotome Chuo
136 PRIME URBAN Aoi
137 PRIME URBAN Kanayama
138 PRIME URBAN Tsurumai
139 PRIME URBAN Esaka I
140 PRIME URBAN Esaka II
141 PRIME URBAN Esaka III
142 URBAN STAGE Sapporo Riverfront
143 URBAN STAGE Kita 3 Jo Dori
144 URBAN STAGE Tsutsumidori Amamiya
145 URBAN STAGE Kamimaezu
146 URBAN STAGE Izumi
147 URBAN STAGE Tamatsukuri
148 URBAN STAGE Sakaisuji Honmachi
149 Benefis Hakata Grand Suite
150 Benefis Yakuin Minami
151 Benefis Kashii Verbena
152 Benefis Hakata Higashi Grand Suite
153 Benefis Chihaya Grand Suite

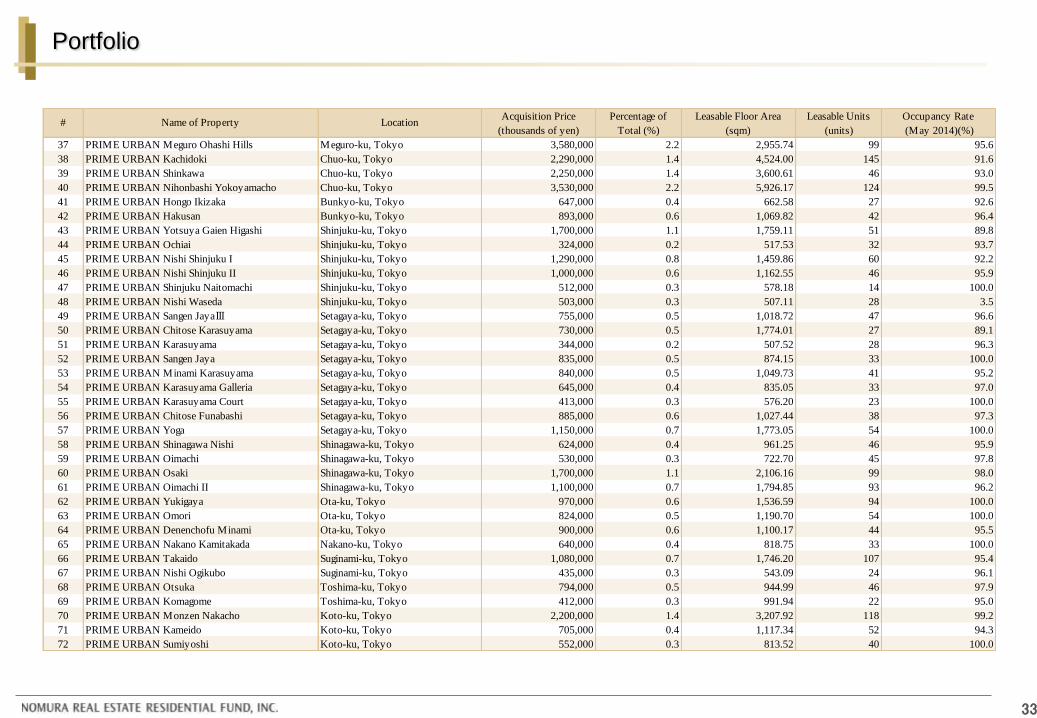
Portfolio
32
Acquisition Price
(thousands of yen)
1 PROUD FLAT Shirokane Takanawa Minato-ku, Tokyo 3,510,000 2.2 2,950.11 106 92.6
2 PROUD FLAT Yoyogi Uehara Shibuya-ku, Tokyo 1,100,000 0.7 1,151.34 44 100.0
3 PROUD FLAT Hatsudai Shibuya-ku, Tokyo 865,000 0.5 958.98 31 100.0
4 PROUD FLAT Shibuya Sakuragaoka Shibuya-ku, Tokyo 800,000 0.5 638.70 30 100.0
5 PROUD FLAT Gakugei Daigaku Meguro-ku, Tokyo 812,000 0.5 934.39 41 97.1
6 PROUD FLAT Meguro Gyoninzaka Meguro-ku, Tokyo 882,000 0.6 855.23 40 92.6
7 PROUD FLAT Sumida Riverside Chuo-ku, Tokyo 2,260,000 1.4 3,055.21 110 98.6
8 PROUD FLAT Kagurazaka Shinjuku-ku, Tokyo 1,540,000 1.0 1,793.43 70 100.0
9 PROUD FLAT Waseda Shinjuku-ku, Tokyo 1,110,000 0.7 1,450.91 60 96.9
10 PROUD FLAT Shinjuku Kawadacho Shinjuku-ku, Tokyo 1,010,000 0.6 1,102.20 41 100.0
11 PROUD FLAT Sangen Jaya Setagaya-ku, Tokyo 1,350,000 0.8 1,277.82 48 88.3
12 PROUD FLAT Kamata Ota-ku, Tokyo 1,140,000 0.7 1,541.64 67 97.1
13 PROUD FLAT Kamata II Ota-ku, Tokyo 2,980,000 1.9 4,051.72 169 98.6
14 PROUD FLAT Shinotsuka Toshima-ku, Tokyo 695,000 0.4 752.09 35 97.2
15 PROUD FLAT Kiyosumi Shirakawa Koto-ku, Tokyo 900,000 0.6 1,209.56 55 100.0
16 PROUD FLAT Monzen Nakacho II Koto-ku, Tokyo 650,000 0.4 830.55 35 89.5
17 PROUD FLAT Monzen Nakacho I Koto-ku, Tokyo 1,130,000 0.7 1,191.08 55 100.0
18 PROUD FLAT Fujimidai Nerima-ku, Tokyo 1,370,000 0.9 2,222.05 94 100.0
19 PROUD FLAT Asakusa Komagata Taito-ku, Tokyo 1,960,000 1.2 2,685.39 79 96.7
20 PROUD FLAT Yokohama Yokohama-shi, Kanagawa 2,340,000 1.5 3,118.12 113 95.9
21 PROUD FLAT Kamioooka Yokohama-shi, Kanagawa 2,770,000 1.7 4,872.17 200 87.5
22 PROUD FLAT Tsurumi II Yokohama-shi, Kanagawa 1,430,000 0.9 2,219.74 81 100.0
23 PRIME URBAN Azabu Juban Minato-ku, Tokyo 991,000 0.6 1,222.13 40 89.9
24 PRIME URBAN Akasaka Minato-ku, Tokyo 956,000 0.6 1,062.05 25 96.6
25 PRIME URBAN Tamachi Minato-ku, Tokyo 941,000 0.6 1,107.36 48 90.0
26 PRIME URBAN Shibaura LOFT Minato-ku, Tokyo 1,510,000 0.9 1,905.39 68 95.9
27 PRIME URBAN Hatagaya Shibuya-ku, Tokyo 452,000 0.3 650.60 38 100.0
28 PRIME URBAN Yoyogi Shibuya-ku, Tokyo 408,000 0.3 439.56 19 100.0
29 PRIME URBAN Bancho Chiyoda-ku, Tokyo 1,170,000 0.7 1,277.04 52 94.4
30 PRIME URBAN Chiyoda Fujimi Chiyoda-ku, Tokyo 707,000 0.4 793.87 32 90.8
31 PRIME URBAN Iidabashi Chiyoda-ku, Tokyo 2,030,000 1.3 2,087.70 90 95.7
32 PRIME URBAN Ebisu Meguro-ku, Tokyo 1,200,000 0.7 1,444.40 29 86.8
33 PRIME URBAN Naka Meguro Meguro-ku, Tokyo 1,320,000 0.8 1,302.42 49 93.9
34 PRIME URBAN Gakugei Daigaku Meguro-ku, Tokyo 886,000 0.6 1,008.39 32 90.8
35 PRIME URBAN Senzoku Meguro-ku, Tokyo 536,000 0.3 655.27 22 91.5
36 PRIME URBAN Meguro Riverside Meguro-ku, Tokyo 464,000 0.3 453.77 24 91.5
Occupancy Rate
(May 2014)(%)# Name of Property Location
Percentage of
Total (%)
Leasable Floor Area
(sqm)
Leasable Units
(units)
33
Portfolio
Acquisition Price
(thousands of yen)
37 PRIME URBAN Meguro Ohashi Hills Meguro-ku, Tokyo 3,580,000 2.2 2,955.74 99 95.6
38 PRIME URBAN Kachidoki Chuo-ku, Tokyo 2,290,000 1.4 4,524.00 145 91.6
39 PRIME URBAN Shinkawa Chuo-ku, Tokyo 2,250,000 1.4 3,600.61 46 93.0
40 PRIME URBAN Nihonbashi Yokoyamacho Chuo-ku, Tokyo 3,530,000 2.2 5,926.17 124 99.5
41 PRIME URBAN Hongo Ikizaka Bunkyo-ku, Tokyo 647,000 0.4 662.58 27 92.6
42 PRIME URBAN Hakusan Bunkyo-ku, Tokyo 893,000 0.6 1,069.82 42 96.4
43 PRIME URBAN Yotsuya Gaien Higashi Shinjuku-ku, Tokyo 1,700,000 1.1 1,759.11 51 89.8
44 PRIME URBAN Ochiai Shinjuku-ku, Tokyo 324,000 0.2 517.53 32 93.7
45 PRIME URBAN Nishi Shinjuku I Shinjuku-ku, Tokyo 1,290,000 0.8 1,459.86 60 92.2
46 PRIME URBAN Nishi Shinjuku II Shinjuku-ku, Tokyo 1,000,000 0.6 1,162.55 46 95.9
47 PRIME URBAN Shinjuku Naitomachi Shinjuku-ku, Tokyo 512,000 0.3 578.18 14 100.0
48 PRIME URBAN Nishi Waseda Shinjuku-ku, Tokyo 503,000 0.3 507.11 28 3.5
49 PRIME URBAN Sangen JayaⅢ Setagaya-ku, Tokyo 755,000 0.5 1,018.72 47 96.6
50 PRIME URBAN Chitose Karasuyama Setagaya-ku, Tokyo 730,000 0.5 1,774.01 27 89.1
51 PRIME URBAN Karasuyama Setagaya-ku, Tokyo 344,000 0.2 507.52 28 96.3
52 PRIME URBAN Sangen Jaya Setagaya-ku, Tokyo 835,000 0.5 874.15 33 100.0
53 PRIME URBAN Minami Karasuyama Setagaya-ku, Tokyo 840,000 0.5 1,049.73 41 95.2
54 PRIME URBAN Karasuyama Galleria Setagaya-ku, Tokyo 645,000 0.4 835.05 33 97.0
55 PRIME URBAN Karasuyama Court Setagaya-ku, Tokyo 413,000 0.3 576.20 23 100.0
56 PRIME URBAN Chitose Funabashi Setagaya-ku, Tokyo 885,000 0.6 1,027.44 38 97.3
57 PRIME URBAN Yoga Setagaya-ku, Tokyo 1,150,000 0.7 1,773.05 54 100.0
58 PRIME URBAN Shinagawa Nishi Shinagawa-ku, Tokyo 624,000 0.4 961.25 46 95.9
59 PRIME URBAN Oimachi Shinagawa-ku, Tokyo 530,000 0.3 722.70 45 97.8
60 PRIME URBAN Osaki Shinagawa-ku, Tokyo 1,700,000 1.1 2,106.16 99 98.0
61 PRIME URBAN Oimachi II Shinagawa-ku, Tokyo 1,100,000 0.7 1,794.85 93 96.2
62 PRIME URBAN Yukigaya Ota-ku, Tokyo 970,000 0.6 1,536.59 94 100.0
63 PRIME URBAN Omori Ota-ku, Tokyo 824,000 0.5 1,190.70 54 100.0
64 PRIME URBAN Denenchofu Minami Ota-ku, Tokyo 900,000 0.6 1,100.17 44 95.5
65 PRIME URBAN Nakano Kamitakada Nakano-ku, Tokyo 640,000 0.4 818.75 33 100.0
66 PRIME URBAN Takaido Suginami-ku, Tokyo 1,080,000 0.7 1,746.20 107 95.4
67 PRIME URBAN Nishi Ogikubo Suginami-ku, Tokyo 435,000 0.3 543.09 24 96.1
68 PRIME URBAN Otsuka Toshima-ku, Tokyo 794,000 0.5 944.99 46 97.9
69 PRIME URBAN Komagome Toshima-ku, Tokyo 412,000 0.3 991.94 22 95.0
70 PRIME URBAN Monzen Nakacho Koto-ku, Tokyo 2,200,000 1.4 3,207.92 118 99.2
71 PRIME URBAN Kameido Koto-ku, Tokyo 705,000 0.4 1,117.34 52 94.3
72 PRIME URBAN Sumiyoshi Koto-ku, Tokyo 552,000 0.3 813.52 40 100.0
# Name of PropertyPercentage of
Total (%)
Leasable Floor Area
(sqm)
Leasable Units
(units)Location
Occupancy Rate
(May 2014)(%)

34
Portfolio
Acquisition Price
(thousands of yen)
73 PRIME URBAN Mukojima Sumida-ku, Tokyo 487,000 0.3 1,108.91 55 100.0
74 PRIME URBAN Kinshi Koen Sumida-ku, Tokyo 1,180,000 0.7 1,886.50 77 98.7
75 PRIME URBAN Kinshicho Sumida-ku, Tokyo 668,000 0.4 991.62 49 100.0
76 PRIME URBAN Hirai Edogawa-ku, Tokyo 700,000 0.4 1,095.91 53 100.0
77 PRIME URBAN Kasai Edogawa-ku, Tokyo 637,000 0.4 905.81 45 97.8
78 PRIME URBAN Kasai II Edogawa-ku, Tokyo 958,000 0.6 1,437.84 68 100.0
79 PRIME URBAN Kasai East Edogawa-ku, Tokyo 940,000 0.6 1,884.62 78 100.0
80 PRIME URBAN Ekoda Nerima-ku, Tokyo 385,000 0.2 872.49 35 97.4
81 PRIME URBAN Itabashi Kuyakushomae Itabashi-ku, Tokyo 940,000 0.6 1,742.64 68 91.2
82 PRIME URBAN Asakusa Taito-ku, Tokyo 350,000 0.2 876.70 22 100.0
83 PRIME URBAN Machiya South Court Arakawa-ku, Tokyo 1,740,000 1.1 4,141.56 77 97.6
84 PRIME URBAN Musashi Koganei Koganei-shi, Tokyo 2,390,000 1.5 5,999.80 98 93.9
85 PRIME URBAN Musashino Hills Koganei-shi, Tokyo 1,590,000 1.0 2,961.06 80 93.3
86 PRIME URBAN Koganei Honcho Koganei-shi, Tokyo 725,000 0.5 1,604.72 43 97.4
87 PRIME URBAN Kumegawa Higashimurayama-shi, Tokyo 1,370,000 0.9 2,610.05 91 97.4
88 PRIME URBAN Musashi Kosugi comodo Kawasaki-shi, Kanagawa 2,150,000 1.3 3,692.44 56 100.0
89 PRIME URBAN Shinyurigaoka Kawasaki-shi, Kanagawa 1,210,000 0.8 1,708.19 64 100.0
90 PRIME URBAN Tsurumi Teraya Yokohama-shi, Kanagawa 457,000 0.3 952.06 50 100.0
91 PRIME URBAN Urayasu Urayasu-shi, Chiba 840,000 0.5 1,264.84 60 93.3
92 PRIME URBAN Gyotoku I Ichikawa-shi, Chiba 635,000 0.4 1,151.36 52 96.2
93 PRIME URBAN Gyotoku II Ichikawa-shi, Chiba 741,000 0.5 1,244.00 58 100.0
94 PRIME URBAN Gyotoku Ekimae Ichikawa-shi, Chiba 476,000 0.3 778.19 37 97.3
95 PRIME URBAN Gyotoku EkimaeⅡ Ichikawa-shi, Chiba 561,000 0.4 927.33 46 97.8
96 PRIME URBAN GyotokuⅢ Ichikawa-shi, Chiba 948,000 0.6 1,766.47 77 98.7
97 PRIME URBAN Nishi Funabashi Funabashi-shi, Chiba 772,000 0.5 1,237.80 60 98.3
98 PRIME URBAN Kawaguchi Kawaguchi-shi, Saitama 2,170,000 1.4 2,477.11 98 86.9
99 URBAN STAGE Ebisu Shibuya-ku, Tokyo 1,030,000 0.6 1,184.85 35 93.7
100 URBAN STAGE Meguro Aobadai Meguro-ku, Tokyo 1,190,000 0.7 1,464.14 40 100.0
101 URBAN STAGE Gakugei Daigaku Meguro-ku, Tokyo 916,000 0.6 1,109.87 41 98.2
102 URBAN STAGE Nihonbashi Hamacho Chuo-ku, Tokyo 1,470,000 0.9 2,026.44 52 94.9
103 URBAN STAGE Naka Ochiai Shinjuku-ku, Tokyo 655,000 0.4 1,237.98 18 100.0
104 URBAN STAGE Shinjuku Ochiai Shinjuku-ku, Tokyo 635,000 0.4 1,053.39 28 91.8
105 URBAN STAGE Mejiro Shinjuku-ku, Tokyo 1,260,000 0.8 1,755.52 65 95.6
106 URBAN STAGE Kagurazaka Shinjuku-ku, Tokyo 2,640,000 1.6 2,853.82 100 99.3
107 URBAN STAGE Roka Koen Setagaya-ku, Tokyo 362,000 0.2 567.20 34 91.3
108 URBAN STAGE Kamiuma Setagaya-ku, Tokyo 900,000 0.6 1,739.86 37 95.5
Leasable Units
(units)
Occupancy Rate
(May 2014)(%)# Name of Property Location
Percentage of
Total (%)
Leasable Floor Area
(sqm)

35
Portfolio
Acquisition Price
(thousands of yen)
109 URBAN STAGE Sangen Jaya II Setagaya-ku, Tokyo 539,000 0.3 810.98 17 91.2
110 URBAN STAGE Komazawa Setagaya-ku, Tokyo 396,000 0.2 572.41 26 100.0
111 URBAN STAGE Kamikitazawa Setagaya-ku, Tokyo 738,000 0.5 1,384.45 29 96.3
112 URBAN STAGE Nakano Nakano-ku, Tokyo 472,000 0.3 801.30 51 96.2
113 URBAN STAGE Ikebukuro Toshima-ku, Tokyo 3,310,000 2.1 4,376.95 131 93.0
114 URBAN STAGE Hino Hino-shi, Tokyo 319,000 0.2 994.68 54 85.2
115 URBAN STAGE Kawasaki Kawasaki-shi, Kanagawa 1,150,000 0.7 1,706.46 80 100.0
116 URBAN STAGE Urayasu Urayasu-shi, Chiba 277,000 0.2 437.94 27 96.3
117 URBAN STAGE Minami Gyotoku II Ichikawa-shi, Chiba 285,000 0.2 611.61 37 94.6
118 URBAN STAGE Minami Gyotoku III Ichikawa-shi, Chiba 263,000 0.2 542.69 33 93.9
119 URBAN STAGE Minami Gyotoku IV Ichikawa-shi, Chiba 256,000 0.2 535.08 32 90.4
Greater Tokyo Area 129,840,000 81.0 185,115.32 6,691 95.7
120 PROUD FLAT Itsutsubashi Sendai-shi, Miyagi 682,000 0.4 1,861.56 60 97.8
121 PROUD FLAT Kawaramachi Sendai-shi, Miyagi 724,000 0.5 1,967.54 64 96.1
122 PROUD FLAT Shin Osaka Osaka-shi, Osaka 1,430,000 0.9 2,990.68 112 96.6
123 PRIME URBAN Yamahana Sapporo-shi, Hokkaido 377,000 0.2 1,518.58 33 96.5
124 PRIME URBAN Kita Juyo Jo Sapporo-shi, Hokkaido 336,000 0.2 1,155.60 36 93.6
125 PRIME URBAN Odori Koen I Sapporo-shi, Hokkaido 530,000 0.3 1,850.20 53 100.0
126 PRIME URBAN Odori Koen II Sapporo-shi, Hokkaido 322,000 0.2 1,148.72 36 100.0
127 PRIME URBAN Kita Juichi Jo Sapporo-shi, Hokkaido 600,000 0.4 1,851.39 60 100.0
128 PRIME URBAN Miyanosawa Sapporo-shi, Hokkaido 576,200 0.4 2,114.53 54 98.4
129 PRIME URBAN Odori Higashi Sapporo-shi, Hokkaido 424,000 0.3 1,494.36 36 100.0
130 PRIME URBAN Chiji Koukan Sapporo-shi, Hokkaido 337,900 0.2 1,007.30 42 100.0
131 PRIME URBAN Maruyama Sapporo-shi, Hokkaido 283,200 0.2 911.07 27 100.0
132 PRIME URBAN Kita Nijuyo Jo Sapporo-shi, Hokkaido 503,700 0.3 1,773.90 36 91.6
133 PRIME URBAN Sapporo Idaimae Sapporo-shi, Hokkaido 731,600 0.5 2,439.90 58 93.5
134 PRIME URBAN Nagamachi Icchome Sendai-shi, Miyagi 1,110,000 0.7 3,411.24 60 94.4
135 PRIME URBAN Yaotome Chuo Sendai-shi, Miyagi 428,000 0.3 1,380.21 43 97.8
136 PRIME URBAN Aoi Nagoya-shi, Aichi 724,000 0.5 1,571.04 46 88.5
137 PRIME URBAN Kanayama Nagoya-shi, Aichi 632,000 0.4 1,391.02 58 96.5
138 PRIME URBAN Tsurumai Nagoya-shi, Aichi 1,189,096 0.7 2,502.11 104 93.3
139 PRIME URBAN Esaka I Suita-shi, Osaka 672,000 0.4 1,189.12 48 85.5
140 PRIME URBAN Esaka II Suita-shi, Osaka 790,000 0.5 1,392.00 57 98.3
141 PRIME URBAN Esaka III Suita-shi, Osaka 1,535,000 1.0 2,151.67 79 91.5
142 URBAN STAGE Sapporo Riverfront Sapporo-shi, Hokkaido 3,500,000 2.2 15,552.59 311 96.4
143 URBAN STAGE Kita 3 Jo Dori Sapporo-shi, Hokkaido 1,450,000 0.9 5,094.29 114 100.0
LocationPercentage of
Total (%)
Leasable Floor Area
(sqm)
Leasable Units
(units)
Occupancy Rate
(May 2014)(%)# Name of Property

36
Portfolio
Acquisition Price
(thousands of yen)
144 URBAN STAGE Tsutsumidori Amamiya Sendai-shi, Miyagi 969,000 0.6 4,251.91 65 96.8
145 URBAN STAGE Kamimaezu Nagoya-shi, Aichi 1,250,000 0.8 3,541.43 101 100.0
146 URBAN STAGE Izumi Nagoya-shi, Aichi 2,800,000 1.7 7,543.10 250 95.9
147 URBAN STAGE Tamatsukuri Osaka-shi, Osaka 906,000 0.6 2,373.10 80 95.4
148 URBAN STAGE Sakaisuji Honmachi Osaka-shi, Osaka 1,780,000 1.1 3,909.90 82 90.7
149 Benefis Hakata Grand Suite Fukuoka-shi, Fukuoka 830,000 0.5 2,176.23 67 96.2
150 Benefis Yakuin Minami Fukuoka-shi, Fukuoka 351,000 0.2 897.84 34 100.0
151 Benefis Kashii Verbena Fukuoka-shi, Fukuoka 396,000 0.2 1,222.34 39 92.3
152 Benefis Hakata Higashi Grand Suite Fukuoka-shi, Fukuoka 693,000 0.4 1,854.13 65 97.4
153 Benefis Chihaya Grand Suite Fukuoka-shi, Fukuoka 545,000 0.3 1,740.70 48 94.0
Other Areas 30,407,696 19.0 89,231.30 2,458 96.1
Total 160,247,696 100.0 274,346.62 9,149 95.8
# Name of Property LocationPercentage of
Total (%)
Leasable Floor Area
(sqm)
Leasable Units
(units)
Occupancy Rate
(May 2014)(%)
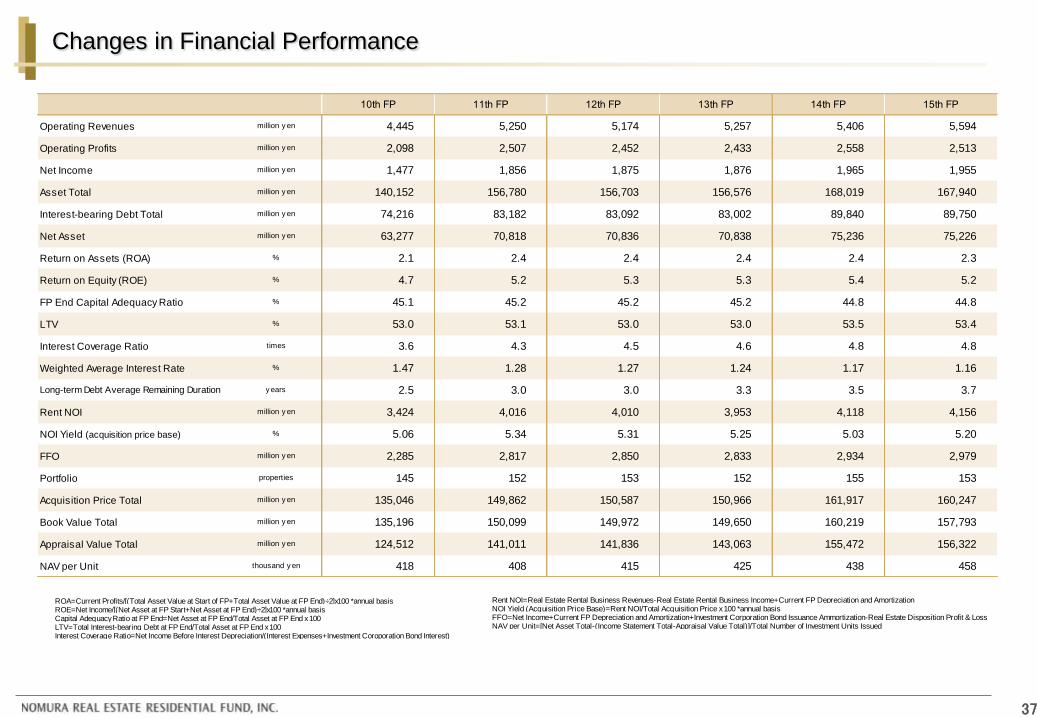
Changes in Financial Performance
37
Rent NOI=Real Estate Rental Business Revenues-Real Estate Rental Business Income+Current FP Depreciation and AmortizationNOI Yield (Acquisition Price Base)=Rent NOI/Total Acquisition Price x 100 *annual basisFFO=Net Income+Current FP Depreciation and Amortization+Investment Corporation Bond Issuance Ammortization-Real Estate Disposition Profit & LossNAV per Unit=[Net Asset Total-(Income Statement Total-Appraisal Value Total)]/Total Number of Investment Units Issued
ROA=Current Profits/[(Total Asset Value at Start of FP+Total Asset Value at FP End)÷2]x100 *annual basisROE=Net Income/[(Net Asset at FP Start+Net Asset at FP End)÷2]x100 *annual basisCapital Adequacy Ratio at FP End=Net Asset at FP End/Total Asset at FP End x 100LTV=Total Interest-bearing Debt at FP End/Total Asset at FP End x 100Interest Coverage Ratio=Net Income Before Interest Depreciation/(Interest Expenses+Investment Coroporation Bond Interest)
10th FP 11th FP 12th FP 13th FP 14th FP 15th FP
Operating Revenues million y en 4,445 5,250 5,174 5,257 5,406 5,594
Operating Profits million y en 2,098 2,507 2,452 2,433 2,558 2,513
Net Income million y en 1,477 1,856 1,875 1,876 1,965 1,955
Asset Total million y en 140,152 156,780 156,703 156,576 168,019 167,940
Interest-bearing Debt Total million y en 74,216 83,182 83,092 83,002 89,840 89,750
Net Asset million y en 63,277 70,818 70,836 70,838 75,236 75,226
Return on Assets (ROA) % 2.1 2.4 2.4 2.4 2.4 2.3
Return on Equity (ROE) % 4.7 5.2 5.3 5.3 5.4 5.2
FP End Capital Adequacy Ratio % 45.1 45.2 45.2 45.2 44.8 44.8
LTV % 53.0 53.1 53.0 53.0 53.5 53.4
Interest Coverage Ratio times 3.6 4.3 4.5 4.6 4.8 4.8
Weighted Average Interest Rate % 1.47 1.28 1.27 1.24 1.17 1.16
Long-term Debt Average Remaining Duration y ears 2.5 3.0 3.0 3.3 3.5 3.7
Rent NOI million y en 3,424 4,016 4,010 3,953 4,118 4,156
NOI Yield (acquisition price base) % 5.06 5.34 5.31 5.25 5.03 5.20
FFO million y en 2,285 2,817 2,850 2,833 2,934 2,979
Portfolio properties 145 152 153 152 155 153
Acquisition Price Total million y en 135,046 149,862 150,587 150,966 161,917 160,247
Book Value Total million y en 135,196 150,099 149,972 149,650 160,219 157,793
Appraisal Value Total million y en 124,512 141,011 141,836 143,063 155,472 156,322
NAV per Unit thousand y en 418 408 415 425 438 458

Interest-bearing Debts
38
Lender Diversification (20 Lenders)
Maturity Diversification
LenderAmount
(millions of yen)
The Bank of Tokyo-Mitsubishi UFJ 12,500
Sumitomo Mitsui Banking 12,500
Mizuho Corporate Bank 7,220
Resona Bank 2,400
Mitsubishi UFJ Trust and Banking 12,500
Sumitomo Mitsui Trust Bank 5,520
The Nomura Trust and Banking 3,700
Mizuho Trust & Banking 1,500
The Iyo Bank 1,000
The Bank of Fukuoka 1,000
The Chiba Bank 750
The Tokyo Tomin Bank 500
Taiyo Life Insurance 3,000
Mitsui Sumitomo Insurance 2,100
Daido Life Insurance 1,100
Dai-ichi Life Insurance Co., Ltd. 800
Nippon Life Insurance Company 500
Development Bank of Japan 7,640
Shinkin Central Bank 2,520
Aozora Bank 1,000
Total
(20)79,750
First Series UnsecuredInvestment CorporationBonds
5,000
Second Series UnsecuredInvestment CorporationBonds
5,000
Total 10,000
Major
Banks
(4)
Trust
Banks
(4)
Regional
Banks
(4)
Insurance
Companies
(5)
Others
(3)
Bond
FP of Repayment Amount of Repayment Lender Amount Date of Loan Date of Repayment Category
6 Lenders ¥3,170 million 0.71000% Aug. 27, 2012 Aug. 27, 2014
3 Lenders ¥3,400 million 0.94700% Sep. 05, 2011 Sep. 05, 2014
1 Lender ¥40 million 2.10000% Aug. 27, 2009 (Note 2)
1 Lender ¥50 million 2.03000% Feb. 26, 2010 (Note 3)
1 Lender ¥1,000 million 1.79200% Feb. 26, 2010 Feb. 26, 2015
1 Lender ¥1,300 million 2.23500% May. 15, 2007 Feb. 27, 2015
5 Lenders ¥5,400 million 0.96365% Feb. 27, 2012 Feb. 27, 2015
1 Lender ¥40 million 2.10000% Aug. 27, 2009 (Note 2)
1 Lender ¥50 million 2.03000% Feb. 26, 2010 (Note 3)
5 Lenders ¥9,700 million 1.00900% Feb. 27, 2012 Aug. 27, 2015
1 Lender ¥40 million 2.10000% Aug. 27, 2009 (Note 2)
1 Lender ¥50 million 2.03000% Feb. 26, 2010 (Note 3)
1 Lender ¥4,700 million 1.00000% Dec. 26, 2011 Dec. 26, 2015
1 Lender ¥40 million 2.10000% Aug. 27, 2009 (Note 2)
1 Lender ¥50 million 2.03000% Feb. 26, 2010 (Note 3)
2 Lenders ¥9,400 million 1.11700% Dec. 26, 2011 Jun. 26, 2016
1 Lender ¥1,080 million 2.10000% Aug. 27, 2009 Aug. 27, 2016
1 Lender ¥50 million 2.03000% Feb. 26, 2010 (Note 3)
3 Lender ¥1,800 million 0.69000% Oct. 25, 2013 Feb. 26, 2017
1 Lender ¥1,350 million 2.03000% Feb. 26, 2010 Feb. 26, 2017
22th Fiscal Period
(ending Nov. 30, 2017)¥3,920 million 3 Lender ¥3,920 million 1.08500% Aug. 27, 2012 Aug. 27, 2017
¥5,420 million 6 Lender ¥5,420 million 1.12013% Aug. 27, 2012 Feb. 27, 2018
¥5,400 million 3 Lender ¥5,400 million 0.99000% Sep. 30, 2013 Aug. 26, 2018
26th Fiscal Period
(ending Nov. 30, 2019)¥1,600 million 4 Lender ¥1,600 million 1.16500% Dec. 03, 2012 Nov. 26, 2019
27th Fiscal Period
(ending May 31, 2020)¥1,000 million 1 Lender ¥1,000 million 1.48625% May. 23, 2013 May. 27, 2020
1 Lender ¥800 million 1.28277% Sep. 30, 2013 Aug. 26, 2020
6 Lender ¥4,700 million 1.18000% Oct. 25, 2013 Aug. 26, 2020
1 Lender ¥500 million 1.15566% Oct. 25, 2013 Aug. 26, 2020
1 Lender ¥2,000 million 1.17750% Feb. 27, 2014 Feb. 26, 2021
1 Lender ¥1,000 million 1.68200% May. 23, 2013 May. 27, 2021
1 Lender ¥3,500 million 1.62500% May. 23, 2013 May. 27, 2021
30th Fiscal Period
(ending Nov. 30, 2021)¥2,700 million 1 Lender ¥2,700 million 1.24100% Feb. 27, 2014 Aug. 26, 2021
31th Fiscal Period
(ending May 31, 2022)¥4,500 million 5 Lender ¥4,500 million 1.31850% Feb. 27, 2014 Feb. 26, 2022
¥79,750 million 20 Lenders - - -
19th Fiscal Period
(ending May 31, 2016)¥5,000 million
Investment
Corporation Bond¥5,000 million 1.21000% Feb. 25, 2011 Feb. 25, 2016
21st Fiscal Period
(ending May 31, 2017)¥5,000 million
Investment
Corporation Bond¥5,000 million 1.03000% Feb. 24, 2012 Feb. 24, 2017
¥89,750 million - - - -
(Note 1) The interest rate stated regarding this loan takes into consideration the Interest Rate Swap transaction.
(Note 2) The amount of ¥40 million to be repayed on February 27, 2010, the first repayment date, and every August 27 and February 27 thereafter, until the last repayment of ¥1,080 million on August 27, 2016.
(Note 3) The amount of ¥50 million to be repayed on August 26, 2010, the first repayment date, and every February 26 and August 26 thereafter, until the last repayment of ¥1,350 million on February 26, 2017.
(Note 4) Regarding the Floating Rate, the interest rate as of the end of the 11th Fiscal Period is stated.
28th Fiscal Period
(ending Nov. 30, 2020)
16th Fiscal Period
(ending Nov. 30, 2014)
17th Fiscal Period
(ending May 31, 2015)
18th Fiscal Period
(ending Nov. 30, 2015)
21st Fiscal Period
(ending May 31, 2017)
20th Fiscal Period
(ending Nov. 30, 2016)
Interest Rate
19th Fiscal Period
(ending May 31, 2016)
¥6,660 million
-
¥7,790 million
¥9,790 million
¥4,790 million
¥10,530 million
-
Short-term Loan
¥14,450 million
29th Fiscal Period
(ending May 31, 2021)¥6,500 million
Long-term Loan
¥65,300 million
¥3,150 million
¥6,000 million
23th Fiscal Period
(ending May 31, 2018)
24th Fiscal Period
(ending Nov. 30, 2018)

Fund Profile
39
Structure
July 28, 2006
Notification of incorporation by the founder (Nomura Real
Estate Asset Management Co., Ltd.) under Article 69 of the
Investment Trust Law.
August 3, 2006
Registration of incorporation under Article 166 of the
Investment Trust Law. Incorporation of the Nomura Real
Estate Residential Fund, Inc.
August 4, 2006
Applied for registration under Article 188 of the Investment
Trust Law.
August 24, 2006
Registration approved by the Prime Minister of Japan under
Article 187 of the Investment Trust Law (Registration number
56, filed with the Director of the Kanto Local Finance Bureau).
February 14, 2007
Listing on the Tokyo Stock Exchange.
History
Asset Custody Agreement
Administration Agreement, etc.
Investment
Rent, etc.
Property Information
Distribution
CapitalInvestment
DebtFinance
Repaymentof Principal& Interest
Instructions forRent &
Management
Rental Strategies,Plans for
Repairs, etc.
Financial Agent
Agreement
Asset CustodianGeneral Administration
Administration ofUnitholders Register
Management ofSpecial Accounts
Mitsubishi UFJTrust and Banking
Corporation
Information & ResearchService Providers
Development Co., Ltd.
Nomura Real EstateUrban Net Co., Ltd.
Nomura Real Estate
Specified Related Party
Development Co., Ltd.Nomura Real Estate
Nomura Real EstateHoldings, Inc.
Nomura Real EstatePartners Co., Ltd.
Property ManagementCompanies
Select the best property management companies
for each property
The Bank of Tokyo-Mitsubishi UFJ, Ltd.
General Administration(Financial Agent)
Sumitomo Mitsui Banking Corporation
Financial Institutions, etc.
General Administration(Accounting, etc.)
Heiseikaikeisha TaxCorporation
Unitholders
Unitholders
Debt
Equity
Asset
Nomura Real Estate Residential Fund, Inc.
Unitholders Meeting
Ernst & Young ShinNihon LLC
The FundAsset Management
Company
Residential Properties(Real Estate Related Assets)
Board of Directors Meeting
Auditor
Accounting
AgreementService
Asset
ServicesAgreement
Management
Property Management

Asset Management Company Overview
40
■ Overview
Company name
Shareholder
Location
Contact Information
Nomura Real Estate Asset Management Co., Ltd.
Nomura Real Estate Holdings, Inc. (100%)
8-5-1 Nishi-Shinjuku, Shinjuku-ku, Tokyo +81-3-3365-7729 [email protected]
・Financial instruments business operator registration: Commissioner of the Kanto Local Finance Bureau (Financial Instruments) No. 374 ・Licensed for discretionary proxy in realty trading: Minister of Land, Infrastructure and Transport Permit No.18 ・Licensed for real estate trading: Governor of Tokyo (3) No. 81679
・The Investment Trusts Association, Japan; The Japan Investment Advisers Association, The Association for Real Estate Securitization, etc.
Registration, License, etc. Memberships
Organization Chart (as of May 2014)

This document has been prepared for the purpose of provision of information only, and should not be construed
as an offer, solicitation or commercial conduct of any nature associated with any specific products. Investors
wishing to purchase the investment units of Nomura Real Estate Residential Fund, Inc. should contact their own
securities brokers or dealers. A fee may be charged by your financial instruments business operator in relation
to the sale or purchase of investment units.
For management fees that the Fund pays to Nomura Real Estate Asset Management Co., Ltd., please refer to
the terms and conditions of the Fund, asset management reports, etc.
The forward-looking statements with respect to the future financial results contained in this document are based
on the current facts about the investment policy of the Fund, applicable laws and regulations, the market
environment, business practice, etc., as of the preparation date of this document and do not reflect or consider
any changes in the circumstances after the preparation date. These forward-looking statements inherently
reflect uncertainty about known risks as well as unknown risks and other factors and may deviate from the
actual operating and management results, financial conditions, etc., of the Fund.
Investment in real estate investment securities may result in a loss due to a decline in the transaction price
caused by, for example, changes in the price or the revenue-generating capability of the underlying properties
or deterioration of the financial conditions of the issuer.
Although the information contained in this document is intended to be complete and thorough, there is no
assurance of precision and safety of the same. Please note that the contents of this document is subject to
change or cancellation without prior notice.
It is prohibited to make duplication, reproduction, distribution or use of any part or whole of the information
contained in this document without express prior written consent.