15455-15495 Los Gatos Boulevard, Los Gatos California ...15455-15495 Los Gatos Boulevard, Los Gatos...
6
Dixie Divine 408.879.4001 [email protected] CA BRE 00926251 & 01481181 Doug Ferrari 408.879.4002 [email protected] CA BRE 01032363 1543 Lafayette Street, Suite C Santa Clara, 95050 Office 408.879.4000 Fax 408.879.4004 www.primecommercialinc.com 15455-15495 Los Gatos Boulevard, Los Gatos California NEW TOWN CENTER Retail & Restaurant Space For Lease
Transcript of 15455-15495 Los Gatos Boulevard, Los Gatos California ...15455-15495 Los Gatos Boulevard, Los Gatos...
Dixie Divine 408.879.4001 [email protected] CA BRE 00926251 & 01481181
Doug Ferrari 408.879.4002 [email protected] CA BRE 01032363
1543 Lafayette Street, Suite C Santa Clara, 95050Office 408.879.4000 Fax 408.879.4004
www.primecommercialinc.com
15455-15495 Los Gatos Boulevard, Los Gatos CaliforniaNEW TOWN CENTERRetail & Restaurant Space For Lease
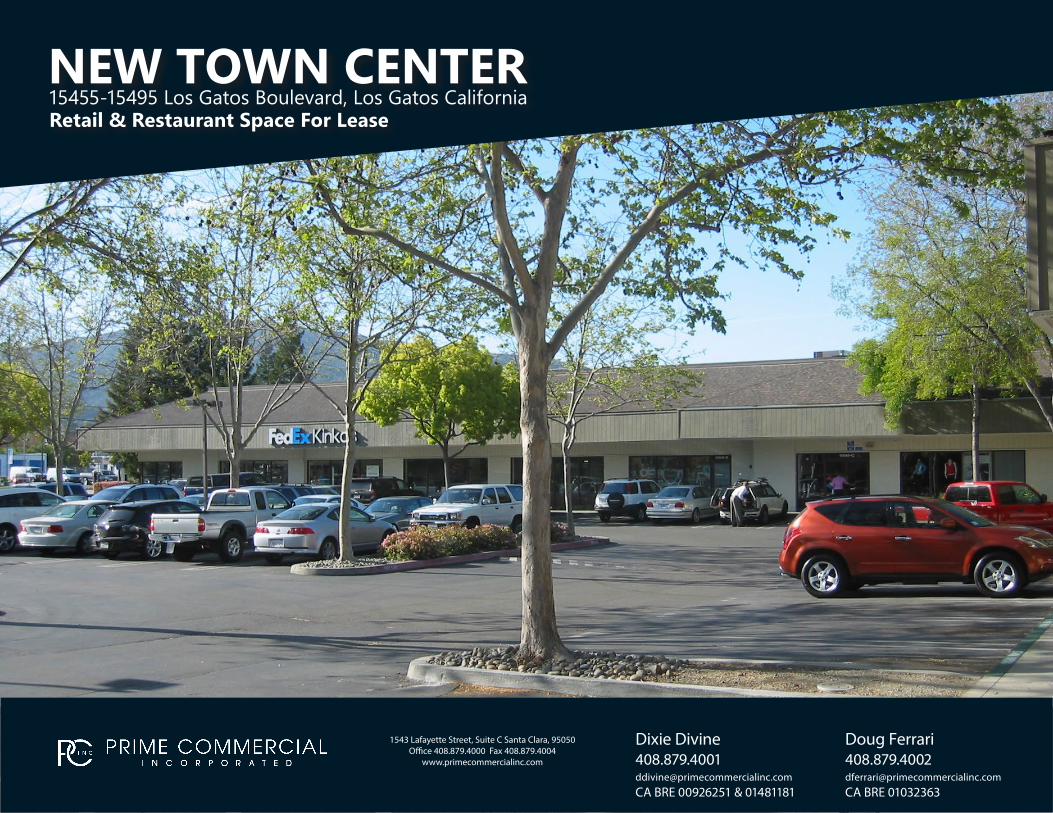
FEATURES• 2,800 SF Second-Generation Pizza Space
$4.50/SF NNN• 5,021 SF Freestanding Retail/Restaurant Space
$4.25/SF NNN• 1,200 SF Retail Space • High Visibility Los Gatos Location on Los Gatos Blvd
with 26,944 ADT• Abundant Parking and Strong Demographics• Anchored by FedEx Kinkos & O’Reilly Auto Parts• Convenient Hwy 17 & 85 Access
DEMOGRAPHICS 1 Mile 3 Miles 5 MilesPopulation 13,469 115,085 313,098Avg HH Income $220,970 $188,232 $180,062
Los Gatos Blvd 26,944 ADT
Dixie Divine 408.879.4001 [email protected] CA BRE 00926251 & 01481181
Doug Ferrari 408.879.4002 [email protected] CA BRE 01032363
1543 Lafayette Street, Suite C Santa Clara, 95050Office 408.879.4000 Fax 408.879.4004
www.primecommercialinc.com
15455-15495 Los Gatos Boulevard, Los Gatos CaliforniaNEW TOWN CENTER
5,021SF
1,200
2,800SF
Dixie Divine 408.879.4001 [email protected] CA BRE 00926251 & 01481181
Doug Ferrari 408.879.4002 [email protected] CA BRE 01032363
1543 Lafayette Street, Suite C Santa Clara, 95050Office 408.879.4000 Fax 408.879.4004
www.primecommercialinc.com
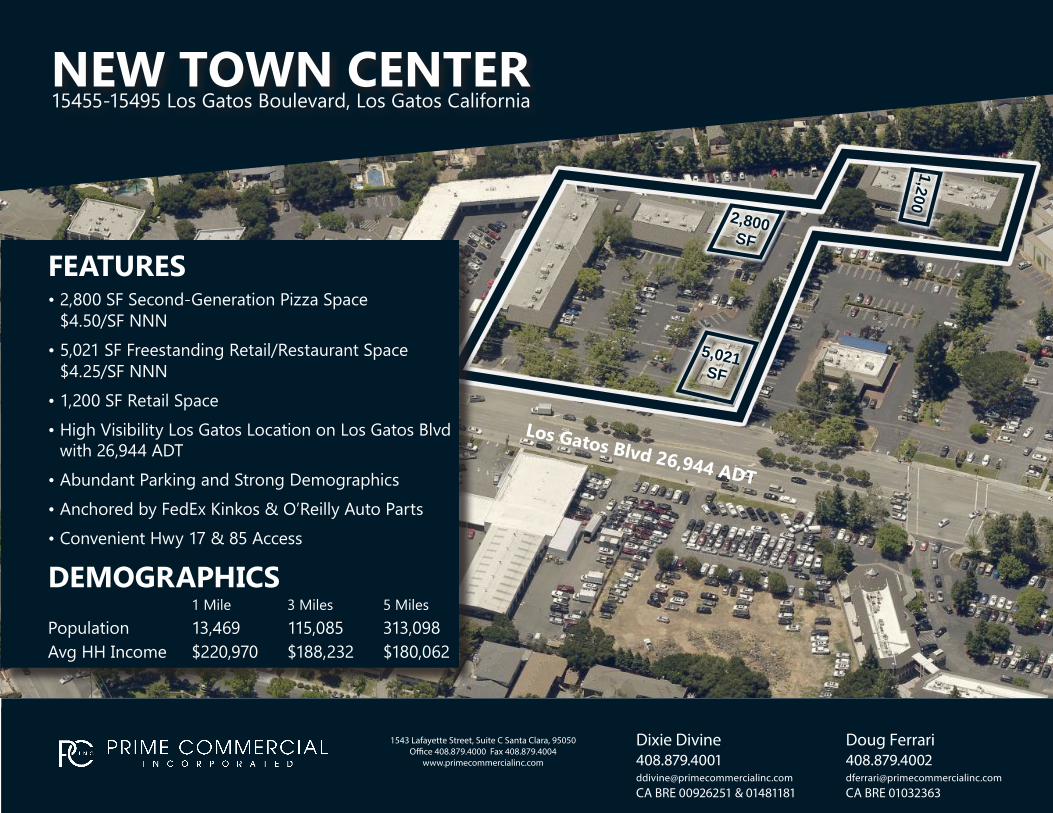
1,200 SF Retail
Los G
atos
Blv
d
5,021 SF Freestanding Retail / Restaurant Possible
2,800 SF Restaurant
15455-15495 Los Gatos Boulevard, Los Gatos CaliforniaNEW TOWN CENTER

Dixie Divine 408.879.4001 [email protected] CA BRE 00926251 & 01481181
Doug Ferrari 408.879.4002 [email protected] CA BRE 01032363
1543 Lafayette Street, Suite C Santa Clara, 95050Office 408.879.4000 Fax 408.879.4004
www.primecommercialinc.com
38’
16’16’
82’
5’
54’
98’
3’
Los G
atos
Blv
d
15455-15495 Los Gatos Boulevard, Los Gatos CaliforniaNEW TOWN CENTER
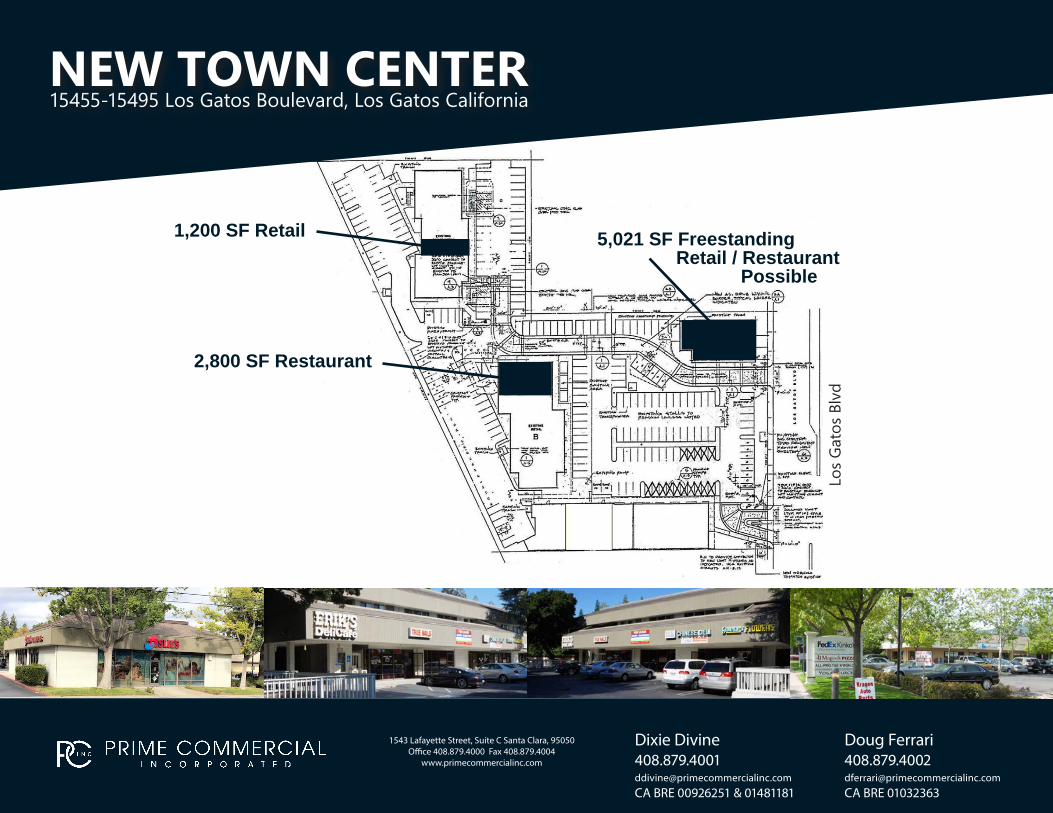
5,021 SF Freestanding Retail / Restaurant Possible
5,021 SF Freestanding Retail / Restaurant Possible
Executive Summary15475 Los Gatos Blvd, Los Gatos, California, 95032 Prepared by EsriRings: 1, 3, 5 mile radii Latitude: 37.24343
Longitude: -121.95976
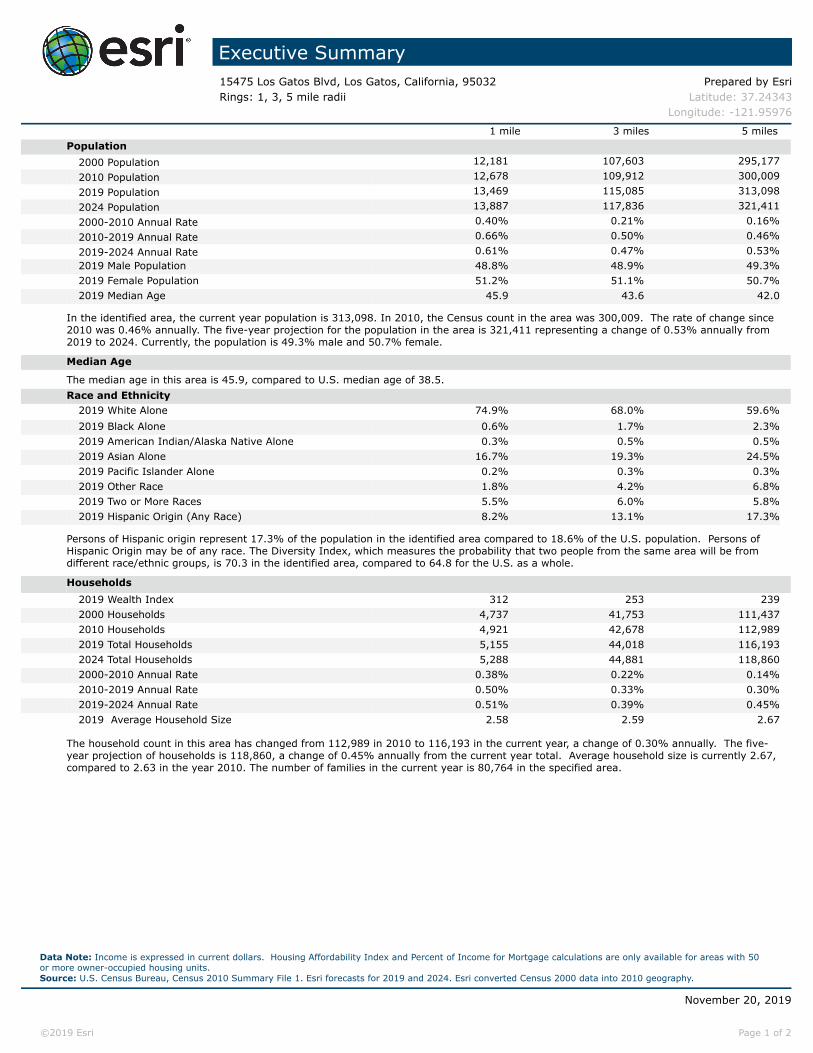
1 mile 3 miles 5 milesPopulation
2000 Population 12,181 107,603 295,1772010 Population 12,678 109,912 300,0092019 Population 13,469 115,085 313,0982024 Population 13,887 117,836 321,4112000-2010 Annual Rate 0.40% 0.21% 0.16%2010-2019 Annual Rate 0.66% 0.50% 0.46%2019-2024 Annual Rate 0.61% 0.47% 0.53%2019 Male Population 48.8% 48.9% 49.3%2019 Female Population 51.2% 51.1% 50.7%2019 Median Age 45.9 43.6 42.0
In the identified area, the current year population is 313,098. In 2010, the Census count in the area was 300,009. The rate of change since 2010 was 0.46% annually. The five-year projection for the population in the area is 321,411 representing a change of 0.53% annually from 2019 to 2024. Currently, the population is 49.3% male and 50.7% female.
Median Age
The median age in this area is 45.9, compared to U.S. median age of 38.5.Race and Ethnicity
2019 White Alone 74.9% 68.0% 59.6%2019 Black Alone 0.6% 1.7% 2.3%2019 American Indian/Alaska Native Alone 0.3% 0.5% 0.5%2019 Asian Alone 16.7% 19.3% 24.5%2019 Pacific Islander Alone 0.2% 0.3% 0.3%2019 Other Race 1.8% 4.2% 6.8%2019 Two or More Races 5.5% 6.0% 5.8%2019 Hispanic Origin (Any Race) 8.2% 13.1% 17.3%
Persons of Hispanic origin represent 17.3% of the population in the identified area compared to 18.6% of the U.S. population. Persons of Hispanic Origin may be of any race. The Diversity Index, which measures the probability that two people from the same area will be from different race/ethnic groups, is 70.3 in the identified area, compared to 64.8 for the U.S. as a whole.
Households2019 Wealth Index 312 253 2392000 Households 4,737 41,753 111,4372010 Households 4,921 42,678 112,9892019 Total Households 5,155 44,018 116,1932024 Total Households 5,288 44,881 118,8602000-2010 Annual Rate 0.38% 0.22% 0.14%2010-2019 Annual Rate 0.50% 0.33% 0.30%2019-2024 Annual Rate 0.51% 0.39% 0.45%2019 Average Household Size 2.58 2.59 2.67
The household count in this area has changed from 112,989 in 2010 to 116,193 in the current year, a change of 0.30% annually. The five-year projection of households is 118,860, a change of 0.45% annually from the current year total. Average household size is currently 2.67, compared to 2.63 in the year 2010. The number of families in the current year is 80,764 in the specified area.
Data Note: Income is expressed in current dollars. Housing Affordability Index and Percent of Income for Mortgage calculations are only available for areas with 50 or more owner-occupied housing units. Source: U.S. Census Bureau, Census 2010 Summary File 1. Esri forecasts for 2019 and 2024. Esri converted Census 2000 data into 2010 geography.
November 20, 2019
©2019 Esri Page 1 of 2
Executive Summary15475 Los Gatos Blvd, Los Gatos, California, 95032 Prepared by EsriRings: 1, 3, 5 mile radii Latitude: 37.24343
Longitude: -121.95976
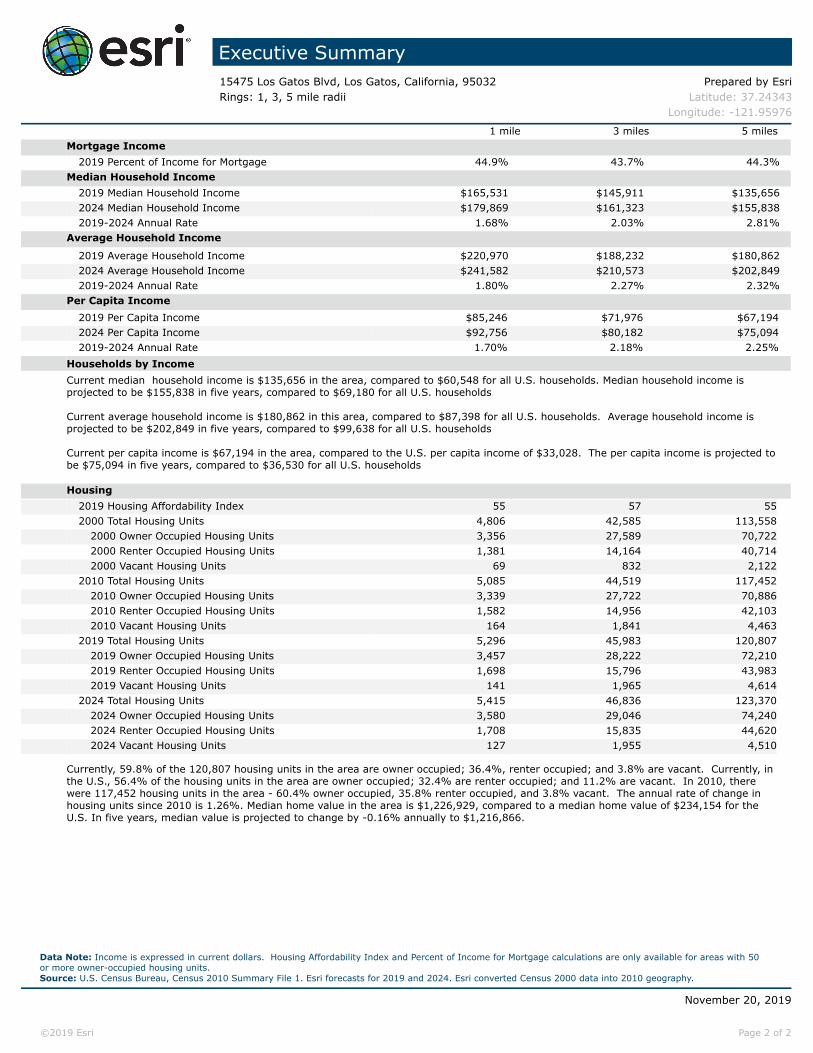
1 mile 3 miles 5 milesMortgage Income
2019 Percent of Income for Mortgage 44.9% 43.7% 44.3%Median Household Income
2019 Median Household Income $165,531 $145,911 $135,6562024 Median Household Income $179,869 $161,323 $155,8382019-2024 Annual Rate 1.68% 2.03% 2.81%
Average Household Income
2019 Average Household Income $220,970 $188,232 $180,8622024 Average Household Income $241,582 $210,573 $202,8492019-2024 Annual Rate 1.80% 2.27% 2.32%
Per Capita Income2019 Per Capita Income $85,246 $71,976 $67,1942024 Per Capita Income $92,756 $80,182 $75,0942019-2024 Annual Rate 1.70% 2.18% 2.25%
Households by IncomeCurrent median household income is $135,656 in the area, compared to $60,548 for all U.S. households. Median household income is projected to be $155,838 in five years, compared to $69,180 for all U.S. households
Current average household income is $180,862 in this area, compared to $87,398 for all U.S. households. Average household income is projected to be $202,849 in five years, compared to $99,638 for all U.S. households
Current per capita income is $67,194 in the area, compared to the U.S. per capita income of $33,028. The per capita income is projected to be $75,094 in five years, compared to $36,530 for all U.S. households Housing
2019 Housing Affordability Index 55 57 552000 Total Housing Units 4,806 42,585 113,558
2000 Owner Occupied Housing Units 3,356 27,589 70,7222000 Renter Occupied Housing Units 1,381 14,164 40,7142000 Vacant Housing Units 69 832 2,122
2010 Total Housing Units 5,085 44,519 117,4522010 Owner Occupied Housing Units 3,339 27,722 70,8862010 Renter Occupied Housing Units 1,582 14,956 42,1032010 Vacant Housing Units 164 1,841 4,463
2019 Total Housing Units 5,296 45,983 120,8072019 Owner Occupied Housing Units 3,457 28,222 72,2102019 Renter Occupied Housing Units 1,698 15,796 43,9832019 Vacant Housing Units 141 1,965 4,614
2024 Total Housing Units 5,415 46,836 123,3702024 Owner Occupied Housing Units 3,580 29,046 74,2402024 Renter Occupied Housing Units 1,708 15,835 44,6202024 Vacant Housing Units 127 1,955 4,510
Currently, 59.8% of the 120,807 housing units in the area are owner occupied; 36.4%, renter occupied; and 3.8% are vacant. Currently, in the U.S., 56.4% of the housing units in the area are owner occupied; 32.4% are renter occupied; and 11.2% are vacant. In 2010, there were 117,452 housing units in the area - 60.4% owner occupied, 35.8% renter occupied, and 3.8% vacant. The annual rate of change in housing units since 2010 is 1.26%. Median home value in the area is $1,226,929, compared to a median home value of $234,154 for the U.S. In five years, median value is projected to change by -0.16% annually to $1,216,866.
Data Note: Income is expressed in current dollars. Housing Affordability Index and Percent of Income for Mortgage calculations are only available for areas with 50 or more owner-occupied housing units. Source: U.S. Census Bureau, Census 2010 Summary File 1. Esri forecasts for 2019 and 2024. Esri converted Census 2000 data into 2010 geography.
November 20, 2019
©2019 Esri Page 2 of 2