14 Lecture Presentation PC.pptprofwelday.weebly.com/uploads/2/3/0/0/23005790/lec_ch14.pdf ·...
81
© 2013 Pearson Education, Inc. Lectures by Edward J. Zalisko PowerPoint ® Lectures for Campbell Essential Biology, Fifth Edition, and Campbell Essential Biology with Physiology, Fourth Edition – Eric J. Simon, Jean L. Dickey, and Jane B. Reece Chapter 14 Chapter 14 How Biological Diversity Evolves 1
Transcript of 14 Lecture Presentation PC.pptprofwelday.weebly.com/uploads/2/3/0/0/23005790/lec_ch14.pdf ·...

© 2013 Pearson Education, Inc.Lectures by Edward J. Zalisko
PowerPoint® Lectures forCampbell Essential Biology, Fifth Edition, and
Campbell Essential Biology with Physiology,
Fourth Edition– Eric J. Simon, Jean L. Dickey, and Jane B. Reece
Chapter 14Chapter 14How Biological Diversity Evolves
1

Biology and Society: The Sixth Mass Extinction
• Over the past 540 million years, the fossil record
reveals five periods of extinction when 50–90% of
living species suddenly died out.
© 2013 Pearson Education, Inc.
2

Figure 14.0 3

• Our current rate of extinction, over the past 400
years, indicates that we may be living in, and
contributing to, the sixth mass extinction period.
• Mass extinctions pave the way for the evolution of
new and diverse forms, but it takes millions of
years for Earth to recover.
Biology and Society: The Sixth Mass Extinction
© 2013 Pearson Education, Inc.
4

THE ORIGIN OF SPECIES
• When Darwin visited the Galápagos Islands, he
realized that he was visiting a place of origins.
– Although the volcanic islands were geologically young, they were home to many plants and animals known nowhere else in the world.
– Darwin thought it unlikely that all of these species could have been among the original colonists of the islands.
© 2013 Pearson Education, Inc.
5

Figure 14.1
PATTERNS OF EVOLUTION6

• In the 150 years since the publication of Darwin’s
book On the Origin of Species by Means of Natural
Selection, new discoveries and technological
advances have given scientists a wealth of new
information about the evolution of life.
• The diversity of life evolved through speciation,
the process in which one species splits into two or
more species.
THE ORIGIN OF SPECIES
© 2013 Pearson Education, Inc.
7

What Is a Species?
• Species is a Latin word meaning
– “kind” or
– “appearance.”
• The biological species concept defines a
species as “A group of populations whose
members have the potential to interbreed with one
another in nature to produce fertile offspring.”
© 2013 Pearson Education, Inc.
8

Figure 14.2
Diversity within one speciesSimilarity between different species
9

Figure 14.2a
Similarity between different species
10

Figure 14.2b
Diversity within one species
11

• The biological species concept cannot be applied
in all situations, including
– fossils and
– asexual organisms.
What Is a Species?
© 2013 Pearson Education, Inc.
12

• Some other definitions of species are based on
– measurable physical traits,
– the use of ecological resources, or
– unique adaptations to particular roles in a biological community.
What Is a Species?
© 2013 Pearson Education, Inc.
13

Reproductive Barriers between Species
• Prezygotic barriers prevent mating or fertilization
between species.
© 2013 Pearson Education, Inc.
14

Figure 14.3
VIABLE, FERTILE OFFSPRING
Hybrid breakdown
FERTILIZATION (ZYGOTE FORMS)
INDIVIDUALS OF DIFFERENT SPECIES
MATING ATTEMPT
Reduced hybrid fertility
Reduced hybrid viability
Temporal isolation
Habitat isolation
Behavioral isolation
Mechanical isolation
Gametic isolation
Prezygotic Barriers
Postzygotic Barriers
No Barriers
15

Figure 14.3a
INDIVIDUALS OF DIFFERENT SPECIES
MATING ATTEMPT
Temporal isolation
Habitat isolation
Behavioral isolation
Mechanical isolation
Gametic isolation
Prezygotic Barriers
16

Figure 14.3b
VIABLE, FERTILE OFFSPRING
Hybrid breakdown
FERTILIZATION (ZYGOTE FORMS)
Reduced hybrid fertility
Reduced hybrid viability
Postzygotic Barriers
No Barriers
INDIVIDUALS OF DIFFERENT SPECIES
17

• Prezygotic barriers include
– temporal isolation,
– habitat isolation,
– behavioral isolation,
– mechanical isolation, and
– gametic isolation.
Reproductive Barriers between Species
© 2013 Pearson Education, Inc.
18

Figure 14.4
Temporal Isolation Habitat Isolation
PREZYGOTIC BARRIERS
Mechanical Isolation Gametic IsolationBehavioral Isolation
22
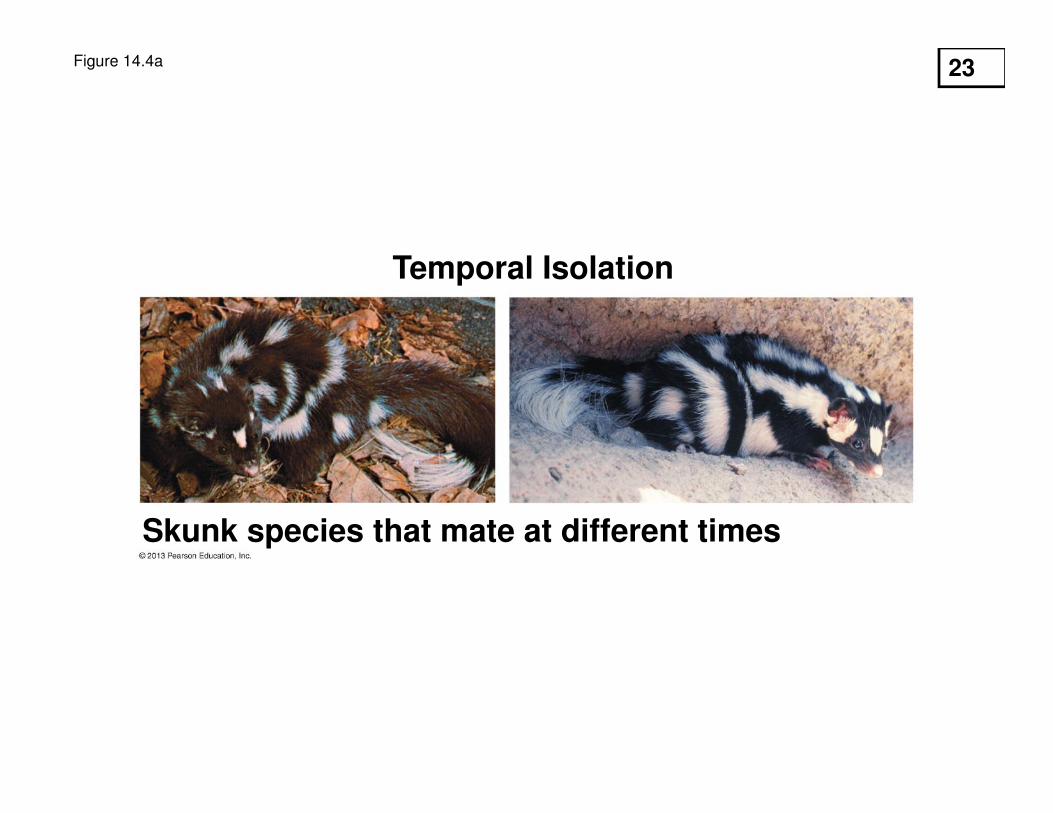
Figure 14.4a
Temporal Isolation
Skunk species that mate at different times
23

Figure 14.4b
Habitat Isolation
Garter snake species from different habitats
24

Figure 14.4c
Mating ritual of blue-footed boobies
Behavioral Isolation
25

Figure 14.4d
Mechanical Isolation
Snail species whose genital openings cannot align
26

Figure 14.4e
Sea urchin species whose gametes cannot fuse
Gametic Isolation
27

• Postzygotic barriers operate if
– interspecies mating occurs and
– hybrid zygotes form.
Reproductive Barriers between Species
© 2013 Pearson Education, Inc.
28

• Postzygotic barriers include
– reduced hybrid viability,
– reduced hybrid fertility, and
– hybrid breakdown.
Reproductive Barriers between Species
© 2013 Pearson Education, Inc.
29

Figure 14.5
Hybrid BreakdownReduced Hybrid FertilityReduced Hybrid Viability
POSTZYGOTIC BARRIERS
Donkey
Mule
Horse
30

Figure 14.5a
Frail hybrid salamander offspring
Reduced Hybrid Viability
31

Figure 14.5b
Reduced Hybrid Fertility
Mule (sterile hybrid ofhorse and donkey)
Donkey
Mule
Horse
32

Figure 14.5c
Hybrid Breakdown
Sterile next-generation rice hybrid
33

Mechanisms of Speciation
• A key event in the potential origin of a species
occurs when a population is somehow cut off from
other populations of the parent species.
• Species can form by
–allopatric speciation, due to geographic isolation, or
–sympatric speciation, without geographic isolation.
© 2013 Pearson Education, Inc.
34

Figure 14.6
Allopatric speciation Sympatric speciation
35

Allopatric Speciation
• Geologic processes can
– fragment a population into two or more isolated populations and
– contribute to allopatric speciation.
© 2013 Pearson Education, Inc.
36

Figure 14.7
Ammospermophilus
harrisii
Ammospermophilus
leucurus
37

• Speciation occurs with the evolution of
reproductive barriers between
– the isolated population and
– its parent population.
• Even if the two populations should come back into
contact at some later time, the reproductive
barriers will keep them as separate species.
Allopatric Speciation
© 2013 Pearson Education, Inc.
38

Figure 14.8
Geographicbarrier
Populationsinterbreed
Time
Populationsbecomeallopatric
Populationsbecomesympatric
Populationscannotinterbreed
Reproductiveisolation:Speciation hasoccurred
Gene pools merge:No speciation
39

What Is the Pace of Speciation?
• There are two contrasting patterns for the pace of
evolution:
1. the gradual pattern, in which big changes (speciations) occur by the steady accumulation of many small changes, and
2. the punctuated equilibria pattern, in which there are
– long periods of little apparent change (equilibria)
interrupted (punctuated) by
– relatively brief periods of rapid change.
© 2013 Pearson Education, Inc.
47
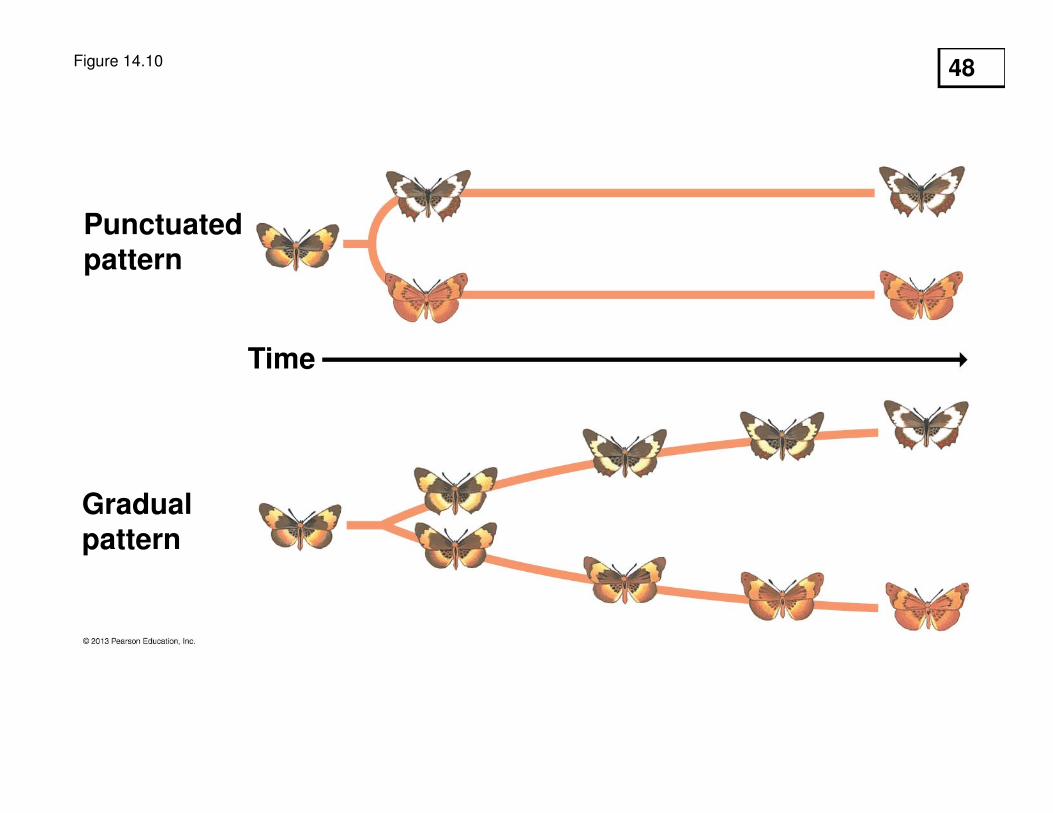
Figure 14.10
Punctuatedpattern
Gradualpattern
Time
48

THE EVOLUTION OF BIOLOGICAL NOVELTY
• What accounts for the dramatic differences
between dissimilar groups?
© 2013 Pearson Education, Inc.
49

Adaptation of Old Structures for New Functions
• Birds
– are derived from a lineage of earthbound reptiles and
– evolved flight from flightless ancestors.
© 2013 Pearson Education, Inc.
50

Figure 14.11
Wing claw(like reptile)
Teeth(like reptile)
Long tail withmany vertebrae
(like reptile)
Feathers
FossilArtist’s reconstruction
51

• An exaptation is
– a structure that evolves in one context but becomes adapted for another function and
– a type of evolutionary remodeling.
• Exaptations can account for the evolution of novel
structures.
Adaptation of Old Structures for New Functions
© 2013 Pearson Education, Inc.
52

• Bird wings are modified forelimbs that were
previously adapted for non-flight functions, such as
– thermal regulation,
– courtship displays, and/or
– camouflage.
• The first flights may have been only glides or
extended hops as the animal pursued prey or fled
from a predator.
Adaptation of Old Structures for New Functions
© 2013 Pearson Education, Inc.
53

EARTH HISTORY AND MACROEVOLUTION
• Macroevolution is closely tied to the history of
Earth.
© 2013 Pearson Education, Inc.
54

Geologic Time and the Fossil Record
• The fossil record is
– the sequence in which fossils appear in rock strata and
– an archive of macroevolution.
© 2013 Pearson Education, Inc.
55

Figure 14.14
A sedimentary fossil formedby minerals replacing theorganic matter of a tree
Trace fossils: footprints, burrows, or other remnants of an ancientorganism’s behavior
A 45-million-year-oldinsect embeddedin amber
Tusks of a 23,000-year-old mammothdiscovered in Siberian ice
A researcherexcavating afossilizeddinosaurskeleton fromsandstone
56

• Geologists have established a geologic time scale that divides Earth’s history into a consistent
sequence of geologic periods.
Geologic Time and the Fossil Record
© 2013 Pearson Education, Inc.
57

© 2013 Pearson Education, Inc.
Animation: Macroevolution
Right click slide / select “Play”
58
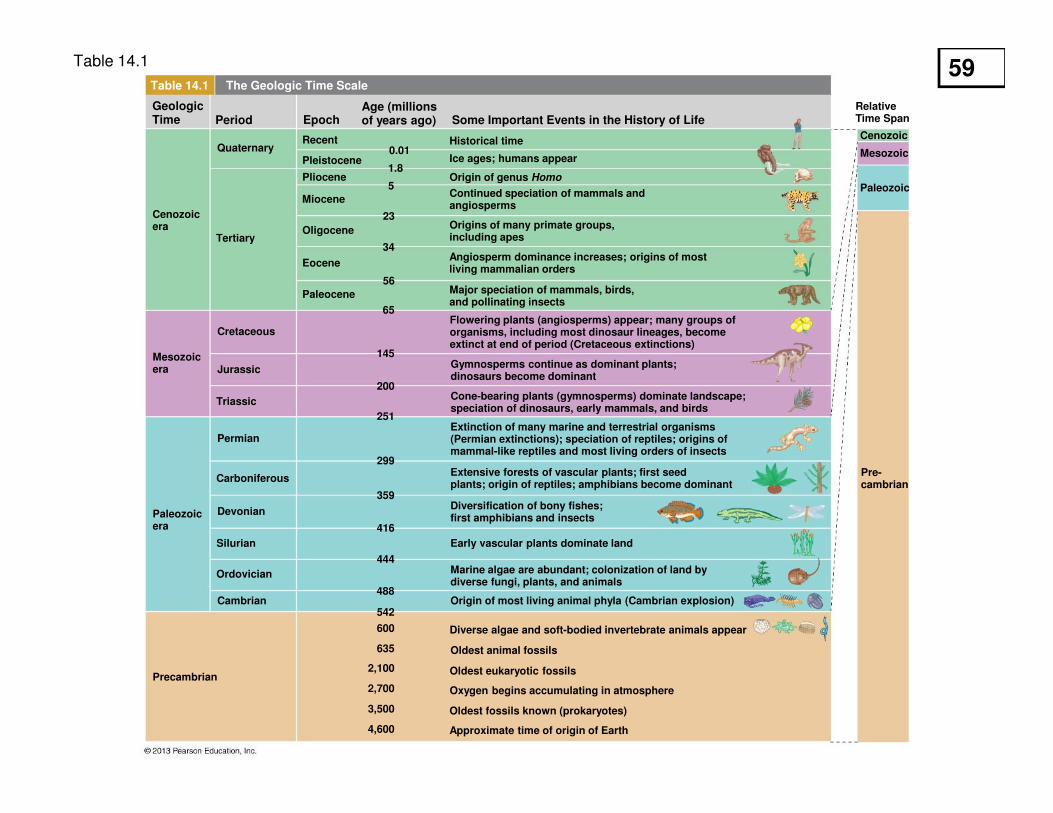
Table 14.1
GeologicTime Period Epoch
Age (millionsof years ago) Some Important Events in the History of Life
Table 14.1 The Geologic Time Scale
Cenozoicera
Quaternary
Tertiary
Recent
Pleistocene
Pliocene
Miocene
Oligocene
Eocene
Paleocene
0.01
1.8
5
23
34
56
65
Historical time
Ice ages; humans appear
Origin of genus Homo
Continued speciation of mammals andangiosperms
Origins of many primate groups, including apes
Angiosperm dominance increases; origins of mostliving mammalian orders
Major speciation of mammals, birds,and pollinating insects
145
200
251
Mesozoicera
Cretaceous
Jurassic
TriassicCone-bearing plants (gymnosperms) dominate landscape;speciation of dinosaurs, early mammals, and birds
Flowering plants (angiosperms) appear; many groups oforganisms, including most dinosaur lineages, becomeextinct at end of period (Cretaceous extinctions)
Gymnosperms continue as dominant plants;dinosaurs become dominant
Paleozoicera
Permian
Carboniferous
Devonian
Silurian
Ordovician
Cambrian
Precambrian
299
359
416
444
488
542
600
635
2,100
2,700
3,500
4,600
Extinction of many marine and terrestrial organisms(Permian extinctions); speciation of reptiles; origins ofmammal-like reptiles and most living orders of insects
Extensive forests of vascular plants; first seedplants; origin of reptiles; amphibians become dominant
Diversification of bony fishes;first amphibians and insects
Early vascular plants dominate land
Marine algae are abundant; colonization of land bydiverse fungi, plants, and animals
Origin of most living animal phyla (Cambrian explosion)
Diverse algae and soft-bodied invertebrate animals appear
Oldest animal fossils
Oldest eukaryotic fossils
Oxygen begins accumulating in atmosphere
Oldest fossils known (prokaryotes)
Approximate time of origin of Earth
Relative Time Span
Paleozoic
Mesozoic
Cenozoic
Pre-cambrian
59

Table 14.1a
Precambrian
542
600
635
2,100
2,700
3,500
4,600
Diverse algae and soft-bodied invertebrate animals appear
Oldest animal fossils
Oldest eukaryotic fossils
Oxygen begins accumulating in atmosphere
Oldest fossils known (prokaryotes)
Approximate time of origin of Earth
60

Table 14.1b
251
Paleozoicera
Permian
Carboniferous
Devonian
Silurian
Ordovician
Cambrian
299
359
416
444
488
542
Extinction of many marine and terrestrial organisms (Permian extinctions); speciation of reptiles; origins of mammal-like reptiles and most living orders of insects
Extensive forests of vascular plants; first seed plants; origin of reptiles; amphibians become dominant
Diversification of bony fishes; first amphibians and insects
Early vascular plants dominate land
Marine algae are abundant; colonization of land by diverse fungi, plants, and animals
Origin of most living animal phyla (Cambrian explosion)
61

Table 14.1c
65
145
200
251
Mesozoicera
Cretaceous
Jurassic
TriassicCone-bearing plants (gymnosperms) dominate landscape; speciation of dinosaurs, early mammals, and birds
Flowering plants (angiosperms) appear; many groups of organisms, including most dinosaur lineages, become extinct at end of period (Cretaceous extinctions)
Gymnosperms continue as dominant plants; dinosaurs become dominant
62

Table 14.1d
Cenozoicera
Quaternary
Tertiary
Recent
Pleistocene
Pliocene
Miocene
Oligocene
Eocene
Paleocene
0.01
1.8
5
23
34
56
65
Historical time
Ice ages; humans appear
Origin of genus Homo
Continued speciation of mammals and angiosperms
Origins of many primate groups, including apes
Angiosperm dominance increases; origins of most living mammalian orders
Major speciation of mammals, birds,and pollinating insects
63

• Fossils are reliable chronological records only if we
can determine their ages, using
– the relative age of fossils, revealing the order in which groups of species evolved, and/or
– the absolute age of fossils, requiring other methods such as radiometric dating.
Geologic Time and the Fossil Record
© 2013 Pearson Education, Inc.
64

• Radiometric dating
– is the most common method for dating fossils,
– is based on the decay of radioactive isotopes, and
– helped establish the geologic time scale.
Geologic Time and the Fossil Record
© 2013 Pearson Education, Inc.
65

Figure 14.15
Carbon-14 in shell
Time (thousands of years)
Radioactive decayof carbon-14
How carbon-14dating isused to determinethe vintageof a fossilizedclam shell
Carb
on
-14 r
ad
ioacti
vit
y
(as %
of
livin
g o
rgan
ism
’sC
-14 t
o C
-12 r
ati
o)
100
75
0
50
25
0 5.6 50.411.2 16.8 22.4 28.0 33.6 39.2 44.8
Carbon-14 is taken upby the clam in tracequantities, along withmuch larger quantitiesof carbon-12.
After the clam dies,carbon-14 amountsdecline due toradioactive decay.
Measuring the ratio ofcarbon-14 to carbon-12reveals how many half-life reductions haveoccurred since theclam’s death.
66

Figure 14.15a
Time (thousands of years)
Radioactive decay of carbon-14
Ca
rbo
n-1
4 r
ad
ioa
cti
vit
y
(as
% o
f livin
g o
rga
nis
m’s
C-1
4 t
o C
-12
ra
tio
)
100
75
0
50
25
0 5.6 50.411.2 16.8 22.4 28.0 33.6 39.2 44.8
67

Figure 14.15b-1
Carbon-14 in shell
How carbon-14 dating is used to determinethe vintage of a fossilized clam shell
Carbon-14 is taken upby the clam in tracequantities, along withmuch larger quantitiesof carbon-12.
68

Figure 14.15b-2
Carbon-14 in shell
How carbon-14 dating is used to determinethe vintage of a fossilized clam shell
After the clam dies,carbon-14 amountsdecline due toradioactive decay.
Carbon-14 is taken upby the clam in tracequantities, along withmuch larger quantitiesof carbon-12.
69

Figure 14.15b-3
Carbon-14 in shell
How carbon-14 dating is used to determinethe vintage of a fossilized clam shell
After the clam dies,carbon-14 amountsdecline due toradioactive decay.
Measuring the ratio ofcarbon-14 to carbon-12reveals how many half-life reductions haveoccurred since theclam’s death.
Carbon-14 is taken upby the clam in tracequantities, along withmuch larger quantitiesof carbon-12.
70
Plate Tectonics and Macroevolution
• The continents are not locked in place.
– Continents drift about Earth’s surface on plates of crust floating on a flexible layer of hot, underlying material called the mantle.
© 2013 Pearson Education, Inc.
71

Plate Tectonics and Macroevolution
• Japan sits atop four different plates.
– A tsunami, caused by an earthquake off the coast of Japan, resulted in the disaster of March 2011.
– Frequent earthquakes occur as the plates move and bump against each other.
© 2013 Pearson Education, Inc.
72

Figure 14.16 75

• About 250 million years ago,
– plate movements formed the supercontinent Pangaea,
– the total amount of shoreline was reduced,
– ocean basins increased in depth,
– sea levels dropped,
– the dry continental interior increased in size, and
– many extinctions occurred.
Plate Tectonics and Macroevolution
© 2013 Pearson Education, Inc.
76
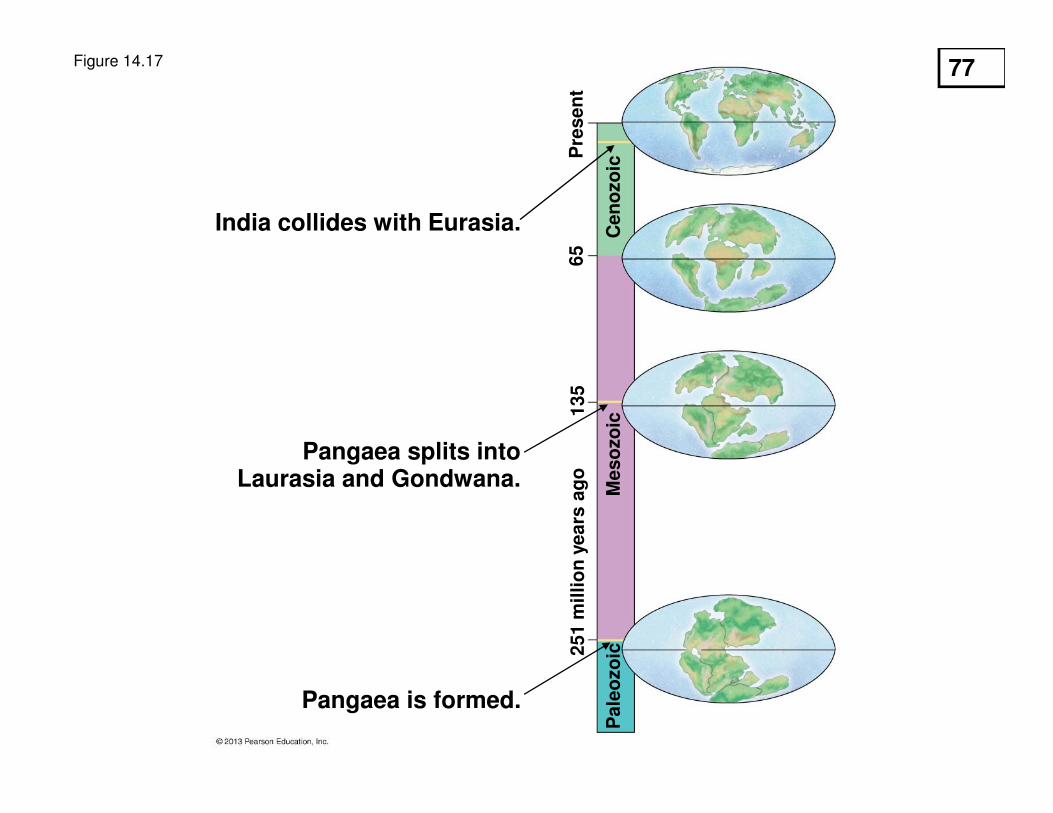
Figure 14.17
Pangaea is formed.
Pangaea splits intoLaurasia and Gondwana.
India collides with Eurasia. Cen
ozo
icM
eso
zo
icP
ale
ozo
ic251 m
illi
on
years
ag
oP
resen
t135
65
77

Figure 14.17a
India collides with Eurasia. Cen
ozo
ic
Pre
sen
t65 m
ya
Meso
zo
ic
78

Figure 14.17b
Pangaea is formed.
Pangaea splits intoLaurasia and Gondwana.
Me
so
zo
icP
ale
ozo
ic25
1 m
illio
n y
ea
rs a
go
13
5
79

• About 180 million years ago,
– Pangaea began to break up,
– large continents drifted increasingly apart,
– climates changed, and
– the organisms of the different biogeographic realms diverged.
Plate Tectonics and Macroevolution
© 2013 Pearson Education, Inc.
80

• Plate tectonics helps to explain
– why Mesozoic reptiles in Ghana (West Africa) and Brazil look so similar and
– how marsupials were free to evolve in isolation in Australia.
Plate Tectonics and Macroevolution
© 2013 Pearson Education, Inc.
81

Mass Extinctions and Explosive Diversifications of Life
• The fossil record reveals that five mass extinctions
have occurred over the last 540 million years.
• The Permian mass extinction
– occurred at about the time the merging continents formed Pangaea (250 million years ago) and
– claimed about 96% of marine species.
© 2013 Pearson Education, Inc.
82

• The Cretaceous extinction
– occurred at the end of the Cretaceous period, about 65 million years ago,
– included the extinction of all the dinosaurs except birds, and
– permitted the rise of mammals.
Mass Extinctions and Explosive Diversifications of Life
© 2013 Pearson Education, Inc.
83

Sorting Homology from Analogy
• Homologous structures
– reflect variations of a common ancestral plan and
– are one of the best sources of information used to
– develop phylogenetic trees and
– classify organisms according to their evolutionary
history.
© 2013 Pearson Education, Inc.
104

• Convergent evolution involves superficially
similar structures from different evolutionary
branches that result from natural selection shaping
analogous adaptations.
• Similarity due to convergence is called analogy,
not homology.
• To develop phylogenetic trees and classify
organisms according to their evolutionary history,
we use only homologous similarities.
Sorting Homology from Analogy
© 2013 Pearson Education, Inc.
105
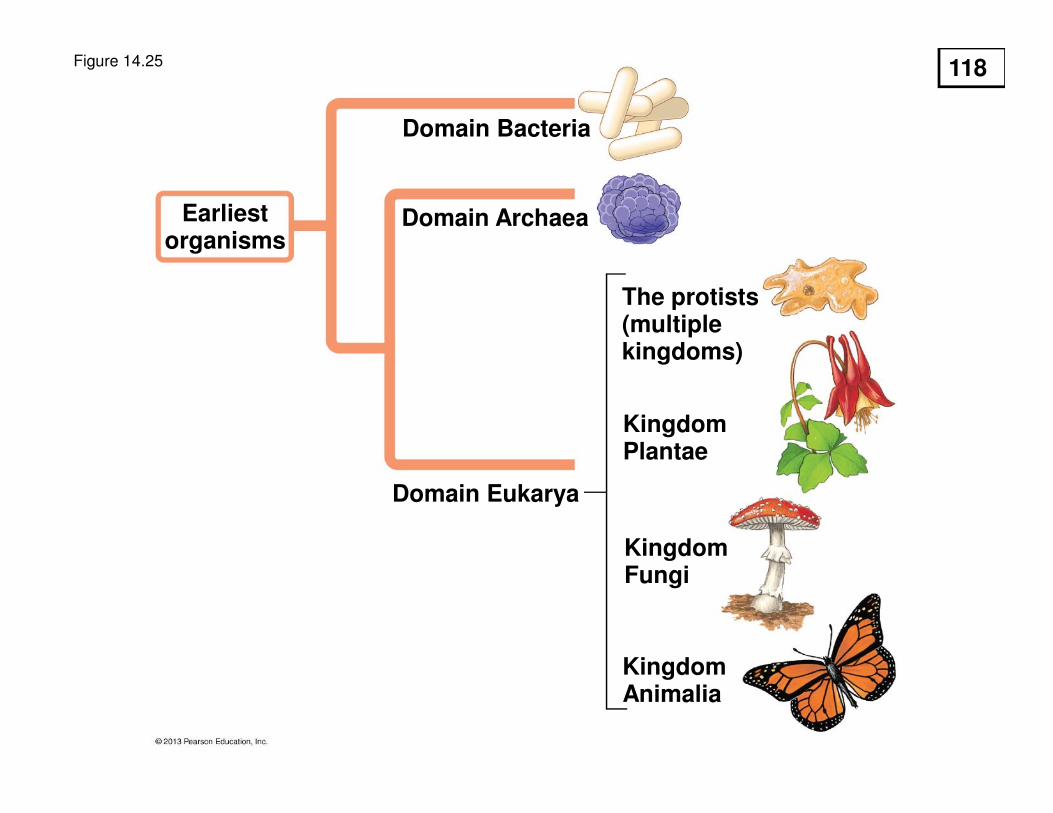
Figure 14.25
KingdomAnimalia
Domain Archaea Earliest organisms
Domain Bacteria
Domain Eukarya
KingdomFungi
KingdomPlantae
The protists(multiplekingdoms)
118

Evolution Connection: Rise of the Mammals
• Mass extinctions
– have repeatedly occurred throughout Earth’s history and
– were followed by a period of evolutionary change.
© 2013 Pearson Education, Inc.
119

• Fossil evidence indicates that
– mammals first appeared about 180 million years ago but
– the number of mammalian species
– remained steady and low in number until about
65 million years ago and
– greatly increased after most of the dinosaurs
became extinct.
Evolution Connection: Rise of the Mammals
© 2013 Pearson Education, Inc.
120

• Throughout the process of evolution by natural
selection, this pattern of death and renewal is
repeated throughout the history of life on Earth.
Evolution Connection: Rise of the Mammals
© 2013 Pearson Education, Inc.
121

Figure 14.26
American black bear
Eutherians (5,010 species)
Millions of years ago
Monotremes (5 species)
Marsupials (324 species)
Ancestral mammal
Reptilian ancestor
Extinction of dinosaurs
250 200 150 100 5065 0
122

Figure 14.26a
Eutherians (5,010 species)
Millions of years ago
Monotremes (5 species)
Marsupials (324 species)
Ancestral mammal
Reptilian ancestor
Extinction of dinosaurs
250 200 150 100 5065 0
123

Figure 14.26b
American black bear
124

Figure 14.UN01
Postzygotic barriers GametesViable,
fertile
offspring
Zygote
Prezygotic barriers • Reduced hybrid viability
• Reduced hybrid fertility• Hybrid breakdown
• Temporal isolation
• Habitat isolation
• Behavioral isolation
• Mechanical isolation
• Gametic isolation
125

![01 Lecture Presentation PC v2 [Read-Only]profwelday.weebly.com › uploads › 2 › 3 › 0 › 0 › 23005790 › lec_01-06...Campbell Essential Biology, Fifth Edition, and Campbell](https://static.fdocuments.in/doc/165x107/5f04d94c7e708231d41003a1/01-lecture-presentation-pc-v2-read-only-a-uploads-a-2-a-3-a-0-a-0-a.jpg)