13 Nov 17, 8.15am/11.15am Morning Call/Webinar
32
Disclaimer: The information contained in this document is intended only for use during the presentation and should not be disseminated or distributed to parties outside the presentation. Phillip Securities accepts no liability whatsoever with respect to the use of this document or its contents. Phillip Securities Research Pte Ltd (A member of PhillipCapital) Co. Reg. No. 198803136N © PhillipCapital 2017. All Rights Reserved. For internal circulation only. Company Results/Updates Banyan Tree Holdings Limited Chip Eng Seng Corporation Ltd DBS Group Holdings Ltd Centurion Corporation Limited Singapore O&G Ltd Fraser and Neave, Ltd SATS Ltd 13 Nov 17, 8.15am/11.15am Morning Call/Webinar ComfortDelGro Corp Ltd 800 Super Holdings Ltd SIA Engineering Company Ltd CapitaLand Limited Ho Bee Land Limited City Developments Limited
Transcript of 13 Nov 17, 8.15am/11.15am Morning Call/Webinar

Disclaimer: The information contained in this document is intended only for use during the presentation and should not be disseminated or distributed to parties outside the presentation. Phillip Securities accepts no liability whatsoever with respect to the use of this document or its contents.
Phillip Securities Research Pte Ltd (A member of PhillipCapital) Co. Reg. No. 198803136N © PhillipCapital 2017. All Rights Reserved. For internal circulation only.
Company Results/Updates
Banyan Tree Holdings Limited
Chip Eng Seng Corporation Ltd
DBS Group Holdings Ltd
Centurion Corporation Limited
Singapore O&G Ltd
Fraser and Neave, Ltd
SATS Ltd
13 Nov 17, 8.15am/11.15am Morning Call/Webinar
ComfortDelGro Corp Ltd
800 Super Holdings Ltd
SIA Engineering Company Ltd
CapitaLand Limited
Ho Bee Land Limited
City Developments Limited

Disclaimer: The information contained in this document is intended only for use during the presentation and should not be disseminated or distributed to parties outside the presentation. Phillip Securities accepts no liability whatsoever with respect to the use of this document or its contents.
Phillip Securities Research Pte Ltd (A member of PhillipCapital) Co. Reg. No. 198803136N © PhillipCapital 2017. All Rights Reserved. For internal circulation only.
SATS Ltd
Stronger associates & JVs offset operating cost pressures
Richard Leow
Phillip Securities Research Pte Ltd
13 November 2017

Disclaimer: The information contained in this document is intended only for use during the presentation and should not be disseminated or distributed to parties outside the presentation. Phillip Securities accepts no liability whatsoever with respect to the use of this document or its contents.
Phillip Securities Research Pte Ltd (A member of PhillipCapital) Co. Reg. No. 198803136N © PhillipCapital 2017. All Rights Reserved. For internal circulation only.
3
Robust 57% growth in associates/JVs driving PATMI growth, in spite of lower EBIT
Overall volumes were up
Lower Food Solutions revenue
13.2% YoY lower TFK Corp. revenue; weaker meal volumes arising from flight cuts by Delta Air Lines
EBIT margin compression
Licence fees 24% YoY higher, due to cessation of fee rebates at Changi Airport since Apr 1
Stable to positive outlook
EPS growth from associates/JVs: horizontal (new geographies) and vertical (DFASS SATS) integration
AirAsia ground handling JV & Turkish Airlines in-flight catering JV
SATS Ltd(Accumulate, TP: $5.23, DPS: 17.0 cents (3.4%), Last: $5.01)
Results at a glance
(SGD mn) 2Q18 2Q17 YoY Comments
Revenue 435 439 -0.8% 3.1% lower Food Solutions, offset by 2.3% higher Gateway Services
EBIT 61.1 63.6 -3.9% 0.3% lower expenditure; lower margin of 14.1% from 14.5%
Associates/JVs 18.0 11.5 57% 75.9% higher Food Solutions , 50.0% higher Gateway Services
PATMI 72.2 62.1 16.3% 2Q18 includes disposal gain of $7.0 mn comprising $5.2 mn from SATS HK and $1.8 mn from restructuring of Jilin JVCo
Underlying PATMI 65.2 62.1 5.0% Excluding one-off above; higher margin of 15.0% from 14.2%
Source: Company, PSR

Disclaimer: The information contained in this document is intended only for use during the presentation and should not be disseminated or distributed to parties outside the presentation. Phillip Securities accepts no liability whatsoever with respect to the use of this document or its contents.
Phillip Securities Research Pte Ltd (A member of PhillipCapital) Co. Reg. No. 198803136N © PhillipCapital 2017. All Rights Reserved. For internal circulation only.
ComfortDelGro Corp Ltd
Strong cash generation, absolute dividend level sustainable
Richard Leow
Phillip Securities Research Pte Ltd
13 November 2017
Disclaimer: The information contained in this document is intended only for use during the presentation and should not be disseminated or distributed to parties outside the presentation. Phillip Securities accepts no liability whatsoever with respect to the use of this document or its contents.
Phillip Securities Research Pte Ltd (A member of PhillipCapital) Co. Reg. No. 198803136N © PhillipCapital 2017. All Rights Reserved. For internal circulation only.
5
Improved profitability at SBST is making an impact to CDG
SBST contributed 10.4% of 3Q17 PATMI, compared to 6.7% contribution in 3Q16
Mainly due to SBST’s 42% YoY higher 3Q17 profit
SBST profit to increase with opening of DTL3 on 21 Oct, and 1Q18 takeover of Seletar bus package
Lower profit, but cash flow has actually improved: absolute dividend level should be sustainable
9M17 PAT 5.1% lower YoY, but FCF is 29% higher (lower Taxi capex)
Singapore Taxi business continues to be challenged by private hire vehicles
Taxi fleet -4.7% QoQ and -12.1% YoY; 4.5% idle rate from 5% in previous quarter
Effective 2.2% fare reduction from 29 Dec will delay the breakeven for DTL
Positive outlook
DTL full quarter contribution from 1Q18
Seletar bus package to contribute positively from 1Q18
ComfortDelGro Corp Ltd(Buy, TP: $2.69, DPS: 10.3 cents (5.2%) , Last: $2.00)
Results at a glance
(SGD mn) 3Q17 3Q16 YoY Comments
Revenue 991 1,015 -2.4% Actual underlying decrease of $30.1 mn was mitigated by favourable currency translation of $6.1 mn mainly from stronger AUD
EBIT 112 127 -12.3% 0.9% lower opex. Actual S$13.6mn decrease in OpEx offset by $5.3 mn unfavourable currency trans lation mainly from stronger AUD
PATMI 80.1 87.3 -8.2%
Source: Company, PSR
Disclaimer: The information contained in this document is intended only for use during the presentation and should not be disseminated or distributed to parties outside the presentation. Phillip Securities accepts no liability whatsoever with respect to the use of this document or its contents.
Phillip Securities Research Pte Ltd (A member of PhillipCapital) Co. Reg. No. 198803136N © PhillipCapital 2017. All Rights Reserved. For internal circulation only.
800 Super Holdings Ltd
Operationally stable, projects coming online
Richard Leow
Phillip Securities Research Pte Ltd
13 November 2017
Disclaimer: The information contained in this document is intended only for use during the presentation and should not be disseminated or distributed to parties outside the presentation. Phillip Securities accepts no liability whatsoever with respect to the use of this document or its contents.
Phillip Securities Research Pte Ltd (A member of PhillipCapital) Co. Reg. No. 198803136N © PhillipCapital 2017. All Rights Reserved. For internal circulation only.
7
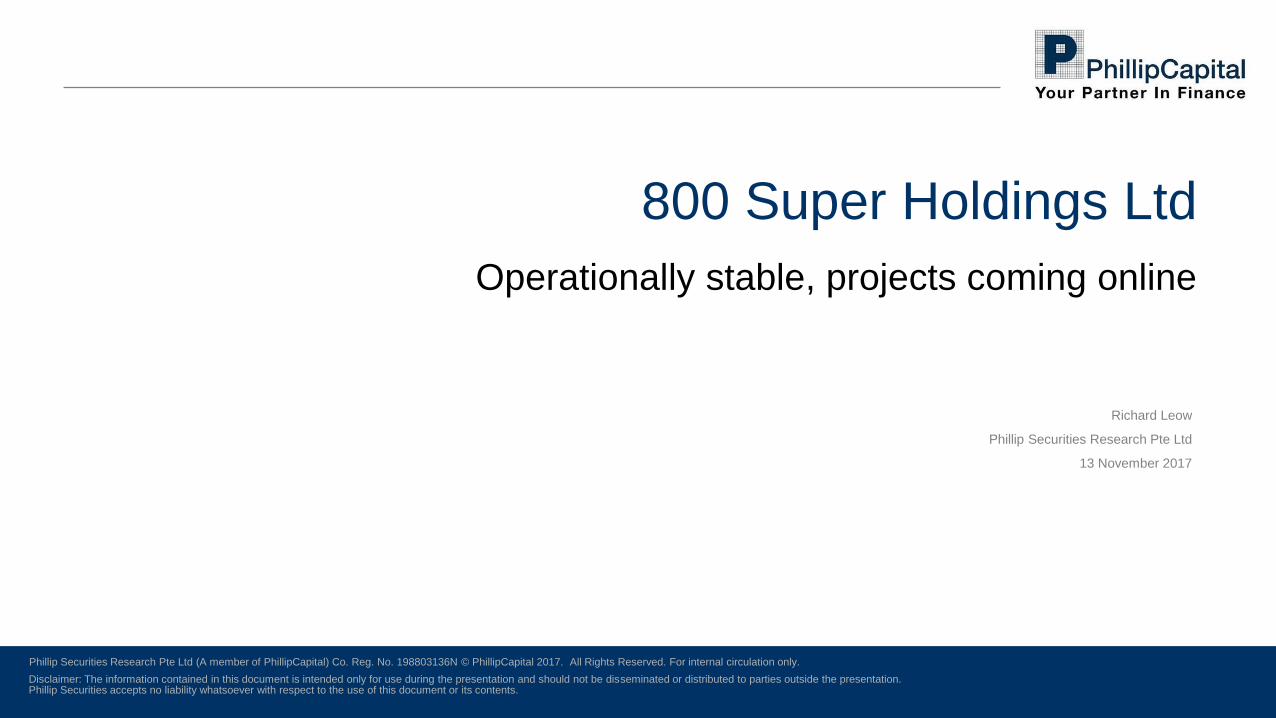
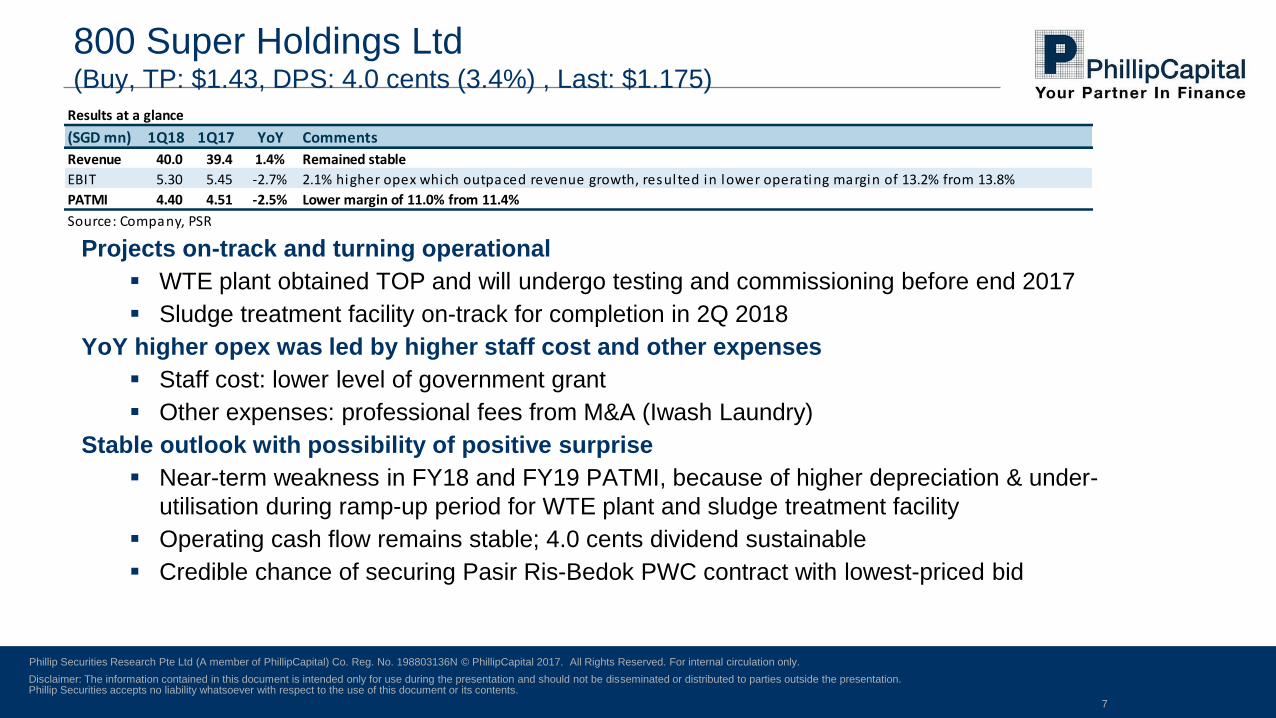
Projects on-track and turning operational
WTE plant obtained TOP and will undergo testing and commissioning before end 2017
Sludge treatment facility on-track for completion in 2Q 2018
YoY higher opex was led by higher staff cost and other expenses
Staff cost: lower level of government grant
Other expenses: professional fees from M&A (Iwash Laundry)
Stable outlook with possibility of positive surprise
Near-term weakness in FY18 and FY19 PATMI, because of higher depreciation & under-
utilisation during ramp-up period for WTE plant and sludge treatment facility
Operating cash flow remains stable; 4.0 cents dividend sustainable
Credible chance of securing Pasir Ris-Bedok PWC contract with lowest-priced bid
800 Super Holdings Ltd(Buy, TP: $1.43, DPS: 4.0 cents (3.4%) , Last: $1.175)
Results at a glance
(SGD mn) 1Q18 1Q17 YoY Comments
Revenue 40.0 39.4 1.4% Remained stable
EBIT 5.30 5.45 -2.7% 2.1% higher opex which outpaced revenue growth, resulted in lower operating margin of 13.2% from 13.8%
PATMI 4.40 4.51 -2.5% Lower margin of 11.0% from 11.4%
Source: Company, PSR

Disclaimer: The information contained in this document is intended only for use during the presentation and should not be disseminated or distributed to parties outside the presentation. Phillip Securities accepts no liability whatsoever with respect to the use of this document or its contents.
Phillip Securities Research Pte Ltd (A member of PhillipCapital) Co. Reg. No. 198803136N © PhillipCapital 2017. All Rights Reserved. For internal circulation only.
SIA Engineering Company Ltd
Muted outlook with absence of near-term catalyst
Richard Leow
Phillip Securities Research Pte Ltd
13 November 2017

Disclaimer: The information contained in this document is intended only for use during the presentation and should not be disseminated or distributed to parties outside the presentation. Phillip Securities accepts no liability whatsoever with respect to the use of this document or its contents.
Phillip Securities Research Pte Ltd (A member of PhillipCapital) Co. Reg. No. 198803136N © PhillipCapital 2017. All Rights Reserved. For internal circulation only.
9
4 cents interim dividend, unchanged from last year
Market share at Changi Airport remains largely intact
Handled +3.8% YoY flights in 1HFY18; in line with +4.1% YoY at Changi Airport
Associates offset weak EBIT to lift PATMI; JV persistent weakness
Associates: Heavier work content from PW4000 engine (B747) at ESA; will transition to
PW1100G (A320neo)
JV (SAESL): Lower work content due to better engine reliability, throughput impacted by supply
chain issue on spares
Outlook remains challenging, no near-term catalyst
Margins continue to compress, and despite YoY higher PATMI, it was lower than expected
Revised PATMI forecast downwards, and lowered dividend assumptions
SIA Engineering Company Ltd(Neutral, TP: $3.35, DPS: 12.0 cents (3.6%), Last: $3.29)
Results at a glance
(SGD mn) 2Q18 2Q17 YoY Comments
Revenue 274.7 264.8 3.7% Higher airframe and component overhaul and line maintenance, partially offset by lower fleet management
EBIT 19.5 24.5 -20.4% OpEx $14.9 mn or 6.2% higher
Associates & JV 22.9 17.2 33.1% Associates S$5.9 mn or 48% higher,
JV $0.2 mn or 4.1% lower
PATMI 38.1 35.5 7.3%
Source: Company, PSR

Disclaimer: The information contained in this document is intended only for use during the presentation and should not be disseminated or distributed to parties outside the presentation. Phillip Securities accepts no liability whatsoever with respect to the use of this document or its contents.
Phillip Securities Research Pte Ltd (A member of PhillipCapital) Co. Reg. No. 198803136N © PhillipCapital 2017. All Rights Reserved. For internal circulation only.
CapitaLand Limited
Recovery in Office and Hospitality segments
Tan Dehong
Phillip Securities Research Pte Ltd
13 November 2017

Disclaimer: The information contained in this document is intended only for use during the presentation and should not be disseminated or distributed to parties outside the presentation. Phillip Securities accepts no liability whatsoever with respect to the use of this document or its contents.
Phillip Securities Research Pte Ltd (A member of PhillipCapital) Co. Reg. No. 198803136N © PhillipCapital 2017. All Rights Reserved. For internal circulation only.
11
CapitaLand Ltd (ACCUMULATE, TP: S$4.19, Last close: S$3.58)
Continued sales momentum for residential properties at the Group’s key markets Singapore and Vietnam. China launches to
remain slow.
Office markets in Singapore and China show signs of improvement.
RevPAUs for serviced residences seeing recovery in key markets.
Tenant sales growth for Singapore malls (40% of total shopping mall portfolio) remains muted.
Maintain ACCUMULATE with unchanged TP of S$4.19
Strong base of stable recurring income (85% of total assets, mostly in SG, China)
New asset light management contract strategies for growth.
Results at a glance
(SGD mn)/Dec Yr Dec 3Q17 3Q16 YoY (%) Comments
Gross Revenue 1,507.2 1,373.7 9.7
Gross Profit 506.8 423.3 19.7
EBIT 793.5 494.4 60.5
Total PATMI 317.0 247.5 28.1
Operating PATMI 204.50 251.80 (18.8)
Source: Company, PSR
Lower handover of residential projects in China
Higher gross margins from rental revenue
Higher re-measurement gains of S$132.6mn (3Q16: -4.3mn)
from consolidation of CMT and CRCT, and divestments in
Singapore/China
Higher contribution from development projects in Singapore,
new malls and serviced residences and consolidation of revenue
from CMT, CRCT, RCST
Disclaimer: The information contained in this document is intended only for use during the presentation and should not be disseminated or distributed to parties outside the presentation. Phillip Securities accepts no liability whatsoever with respect to the use of this document or its contents.
Phillip Securities Research Pte Ltd (A member of PhillipCapital) Co. Reg. No. 198803136N © PhillipCapital 2017. All Rights Reserved. For internal circulation only.
Ho Bee Land Limited
Largely stable set of results
Tan Dehong
Phillip Securities Research Pte Ltd
13 November 2017
Disclaimer: The information contained in this document is intended only for use during the presentation and should not be disseminated or distributed to parties outside the presentation. Phillip Securities accepts no liability whatsoever with respect to the use of this document or its contents.
Phillip Securities Research Pte Ltd (A member of PhillipCapital) Co. Reg. No. 198803136N © PhillipCapital 2017. All Rights Reserved. For internal circulation only.
13
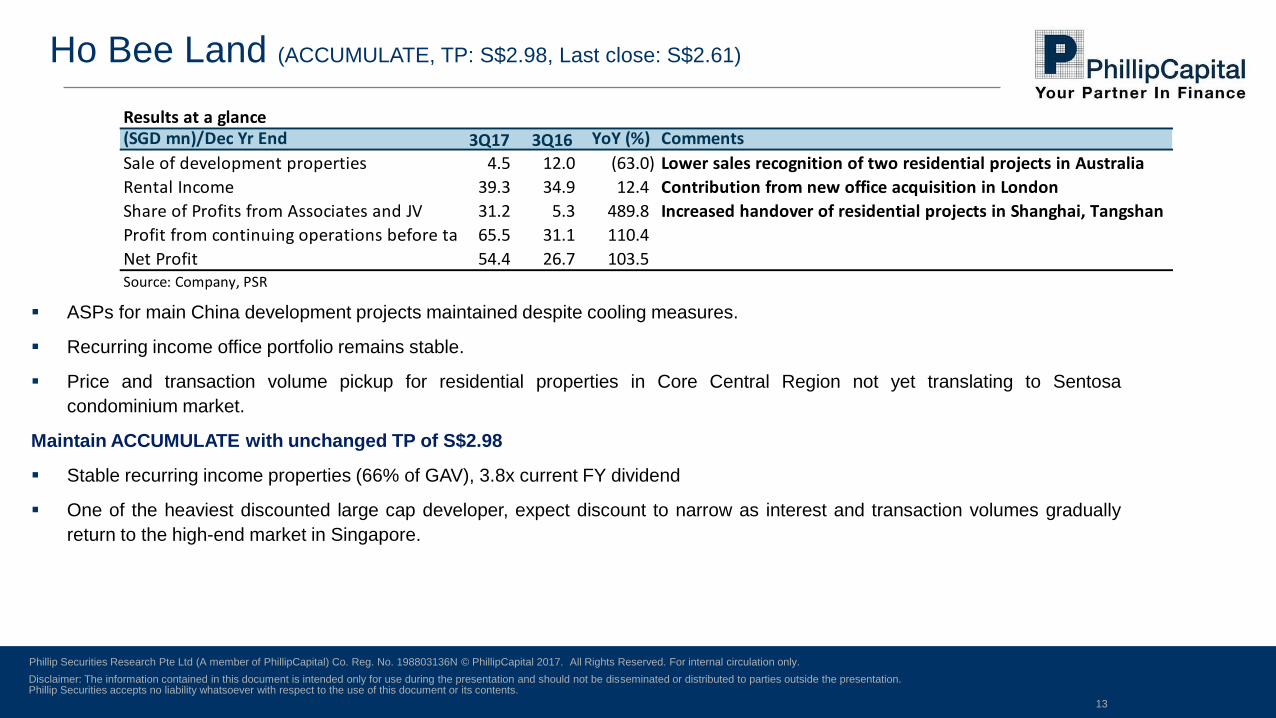
Ho Bee Land (ACCUMULATE, TP: S$2.98, Last close: S$2.61)
ASPs for main China development projects maintained despite cooling measures.
Recurring income office portfolio remains stable.
Price and transaction volume pickup for residential properties in Core Central Region not yet translating to Sentosa
condominium market.
Maintain ACCUMULATE with unchanged TP of S$2.98
Stable recurring income properties (66% of GAV), 3.8x current FY dividend
One of the heaviest discounted large cap developer, expect discount to narrow as interest and transaction volumes gradually
return to the high-end market in Singapore.
Results at a glance(SGD mn)/Dec Yr End 3Q17 3Q16 YoY (%) Comments
Sale of development properties 4.5 12.0 (63.0)
Rental Income 39.3 34.9 12.4
Share of Profits from Associates and JV 31.2 5.3 489.8
Profit from continuing operations before tax 65.5 31.1 110.4
Net Profit 54.4 26.7 103.5 Source: Company, PSR
Lower sales recognition of two residential projects in Australia
Increased handover of residential projects in Shanghai, Tangshan
Contribution from new office acquisition in London

Disclaimer: The information contained in this document is intended only for use during the presentation and should not be disseminated or distributed to parties outside the presentation. Phillip Securities accepts no liability whatsoever with respect to the use of this document or its contents.
Phillip Securities Research Pte Ltd (A member of PhillipCapital) Co. Reg. No. 198803136N © PhillipCapital 2017. All Rights Reserved. For internal circulation only.
City Developments Limited
Stronger performance across most segments
Tan Dehong
Phillip Securities Research Pte Ltd
13 November 2017

Disclaimer: The information contained in this document is intended only for use during the presentation and should not be disseminated or distributed to parties outside the presentation. Phillip Securities accepts no liability whatsoever with respect to the use of this document or its contents.
Phillip Securities Research Pte Ltd (A member of PhillipCapital) Co. Reg. No. 198803136N © PhillipCapital 2017. All Rights Reserved. For internal circulation only.
15
City Developments Ltd (ACCUMULATE, TP: S$12.10, Last close: S$12.20)
Properties sold in Singapore tripled in value YTD17 to S$1.76bn.
Recovery in Hotel Operations as global sentiment and tourism improves.
Slower residential sales in UK, China.
Successful launches of 4 residential projects in Singapore, mostly in 1H18 could be catalysts for share price and target price
upgrade.
Maintain ACCUMULATE with unchanged TP of S$12.10
Successful accretive acquisition of M&C could increase our TP to S$13.50 depending on offer price.
Large exposure of unlaunched and available for sale inventory to capture the potential upswing in SG property prices.
Post consolidation, SG residential makes up c.31% of adjusted GAV (Total SG: 56%)
Results at a glance(SGD mn)/Dec Yr End 3Q17 3Q16 YoY (%) Comments
Revenue 863.1 922.8 (6.5)
-Property development 291 372 (21.8) Mainly due to absence of contributions from EC projects which TOPed in 3Q16
-Hotel Operations 445 424 5.0 Contributions from hotel trading, land sales in New Zealand, and increases in
global RevPARs in M&C hotels led by increases in occupancy
-Rental Properties 89 92 (3.3)
-Others 38 35 8.6
Gross Profit 426.6 430.0 (0.8)
Profit from operations 238.4 245.3 (2.8)
PATMI 156.1 170.3 (8.3) Excluding one-off divestment gains etc, YTD PATMI increased 3.5%Source: Company, PSR

Disclaimer: The information contained in this document is intended only for use during the presentation and should not be disseminated or distributed to parties outside the presentation. Phillip Securities accepts no liability whatsoever with respect to the use of this document or its contents.
Phillip Securities Research Pte Ltd (A member of PhillipCapital) Co. Reg. No. 198803136N © PhillipCapital 2017. All Rights Reserved. For internal circulation only.
Banyan Tree Holdings Limited
Patience as partnerships bear fruit
Tan Dehong
Phillip Securities Research Pte Ltd
13 November 2017
Disclaimer: The information contained in this document is intended only for use during the presentation and should not be disseminated or distributed to parties outside the presentation. Phillip Securities accepts no liability whatsoever with respect to the use of this document or its contents.
Phillip Securities Research Pte Ltd (A member of PhillipCapital) Co. Reg. No. 198803136N © PhillipCapital 2017. All Rights Reserved. For internal circulation only.
17
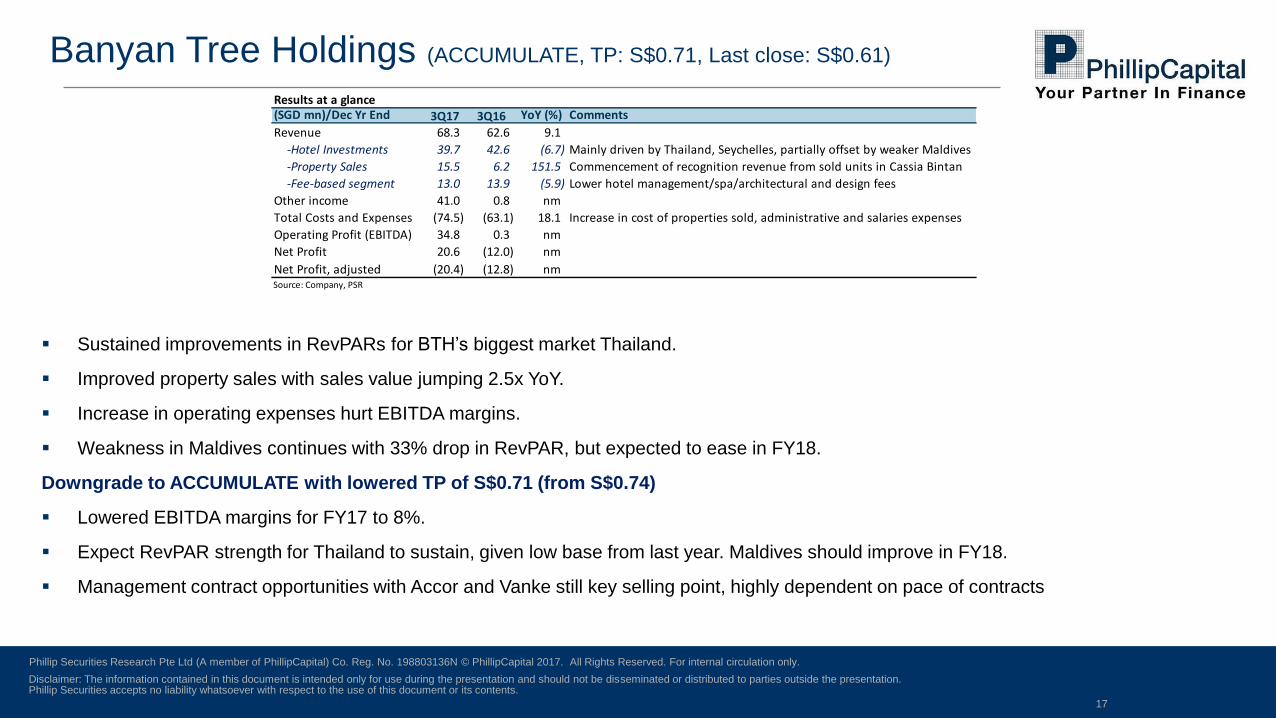
Banyan Tree Holdings (ACCUMULATE, TP: S$0.71, Last close: S$0.61)
Sustained improvements in RevPARs for BTH’s biggest market Thailand.
Improved property sales with sales value jumping 2.5x YoY.
Increase in operating expenses hurt EBITDA margins.
Weakness in Maldives continues with 33% drop in RevPAR, but expected to ease in FY18.
Downgrade to ACCUMULATE with lowered TP of S$0.71 (from S$0.74)
Lowered EBITDA margins for FY17 to 8%.
Expect RevPAR strength for Thailand to sustain, given low base from last year. Maldives should improve in FY18.
Management contract opportunities with Accor and Vanke still key selling point, highly dependent on pace of contracts
Results at a glance(SGD mn)/Dec Yr End 3Q17 3Q16 YoY (%) Comments
Revenue 68.3 62.6 9.1
-Hotel Investments 39.7 42.6 (6.7) Mainly driven by Thailand, Seychelles, partially offset by weaker Maldives
-Property Sales 15.5 6.2 151.5 Commencement of recognition revenue from sold units in Cassia Bintan
-Fee-based segment 13.0 13.9 (5.9) Lower hotel management/spa/architectural and design fees
Other income 41.0 0.8 nm
Total Costs and Expenses (74.5) (63.1) 18.1 Increase in cost of properties sold, administrative and salaries expenses
Operating Profit (EBITDA) 34.8 0.3 nm
Net Profit 20.6 (12.0) nm
Net Profit, adjusted (20.4) (12.8) nmSource: Company, PSR
Disclaimer: The information contained in this document is intended only for use during the presentation and should not be disseminated or distributed to parties outside the presentation. Phillip Securities accepts no liability whatsoever with respect to the use of this document or its contents.
Phillip Securities Research Pte Ltd (A member of PhillipCapital) Co. Reg. No. 198803136N © PhillipCapital 2017. All Rights Reserved. For internal circulation only.
Chip Eng Seng Corporation Ltd
Riding the SG property cycle well
Tan Dehong
Phillip Securities Research Pte Ltd
13 November 2017

Disclaimer: The information contained in this document is intended only for use during the presentation and should not be disseminated or distributed to parties outside the presentation. Phillip Securities accepts no liability whatsoever with respect to the use of this document or its contents.
Phillip Securities Research Pte Ltd (A member of PhillipCapital) Co. Reg. No. 198803136N © PhillipCapital 2017. All Rights Reserved. For internal circulation only.
19
Chip Eng Seng (BUY, TP: S$1.21, Last close: S$0.965)
Revenue pick-up is driven by momentum in Singapore residential property sales.
Better performance from hospitality assets.
Cancellation of Melbourne Tower purchase contracts could enable Group to move on with other exit options.
Maintain BUY with higher TP of S$1.21
Narrowed the discount to RNAV from the previous 50% to 40%.
Incorporate valuation of the Group’s construction business.
RNAV boost could come from a favourable monetization of Tower Melbourne, strong take up rates at Woodleigh launch (2H18)
Results at a glance
(SGD mn)/Sept Yr Dec 3Q17 3Q16 YoY (%) Comments
Gross Revenue 209.2 151.8 37.8
-Property developments 145.8 67.9 114.7
-Construction 50.4 74.1 (31.9)
-Hospitality 10.4 7.1 47.6
-Property investments/others 2.5 2.7 (7.7) Gross Profit 35.1 27.0 30.2
Profit before tax 24.4 12.9 90.1 PATMI 14.05 5.71 145.8 Source: Company, PSR
One-off divestment gain of c.S$13mn for St. Kilda office
Progressive recognition of High Park Residences/Grandeur
Park, Pick-up in sales at Fulcrum, progressive handover of
Melbourne project
Absence of revenue from construction projects
Contribution from Maldives, improved occupancy at Park
Absence of contribution from divested 420 St. Kilda Road
Driven mainly by property development segment
Lower profitability of recognised development projects

Disclaimer: The information contained in this document is intended only for use during the presentation and should not be disseminated or distributed to parties outside the presentation. Phillip Securities accepts no liability whatsoever with respect to the use of this document or its contents.
Phillip Securities Research Pte Ltd (A member of PhillipCapital) Co. Reg. No. 198803136N © PhillipCapital 2017. All Rights Reserved. For internal circulation only.
Name
Mkt Cap
(SGD mn)
Last Px
(SGD)PSR RATING
PSR
TARGET
PRICE
P/E ROE (%) ROA (%)Dividend
Yield (%)P/B
Total Debt to
Assets
CITY DEVELOPMENTS LTD 11,093 12.20 ACCUMULATE 12.10 19.0 6.08 2.82 1.31 1.18 28.98
CAPITALAND LTD 15,205 3.58 ACCUMULATE 4.19 8.9 5.26 1.78 2.79 0.84 32.47
UOL GROUP LTD 7,363 8.75 ACCUMULATE 8.93 8.2 4.67 2.57 1.71 0.80 20.85
WHEELOCK PROPERTIES (S) LTD 2,309 1.93 TRADING BUY 2.28 39.5 3.46 2.99 3.11 0.76 0.00
HO BEE LAND LTD 1,738 2.61 ACCUMULATE 2.98 6.3 6.36 4.17 2.30 0.57 30.62
FRASERS CENTREPOINT LTD 6,045 2.08 9.2 9.16 2.52 4.13 0.88 40.47
UNITED INDUSTRIAL CORP LTD 4,740 3.31 16.8 4.46 3.22 0.91 0.75 14.40
YANLORD LAND GROUP LTD 3,322 1.72 4.6 15.71 3.40 2.53 0.79 24.26
GUOCOLAND LTD 2,686 2.27 5.1 8.15 3.36 3.08 0.68 48.51
WING TAI HOLDINGS LTD 1,735 2.24 67.7 0.59 0.41 2.68 0.53 20.14
BUKIT SEMBAWANG ESTATES LTD 1,608 6.21 52.3 3.92 3.52 5.31 1.25 0.00
FRAGRANCE GROUP LTD 1,134 0.17 127.6 0.90 0.46 0.59 1.07 43.59
Large cap average (>S$1bn) 5.7 2.6 2.7 0.8 25.0
CHIP ENG SENG 599 0.97 BUY 0.90 16.7 3.51 1.18 4.15 0.79 52.45
BANYAN TREE 485 0.61 ACCUMULATE 0.71 26.4 -6.12 -2.09 NA 0.84 38.34
CENTURION CORP LTD 431 0.54 ACCUMULATE 0.59 13.8 7.48 2.64 3.74 0.98 58.98
HONG FOK CORP LTD 770 0.89 9.0 -0.97 -0.51 1.13 0.50 25.34
ROXY-PACIFIC HLDGS LTD 650 0.55 19.0 6.66 2.24 2.53 1.29 56.97
BONVESTS HOLDINGS LTD 563 1.40 22.4 3.39 2.51 1.86 0.63 18.19
TUAN SING HOLDINGS LTD 516 0.44 20.7 2.66 1.03 1.38 0.56 48.08
HIAP HOE LTD 416 0.88 10.2 1.39 0.73 1.70 0.57 31.56
YING LI INTERNATIONAL 366 0.14 21.8 1.14 0.39 NA 0.44 40.53
HOTEL ROYAL LTD 339 4.03 33.1 1.56 1.16 1.24 0.62 20.90
SING HOLDINGS LIMITED 198 0.50 36.1 -12.16 -6.85 2.78 0.78 44.14
HEETON HOLDINGS LTD 182 0.56 3.3 6.29 2.95 1.07 0.47 40.55
Small-Mid cap average 1.2 0.4 2.2 0.7 39.7
Source: Bloomberg, PSR
Developers Peer Comparison/PSR Coverage

Disclaimer: The information contained in this document is intended only for use during the presentation and should not be disseminated or distributed to parties outside the presentation. Phillip Securities accepts no liability whatsoever with respect to the use of this document or its contents.
Phillip Securities Research Pte Ltd (A member of PhillipCapital) Co. Reg. No. 198803136N © PhillipCapital 2017. All Rights Reserved. For internal circulation only.
DBS Group Holdings Ltd
Major Spring Cleaning before FY18
Jeremy Teong
Phillip Securities Research Pte Ltd
13 November 2017
Disclaimer: The information contained in this document is intended only for use during the presentation and should not be disseminated or distributed to parties outside the presentation. Phillip Securities accepts no liability whatsoever with respect to the use of this document or its contents.
Phillip Securities Research Pte Ltd (A member of PhillipCapital) Co. Reg. No. 198803136N © PhillipCapital 2017. All Rights Reserved. For internal circulation only.
22
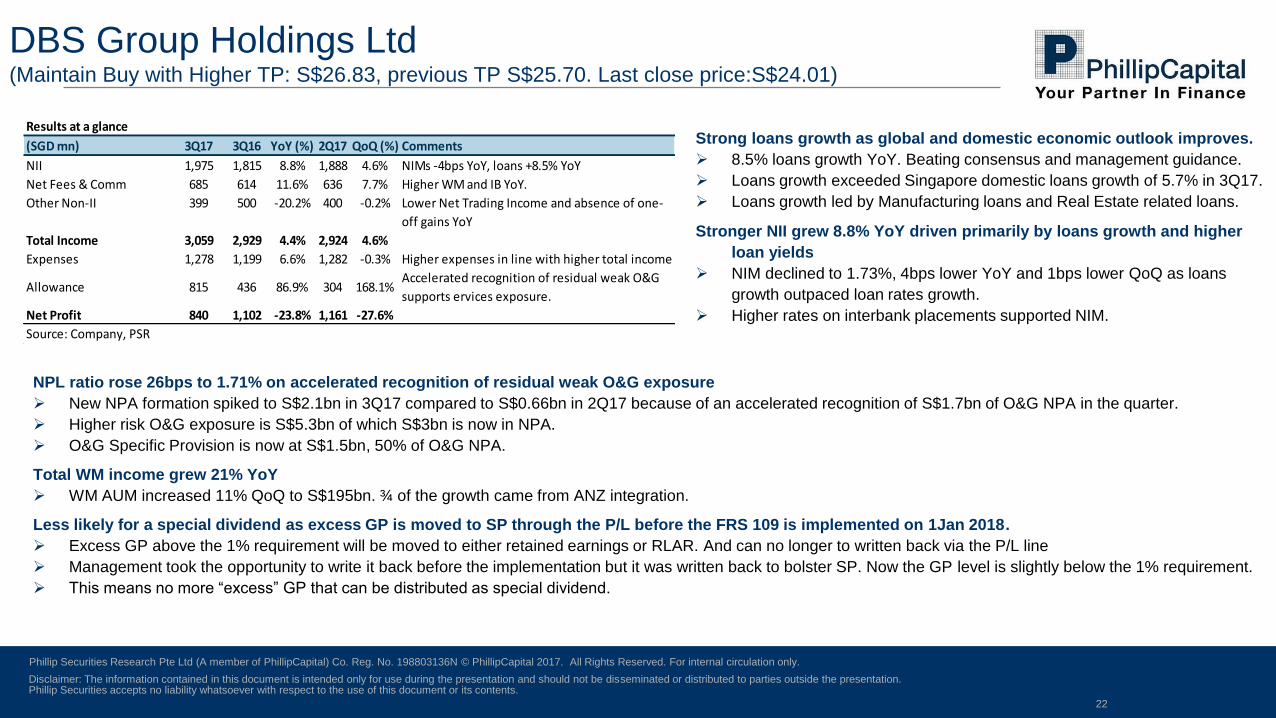
NPL ratio rose 26bps to 1.71% on accelerated recognition of residual weak O&G exposure
New NPA formation spiked to S$2.1bn in 3Q17 compared to S$0.66bn in 2Q17 because of an accelerated recognition of S$1.7bn of O&G NPA in the quarter.
Higher risk O&G exposure is S$5.3bn of which S$3bn is now in NPA.
O&G Specific Provision is now at S$1.5bn, 50% of O&G NPA.
Total WM income grew 21% YoY
WM AUM increased 11% QoQ to S$195bn. ¾ of the growth came from ANZ integration.
Less likely for a special dividend as excess GP is moved to SP through the P/L before the FRS 109 is implemented on 1Jan 2018.
Excess GP above the 1% requirement will be moved to either retained earnings or RLAR. And can no longer to written back via the P/L line
Management took the opportunity to write it back before the implementation but it was written back to bolster SP. Now the GP level is slightly below the 1% requirement.
This means no more “excess” GP that can be distributed as special dividend.
DBS Group Holdings Ltd(Maintain Buy with Higher TP: S$26.83, previous TP S$25.70. Last close price:S$24.01)
Results at a glance
(SGD mn) 3Q17 3Q16 YoY (%) 2Q17 QoQ (%) Comments
NII 1,975 1,815 8.8% 1,888 4.6% NIMs -4bps YoY, loans +8.5% YoY
Net Fees & Comm 685 614 11.6% 636 7.7% Higher WM and IB YoY.
Other Non-II 399 500 -20.2% 400 -0.2% Lower Net Trading Income and absence of one-
off gains YoY
Total Income 3,059 2,929 4.4% 2,924 4.6%
Expenses 1,278 1,199 6.6% 1,282 -0.3% Higher expenses in line with higher total income
Allowance 815 436 86.9% 304 168.1%Accelerated recognition of residual weak O&G
supports ervices exposure.
Net Profit 840 1,102 -23.8% 1,161 -27.6%
Source: Company, PSR
Strong loans growth as global and domestic economic outlook improves.
8.5% loans growth YoY. Beating consensus and management guidance.
Loans growth exceeded Singapore domestic loans growth of 5.7% in 3Q17.
Loans growth led by Manufacturing loans and Real Estate related loans.
Stronger NII grew 8.8% YoY driven primarily by loans growth and higher
loan yields
NIM declined to 1.73%, 4bps lower YoY and 1bps lower QoQ as loans
growth outpaced loan rates growth.
Higher rates on interbank placements supported NIM.
Disclaimer: The information contained in this document is intended only for use during the presentation and should not be disseminated or distributed to parties outside the presentation. Phillip Securities accepts no liability whatsoever with respect to the use of this document or its contents.
Phillip Securities Research Pte Ltd (A member of PhillipCapital) Co. Reg. No. 198803136N © PhillipCapital 2017. All Rights Reserved. For internal circulation only.
Centurion Corporation Limited
Higher Occupancy at Above Market Rates
Jeremy Teong
Phillip Securities Research Pte Ltd
13 November 2017

Disclaimer: The information contained in this document is intended only for use during the presentation and should not be disseminated or distributed to parties outside the presentation. Phillip Securities accepts no liability whatsoever with respect to the use of this document or its contents.
Phillip Securities Research Pte Ltd (A member of PhillipCapital) Co. Reg. No. 198803136N © PhillipCapital 2017. All Rights Reserved. For internal circulation only.
24
Singapore workers’ accommodation business continues to
experience high occupancy at above average bed rates
Papan occupancy at 99%, Woodlands occupancy at 100%. Toh
Guan and Mandai occupancy at 95%.
We estimate the Westlite dormitories in Singapore are commanding
a 10% to 14% premium to market rates.
Improving occupancy at Weslite Malaysia
Occupancy rising QoQ: 74% in 1Q17, 82% in 2Q17 and 86% in
3Q17.
Ongoing legal enforcement on illegal worker dormitories that shifted
more foreign workers into purpose-built accommodation and
increased worker limit in certain sectors.
Expect positive rental reversion in 2018 as policy continues to be
favourable
Other developments
Cash injection of S$29mn from exercise of warrants reduced net
debt to equity from 140% in 2Q17 to 125% in 3Q17. Management
and majority owners have exercised their warrants.
Westlite Tuas will expire on 30 January 2018. Bed rates at Tuas fell
to c.S$250 per bed per month to encourage tenants to commit to a
short term stay.
Centurion Corporation Limited(Maintain Accumulate with unchanged TP:S$0.59. Last:S$0.535)
Results at a glance
(SGD '000) 3Q17 3Q16 YoY 2Q17 QoQ Comments
Revenue 32,253 28,130 15% 35,248 -8% Better occupancy at Papan
Woodlands and Westlite M'sia
portfolio.
Cost of Sales (10,489) (11,246) -7% (9,592) 9% Lower amortisation cost YoY from
Tuas assets
Gross Profit 21,764 16,884 29% 25,656 -15%
Other misc. gains 396 729 -46% 303 31%
Expenses (12,165) (10,583) 15% (11,329) 7% S$1.1mn Fees for proposed dual
listing on SEHK
Assoc. & JV 1,139 1,590 -28% 53 2049%
Fair value gains (1,478) - NM 1,976 NMFair value losses from valuation
exercise
Income tax (2,253) (1,480) 52% (5,013) -55%
MI (1,342) 676 NM (2,533) NM Better performance from Papan
PATMI 6,061 7,816 -22% 9,113 -33% Lower contribution from Tuas
Source: Company, PSR
Disclaimer: The information contained in this document is intended only for use during the presentation and should not be disseminated or distributed to parties outside the presentation. Phillip Securities accepts no liability whatsoever with respect to the use of this document or its contents.
Phillip Securities Research Pte Ltd (A member of PhillipCapital) Co. Reg. No. 198803136N © PhillipCapital 2017. All Rights Reserved. For internal circulation only.
Singapore O&G Ltd.
Playing catch-up in 2H17
Soh Lin Sin
Phillip Securities Research Pte Ltd
13 November 2017

Disclaimer: The information contained in this document is intended only for use during the presentation and should not be disseminated or distributed to parties outside the presentation. Phillip Securities accepts no liability whatsoever with respect to the use of this document or its contents.
Phillip Securities Research Pte Ltd (A member of PhillipCapital) Co. Reg. No. 198803136N © PhillipCapital 2017. All Rights Reserved. For internal circulation only.
26
Strong performance from Cancer-related segment;
9M17 profitability +107.9% YoY
Should continue to gain traction
Maiden contribution from Paediatric clinic; Second
clinic in Tiong Bahru to commence by Nov-17
First clinic should breakeven by 1Q18 and start
contributing to bottom line by end-FY18
YTD market share for Obstetrics is stable at 4.2%
of Singapore’s total birth
Remain upbeat of the Group’s ability to deliver
organic growth
Management targets to add 2 new specialists into
the Group every year
Singapore O&G Ltd.(▼Accumulate, ▼ TP: $0.62 (prev. $0.65), Last: $0.51)
Results at a glance
S$' mn 3Q17 3Q16 YoY (%) Comments
Obstetrics & Gynaecology 4.6 4.7 -2.8% Lower contributions from Gynaecology offset growth
from Obstetrics
Cancer-related 1.0 0.8 25.3% Higher patient load
Dermatology 2.1 2.0 2.8% Stronger local patient load
Paediatric 0.1 0.0 n.m. New segment started in Jul-17
Revenue 7.7 7.5 2.4% As above
Gross 6.6 6.4 3.2% Gross Profit Margin +0.7pp to 85.9%
EBITDA 2.9 3.0 -1.4% Higher staff and rental expenses
EBITDA Margin -1.5pp to 36.8%
EBIT 2.8 2.9 -2.2% Higher depreciation cost
EBIT Margin -1.7pp to 36.4%
PATMI 2.3 2.4 -3.3% Lesser tax rebates and allowances (Implied tax rate
+2.6pp to 15.1%);
PATMI -5.2% YoY if excludes non-cash finance expense
Source: Company, PSR
Disclaimer: The information contained in this document is intended only for use during the presentation and should not be disseminated or distributed to parties outside the presentation. Phillip Securities accepts no liability whatsoever with respect to the use of this document or its contents.
Phillip Securities Research Pte Ltd (A member of PhillipCapital) Co. Reg. No. 198803136N © PhillipCapital 2017. All Rights Reserved. For internal circulation only.
Fraser and Neave, Ltd.
Vinamilk for the win
Soh Lin Sin
Phillip Securities Research Pte Ltd
13 November 2017

Disclaimer: The information contained in this document is intended only for use during the presentation and should not be disseminated or distributed to parties outside the presentation. Phillip Securities accepts no liability whatsoever with respect to the use of this document or its contents.
Phillip Securities Research Pte Ltd (A member of PhillipCapital) Co. Reg. No. 198803136N © PhillipCapital 2017. All Rights Reserved. For internal circulation only.
28
Dairies continued to deliver strong growth,
underpinned by strong Dairies Thailand
performance, as well as the significant increase in
contribution from Vinamilk
Vinamilk contributed approximately S$84mn or 47% of
FY17 EBIT
Group earnings were dampened by (a) higher finance
cost; (b) losses in Beverages and P&P; and (c)
brand investments in New Markets
Persistent challenging environment in Malaysia: rising
input costs, cautious spending, intensified competition,
and weaker MYR against SGD
Fraser and Neave(▲Accumulate, ▲TP: $2.83 (prev. $2.52), Last: $2.59)
Results at a glance
SGD mn FY17 FY16 YoY (%) Comments
Beverages 499 572 -12.7% Weak consumer sentiment and competitive
pricing in SG and MY
Dairies 1,105 1,099 0.6% Stronger performance from TH, SG and New
Markets mitigated slower sales in MY
Printing & Publishing
("P&P")
293 308 -4.7% Lower contributions from Publishing, coupled
with lower book volume sales
Revenue 1,898 1,979 -4.1% As above
Gross profit 661 728 -9.2% Higher input costs
Gross Margin -2.0pp to 34.8%
Core EBITDA 231 190 21.3% EBITDA Margin -4.0pp to 6.7%
EBIT, adj. 174 179 -3.1% Higher dividend income and profit contribution
from Vinamilk
PATMI (continuing
operations ex.
exceptional items)
100 109 -8.3% Higher finance cost mitigated by lower effective
tax rate due to higher tax exempt income
ETR of 8.8% vs FY16’s 12.0%.
DPS (Cents) 4.5 4.5 0.0% Payment ratio increased to 65.2% from 60.0%
Source: Company, PSR

Disclaimer: The information contained in this document is intended only for use during the presentation and should not be disseminated or distributed to parties outside the presentation. Phillip Securities accepts no liability whatsoever with respect to the use of this document or its contents.
Phillip Securities Research Pte Ltd (A member of PhillipCapital) Co. Reg. No. 198803136N © PhillipCapital 2017. All Rights Reserved. For internal circulation only.
Company
Mkt Cap
(SGD mn)
EV
(SGD mn)
EV/TTM
EBITDA
EV/EBITDA
FY1 P/E
P/E
FY1 Net D/E ROE (%) P/B
Price To
Tangible Assets
Saigon Beer Alcohol Beverage 10,614 10,143 28.9 24.7 40.2 38.7 Net Cash 20.3 31.7 12.0
Global Distillers
Anheuser-Busch Inbev NV 323,061 488,552 N/A 16.3 43.8 27.7 133.2 N/A N/A N/A
Diageo PLC 114,934 131,923 18.4 17.2 23.8 22.1 64.6 9.3 28.3 6.9
Heineken NV 77,688 99,525 13.3 11.6 26.5 21.9 76.4 4.6 14.2 3.7
Asahi Group Hldgs Ltd 31,026 47,051 N/A 14.9 17.0 21.1 64.3 5.8 15.5 2.3
Thai Beverage PCL 23,980 25,690 20.3 19.2 17.1 21.3 33.2 18.4 28.1 4.7
Tsingtao Brewery Co Ltd 8,916 6,753 12.2 13.4 34.5 28.1 Net Cash 3.5 6.6 2.3
Carlsberg Brewery (Malaysia) Bhd 1,563 1,576 13.2 13.7 21.9 20.1 Net Cash 35.6 91.8 20.0
Beijing Yanjing Brewery Co 3,579 3,408 N/A 13.2 57.6 39.2 Net Cash 1.6 2.3 1.3
Sapporo Hldgs Ltd 3,293 6,070 10.3 10.8 28.2 22.0 162.7 1.6 6.1 1.6
Hanoi Beer Alcohol & Beverage 1,707 1,591 17.5 18.1 38.0 40.4 Net Cash 8.0 13.8 5.0
Market Cap Weighted Average (ex. Sabeco) 6.5 15.8 34.9 25.3 101.3 3.7 9.8 2.3
Vietnam Dairy Products JSC 15,098 14,505 16.1 18.0 27.1 25.5 Net Cash 35.0 41.9 10.5
Source: Bloomberg
29
Next potential re-rating catalysts:
i. Acquisition of additional Vinamilk via open market
ii. 36.8% to 53.6% of Sabeco’s stake sales to be in tranches; the first tranche is expected to begin
in Dec-17
Fraser and Neave(▲Accumulate, ▲TP: $2.83 (prev. $2.52), Last: $2.59)

Disclaimer: The information contained in this document is intended only for use during the presentation and should not be disseminated or distributed to parties outside the presentation. Phillip Securities accepts no liability whatsoever with respect to the use of this document or its contents.
Phillip Securities Research Pte Ltd (A member of PhillipCapital) Co. Reg. No. 198803136N © PhillipCapital 2017. All Rights Reserved. For internal circulation only.
Company
Mkt Cap
(SGD mn)
EV
(SGD mn)
EV/EBITDA
TTM
EV/EBITDA
FY1 P/E
P/E
FY1
Net D/E
(%) ROA (%) ROE (%) P/B
Fraser and Neave Ltd 3,733 4,218 27.3 17.7 37.5 24.8 5.4 29.6 45.3 1.3
ASEAN
Fraser & Neave Hldgs Bhd 3,045 3,030 46.1 16.2 29.0 21.0 Net Cash 10.0 15.7 9.8
Power Root Bhd 225 211 13.8 11.2 17.8 15.3 Net Cash 10.4 15.0 2.7
Spritzer BHD 136 128 8.0 10.3 15.5 18.4 Net Cash 7.7 10.0 1.4
Oldtown Bhd 389 335 11.6 9.6 18.5 16.8 Net Cash 13.4 16.6 3.1
Alliance Global Group Inc 4,169 9,438 8.8 9.5 10.9 10.9 64.3 2.8 9.6 1.0
Pepsi-Cola Products Philippines Inc 265 364 4.0 N/A 13.4 N/A -6.0 3.3 8.4 1.1
Ultrajaya Milk Ind & Trading 1,500 1,321 10.7 12.9 18.7 19.7 Net Cash 17.9 21.6 3.7
Vietnam Dairy Products JSC 15,052 14,458 16.1 17.9 27.0 25.4 Net Cash 35.0 41.9 10.5
Yeo Hiap Seng Ltd 739 497 2.9 N/A 4.6 N/A Net Cash 22.0 25.3 1.1
17.5 15.1 23.0 20.9 10.4 24.4 30.7 7.9
Source: Bloomberg
Market Cap weighted Average (Excl. FNN)
30
FNN is currently trading at adjusted Trailing P/E of 37.5x
Our SOTP derived TP implied a 27.1x FY18e P/E, which is 30% higher than its ASEAN Beverages
peers at 20.9x
Fraser and Neave(▲Accumulate, ▲TP: $2.83 (prev. $2.52), Last: $2.59)

Disclaimer: The information contained in this document is intended only for use during the presentation and should not be disseminated or distributed to parties outside the presentation. Phillip Securities accepts no liability whatsoever with respect to the use of this document or its contents.
Phillip Securities Research Pte Ltd (A member of PhillipCapital) Co. Reg. No. 198803136N © PhillipCapital 2017. All Rights Reserved. For internal circulation only.
31
Disclaimer
The information contained in this presentation has been obtained from public sources which Phillip Securities Research Pte Ltd (“PSR”) has no
reason to believe are unreliable and any analysis, forecasts, projections, expectations and opinions (collectively the “Research”) contained in this
presentation are based on such information and are expressions of belief only. PSR has not verified this information and no representation or
warranty, express or implied, is made that such information or Research is accurate, complete or verified or should be relied upon as such. Any
such information or Research contained in this presentation is subject to change, and PSR shall not have any responsibility to maintain the
information or Research made available or to supply any corrections, updates or releases in connection therewith. In no event will PSR be liable for
any special, indirect, incidental or consequential damages which may be incurred from the use of the information or Research made available, even
if it has been advised of the possibility of such damages.
This presentation is intended for general circulation only and does not take into account the specific investment objectives, financial situation or
particular needs of any particular person.
You should seek advice from a financial adviser regarding the suitability of the investment product, taking into account your specific investment
objectives, financial situation or particular needs, before making a commitment to invest in such products.

Disclaimer: The information contained in this document is intended only for use during the presentation and should not be disseminated or distributed to parties outside the presentation. Phillip Securities accepts no liability whatsoever with respect to the use of this document or its contents.
Phillip Securities Research Pte Ltd (A member of PhillipCapital) Co. Reg. No. 198803136N © PhillipCapital 2017. All Rights Reserved. For internal circulation only.
32
Analysts Paul Chew, Head of Research
Pei Sai Teng, Macro
Jeremy Ng, Technical Analysis
Jeremy Teong, Banking & Finance
Soh Lin Sin, Consumer | Healthcare
Richard Leow, Transport | REITs (Industrial)
Dehong Tan, REITs (Commercial, Retail, Healthcare) | Property
Ho Kang Wei, US Equity
Chen Guangzhi, Oil and Gas | Energy
By Phillip Securities ResearchMohamed Amiruddin, Operations Exec
Ask Questions!
Archived Webinar videos can be accessed at:
https://www.StocksBnB.com/webinars/