12455
9
This is the author-manuscript version of this work - accessed from http://eprints.qut.edu.au Pamulu, M. Sapri and Kajewski, Stephen L. and Betts, Martin (2007) Evaluating Financial Ratios in Construction Industry: A Case Study of Indonesian Firms. In Dewobroto, Wiryanto and Hardjasaputra, Harianto and Adventus, Manlian R. and Widjajakusuma, Jack and Sitohang, Fransiscus Mintar, Eds. Proceedings 1st International Conference of European Asian Civil Engineering Forum (EACEF), pages E-158, Jakarta, Indonesia. Copyright 2007 (please consult author)
Transcript of 12455
8/7/2019 12455
http://slidepdf.com/reader/full/12455 1/9
This is the author-manuscript version of this work - accessed from
http://eprints.qut.edu.au
Pamulu, M. Sapri and Kajewski, Stephen L. and Betts, Martin (2007)
Evaluating Financial Ratios in Construction Industry: A Case Study
of Indonesian Firms. In Dewobroto, Wiryanto and Hardjasaputra,
Harianto and Adventus, Manlian R. and Widjajakusuma, Jack and
Sitohang, Fransiscus Mintar, Eds. Proceedings 1st International
Conference of European Asian Civil Engineering Forum (EACEF),
pages E-158, Jakarta, Indonesia.
Copyright 2007 (please consult author)
8/7/2019 12455
http://slidepdf.com/reader/full/12455 2/9
EVALUATING FINANCIAL RATIOS IN CONSTRUCTION INDUSTRY: A CASE
STUDY OF INDONESIAN FIRMS
M. Sapri Pamulu, Stephen Kajewski, and Martin Betts
ABSTRACT: This paper presents findings of a pilot study, which evaluates financial ratios in theIndonesian construction Industry. The study is an extension of a larger study that is an attempt to
identify the areas of strategic issues for Indonesian construction firms and develop an appropriate
strategic management process for the firms to formulate, implement and evaluate. The findings are
based on financial reports taken from all of construction companies listed in Surabaya Stock Exchange
(SSX). The SSX has classified 6 firms in the construction sector. It has included both private and state
owned firms. The research methodology adopted for this study includes data collection and analysis of
firm annual reports and financial statements. There are some methods and techniques of financial ratio
analysis in evaluating corporate performance of construction firms. Modified traditional ratios such as
Liquidity, Leverage, Activity and Profitability ratios are adapted from Construction Financial
Management Association (CFMA) to support different purposes of analysis. When evaluating ratios,
the results are compared with other firms in the same sector of industry. The analysis reveals that the
Indonesian firms in this study are financially sound, where profits and returns generated from
construction works are still satisfactory. However, this performance can still be sustained if they are
able to manage their maximum pace at which a company can grow revenue without depleting itsfinancial resources.
KEYWORDS: Financial Management; Ratio Analysis; Strategic Management, Management of the firm;
Indonesia.
1. INTRODUCTION
The Indonesian government established the National Construction Services Development Board
(CSDB) in 1999, and began working to develop the industrial sector through industry-government
partnerships. The government and CSDB hope to establish organizations that are needed by
companies, engineers, and skilled workers with regard to human resource development, technologicalinnovation, and capital cooperation. These activities are expected to ensure a level of capacity building
that will allow Indonesia to compete in global economic structures. Since 2004, under the new regime
of Susilo Bambang Yudhoyono, expanded efforts toward infrastructural and public housing
development are expected to boost the construction industry and employment. The Government is
pursuing public private partnership (PPP), which introduces private sector funds into infrastructure
building in Indonesia.
Although the construction industry in Indonesia is relatively young, it has shown a rapid growth since
the early 1970s. The construction industry contribution to the Indonesian GDP increased from 3.9% in
1973 to 7.9% in 1996. In the period of 1996 to 1999, construction works were sharply reduced due to
the recent economic crisis, but went on the upswing from 1999 to 2005. The Bureau of Statistics
(BPS) reveals that the latent construction market for 2005 was valued at about 45 Trillion Indonesian
Rupiah (IDR), reflecting a growth rate of 6% over the previous year and this growth is set to continue.
____________________1 Researcher, Centre for Built Environment & Engineering Research, Queensland University of Technology, Brisbane, QLD
4001, Australia.
8/7/2019 12455
http://slidepdf.com/reader/full/12455 3/9
8/7/2019 12455
http://slidepdf.com/reader/full/12455 4/9
assessing the financial performance of a construction firm, CFMA employs 19 financial ratios as
follows:
Profitability ratios:
R.1 Return on Assets
R.2 Return on Equity
R.3 Time Interest Earned
Liquidity ratios:
R.4 Current Ratio
R.5 Quick Ratio
R.6 Days of Cash
R.7 Working Capital Turnover
Leverage ratios:
R.8 Debt to Equity
R.9 Revenue to Equity
R.10 Asset Turnover
R.11 Equity to SG&A Expense
R.12 Underbillings to EquityR.13 Backlog to Equity
Efficiency Ratios:
R.14 Backlog to Working Capital
R.15 Months in Backlog
R.16 Days in Account Receivable
R.17 Days in Inventory
R.18 Days in Account Payable
R.19 Operating Cycle
The formulas that define the above ratios are listed in Appendix 1. However, In the CFMA's 2006
Annual Financial Study, Return on Assets (ROA) and Return on Equity (ROE) are calculated usingnet profit (loss) before income taxes. Studies conducted in prior years used net earnings (loss) after
taxes to calculate ROA and ROE.
As a general rule, the higher the score in profitability and liquidity, and the lower score in leverage
indicate the better the financial performance of the firm. Ellis (2006) suggests five indicators to
determine ‘Best in Class’ status of financial health of a construction firm i.e. (1) Return on assets; (2)
Return on equity; (3) Fixed asset ratio; (4) Debt to equity, and (5) Working capital turnover. In
addition, McCall (2006) points out that working capital is the most important ratio for construction
contractors which is a direct indicator of a contractor’s short term financial strength and is used to help
evaluate a contractor’s ability to fund construction projects. All these have to be taken into account
when evaluating the financial performance of a firm
3. METHODOLOGY
The research methodology adopted for this study includes data collection and analysis of the firm’s
annual report. These reports include the following financial statements: Consolidated of Balance
Sheets, Consolidated Statements of Income, Consolidated Statements of Changes in Equity, and
Consolidated Statements of Cash Flows. The Capital Market Supervisory Agency of Indonesia (2002)
has recommended a guide for financial report/statement disclosure for public listed companies in the
construction industry.
8/7/2019 12455
http://slidepdf.com/reader/full/12455 5/9
Specific financial ratio standards for the Indonesian construction industry have not been formally
developed, and hence the ratios will be compared to values applied to the U.S. construction industry
found in various references which are noted with each ratio. Modified traditional ratios such as
Liquidity, Leverage, Activity and Profitability ratios are adapted from CFMA’s Construction Industry
Annual Financial Survey (Ellis, 2006) to support the different purposes of analysis. In evaluating
ratios, the results are compared with other firms in the same market segment of industry, and
comparable in terms of size. A sample of six construction companies listed on the Jakarta Stock
Exchange (JSX) and Surabaya Stock Exchange (SSX) was selected in this empirical research. All of the selected firms have been involved in the Indonesian construction business over 30 years with total
assets value over 1 Trillion Indonesian Rupiahs (IDR).
4. EVALUATING FINANCIAL RATIO
The analysis is carried out over a period of four consecutive years so that all aspects of recent financial
performances are reflected in the following results of evaluation.
4.1 Revenue and profitability
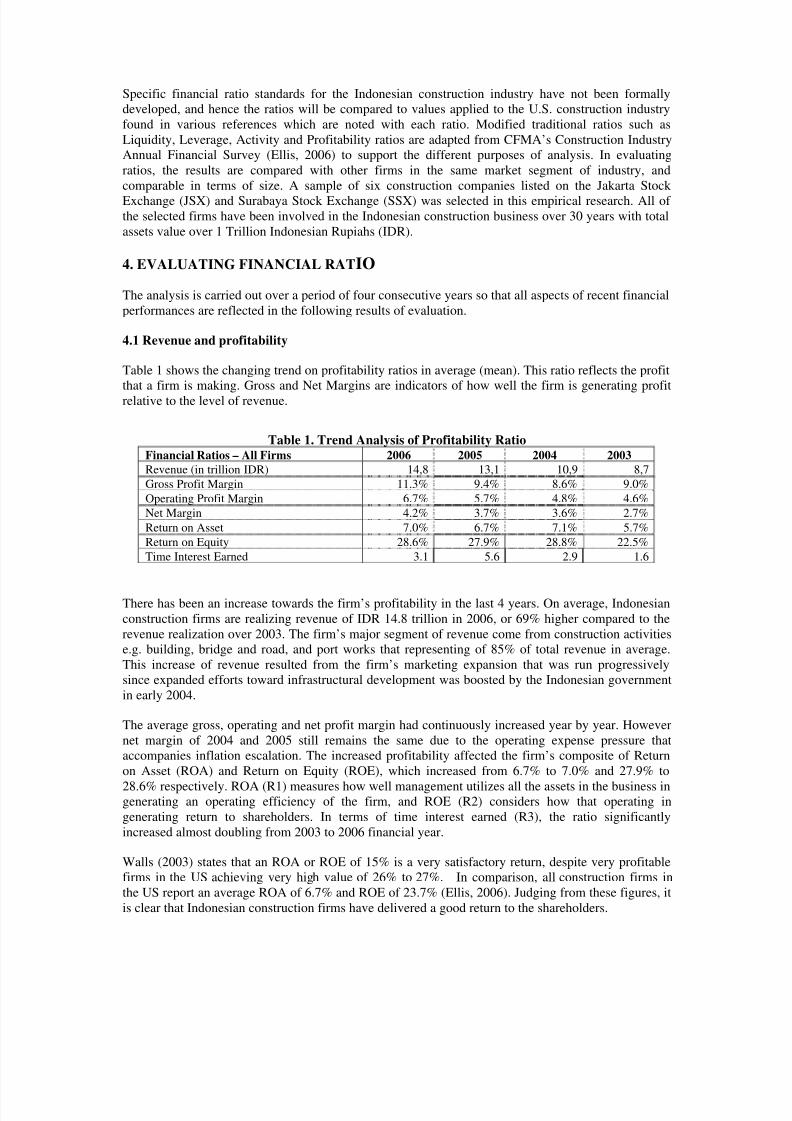
Table 1 shows the changing trend on profitability ratios in average (mean). This ratio reflects the profit
that a firm is making. Gross and Net Margins are indicators of how well the firm is generating profit
relative to the level of revenue.
Table 1. Trend Analysis of Profitability Ratio Financial Ratios – All Firms 2006 2005 2004 2003
Revenue (in trillion IDR) 14,8 13,1 10,9 8,7
Gross Profit Margin 11.3% 9.4% 8.6% 9.0%
Operating Profit Margin 6.7% 5.7% 4.8% 4.6%
Net Margin 4.2% 3.7% 3.6% 2.7%
Return on Asset 7.0% 6.7% 7.1% 5.7%
Return on Equity 28.6% 27.9% 28.8% 22.5%
Time Interest Earned 3.1 5.6 2.9 1.6
There has been an increase towards the firm’s profitability in the last 4 years. On average, Indonesian
construction firms are realizing revenue of IDR 14.8 trillion in 2006, or 69% higher compared to the
revenue realization over 2003. The firm’s major segment of revenue come from construction activities
e.g. building, bridge and road, and port works that representing of 85% of total revenue in average.
This increase of revenue resulted from the firm’s marketing expansion that was run progressively
since expanded efforts toward infrastructural development was boosted by the Indonesian government
in early 2004.
The average gross, operating and net profit margin had continuously increased year by year. However
net margin of 2004 and 2005 still remains the same due to the operating expense pressure that
accompanies inflation escalation. The increased profitability affected the firm’s composite of Return
on Asset (ROA) and Return on Equity (ROE), which increased from 6.7% to 7.0% and 27.9% to
28.6% respectively. ROA (R1) measures how well management utilizes all the assets in the business ingenerating an operating efficiency of the firm, and ROE (R2) considers how that operating in
generating return to shareholders. In terms of time interest earned (R3), the ratio significantly
increased almost doubling from 2003 to 2006 financial year.
Walls (2003) states that an ROA or ROE of 15% is a very satisfactory return, despite very profitable
firms in the US achieving very high value of 26% to 27%. In comparison, all construction firms in
the US report an average ROA of 6.7% and ROE of 23.7% (Ellis, 2006). Judging from these figures, it
is clear that Indonesian construction firms have delivered a good return to the shareholders.
8/7/2019 12455
http://slidepdf.com/reader/full/12455 6/9
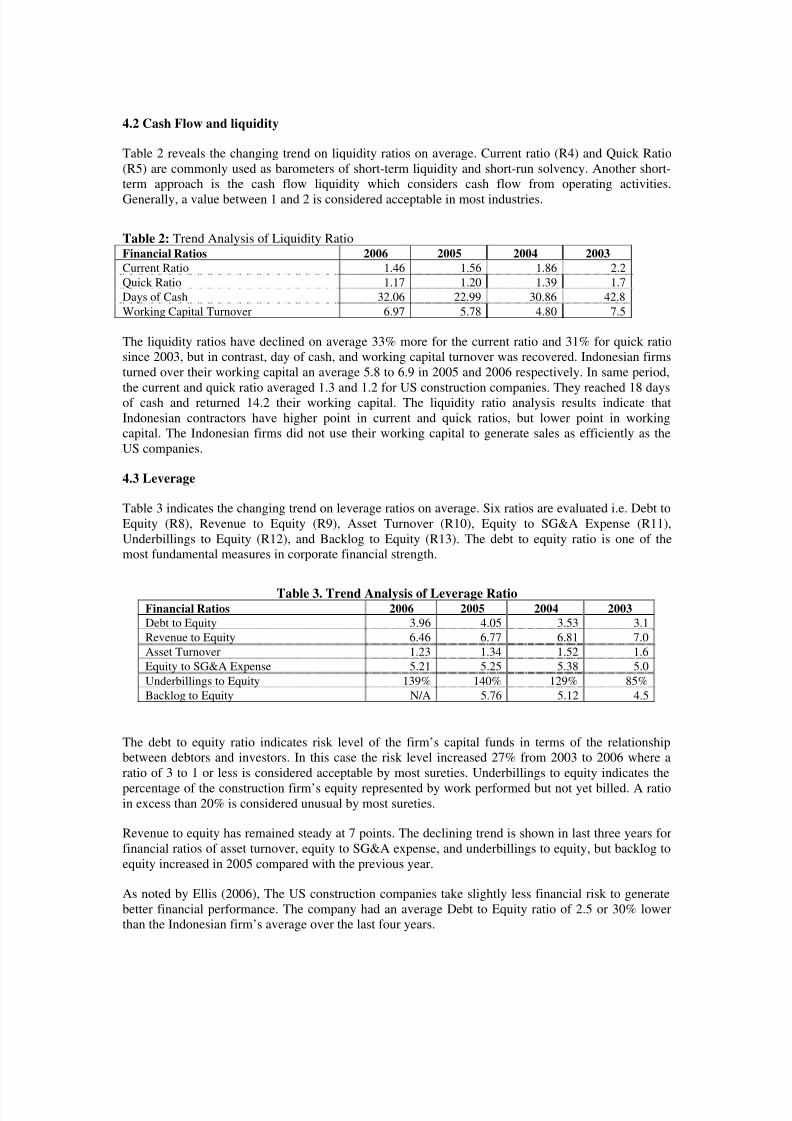
4.2 Cash Flow and liquidity
Table 2 reveals the changing trend on liquidity ratios on average. Current ratio (R4) and Quick Ratio
(R5) are commonly used as barometers of short-term liquidity and short-run solvency. Another short-
term approach is the cash flow liquidity which considers cash flow from operating activities.
Generally, a value between 1 and 2 is considered acceptable in most industries.
Table 2: Trend Analysis of Liquidity RatioFinancial Ratios 2006 2005 2004 2003
Current Ratio 1.46 1.56 1.86 2.2
Quick Ratio 1.17 1.20 1.39 1.7
Days of Cash 32.06 22.99 30.86 42.8
Working Capital Turnover 6.97 5.78 4.80 7.5
The liquidity ratios have declined on average 33% more for the current ratio and 31% for quick ratio
since 2003, but in contrast, day of cash, and working capital turnover was recovered. Indonesian firms
turned over their working capital an average 5.8 to 6.9 in 2005 and 2006 respectively. In same period,
the current and quick ratio averaged 1.3 and 1.2 for US construction companies. They reached 18 daysof cash and returned 14.2 their working capital. The liquidity ratio analysis results indicate that
Indonesian contractors have higher point in current and quick ratios, but lower point in working
capital. The Indonesian firms did not use their working capital to generate sales as efficiently as the
US companies.
4.3 Leverage
Table 3 indicates the changing trend on leverage ratios on average. Six ratios are evaluated i.e. Debt to
Equity (R8), Revenue to Equity (R9), Asset Turnover (R10), Equity to SG&A Expense (R11),
Underbillings to Equity (R12), and Backlog to Equity (R13). The debt to equity ratio is one of the
most fundamental measures in corporate financial strength.
Table 3. Trend Analysis of Leverage Ratio Financial Ratios 2006 2005 2004 2003
Debt to Equity 3.96 4.05 3.53 3.1
Revenue to Equity 6.46 6.77 6.81 7.0
Asset Turnover 1.23 1.34 1.52 1.6
Equity to SG&A Expense 5.21 5.25 5.38 5.0
Underbillings to Equity 139% 140% 129% 85%
Backlog to Equity N/A 5.76 5.12 4.5
The debt to equity ratio indicates risk level of the firm’s capital funds in terms of the relationship
between debtors and investors. In this case the risk level increased 27% from 2003 to 2006 where a
ratio of 3 to 1 or less is considered acceptable by most sureties. Underbillings to equity indicates the
percentage of the construction firm’s equity represented by work performed but not yet billed. A ratioin excess than 20% is considered unusual by most sureties.
Revenue to equity has remained steady at 7 points. The declining trend is shown in last three years for
financial ratios of asset turnover, equity to SG&A expense, and underbillings to equity, but backlog to
equity increased in 2005 compared with the previous year.
As noted by Ellis (2006), The US construction companies take slightly less financial risk to generate
better financial performance. The company had an average Debt to Equity ratio of 2.5 or 30% lower
than the Indonesian firm’s average over the last four years.
8/7/2019 12455
http://slidepdf.com/reader/full/12455 7/9
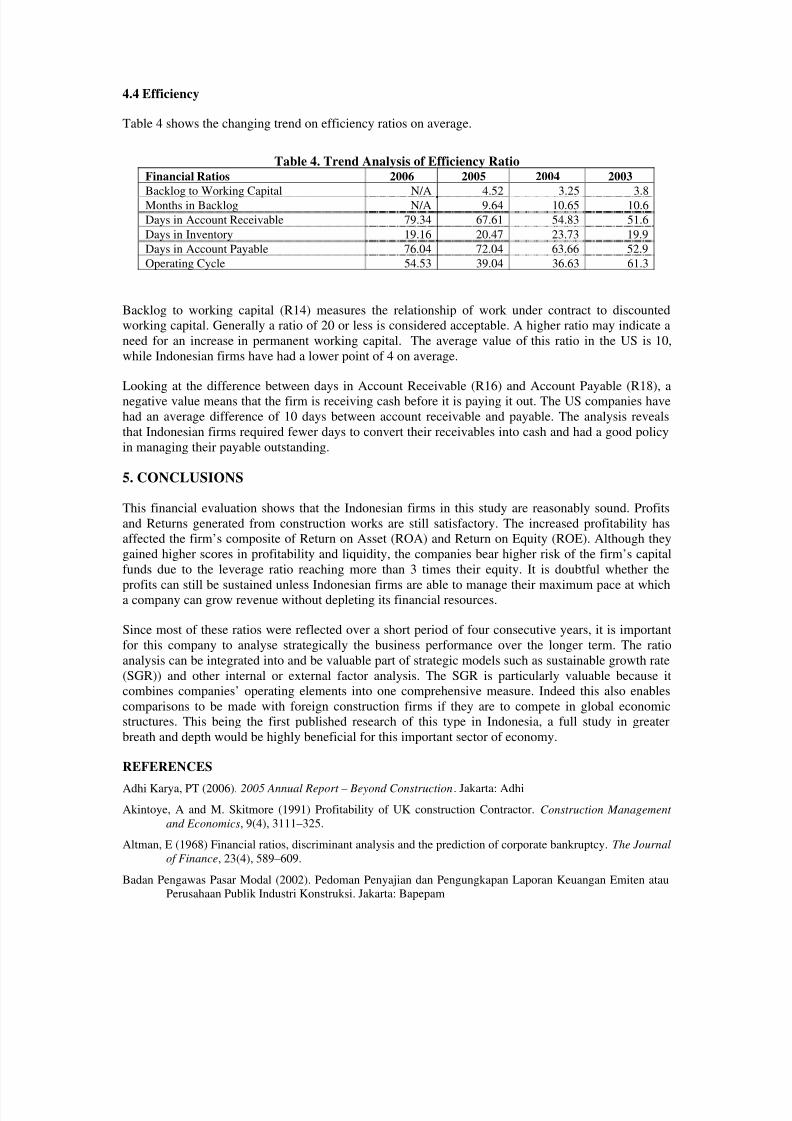
4.4 Efficiency
Table 4 shows the changing trend on efficiency ratios on average.
Table 4. Trend Analysis of Efficiency RatioFinancial Ratios 2006 2005 2004 2003
Backlog to Working Capital N/A 4.52 3.25 3.8Months in Backlog N/A 9.64 10.65 10.6
Days in Account Receivable 79.34 67.61 54.83 51.6
Days in Inventory 19.16 20.47 23.73 19.9
Days in Account Payable 76.04 72.04 63.66 52.9
Operating Cycle 54.53 39.04 36.63 61.3
Backlog to working capital (R14) measures the relationship of work under contract to discounted
working capital. Generally a ratio of 20 or less is considered acceptable. A higher ratio may indicate a
need for an increase in permanent working capital. The average value of this ratio in the US is 10,
while Indonesian firms have had a lower point of 4 on average.
Looking at the difference between days in Account Receivable (R16) and Account Payable (R18), anegative value means that the firm is receiving cash before it is paying it out. The US companies have
had an average difference of 10 days between account receivable and payable. The analysis reveals
that Indonesian firms required fewer days to convert their receivables into cash and had a good policy
in managing their payable outstanding.
5. CONCLUSIONS
This financial evaluation shows that the Indonesian firms in this study are reasonably sound. Profits
and Returns generated from construction works are still satisfactory. The increased profitability has
affected the firm’s composite of Return on Asset (ROA) and Return on Equity (ROE). Although they
gained higher scores in profitability and liquidity, the companies bear higher risk of the firm’s capital
funds due to the leverage ratio reaching more than 3 times their equity. It is doubtful whether the
profits can still be sustained unless Indonesian firms are able to manage their maximum pace at whicha company can grow revenue without depleting its financial resources.
Since most of these ratios were reflected over a short period of four consecutive years, it is important
for this company to analyse strategically the business performance over the longer term. The ratio
analysis can be integrated into and be valuable part of strategic models such as sustainable growth rate
(SGR)) and other internal or external factor analysis. The SGR is particularly valuable because it
combines companies’ operating elements into one comprehensive measure. Indeed this also enables
comparisons to be made with foreign construction firms if they are to compete in global economic
structures. This being the first published research of this type in Indonesia, a full study in greater
breath and depth would be highly beneficial for this important sector of economy.
REFERENCES
Adhi Karya, PT (2006). 2005 Annual Report – Beyond Construction. Jakarta: Adhi
Akintoye, A and M. Skitmore (1991) Profitability of UK construction Contractor. Construction Management
and Economics, 9(4), 3111–325.
Altman, E (1968) Financial ratios, discriminant analysis and the prediction of corporate bankruptcy. The Journal
of Finance, 23(4), 589–609.
Badan Pengawas Pasar Modal (2002). Pedoman Penyajian dan Pengungkapan Laporan Keuangan Emiten atau
Perusahaan Publik Industri Konstruksi. Jakarta: Bapepam
8/7/2019 12455
http://slidepdf.com/reader/full/12455 8/9
Biro Pusat Statistik (BPS) (2007) Construction Statistics. Statistics Indonesia. www.bps.go.id (accessed 1 April
2007)
Chan, J and R. Cheung (2005) Monitoring financial health of contractors at the aftermath of the Asian economic
turmoil: a case study in Hong Kong. Construction Management and Economics, 23(5), 451–458.
Cheah, C, M. Garvin, and J. Miller (2004) Empirical Study of Strategic Performance of Global Construction
Firms. Journal of Construction Engineering and Management , 130(6), 808-817.
Edum-Fotwe, F, A. Price, and A. Thorpe (1996). A review of financial ratio tools for predicting contractorinsolvency. Construction Management and Economics, 14(3), 317–325.
Ellis, M, R. Earl, and & K. Evans (2006) CFMA’s 2006: Financial Survey Results. In Accounting & Reporting,
CFMA – BP. New Jersey: Construction Financial Management Association
Fadel, H (1977) The Predictive power of financial ratios in the British construction industry. Journal of Business
Finance & Accounting, 4(3), 339-352.
Fraser, L, and A. Ormiston (2004) Undertsanding Financial Statements. 7th Ed. New Jersey: Pearson Prentice
Hall.
Gibson, C (2004) Financial reporting & analysis: using financial accounting information . 9th Ed. Ohio:
Thomson South-Western.
Hogget, J, E. Lee, and J. Medlin (2006) Accounting. 6th Ed. Milton: John Wiley & Sons Australia.
Hunger, J, and T. Wheelen (2007) Essential of Strategic Management . 4th Ed. New Jersey: Pearson PrenticeHall.
Langford, D, T. Iyagba and D. Komba (1993) Prediction of solvency in construction companies. Construction
Management and Economics, 11(5), 317–325.
Lembaga Pengembangan Jasa Konstruksi.(LPJK) (2007). Statistik Badan Usaha – 2006. www.lpjk.org (accessed
1 April 2007)
Lembaga Pengembangan Jasa Konstruksi (LPJK) (2004). Asia Construct - Country Report Indonesia. Jakarta:
LPJK
McCall, J (2006) Understanding a Contractor’s Financial Statement. In RMA Presentation, 1-17. Philadelphia:
Risk Management Association.
Ocal, M, E. Oral, E. Erdis, And G. Vural (2007) Industry financial ratios – application of factor analysis in
Turkish construction industry. Building and Environment , 42(1), 385-392.Pembangunan Perumahan, PT (2006) 2005 Annual Report – it’s a view of quality …. Jakarta: PP
Petrosea, PT (2006) 2005 Annual Report . Jakarta: Petrosea
Pilateris, P, and B. McCabe (2003) Contractor financial evaluation model. Canadian Journal of Civil
Engineering, 30, 487-489.
Singh, D and R. Tiong (2006) Evaluating the financial health of construction contractors. In Municipal Engineer
- Proceedings of the Institution of Civil Engineers, 161-166. London: Institution of Civil Engineers
Total Bangun Persada, PT (2006) Independent Auditor’s Report and Financial Statements for the years ended
December 31, 2005, 2004 and 2003. Jakarta: RSM AAJ Associates.
Walsh, C (2003) Key Management Ratios. 3rd Ed. Harlow GB: Pearson Education Limited
Waskita Karya, PT (2006) 2005 Annual Report – Onward through high quality performance. Jakarta: Waskita
Wijaya Karya, PT (2006) 2005 Laporan Keuangan Konsolidasian untuk tahun-tahun yang berakhir pada 31
desember 2205 dan 2004. Jakarta: Hadori & Rekan
Williamson, D, W. Jenkins, P. Cooke, and K. Moreton (2004) Strategic Management and Business Analysis.
Oxford: Elsevier Butterworth-Heinemann.
Yee, C and C. Cheah (2006) Fundamental Analysis of Profitability of Large Engineering and Construction
Firms. Journal of Management in Engineering, 22(4), 203-210.
8/7/2019 12455
http://slidepdf.com/reader/full/12455 9/9
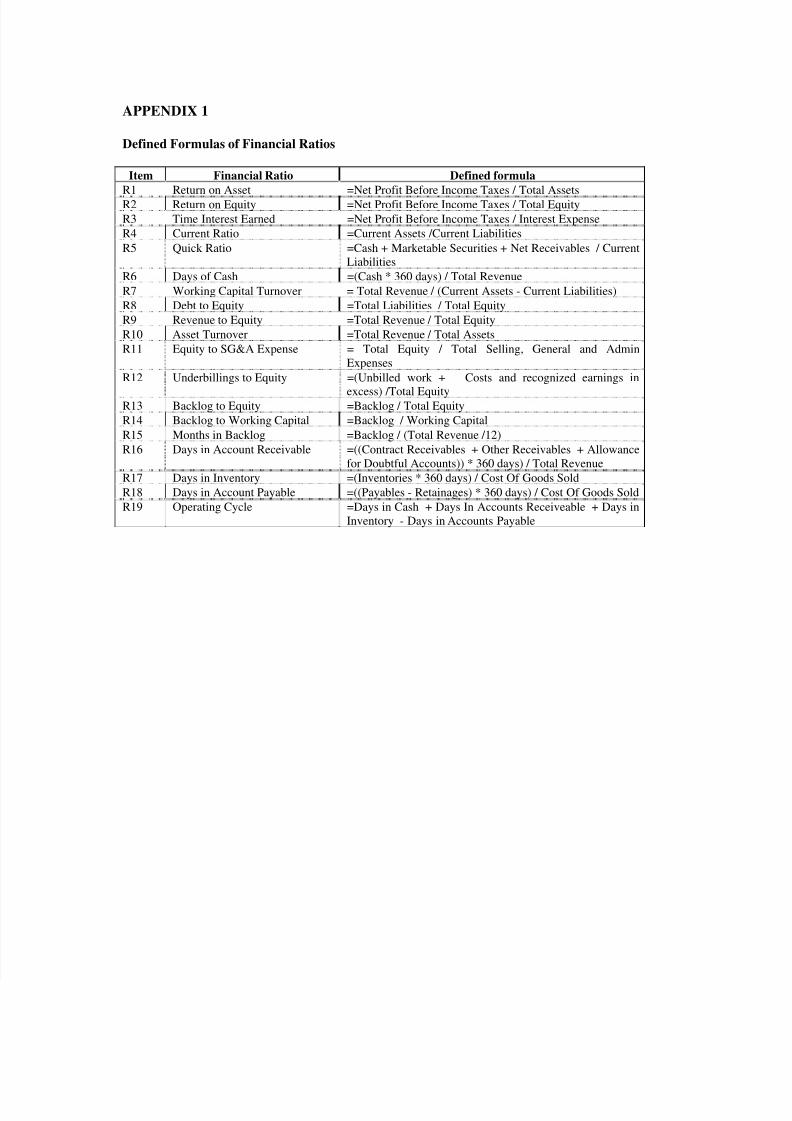
APPENDIX 1
Defined Formulas of Financial Ratios
Item Financial Ratio Defined formula
R1 Return on Asset =Net Profit Before Income Taxes / Total AssetsR2 Return on Equity =Net Profit Before Income Taxes / Total Equity
R3 Time Interest Earned =Net Profit Before Income Taxes / Interest Expense
R4 Current Ratio =Current Assets /Current Liabilities
R5 Quick Ratio =Cash + Marketable Securities + Net Receivables / Current
Liabilities
R6 Days of Cash =(Cash * 360 days) / Total Revenue
R7 Working Capital Turnover = Total Revenue / (Current Assets - Current Liabilities)
R8 Debt to Equity =Total Liabilities / Total Equity
R9 Revenue to Equity =Total Revenue / Total Equity
R10 Asset Turnover =Total Revenue / Total Assets
R11 Equity to SG&A Expense = Total Equity / Total Selling, General and Admin
Expenses
R12 Underbillings to Equity =(Unbilled work + Costs and recognized earnings in
excess) /Total EquityR13 Backlog to Equity =Backlog / Total Equity
R14 Backlog to Working Capital =Backlog / Working Capital
R15 Months in Backlog =Backlog / (Total Revenue /12)
R16 Days in Account Receivable =((Contract Receivables + Other Receivables + Allowance
for Doubtful Accounts)) * 360 days) / Total Revenue
R17 Days in Inventory =(Inventories * 360 days) / Cost Of Goods Sold
R18 Days in Account Payable =((Payables - Retainages) * 360 days) / Cost Of Goods Sold
R19 Operating Cycle =Days in Cash + Days In Accounts Receiveable + Days in
Inventory - Days in Accounts Payable