12-1151-0213 Rpt Apr 2013 DCC Bronte Asphalt Plant HPAQB V3
152
April 2013 BRONTE ASPHALT PLANT Oakville Health Protection Air Quality By-Law Application for Approval REPORT Report Number: 12-1151-0213 Distribution: 1 Copy - Dufferin Construction Company, Oakville, Ontario 3 Copies - The Corporation of the Town of Oakville 2 Copies - Golder Associates Ltd., Mississauga, Ontario Submitted to: Dufferin Construction Company, a division of Holcim (Canada) Inc. 600 Dorval Drive Suite 200 Oakville, Ontario L6H 3K4
Transcript of 12-1151-0213 Rpt Apr 2013 DCC Bronte Asphalt Plant HPAQB V3

April 2013
BRONTE ASPHALT PLANT
Oakville Health Protection Air Quality By-Law Application for Approval
REPO
RT
Report Number: 12-1151-0213
Distribution:
1 Copy - Dufferin Construction Company, Oakville, Ontario 3 Copies - The Corporation of the Town of Oakville 2 Copies - Golder Associates Ltd., Mississauga, Ontario
Submitted to: Dufferin Construction Company, a division of Holcim (Canada) Inc. 600 Dorval Drive Suite 200 Oakville, Ontario L6H 3K4

BRONTE ASPHALT PLANT HPAQB APPLICATION FOR APPROVAL
April 2013 Report No. 12-1151-0213 i
EXECUTIVE SUMMARY This Town of Oakville (the Town) Health Protection Air Quality By-Law (HPAQB) Application for Approval (Application) was prepared to assess the potential health risk of emissions of fine particulate matter (FPM) from the existing Bronte Asphalt Plant (the Facility), owned and operated by Dufferin Construction Company, a division of Holcim (Canada) Inc. (Dufferin). This Application was prepared following the Oakville document “Guidance for Implementation of Oakville Health Protection Air Quality By-Law 2010-035, Section 5 and 6 and Approval Requirements for Major Emitters v.5 June 2011”.
Dufferin Construction has been operating a hot mix asphalt (HMA) plant located at 731 Third Line in Oakville, Ontario (the Facility) for the past 30 years. Dufferin is a local provider of asphalt and construction services, that has helped improve local infrastructure within the Town of Oakville. In 2011, the company completed the widening of the QEW through Oakville which included the construction of high-occupancy vehicle (HOV) lanes to help alleviate traffic and gridlock. Secondary activities at the facility include recycled concrete and asphalt crushing operations, which is a sustainable practice through providing a replacement product for virgin aggregate in various concrete and asphalt products.
The primary sources of FPM from the Facility included in the assessment are the HMA batch plant, material receiving, transfer and storage, heating equipment and recycled concrete crushing. To determine the impact of the Facility on the airshed, average and annual emission rates were developed following regulatory accepted inventory calculation methods. These data, with the aid of the CALPUFF modelling system, were used to estimate the contribution of the facility to ambient levels of FPM in the airshed.
The Facility is currently permitted to operate under site-wide Environmental Compliance Approval 5859-798SLP dated December 31, 2007. Under the Town of Oakville (the Town) Health Protection Air Quality By-Law (HPAQB), the facility is considered a major emitter of FPM, as they directly emit more than 300 kilograms per year of this substance.
This assessment considered both average and maximum operating scenarios for the Facility. Due to the seasonality of construction operations, the batch plant is in operation April through December each year. Recycle crushing operations are carried out by a third party contractor and occur occasionally throughout the year for a maximum of 60 days per year.
Based on modelling results, the Facility does not significantly affect the existing airshed as the facility-induced FPM concentrations for average and maximum scenarios are less than 0.2 µg/m3 (micrograms per cubic metre) annually, a criterion defined by the HPAQB. As a result, a health risk assessment is not required.

BRONTE ASPHALT PLANT HPAQB APPLICATION FOR APPROVAL
April 2013 Report No. 12-1151-0213 ii
Table of Contents
1.0 INTRODUCTION ............................................................................................................................................................... 1
2.0 FACILITY DESCRIPTION ................................................................................................................................................. 2
2.1 Facility Overview .................................................................................................................................................. 2
2.2 Location of the Facility ......................................................................................................................................... 3
2.3 Buildings .............................................................................................................................................................. 3
2.4 Raw Materials, Products and Processes ............................................................................................................. 3
2.5 Emission Sources ................................................................................................................................................ 5
2.6 Emission Totals ................................................................................................................................................... 7
2.7 Negligible Sources ............................................................................................................................................... 8
2.8 Average and Maximum Operating Scenarios ...................................................................................................... 8
3.0 EMISSION CONTROL EQUIPMENT AND PROCEDURES AND EMISSIONS MONITORING ..................................... 10
3.1.1 Best Management Practices Plan ................................................................................................................ 11
3.1.2 Maintenance of Pollution Control Equipment ............................................................................................... 11
3.1.3 Summary ...................................................................................................................................................... 11
4.0 IDENTIFICATION AND QUANTIFICATION OF SUBSTANCES RELEASED TO AIR .................................................. 13
4.1 Emission Estimation Methods ............................................................................................................................ 13
4.1.1 Asphalt Production ....................................................................................................................................... 13
4.1.2 Materials Handling ....................................................................................................................................... 14
4.1.3 Storage Piles ................................................................................................................................................ 14
4.1.4 Emissions from Recycle Crushing................................................................................................................ 14
4.1.5 Generators for Crushing Operations ............................................................................................................ 14
4.1.6 Combustion Emissions ................................................................................................................................. 14
4.1.7 Welding ........................................................................................................................................................ 14
5.0 EVALUATION ................................................................................................................................................................. 15
5.1 Modelling Approach and Model Selection .......................................................................................................... 15
5.2 Model Inputs ...................................................................................................................................................... 16
5.3 Source Parameters ............................................................................................................................................ 17
5.3.1 Model Input Options ..................................................................................................................................... 19

BRONTE ASPHALT PLANT HPAQB APPLICATION FOR APPROVAL
April 2013 Report No. 12-1151-0213 iii
5.3.2 Non-Default Settings .................................................................................................................................... 19
5.3.3 Coordinate System....................................................................................................................................... 19
5.3.4 Meteorology, Land Use and Terrain Data .................................................................................................... 20
5.3.5 Receptors ..................................................................................................................................................... 20
5.3.6 Building Downwash ...................................................................................................................................... 20
5.3.7 Background and Cumulative Concentrations ............................................................................................... 20
5.3.8 Chemistry Models ........................................................................................................................................ 20
5.3.9 Species Modelled ......................................................................................................................................... 21
5.3.10 Same Structure Contamination .................................................................................................................... 21
6.0 MAPPING ....................................................................................................................................................................... 22
7.0 CONCLUSION ................................................................................................................................................................ 23
TABLES Table 1: Daily and Annual Flow-Through Rates of Raw Materials ............................................................................................. 4
Table 2: Sources of Fine Particulate Matter .............................................................................................................................. 6
Table 3: Summary of Daily and Annual FPM Emission Rates .................................................................................................... 7
Table 4: Annual Operations Summary ....................................................................................................................................... 8
Table 5: Historical Annual Production and Variability ................................................................................................................. 9
Table 6: List of Typical Control Technologies ........................................................................................................................... 10
Table 7: Emission Control Practices ........................................................................................................................................ 11
Table 8: Typical Control Efficiencies for Fugitive Dust Management ....................................................................................... 12
Table 9: Health-Risk Air Pollutant Total Annual Emissions ...................................................................................................... 13
Table 11: Summary of Source Types Used for Dispersion Modelling ...................................................................................... 17
Table 12: Point Source Dispersion Modelling Input Parameters .............................................................................................. 17
Table 13: Volume Source Dispersion Modelling Input Parameters .......................................................................................... 18
Table 14: Model Input Options ................................................................................................................................................. 19
Table 15: FPM Modelling Results ............................................................................................................................................ 22
FIGURES
No table of figures entries found.

BRONTE ASPHALT PLANT HPAQB APPLICATION FOR APPROVAL
April 2013 Report No. 12-1151-0213 iv
FIGURES
Figure 1 - Site Location Plan
Figure 2 - Zoning Map
Figure 3 – Building Locations
Figure 4 - Simplified Process Flow Diagram
Figure 5 - Dispersion Sources
APPENDICES APPENDIX A Dufferin’s History and Commitment to Oakville
APPENDIX B ECA No. 5859-798SLP, OHMPA Environmental Best Practices Guide
APPENDIX C Emission Rate Calculations
APPENDIX D CALPUFF Model Files (on CD)

BRONTE ASPHALT PLANT HPAQB APPLICATION FOR APPROVAL
April 2013 Report No. 12-1151-0213 1
1.0 INTRODUCTION Dufferin Construction Company, a division of Holcim Canada Limited (Dufferin) has been operating a hot mix asphalt (HMA) plant located at 731 Third Line in Oakville, Ontario (the Facility) for the past 30 years. Dufferin is a local provider of asphalt and construction services, that has helped improve local infrastructure within the Town of Oakville. In 2011, the company completed the widening of the QEW through Oakville which included the construction of high-occupancy vehicle (HOV) lanes to help alleviate traffic and gridlock. A detailed summary of Dufferin’s commitment to the Oakville community is provided in Appendix A.
The Facility is currently permitted to operate under site-wide Environmental Compliance Approval (ECA) (formerly referred to as Certificate of Approval) 5859-798SLP dated December 31, 2007. Under the Town of Oakville (the Town) Health Protection Air Quality By-Law (HPAQB), the facility is considered a major emitter of Fine Particulate Matter (FPM), as the Facility directly emits more than 300 kilograms per year of this substance.
As a major emitter, the HPAQB requires an application be filed no later than September 1, 2012. Dufferin requested an extension from the Town on this matter. This request was made to Mr. Jeffrey Lee, Research Policy Analyst - Air, Town of Oakville on August 24, 2012 in an email. This report (the Application) provides all of the required documentation required under Section 6 of the bylaw and was prepared following the Town’s document “Guidance for Implementation of Oakville Health Protection Air Quality By-Law 2010-035, Section 5 and 6 and Approval Requirements for Major Emitters v.5 June 2011” (GIOHPAQB).
On June 22, 2012, representatives from Dufferin and Golder Associates Ltd (Golder) met with the Town for a preliminary consultation meeting. During this meeting it was confirmed the Facility is required to submit a permit for FPM. During this meeting general approaches to the Application were discussed. The Town did not provide any specific guidance as to the suggested approaches, however, emphasized the need to provide detailed rationale for the final project approach used in the Application and to follow GIOHPAQB. Subsequent communication occurred to clarify the approaches used in this application.

BRONTE ASPHALT PLANT HPAQB APPLICATION FOR APPROVAL
April 2013 Report No. 12-1151-0213 2
2.0 FACILITY DESCRIPTION 2.1 Facility Overview At the Facility, the primary operation is the production of HMA. In this process, aggregate materials are heated and combined with asphalt cement to produce HMA for asphalt paving operations. The maximum production capacity of the plant is 300,000 tonnes per year of HMA. The North American Industry Classification System (NAICS) code that applies to this operation at the Facility is 324121 - Asphalt Paving Mixture & Block Manufacturing. The Facility is currently permitted to operate under site-wide ECA 5859-798SLP dated December 31, 2007. A copy of the ECA is provided in Appendix B.
At the Facility, two other distinct operations are conducted, including:
Mobile equipment repair shop to service construction equipment that is used during road construction operations (NAICS 81111), and;
Quality Assurance Laboratory for testing materials from off-site construction jobs (NAICS 541380)
The Facility stores waste concrete and recycled asphalt pavement (RAP) from construction projects, which is further used for recycling activities. This material is crushed at a portable crushing plant. The recycled concrete is delivered off-site to customers. The RAP is used on-site in the batch plant. The recycled concrete and asphalt crushing operations are carried out by 3rd party contractors. Dufferin does not own or operate this equipment, however, emissions estimates for this activity have been included as part of this Application. The production rate of the crushing operations can vary from 50 tonnes per hour up to 200 tonnes per hour, depending on the equipment brought on-site by the contractor.
Over the past 10 years, Dufferin has continually invested in reducing emissions from the site through the implementation of Best Management Practices (BMPs) for fugitive dust management, as well as equipment upgrades, including:
Installation of low NOx burner on dryer;
Paving of all unpaved roads on-site;
Installation of silencer on baghouse; and
Installation of new coater asphalt coater system.
BRONTE ASPHALT PLANT HPAQB APPLICATION FOR APPROVAL
April 2013 Report No. 12-1151-0213 3
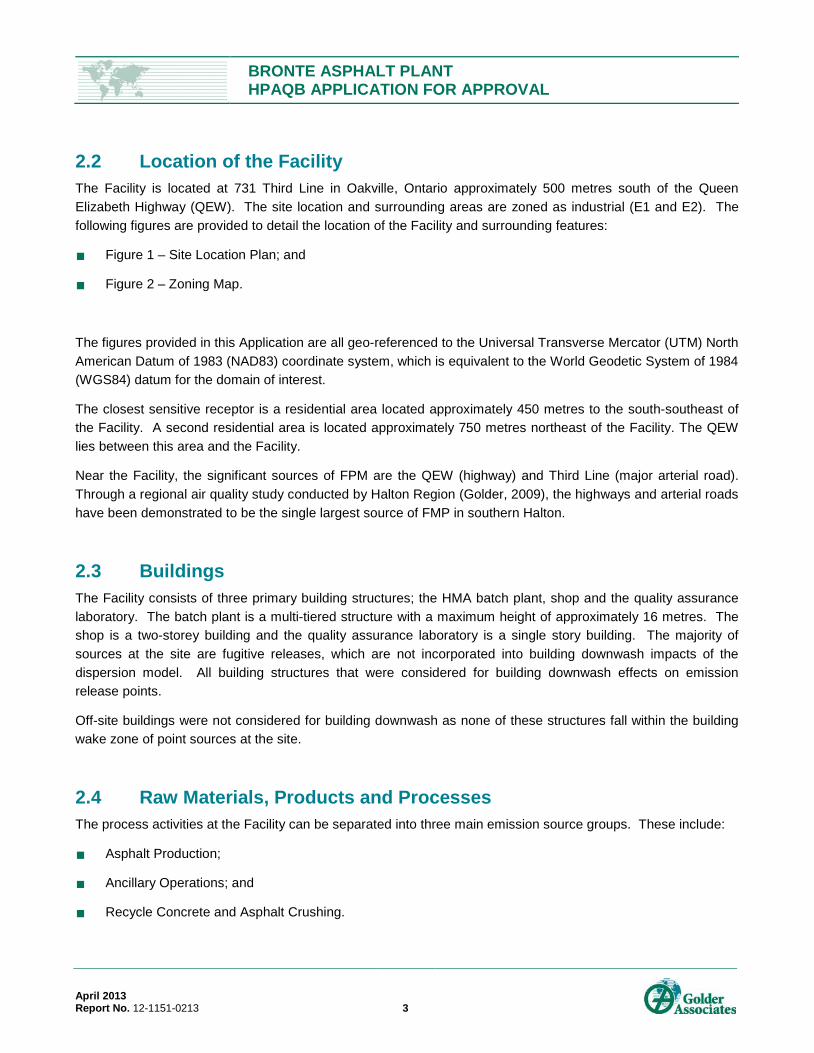
2.2 Location of the Facility The Facility is located at 731 Third Line in Oakville, Ontario approximately 500 metres south of the Queen Elizabeth Highway (QEW). The site location and surrounding areas are zoned as industrial (E1 and E2). The following figures are provided to detail the location of the Facility and surrounding features:
Figure 1 – Site Location Plan; and
Figure 2 – Zoning Map.
The figures provided in this Application are all geo-referenced to the Universal Transverse Mercator (UTM) North American Datum of 1983 (NAD83) coordinate system, which is equivalent to the World Geodetic System of 1984 (WGS84) datum for the domain of interest.
The closest sensitive receptor is a residential area located approximately 450 metres to the south-southeast of the Facility. A second residential area is located approximately 750 metres northeast of the Facility. The QEW lies between this area and the Facility.
Near the Facility, the significant sources of FPM are the QEW (highway) and Third Line (major arterial road). Through a regional air quality study conducted by Halton Region (Golder, 2009), the highways and arterial roads have been demonstrated to be the single largest source of FMP in southern Halton.
2.3 Buildings The Facility consists of three primary building structures; the HMA batch plant, shop and the quality assurance laboratory. The batch plant is a multi-tiered structure with a maximum height of approximately 16 metres. The shop is a two-storey building and the quality assurance laboratory is a single story building. The majority of sources at the site are fugitive releases, which are not incorporated into building downwash impacts of the dispersion model. All building structures that were considered for building downwash effects on emission release points.
Off-site buildings were not considered for building downwash as none of these structures fall within the building wake zone of point sources at the site.
2.4 Raw Materials, Products and Processes The process activities at the Facility can be separated into three main emission source groups. These include:
Asphalt Production;
Ancillary Operations; and
Recycle Concrete and Asphalt Crushing.

BRONTE ASPHALT PLANT HPAQB APPLICATION FOR APPROVAL
April 2013 Report No. 12-1151-0213 4
Asphalt Production Asphalt is manufactured by combining raw aggregate materials with asphalt cement to produce an asphalt cement paving mixture. Raw aggregate materials used in the production process include coarse aggregate and RAP. RAP is old asphalt paving that is removed from road base and recycled back to the new asphalt cement mixture. This process results in a lower quantity of virgin aggregate being used in the mixture. The typical composition of the paving mixture is 75 % aggregates, 20 % RAP and 5 % asphalt cement. At the Facility, this process is carried out in a dryer and tower combination (batch mix plant).
Raw materials (aggregates and RAP) are delivered to the site by truck and stored in outdoor storage piles. From the storage piles, the raw materials are transferred to feed hoppers using a front-end loader. Materials are then transferred from the feed hopper to the dryers. In the dryer, moisture is removed from the aggregate and heating takes place. A bucket elevator transfers the hot aggregate to the mixing tower. Emissions from the dryer are ducted and controlled by a baghouse.
In the tower, the aggregate is stored in hot storage bins. The aggregate is then dropped into a weigh hopper. From the weigh hopper the aggregate is combined with asphalt cement in a pugmill to produce the finished product (i.e. coater system). The final product is then either stored in a heated storage silo or placed directly into a truck for delivery to customers. Approximately 20% of material is directly shipped to the trucks and 80% goes through the storage silos. All material transfer points of the mixing tower are enclosed and ducted to the baghouse.
The asphalt cement (binder) is stored in above ground heated storage tanks. These tanks are heated using a natural gas heater.
Typical daily and annual flow-through rates of raw material inputs to the process are summarized in Table 1.
Table 1: Daily and Annual Flow-Through Rates of Raw Materials
Raw Material Daily Average Flow-Through Rate [tonnes/day]
Annual Average Flow-Through Rate [tonnes/year]
Aggregate and Sand 495 136,245 RAP 132 36,332 Asphalt Cement (binder) 33 9,083
Ancillary Operations The on-site garage area is used for general site maintenance activities and minor repairs to construction equipment. Emission sources include parts washers and welding activities. For parts washers, dirty parts are cleaned manually by spraying solvent onto the parts in a sink like work area and excess solvent drains into an enclosed container through a small drain. The solvent drains into a remove reservoir (drum). The cover is closed whenever parts are not being handled in the cleaner. There is a separate welding shop in the garage building.
Other activities that occur at the site include general comfort heating, and ventilation for the offices. All combustion equipment at the site is natural gas fired, with the exception of one (1) heater located in the wash bay, which is No.2 fuel oil fired.

BRONTE ASPHALT PLANT HPAQB APPLICATION FOR APPROVAL
April 2013 Report No. 12-1151-0213 5
Recycled Concrete and RAP Crushing Waste concrete and RAP from construction projects is delivered to the Facility for recycling activities. This material is crushed at the portable crushing plant and delivered to off-site customers or used in the process of asphalt production. The recycled concrete and asphalt crushing operations are carried out by 3rd party contractors. Dufferin does not own or operate this equipment, however, emissions estimates for this activity have been included as part of this Application. The production rate of the crushing operations can vary from 50 tonnes per hour up to 200 tonnes per hour, depending on the equipment brought in by the contractor. Crushing equipment is powered by diesel generators.
A simplified process flow diagram is provided in Figure 3.
2.5 Emission Sources Emissions of FPM at the site occur from both ducted source releases and fugitive releases. Ducted process emissions include sources that are vented directly to the atmosphere through a stack. Fugitive emissions are those which result from process and open sources1.
The primary sources of ducted emissions at the Facility are the rotary dryer, hot bins and mixer. All emissions from these sources are ducted to the baghouse prior to discharge to the atmosphere. The primary sources of fugitive emissions are raw material transfers (pre-production fugitives) and transfers of final product (production fugitives). A summary of sources of FPM at the Facility are summarized in Table 2.
1 United States Environmental Protection Agency, Office of Air Quality Planning and Standards (February 2004). “Emission Factor
Documentation for AP-42 Section 11.1 Hot Mix Asphalt Plants Final Report”.

BRONTE ASPHALT PLANT HPAQB APPLICATION FOR APPROVAL
April 2013 Report No. 12-1151-0213 6
Table 2: Sources of Fine Particulate Matter
Source Group Activity Individual Sources
Asphalt Production
Material Transfers
Aggregate/RAP truck delivery to storage pile. Transfer from storage pile to feed hoppers. Transfer from feed hoppers to conveyors. Transfer from conveyors dryer.
Batching
Drying. Transfer from dryer to mixing tower. Addition of asphalt cement & mixing in pugmill. Silo Loading/Truck Loading.
Other Fugitive
Drying. Transfer from dryer to mixing tower. Addition of asphalt cement & mixing in pugmill. Silo Loading/Truck Loading.
Ancillary Operations
Comfort Heating Combustion Sources (Boilers/Heaters). Bulk Chemical Storage Asphalt Cement Storage Tanks.
Vehicle Maintenance Maintenance (Parts Washer). Welding.
Quality Assurance Quality Laboratory.
Recycle Concrete and Asphalt Crushing
Material Transfers Used concrete delivery to storage pile. Transfer from storage pile to crusher. Transfer of crushed recycled concrete to truck for off-site delivery.
Crushing Portable Crushing Operations.
Other Fugitive Outdoor Storage Pile. Paved and Unpaved Roads.
The location of all sources at the Facility included in the assessment is provided in Figure 4. A summary of the source parameterization for dispersion modelling is provided in Appendix C.

BRONTE ASPHALT PLANT HPAQB APPLICATION FOR APPROVAL
April 2013 Report No. 12-1151-0213 7
2.6 Emission Totals The summary of the daily and annual average emissions and daily and annual worst-case emissions are summarized in Table 2.
Table 3: Summary of Daily and Annual FPM Emission Rates
Source ID
Operations Area Source Activity
Daily Average Emission
Rate [kg/day]
Annual Average Emission
Rate [kg/year]
Daily Worst Case
Emission Rate [kg/day]
Annual Worst Case Emission
Rate [kg/year]
1 Batch Plant Raw Material Receipt 0.011 2.923 0.018 4.827
Transfers from Piles to
Batch Plant 0.011 2.923 0.018 4.827
HMA - Silo and Load
Out 0.189 52.054 0.313 85.965
HMA- Dryer Screens
Mixer 2.741 753.887 4.527 1245.000
Storage Piles 0.003 0.862 0.003 0.862
Batch Plant Total 2.955 812.649 4.878 1341.48
2 Recycled Crushing Raw Material Receipt 0.001 0.355 0.003 0.709
Recycled Concrete
Crushing Operations 0.013 0.574 0.018 1.148
Recycled Crushing
Generator 0.639 26.181 0.639 38.314
Recycle Crushing
Total 0.653 27.109 0.660 40.170
3 Support Operations Boilers/Heater 0.305 73.671 0.384 92.777
Maintenance Welding 0.009 2.392 0.009 2.392
Support Operations
Total 0.314 76.063 0.393 95.169
All Operations Total 3.922 915.821 5.930 1476.819
A detailed source listing and associated emission rate of FPM is provided in Appendix C.

BRONTE ASPHALT PLANT HPAQB APPLICATION FOR APPROVAL
April 2013 Report No. 12-1151-0213 8
2.7 Negligible Sources Emissions from sources that directly emit less than 1 kg per year of FPM are considered to be negligible in quantity, as outlined in the GIOHPAB. At the Facility, sources that meet the negligibility criteria include:
outdoor storage piles (0.86 kg per year); and
sale of recycled concrete product (0.053 kg per year).
Other negligible sources include:
paved roads – not required under the HPAQB;
unpaved roads – distance travelled on unpaved roads is less than 10,000 km per year;
quality laboratory testing - the QA/QC laboratory is used for quality testing of materials. Emissions of FPM are not expected from this source.
All negligible sources were excluded from the dispersion modelling assessment.
2.8 Average and Maximum Operating Scenarios The Facility typically operates 12 hours per day, 5 days per week. Due to the seasonality of the construction industry, the batch plant operates from April through December. The other operations at the site include equipment maintenance. For recycled concrete and asphalt operations, a third party contractor is brought on site, and can operate a maximum of 60 days per year. These activities typically occur during lower production periods (winter and fall). A summary of the annual operations is provided in Table 4. Details of how these variable emissions were applied to the dispersion model are provided in Appendix C.
Table 4: Annual Operations Summary
Process Area Annual Operating Schedule Annual Average Production Rate
Maximum Annual Production Rate
Asphalt Batch Plant April – December 181,660 tpy 300,000 tpy
Recycle Crushing Operations 3-4 times per year 72,964 tpy 145,927 tpy
Support Operations Year Round combustion sources : 80% of name plate capacity
combustion sources: name plate capacity
The average production rates were based on historic production data provided by Dufferin (Table 5). The variability around this data is also included and is based on the average percent change per year for each product.

BRONTE ASPHALT PLANT HPAQB APPLICATION FOR APPROVAL
April 2013 Report No. 12-1151-0213 9
Table 5: Historical Annual Production and Variability
Annual Production Rate
Variability Process Area 2009 2010 2011 Average
Batch Plant 176,580 169,681 196,562 181,660 < 10%
Recycle Crushing1 8,763 79,065 24,941 72,964 <50%
1 Recycled crushing activities are highly variable. To determine the annual calculation, the 2012 data was also included in the average.
Outlier years (2008 and 2011 were omitted from the calculation.
Although the maximum potential production rate of the plant would derive a theoretical annual production rate of over 1.7 million tonnes, the local market demand and seasonality of construction operations limits the quantity of asphalt to be produced at this Facility. Dufferin estimates a maximum annual rate of 300,000 tonnes per year which is almost twice the average historical production rate at the Facility and is a conservative worst case estimate.
Recycle crushing operations are contracted to a third party contractor. In 2008, crushing activities were low, therefore this value was removed from the average to avoid under-representing the current typical rates. The maximum rate was set to 145,927 tonnes per year. This value is based on the capacity of the crushing equipment and MOE permit limitations, as well as historical production data estimates.

BRONTE ASPHALT PLANT HPAQB APPLICATION FOR APPROVAL
April 2013 Report No. 12-1151-0213 10
3.0 EMISSION CONTROL EQUIPMENT AND PROCEDURES AND EMISSIONS MONITORING
Dufferin has been a long standing member of the Ontario Hot Mix Asphalt Producers Association (OHMPA). As part of this organization, the Facility is committed to follow OHMPA’s Environmental Best Practices Guide, which includes environmental best practices for emissions and maintenance of equipment on site. A copy of this guide is provided in Appendix B.
Dust controls can be categorized into best management practices and physical controls. Table 6 provides a summary of the individual best management practices and technologies considered that are typically used to control fugitive dust sources.
Table 6: List of Typical Control Technologies
Technology
Vehi
cle
Traf
fic
Load
ing/
U
nloa
ding
of
Hau
l Tru
cks
Stor
age
Pile
s - W
ind
Stor
age
Pile
s -
Mai
nten
ance
Stor
age
Pile
s –
Load
ing/
U
nloa
ding
A
ctiv
ities
HM
A
Man
ufac
-tu
ring
Mat
eria
l Tr
ansf
ers
(Dro
p Po
ints
)
Bes
t Mgt
Pra
ctic
es
Speed Limits x Vehicle Restrictions x Storage Pile Configuration x x Storage Pile Heights x x Drop Heights x x x x x
Meteorological Considerations x x x x x x
Routine Maintenance x Truck Sizing (large trucks, fewer hauls) x x
Phys
ical
Con
trol
s
Water Spray x x x x x x
Additives/Suppressants x x x x Partial Process Enclosure x
Windscreens fixed x x x x x
Windscreens - windward side x x x x x
Baghouse Full Enclosure with Baghouse x x x x x
Concrete Blocks x x x Tarps x x x x Road Vacuum Trucks x Road Water Trucks x Paving x Large size material addition to roads x Wheel Wash/Truck Wash Stations x Truck Covers (tarps) x Vegetative Cover x

BRONTE ASPHALT PLANT HPAQB APPLICATION FOR APPROVAL
April 2013 Report No. 12-1151-0213 11
3.1.1 Best Management Practices Plan Dufferin has in place a Best Management Practices Plan (BMPP) to address fugitive dust issues. A BMPP documents the best management practices for the control of fugitive dust emissions from a Facility and documents the decision making process that was used to develop these BMPs.
Fugitive dust emissions can be reduced through BMPs that include physical controls, procedural controls and behavioural controls. Addressing all three of these aspects during the risk assessment phase is essential to identify the root cause of the emission. Many of the best practices cannot be quantified in one specific reduction technique, but will result in overall emissions reductions from the site.
The current Dufferin BMP successfully addresses housekeeping issues at the facility.
3.1.2 Maintenance of Pollution Control Equipment A formal operating and maintenance process for pollution control equipment can prevent problems from occurring and, more importantly, maintain or improve the removal efficiency of the existing pollution control equipment. The baghouse at the Facility undergoes routine maintenance as required by their ECA.
3.1.3 Summary Table 7 summarizes the emission mitigation practices employed at the Facility.
Table 7: Emission Control Practices
Equipment Emission Control Device
Pollution Control Practice Control Efficiency
Batch Plant Dryer, Screens, Mixer Baghouse
A baghouse is used to control FPM from the batching process. This baghouse is operated and maintained under the current ECA
Baghouses have a typical efficiency rating of 95 %-99.99%.
Material Transfer Best Management Practices
Movements of materials onsite follow the Best Management Practices document for the Facility
Emission controls vary depending on BMP employed. A table of typical control efficiencies achieved is summarized in Table 8.
Material Storage Piles Best Management Practices
Movements of materials onsite follow the Best Management Practices document for the Facility
Emission controls vary depending on BMP employed. A table of typical control efficiencies achieved is summarized in Table 8.
Diesel Generator Maintenance
Emission limits on engine specifications and sulphur content of fuel
Tier 2 emission standards are more stringent than Tier 1 standards, 30% lower for NOx, and 50% lower for fine particulate matter.

BRONTE ASPHALT PLANT HPAQB APPLICATION FOR APPROVAL
April 2013 Report No. 12-1151-0213 12
Table 8: Typical Control Efficiencies for Fugitive Dust Management
Control Type Control Efficiency
Water Spray - Point of App. 75% Chemical Additive - Application Point 85% Baghouse Multiple Pickups 95% Baghouse 99.0% Windbreak, Windward Side 75% Wind Breaks 30% 2-3 sided enclosure 90% Enclosure (inside building) 90% Covered Stockpile 100%
Details of individual control technologies applied to each activity/equipment are provided in Appendix C.

BRONTE ASPHALT PLANT HPAQB APPLICATION FOR APPROVAL
April 2013 Report No. 12-1151-0213 13
4.0 IDENTIFICATION AND QUANTIFICATION OF SUBSTANCES RELEASED TO AIR
Table 9 summarizes the total annual emissions of FPM, as this is the only health-risk air pollutants emitted from the Facility above major emission levels.
Table 9: Health-Risk Air Pollutant Total Annual Emissions
Pollutant Annual Emissions [kg]
Average Maximal FPM 763.146 1228.333
4.1 Emission Estimation Methods The basic equation for calculating emissions is:
𝑅 = 𝑆𝐸 ∗ 𝐸 ∗ (1 − 𝐶)
Where:
R = estimated mass emission rate in the specified unit
SE = source extent (e.g. production rate, exposed area, distance travelled)
E = uncontrolled emission factor in the specified particle range (i.e. mass of uncontrolled emission per unit of source extent)
C = fractional efficiency of control
From this formula, it can be seen that changing any of the variables will result in an increase or decrease in emissions. Inherently, reducing the source extent will result in reduction of emissions
The emission calculation approach for each of the sources/source groups at the Facility are summarized in the sections below. Detailed calculations are also provided in Appendix C. This appendix also contains details on the SCC codes for the Facility as well as quality ratings for emission factors used.
4.1.1 Asphalt Production As previously discussed, the primary sources of emissions from the asphalt production process are the dryer, screens, hot bins and mixer. Other fugitive emission sources include silo filling, truck load-out, and fugitive yard emissions. The emission sources in the asphalt plant include:
Dryer, Screens, Hot Bins, Mixer (ducted to baghouse);
Silo Filling; and
Truck Load-out.
For these activities, the emission factors listed in Section 11.1 of US EPA AP-42 were applied to each source, based on the average and maximum production rates.
BRONTE ASPHALT PLANT HPAQB APPLICATION FOR APPROVAL
April 2013 Report No. 12-1151-0213 14
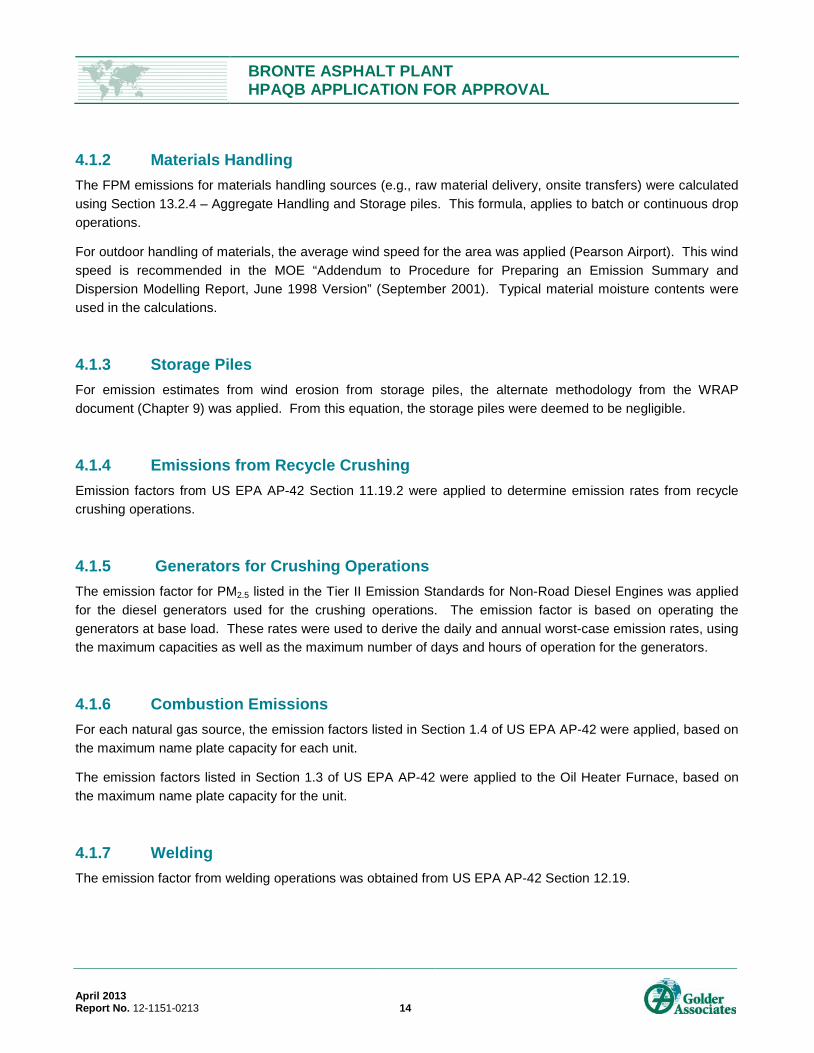
4.1.2 Materials Handling The FPM emissions for materials handling sources (e.g., raw material delivery, onsite transfers) were calculated using Section 13.2.4 – Aggregate Handling and Storage piles. This formula, applies to batch or continuous drop operations.
For outdoor handling of materials, the average wind speed for the area was applied (Pearson Airport). This wind speed is recommended in the MOE “Addendum to Procedure for Preparing an Emission Summary and Dispersion Modelling Report, June 1998 Version” (September 2001). Typical material moisture contents were used in the calculations.
4.1.3 Storage Piles For emission estimates from wind erosion from storage piles, the alternate methodology from the WRAP document (Chapter 9) was applied. From this equation, the storage piles were deemed to be negligible.
4.1.4 Emissions from Recycle Crushing Emission factors from US EPA AP-42 Section 11.19.2 were applied to determine emission rates from recycle crushing operations.
4.1.5 Generators for Crushing Operations The emission factor for PM2.5 listed in the Tier II Emission Standards for Non-Road Diesel Engines was applied for the diesel generators used for the crushing operations. The emission factor is based on operating the generators at base load. These rates were used to derive the daily and annual worst-case emission rates, using the maximum capacities as well as the maximum number of days and hours of operation for the generators.
4.1.6 Combustion Emissions For each natural gas source, the emission factors listed in Section 1.4 of US EPA AP-42 were applied, based on the maximum name plate capacity for each unit.
The emission factors listed in Section 1.3 of US EPA AP-42 were applied to the Oil Heater Furnace, based on the maximum name plate capacity for the unit.
4.1.7 Welding The emission factor from welding operations was obtained from US EPA AP-42 Section 12.19.

BRONTE ASPHALT PLANT HPAQB APPLICATION FOR APPROVAL
April 2013 Report No. 12-1151-0213 15
5.0 EVALUATION 5.1 Modelling Approach and Model Selection Atmospheric dispersion modelling was carried out using an updated version of the CALPUFF model. The CALPUFF model has many advancements including;
The CALPUFF modelling system is made up of three main components:
The CALMET meteorological model that generates hourly wind and temperature fields in a three dimensional gridded modelling domain;
The CALPUFF transport and dispersion model that advects “puffs” of material emitted from sources to calculate hourly concentration/fluxes at receptors of interest; and
CALPOST post processor (used to extract the data of interest from CALPUFF binary output files).
The default model (CALPUFF V5.8) contains an input read error that does not allow the use of PRIME building downwash, which is considered to be more accurate in predicting concentrations within the building wake zone since it takes into account the effect of vertical wind shear and the variation in wind speed deficit with downwind distance. For this reason, a later version (CALPUFF V6.263) was used, where the error was corrected. It is our understanding that the there are no fundamental differences between the models. CALPUFF V6.263 has been applied to urban airshed modelling for the City of Toronto (Reference - Dr. Christopher Morgan and Regional Municipality of Halton (Reference - Mr. Peter Steer).
The following table provides additional information as per S.3.2.1.1 of the Town guidance document.
Table 10: Additional CALPUFF Information
Name of Model Used: CALPUFF V6.263
Technical Issues which warrants use of Model:
Version 5.8 has a bug with respect to using building downwash using Prime input data. Problem Area 1 -- When performing cavity sampling for PRIME downwash, restrict primary source calculations to receptors downwind of primary source and add screen for receptors located far to the side (no impact). Without this restriction, the model may halt with an attempted division by zero. Receptors upwind of the source are processed for cavity impacts starting with Version 5.8, Level 070623. Modified: CAV_SAMP The model stops executing and returns an error message when by running BPIP-Prime with CALPUFF V5.8. The error message generated is provided in Appendix E.
References: MCB-E.txt Website: http://www.src.com/calpuff/calpuff1.htm Source Code: See Appendix F

BRONTE ASPHALT PLANT HPAQB APPLICATION FOR APPROVAL
April 2013 Report No. 12-1151-0213 16
The following models and pre- and post-processors were used in the assessment:
CALPUFF dispersion model (V6.263, level 080827);
CALPOST post processor (V6.223);
BPIP-Prime building downwash pre-processor (V04274); and
CALMET was not required in this assessment as the CALPUFF-ready meteorological data were supplied by the Town.
The Town provides all applicants with identical Town Default Inputs (TDI) data to be used with the CALPUFF model. Golder received the following data from Mr. Jeffrey Lee of the Town in August 2012.
Model domain;
Fine gridded receptors with 100 meter spacing over the Town;
Pre-processed meteorology data using CALMET (2004 to 2008);
Geophysical data;
Terrain data;
Land use data;
Coastline data;
Background concentration data;
Background hourly ozone data
Background monthly ammonia data; and
Background hourly FPM data.
5.2 Model Inputs The CALPUFF model input and output files for the Facility have been provided on compact disc (Appendix D).

BRONTE ASPHALT PLANT HPAQB APPLICATION FOR APPROVAL
April 2013 Report No. 12-1151-0213 17
5.3 Source Parameters For the purposes of the modelling, the sources at the facility were parameterized as area, point or volume sources. Table 11 is a summary of how each major source was parameterized in the model with detailed source characterization provided in Appendix C.
Table 11: Summary of Source Types Used for Dispersion Modelling Process Modelled as a Volume Source Modelled as Point Source
Dryer Stack X HMA Storage Heater X Raw Material Delivery X Raw Material Transfers X Product Sales X Fugitives from Batch Plant X Combustion Sources X Recycle Crushing X
Recommended procedures for source characterization of roads outlined in the National Sand Stone and Gravel Association’s manual “Modeling Fugitive Dust Sources” were also followed (NSSGA, 2004).
Dispersion modelling input parameters are summarized in Table 12, and Table 13.
Table 12: Point Source Dispersion Modelling Input Parameters
Source ID Description x
[UTM] y
[UTM]
Stack Height Above
Grade [m] Elevation
Stack Inner
Diameter [m]
Stack Exit Velocity
[m/s]
Stack Exit Gas
Temp. [°C]
Stack Flow Rate
[m³/s]
DS_01 Asphalt Plant Dryer Stack
603756.5 4808481.4 15.2 99.07 1.20 22.5 418.15 25.5
CS-01 HMA Storage Heater
603721.8 4808504.0 3.3 99.45 0.35 36.1 418.15 3.47

BRONTE ASPHALT PLANT HPAQB APPLICATION FOR APPROVAL
April 2013 Report No. 12-1151-0213 18
Table 13: Volume Source Dispersion Modelling Input Parameters
Source ID Description x y Release Height Elevation Initial
Lateral Initial
Vertical
BP_01 Silo Filling and Loadout 603722.40 4808484.20 16.5 99.20 2.093 7.69
MH_01 Rap Delivery 603682.70 4808483.00 1.5 100.24 0.70 2.74
MH_02A Aggregate and Sand Delivery 603766.80 4808509.40 1.5 98.08 0.70 2.74
MH_02B Aggregate and Sand Delivery 603731.90 4808532.20 1.5 99.20 0.70 2.74
MH_02C Aggregate and Sand Delivery 603782.90 4808485.60 1.5 98.06 0.70 2.74
MH_02d Aggregate and Sand Delivery 603749.40 4808514.60 1.5 99.02 0.70 2.74
MH_02e Aggregate and Sand Delivery 603791.20 4808469.20 1.5 98.58 0.70 2.74
MH_03 Recycled Concrete Delivery 603681.60 4808441.20 1.5 100.73 0.70 2.74
MH_04a BP Feed Hopper 603764.50 4808473.00 5.0 99.0 0.70 2.79
MH_04b BP Feed Hopper 603769.30 4808470.00 5.0 99.0 0.70 2.79
MH_04c BP Feed Hopper 603774.00 4808467.00 5.0 99.0 0.70 2.79
MH_05 RAP Feed Hopper 603710.00 4808505.30 3.8 99.7 0.70 2.33
RC_01 Crushing Plant - Concrete 603658.80 4808415.60 5 101.04 1.64 2.33
RC_03 Crushing Plant - RAP 603658.40 4808480.00 5.0 101.0 1.64 2.33
VS_02 Shop (1) 603620.40 4808422.20 10.7 102.0 6.05 4.98
VS_03 Shop (2) 603589.90 4808429.30 10.7 102.3 6.05 4.98
Due to the variability in emission rates, the variable emission file option was used for the analysis. The details of how each source was entered to the variable emission file are provided in Appendix C.

BRONTE ASPHALT PLANT HPAQB APPLICATION FOR APPROVAL
April 2013 Report No. 12-1151-0213 19
5.3.1 Model Input Options CALPUFF dispersion modelling has been completed using the following input options summarized in Table 14.
Table 14: Model Input Options
Model Input Default Option Used Non-Default Option Used
Meteorological Data Yes - TDI
Receptor Grid Yes - TDI
Land Use Data Yes - TDI
Terrain Data Yes - TDI
Coastline Data Yes - TDI
Background Concentrations Yes - TDI
Ozone not applicable
Ammonia not applicable
FPM Yes - TDI
5.3.2 Non-Default Settings All Town default settings were used in the model analysis.
5.3.3 Coordinate System The UTM coordinate system was used to specify model object sources and buildings. All coordinates were defined in the NAD83 datum. Data supplied by the Town (e.g., receptor grids) were provided in WGS84 datum, which shows no difference compared to NAD83 datum for the domain of interest.
As outlined in the GIOHPAQB, receptors located within the property boundary can be excluded from the analysis. Based on this guidance, the following receptors were excluded:
603.630, 4808.517
603.728, 4808.517
603.603, 4808.392
603.728, 4808.392

BRONTE ASPHALT PLANT HPAQB APPLICATION FOR APPROVAL
April 2013 Report No. 12-1151-0213 20
5.3.4 Meteorology, Land Use and Terrain Data CALMET meteorological data supplied by the Town were used in CALPUFF for this assessment. The CALMET meteorological data set, which takes into account effects such as slope flow and terrain channelling of winds, incorporated geophysical data such as land use and terrain data when it was developed. Due to the low resolution of the Town data set, base elevations for the receptor points, stacks and buildings were determined based on terrain data obtained from the MOE. The MOE provides terrain data in the form of Digital Elevation Model (DEM) files. The DEM files used in this assessment include the following:
0871_1.DEM;
0871_2.DEM;
0872_1.DEM; and
0872_2.DEM.
5.3.5 Receptors Two sets of receptors were used for the modelling. One set corresponded to the CALMET meteorological grid and the other set was a finer resolution set of discrete receptors within the boundaries of Oakville supplied by the Town. As mentioned in Section 3.2.4, the elevations for the discrete receptors were obtained from the higher resolution MOE DEM files.
5.3.6 Building Downwash Building wake effects were considered in this modelling study using the U.S. EPA’s Building Profile Input Program (BPIP-PRIME). The inputs into this pre-processor include the coordinates and heights of the buildings and stacks. The BPIP output is used in the CALPUFF building wake effect calculations. Building locations and heights are provided in Figure 5.
5.3.7 Background and Cumulative Concentrations Hourly background data for FPM were supplied by the Town. The data file contains hourly FPM data based on measurements taken at the MOE monitoring station in northeast Oakville. These hourly background FPM concentrations were added to the hourly facility-induced FPM concentrations to determine the cumulative concentrations.
5.3.8 Chemistry Models The Facility is a major emitter for direct FPM releases only; therefore chemistry was not applied for the purposes of this application.

BRONTE ASPHALT PLANT HPAQB APPLICATION FOR APPROVAL
April 2013 Report No. 12-1151-0213 21
5.3.9 Species Modelled Based on emission levels, the Facility is only required to model facility induced FPM.
5.3.10 Same Structure Contamination There are no sensitive receptors within the property; therefore same structure contamination does not apply.
BRONTE ASPHALT PLANT HPAQB APPLICATION FOR APPROVAL
April 2013 Report No. 12-1151-0213 22
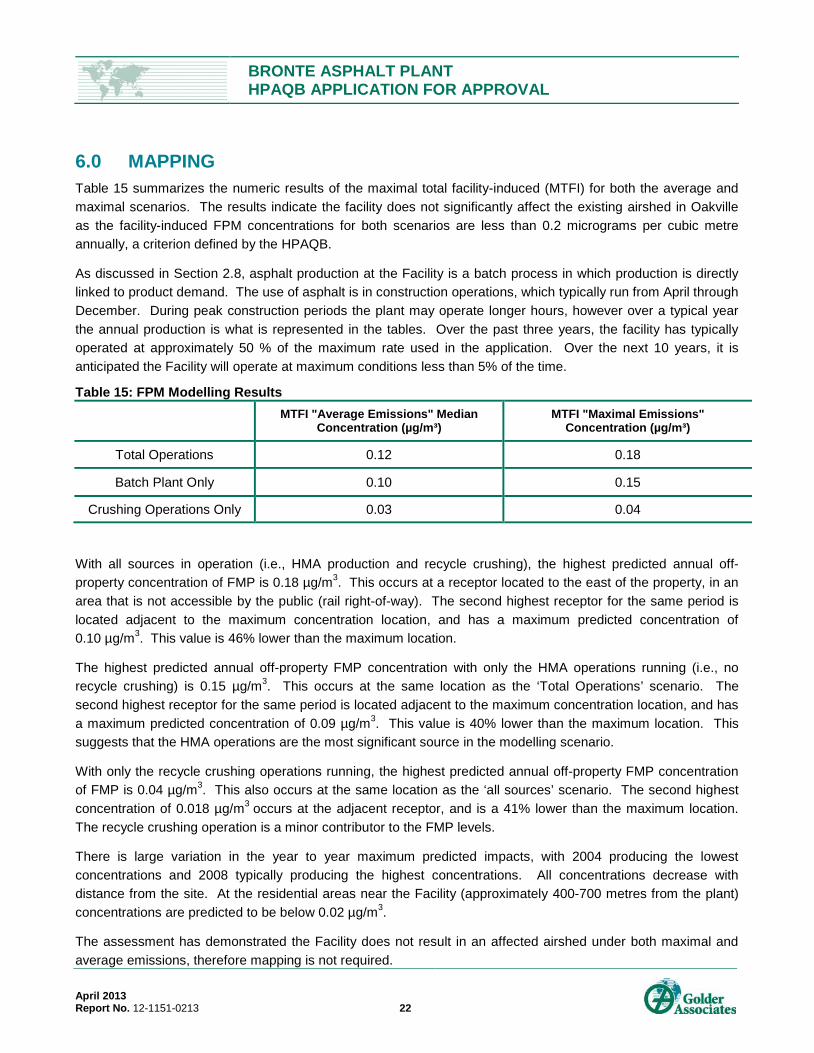
6.0 MAPPING Table 15 summarizes the numeric results of the maximal total facility-induced (MTFI) for both the average and maximal scenarios. The results indicate the facility does not significantly affect the existing airshed in Oakville as the facility-induced FPM concentrations for both scenarios are less than 0.2 micrograms per cubic metre annually, a criterion defined by the HPAQB.
As discussed in Section 2.8, asphalt production at the Facility is a batch process in which production is directly linked to product demand. The use of asphalt is in construction operations, which typically run from April through December. During peak construction periods the plant may operate longer hours, however over a typical year the annual production is what is represented in the tables. Over the past three years, the facility has typically operated at approximately 50 % of the maximum rate used in the application. Over the next 10 years, it is anticipated the Facility will operate at maximum conditions less than 5% of the time.
Table 15: FPM Modelling Results
MTFI "Average Emissions" Median
Concentration (µg/m³) MTFI "Maximal Emissions"
Concentration (µg/m³)
Total Operations 0.12 0.18
Batch Plant Only 0.10 0.15
Crushing Operations Only 0.03 0.04
With all sources in operation (i.e., HMA production and recycle crushing), the highest predicted annual off-property concentration of FMP is 0.18 µg/m3. This occurs at a receptor located to the east of the property, in an area that is not accessible by the public (rail right-of-way). The second highest receptor for the same period is located adjacent to the maximum concentration location, and has a maximum predicted concentration of 0.10 µg/m3. This value is 46% lower than the maximum location.
The highest predicted annual off-property FMP concentration with only the HMA operations running (i.e., no recycle crushing) is 0.15 µg/m3. This occurs at the same location as the ‘Total Operations’ scenario. The second highest receptor for the same period is located adjacent to the maximum concentration location, and has a maximum predicted concentration of 0.09 µg/m3. This value is 40% lower than the maximum location. This suggests that the HMA operations are the most significant source in the modelling scenario.
With only the recycle crushing operations running, the highest predicted annual off-property FMP concentration of FMP is 0.04 µg/m3. This also occurs at the same location as the ‘all sources’ scenario. The second highest concentration of 0.018 µg/m3 occurs at the adjacent receptor, and is a 41% lower than the maximum location. The recycle crushing operation is a minor contributor to the FMP levels.
There is large variation in the year to year maximum predicted impacts, with 2004 producing the lowest concentrations and 2008 typically producing the highest concentrations. All concentrations decrease with distance from the site. At the residential areas near the Facility (approximately 400-700 metres from the plant) concentrations are predicted to be below 0.02 µg/m3.
The assessment has demonstrated the Facility does not result in an affected airshed under both maximal and average emissions, therefore mapping is not required.

BRONTE ASPHALT PLANT HPAQB APPLICATION FOR APPROVAL
April 2013 Report No. 12-1151-0213 23
7.0 CONCLUSION This HPAQB Application for Approval (Application) was prepared to assess the potential health risk of emissions of FPM and its precursors from the Facility. This Application was prepared following the Town’s document “Guidance for Implementation of Oakville Health Protection Air Quality By-Law 2010-035, Section 5 and 6 and Approval Requirements for Major Emitters v.5 June 2011”.
The major sources of FPM at the Facility are associated with the batch mix process. All of these sources were considered in this assessment. To closely reflect how the facility operates, variable emission rates, which were estimated based on U.S. EPA emission factors, were employed for the modelling assessment.
Based on modelling results, the Facility does not significantly affect the existing airshed in Oakville as the facility-induced FPM concentrations are less than 0.2 micrograms per cubic metre annually, a criterion defined by the Oakville Health Protection Air Quality By-Law. As a result, a health risk assessment is not required.

BRONTE ASPHALT PLANT HPAQB APPLICATION FOR APPROVAL
April 2013 Report No. 12-1151-0213
Report Signature Page
GOLDER ASSOCIATES LTD.
Tracy Hodges, B.Sc. (Hons), CCEP Anthony Ciccone, Ph.D., P.Eng. Air Quality Engineer Principal
TMH/AC/ng
Golder, Golder Associates and the GA globe design are trademarks of Golder Associates Corporation.
n:\active\2012\1151\12-1151-0213 dcc - oakville bylay - oakville\report\final\revision 3\12-1151-0213 rpt apr 2013 dcc bronte asphalt plant hpaqb v3.docx

BRONTE ASPHALT PLANT HPAQB APPLICATION FOR APPROVAL
April 2013 Report No. 12-1151-0213
FIGURES

!
!
!
!
!
!
!
!
!
!
!
!
!
!
!
!
!
!
!
!
!
!
!
!
!
!
!
!
!
!
!
!
!
!
!
!
!
!
!
!
!
!
!
!
!
!
!
!
!
Fourteen Mile Creek
LakeOntario
REYNOLDS ST
BURLOAK DR
SPE
ERS
RD
WESTO
AK TRAILS BLVD
KERR ST
E ST
SABEL
ST
REB
ECC
A S
T
REB
ECC
A S
T
WESTDALE
RD
PROUDFOOT
TRAIL
DORVAL DR
TRAFALGAR RD
BRONTE
RD
CALLOW
AY
DR
RAN
DALL
ST
LEES LANE
VALLEYRIDGE
DR
N SERV RD W
UPP
ER M
IDD
LE R
D W
ELMWOOD
RD
MO
NK
S PASS
SEDGEWICK
CR
ES
OXFO
RD AVE
THOMAS ST
ON
TAR
IO ST
TREVOR DR
GLE
N VA
LLEY
RD
BARONWOOD
DR
TENNYSON DR
BON
D S
T
BUR
NE
T S
T
PINECLI
FF RD
BALSAM DR
VILMA DR
MAYFAIR RD
LYONS LANE
MO
NTROSE ABBEY DR
MA
INW
AY
BRONTE RD
WESTO
AK
TRAILS
BLV
D
CH
UR
CH
ST
POSTMASTER DR
SA
ND
PIP
ER
RD
BAYVIEW
RD
NOTTINGHILL GA
TE
WY
ECR
OFT
RD
NAVY ST
YOLANDA DR
SPR
UC
E S
T
4TH LINE
SANDPIPER
RD
3RD LINE
BURTON RD
CU
LHAM
ST
4TH LINE
WE
STO
AK
TRA
ILS
BLVD
SUNSET DR
3RD LINE
HIX
ON
ST
3RD LINE
HIX
ON
ST
FELAN AVE
SA
XO
N R
D
JONES ST
GLEN OAK DR
SOUTHVIEW
RD
LAK
ES
HO
RE
RD
W
STANFIELD
DR
PALM
ER
AV
E
WO
ODALE AVE
WO
OD
HAVE
N
PK DR
MAC
DO
NALD
RD
GALT
AV
E
JOH
N S
T
MO
RDEN RD
ASHBURY RD
QUEEN MARY DR
TRACINA DR
MAPLEH
URST AVE
VALLEY DR
LAK
ESHO
RE R
D W
WINSTON RD
BURLOAK DR
HIX
ON
ST
TRUMAN AVE
MARINE DR
N S
ERV R
D E
WARM
INSTER DR
DU
ND
AS ST
W
4TH LINE
NELSON ST
PIN
EG
RO
VE
RD
OLD BRONTE RD
OAKHAVEN
DR
MA
RIN
E DR
PINEGROVE RD
DORVAL DR
TAN
SLE
Y D
R
STRATUS DR
MA
PLE
AV
E
SANDWELL
DR
WALKER
ST
SINCLAIR RD
ABBEYWOOD
DR
RIDGE LANDNG
WYE
CR
OFT
RD
COLONEL WILLIAM PKY
PIN
E A
VE
WO
ODY R
D
KENT AVE
UPPE
R M
IDD
LE R
D
RIC
HV
IEW
BLV
D
UPPE
R M
IDD
LE R
D W
MAURICE DR3RD LINE
4TH LINE
JOH
N LU
CA
S
DR
DU
ND
AS ST
W
BRID
GE
RD
LAKESHO
RE RD W
3RD LINE
3RD LINE
3RD LIN
E
RANCLIFFE
RD
SPEER
S R
D
RID
GE
DR
LIN
DS
AY
DR
4TH LINE
FOURTH LINE
DORVAL DR
PA
RIS
H
LANE
DORVAL DR
VENETIA DR
RE
G R
D 25
UPPE
R M
IDD
LE R
D W
OLD BRONTE
RD
WY
ECR
OFT
RD
MCPHERSON RD
N SE
RV
RD
W
SPE
ERS
RD
OLD
ABBEY LA
NE
BRAYS
LAN
E
BURTON RD
CX
AVE
CX A
VE
THE LINKS DR
ASHMORE
DR
WYA
ND
OTT
E
DRW
ALBY DR
N
SERV RD
E ST
WINDRUSH DR
VENTURA DR
PILG
RIM
S WAY
PILGRIMS WAY
PIN
E G
LEN
RD
HERITAGE WAY
HERITAGE WAY
SEATON
DRSHERIN DR
OLD COLONY RD
WILLIS DR
RIVER
SIDE DR
BR
IDG
E R
D
BR
IDG
E R
D
FALLING GR
EEN D
R
S SE
RV
RD
W
MILLSTONE DR
CR
ESTMO
NT
DR
PIN
EG
RO
VE
RD
S S
ER
V RD
W
QU
EEN E
LIZA
BETH W
AY
OUTLOOK TERR
N SER
V R
D W
S S
ERV
RD
W
S SE
RV RD
E
S S
ERV
RD
W
599000
599000
600000
600000
601000
601000
602000
602000
603000
603000
604000
604000
605000
605000
606000
606000
607000
607000
4806
000
4806
000
4807
000
4807
000
4808
000
4808
000
4809
00 0
4809
000
4810
000
4810
000
4811
000
4811
000
4812
000
4812
000
G:\P
roje
cts\
2012
\12-
115
1-02
13_B
ront
e_A
spha
lt_P
lant
\GIS
\MX
Ds\
Rep
ortin
g\S
ite_L
ocat
ion.
mxd
³LEGEND
Base Data - MNR NRVIS, obtained 2004, CANMAP v2006.4Produced by Golder Associates Ltd under licence from Ontario Ministry of Natural Resources, © Queens Printer 2008Projection: Transverse Mercator Datum: NAD 83 Coordinate System: UTM Zone 17Imagery: Bing Maps © 2009 Microsoft Corporation and its data suppliers
REV. 0.0
Mississauga, Ontario
DESIGN
SITE LOCATION PLAN
FIGURE: 1
PROJECT NO. 12-1151-0213 SCALE AS SHOWN
PROJECT
TITLE
GIS
REVIEW
KD 20 Jan. 2011
CHECK
BRONTE ASPHALT PLANT
HPAQB APPLICATION
KD 28 Sep. 2012
CM
TH
6 Sep. 2012
28 Sep. 2012
!.
!.
!.
!.
QUEE
N E
LIZA
BETH
WAY
HIGHWAY 401
HIG
HW
AY 4
07
HIGHWAY 8HIG
HWAY 4
03
HIGHWAY 5 W
Guelph
Hamilton
Oakville
Burlington
REFERENCE
INDEX MAP
SCALE
SITE
LakeOntario
1:30,000
500 0 500 1,000 1,500250
METRES
Railways
Watercourse
Water Area, Permanent
Approximate Property Boundary
3 km Buffer from Centre of Site

!
!
!
!
!
!
Fourteen Mile Creek
4TH LIN
E
WELLIN
GTON CRES
REBECCA ST
3RD LIN
E
PLAYTER PL
3RD LIN
E
3RD LIN
E
GILES
GATE
LEES
LANE
WILLIS
DR
TENNYSON DR
SANDBROOK
RD
HIXON ST
FIELDSTONE
CIR
VALE
PL
SEABOURNE D
R
3RD LIN
E
TOWER
DR
SAXON
RD
SEATON DR
BRIDGE RD
BOWMAN DR
WARWICK AVE
GLENRIDGE
DR
HELEN
CRT
TANSLEY DR
WAKEL
Y ST
VALLEY DR
SECORD AVE
PILGRIMS WAY
WARMINSTER DR
WALLACE RD
QUEEN ELIZABETH WAY
WREN AVE
YORK S
T
ABBEYWOOD
DR
SWANN DR
BRIDGE RD
STAFFORD DR
SEAGRAM AVE
HURLEY DR
LANGTRY DR
SELKIRK AVE
STONECLIFFE RD
HILTO
N LANE
WILLOWDOWN RD
KINGS
COLLEGE DR
FIELDCREST
LANE
MAPLEH
URST AVE
QUEEN ELIZABETH WAY
THORNHILL DR
WEIR
AVE
WAVERLY AVE
WESTGATE R
D
PACIFIC
RD
SHELDON AVE
PROGRESS C
RT
SPEERS RD
N SERV RD W
BRAYS LANE
PINEGROVE RD
SHERIN
DR
BRIDLEW
OOD TR
AIL
HERITAGE
WAY
TISDALE
ST
SAVILLE CRES
SCARSDALE C
RES
TAPLO
W CRES
SEABROOK
DR
ADVANCE RD
SANDHURST
DR
TRUDALE
CRT
WEYNWAY CR
T
VYNER
CRES
FAIRMEADOW
TRAIL
SAMFORD P
L
BLACKSMITH LAN
E
GREENRIDGE CIR
WYECROFT RD
SANDMERE PL
SANDMERE PLS
SERV RD W
S SERV RD W
S SERV
RD
W
N SE
RV RD
W
N SERV RD W
STANBURY RD
603000
603000
604000
604000
605000
605000
4808000
4808000
4809000
4809000
G:\Projects\2012\12-1151-0213_Bronte_Asphalt_Plant\GIS\M
XDs\Reporting\Zoning.m
xd
³LEGEND
Base Data - MNR NRVIS, obtained 2004, CANMAP v2006.4
Produced by Golder Associates Ltd under licence from
Ontario Ministry of Natural Resources, © Queens Printer 2008
Projection: Transverse Mercator Datum: NAD 83 Coordinate System: UTM Zone 17
Zoning data obtained from Town of Oakville website.
REV. 0.0
Mississauga, Ontario
DESIGN
LAND USE ZONING DESIGNATION
FIGURE: 2
PROJECT NO. 12-1151-0213 SCALE AS SHOWN
PROJECT
TITLE
GIS
REVIEW
KD 20 Jan. 2011
CHECK
BRONTE ASPHALT PLANT
HPAQB APPLICATION
JR 6 Sep. 2012
CM
TH
6 Sep. 2012
6 Sep. 2012
!.
!.
!.
!.
QUEEN ELIZABETH WAY
HIGHW
AY 401
HIGHWAY 407
HIGHWAY 8HIGHWAY 403
HIGHWAY 5
W
Guelph
Hamilton
Oakville
Burlington
REFERENCE
INDEX MAP
SCALE
SITE
Lake
Ontario
1:10,000
200 0 200 400 600100
METRES
Approximate Property Boundary
Railways
Watercourse
Waterbody
ZONING DEFINITIONS
Residential - Detached Dwellings R02, R3, R03, R5
Residential - Mixed Dwellings R6, R7, R07, R8
Commercial - Local Shopping Centre C1
Commercial - Community Shopping Centre C2
Commercial - Arterial Commercial C3A
Commercial - Service Station Zone C6
Employment - Light Employment E1
Employment - General Employment E2
Employment - Transition Employment T1
Open Space - Public O1
Open Space - Private O2
Open Space - Semi-Public O3
Open Space - Conservation O4
Open Space - Parkway Belt Public Use O5
Public Use - Public Use/Education P/E

SIMPLIFIED PROCESS FLOW DIAGRAMBronte Asphalt PlantOakville, ONTARIO
FIGURE 3
Aggregate/RAP Delivery AC Delivery
Outdoor Storage Asphalt
C t
Feed Hopper
gCement
Mixing Tower
Silos Truck
Truck
Made By: TMH
Checked By: CDKGolder AssociatesDate: September 28, 2012
Project: 12-1151-0213

603600
603600
603700
603700
603800
603800
4808
40 0
4808
400
4808
500
4808
500
G:\P
roje
cts\
2012
\12-
115
1-02
13_B
ront
e_A
spha
lt_P
lant
\GIS
\MX
Ds\
Rep
ortin
g\D
ispe
rsio
n_S
ourc
es.m
xd
³LEGEND
Base Data - MNR NRVIS, obtained 2004, CANMAP v2006.4Produced by Golder Associates Ltd under licence from Ontario Ministry of Natural Resources, © Queens Printer 2008Projection: Transverse Mercator Datum: NAD 83 Coordinate System: UTM Zone 17Imagery: Bing Maps © 2009 Microsoft Corporation and its data suppliers
REV. 0.0
Mississauga, Ontario
DESIGN
DISPERSION SOURCES
FIGURE: 4
PROJECT NO. 12-1151-0213 SCALE AS SHOWN
PROJECT
TITLE
GIS
REVIEW
KD 20 Jan. 2011
CHECK
BRONTE ASPHALT PLANT
HPAQB APPLICATION
KD 14 Dec. 2012
CM
TH
14 Dec. 2012
14 Dec. 2012
!.
!.
!.
!.
QU
EEN ELI
ZABETH
WAY
HIGHWAY 401
HIG
HW
AY 4
07
HIGHWAY 8HIG
HWAY 4
03
HIGHWAY 5 W
Guelph
Hamilton
Oakville
Burlington
REFERENCE
INDEX MAP
SCALE
SITE
LakeOntario
1:1,000
20 0 20 40 6010
METRES
!( Dispersion Sources
Railways
Watercourse
Stockpile

Shop10.7m
FeedHoppers
4.9m
Batch PlantTower19.2m
Tanks5m
BatchPlant7mStorage
Silos15.5m
S S
ER
V R
D W
3RD LINE
603600
603600
603700
603700
603800
603800
4808
40 0
4808
400
4808
500
4808
500
G:\P
roje
cts\
2012
\12-
115
1-02
13_B
ront
e_A
spha
lt_P
lant
\GIS
\MX
Ds\
Rep
ortin
g\B
uild
ing_
Loc
atio
ns.m
xd
³LEGEND
Base Data - MNR NRVIS, obtained 2004, CANMAP v2006.4Produced by Golder Associates Ltd under licence from Ontario Ministry of Natural Resources, © Queens Printer 2008Projection: Transverse Mercator Datum: NAD 83 Coordinate System: UTM Zone 17Imagery: Bing Maps © 2009 Microsoft Corporation and its data suppliers
REV. 0.0
Mississauga, Ontario
DESIGN
BUILDING LOCATIONS
FIGURE: 5
PROJECT NO. 12-1151-0213 SCALE AS SHOWN
PROJECT
TITLE
GIS
REVIEW
KD 20 Jan. 2011
CHECK
BRONTE ASPHALT PLANT
HPAQB APPLICATION
KD 14 Dec. 2012
CM
TH
14 Dec. 2012
14 Dec. 2012
!.
!.
!.
!.
QU
EEN ELI
ZABETH
WAY
HIGHWAY 401
HIG
HW
AY 4
07
HIGHWAY 8HIG
HWAY 4
03
HIGHWAY 5 W
Guelph
Hamilton
Oakville
Burlington
REFERENCE
INDEX MAP
SCALE
SITE
LakeOntario
1:1,000
20 0 20 40 6010
METRES
Railways
Watercourse
Building Location with Height

BRONTE ASPHALT PLANT HPAQB APPLICATION FOR APPROVAL
April 2013 Report No. 12-1151-0213
APPENDIX A Dufferin’s History and Commitment to Oakville

Dufferin Construction Company 690 Dorval Drive, Suite 200 Oakville,ON L6K 3W7 Canada
Tel: 905-842-2741 Fax:905-842-2137 www.dufferinconstruction.com
Strength. Performance. Passion. A division of Holcim (Canada) Inc.
Background Dufferin Construction Company, a division of Holcim (Canada) Inc., has been operating in the Town of Oakville for the past 30 years. Currently, we employee 60 full time salaried employees at our head office on Dorval Drive, and an additional 45 employees at our Bronte facility located on 3rd line which includes a repair shop and asphalt plant. Several other Dufferin Construction employees and their families call Oakville home. Dufferin Construction is a local provider of asphalt and construction services, that has helped improve local infrastructure within the Town of Oakville. In 2011, the company completed the widening of the QEW through Oakville which included the construction of high-occupancy vehicle (HOV) lanes to help alleviate traffic and gridlock. Dufferin Construction’s parent company, Holcim Canada also provides construction materials to a variety of infrastructure and construction projects within Oakville. Dufferin Concrete, one of Dufferin Construction’s sister companies, has been pouring concrete at the site of the new Oakville Hospital.
Dufferin Construction Bronte Plant Halton Healthcare ready mix truck at ceremonial concrete pouring at new Oakville
Hospital site Our Commitment to the Community Throughout the year, Holcim Canada and Dufferin Construction contribute to various activities, fundraisers and community initiatives as a means to give back and to help build the communities in which we live, work and play. Initiatives that we have led and/or contributed to in Oakville include: Bronte Plant Open House In May 2011, Dufferin Construction held its first ever open house at the Bronte Plant. We invited our external stakeholders to our site to meet some of our employees and learn about the process of producing asphalt products for road construction. It proved to be a great opportunity to ask questions
Strength. Performance. Passion. A division of Holcim (Canada) Inc. 2/4
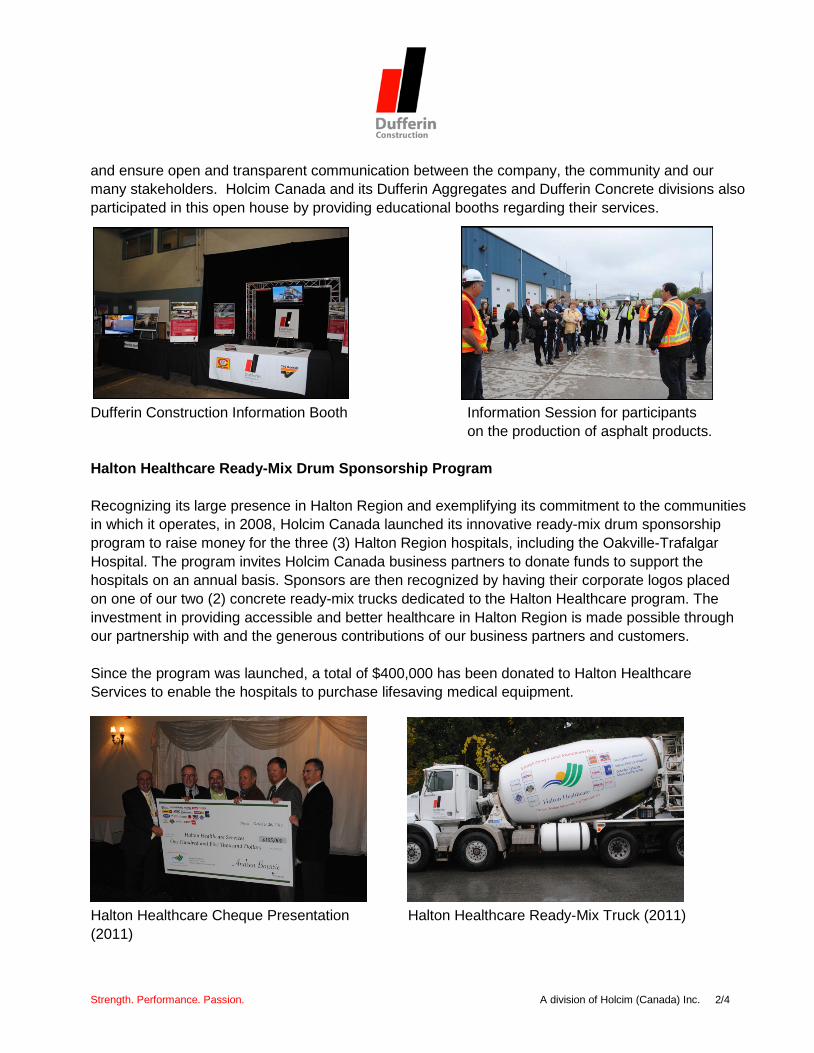
and ensure open and transparent communication between the company, the community and our many stakeholders. Holcim Canada and its Dufferin Aggregates and Dufferin Concrete divisions also participated in this open house by providing educational booths regarding their services.
Dufferin Construction Information Booth Information Session for participants on the production of asphalt products. Halton Healthcare Ready-Mix Drum Sponsorship Program Recognizing its large presence in Halton Region and exemplifying its commitment to the communities in which it operates, in 2008, Holcim Canada launched its innovative ready-mix drum sponsorship program to raise money for the three (3) Halton Region hospitals, including the Oakville-Trafalgar Hospital. The program invites Holcim Canada business partners to donate funds to support the hospitals on an annual basis. Sponsors are then recognized by having their corporate logos placed on one of our two (2) concrete ready-mix trucks dedicated to the Halton Healthcare program. The investment in providing accessible and better healthcare in Halton Region is made possible through our partnership with and the generous contributions of our business partners and customers. Since the program was launched, a total of $400,000 has been donated to Halton Healthcare Services to enable the hospitals to purchase lifesaving medical equipment. Halton Healthcare Cheque Presentation Halton Healthcare Ready-Mix Truck (2011) (2011)

Strength. Performance. Passion. A division of Holcim (Canada) Inc. 3/4
Coronation Park Clean Up – Oakville As part of our ongoing commitment to corporate social responsibility, Dufferin Construction contacted Town of Oakville councilors Cathy Duddeck (Regional Councilor - Ward 2) and Pam Damoff (Town Councilor – Ward 2) to ask for ideas about how the company could help the local community. Coronation Park, the premier waterfront park in Oakville, was identified as an area in need of clean-up and beautification, and suggested as an opportunity for Dufferin Construction to make a contribution. Drawing on internal expertise and resources, the company completed a six (6) hour clean-up of the park on October 18, 2011 in cooperation with Oakville Parks and Recreation staff, and Councilors Damoff and Duddeck. The scope of work involved shoreline clean-up, painting of park benches and the pavilion, and clean-up around the play park area. Over 60 Dufferin Construction personnel volunteered their time for this initiative. Dufferin Construction drew on the resources of sister organization, Dufferin Concrete, which supplied a small quantity of concrete to facilitate the repair of broken concrete in various areas around the park. In the spring of 2012, the company returned to the park and placed asphalt on deteriorated walkways. In addition to the supply and placement of asphalt, Dufferin Construction also coordinated the pouring of concrete slabs for the park benches.
Clean-up day at the park. Dufferin Construction Line and walkway painting. and Town of Oakville staff discussing planned activities. Joshua Valley Park Tree Planting In May 2012, Holcim Canada partnered with the Joshua’s Creek Residents Association and the Town of Oakville to plant 300 white pine and white spruce seedlings at the Joshua Valley Park to help maintain and enhance Oakville’s tree canopy.

Strength. Performance. Passion. A division of Holcim (Canada) Inc. 4/4
Habitat for Humanity – Oakville On October 28, 2010, Holcim Canada staff volunteered at a Habitat for Humanity build event in Oakville. Staff completed a number of varying tasks to help construct the two (2) homes located on Elmwood Road in Oakville. Holcim Volunteers at Oakville Habitat for Humanity Build Oakville Trafalgar Memorial Hospital Classic In 2011 and 2012, Holcim Canada participated in the OTMH Annual Classic. In addition to being a corporate sponsor, individual Holcim team members also raised funds. Team Holcim at the 2011 OTMH Classic

BRONTE ASPHALT PLANT HPAQB APPLICATION FOR APPROVAL
April 2013 Report No. 12-1151-0213
APPENDIX B ECA No. 5859-798SLP, OHMPA Environmental Best Practices Guide


ON
TA
RIO
HO
TM
IXP
RO
DU
CE
RS
AS
SO
CIA
TIO
NE
NV
IRO
NM
EN
TA
LP
RA
CT
ICE
GU
IDE
2010
Page
1of85

ONTARIO HOT MIX PRODUCERS ASSOCIATION ENVIRONMENTAL PRACTICE GUIDE 2010 Page 2 of 85
TABLE OF CONTENTS
SECTION ONE ______________________________________________________________ 4
Introduction ______________________________________________________________________ 4
SECTION TWO ______________________________________________________________ 5
Environmental Regulations Governing Hot Mix Asphalt Production _______________________ 52.1 Air / Noise________________________________________________________________________52.2 Waste____________________________________________________________________________62.3 Water____________________________________________________________________________6
SECTION THREE____________________________________________________________ 8
Hot Mix Asphalt Production Emissions Generated On-Site _______________________________ 83.1 Air Emissions _____________________________________________________________________83.1.1 Particulates _______________________________________________________________________83.1.2 Gaseous Emissions _________________________________________________________________83.1.2.1 Combustion Gases__________________________________________________________________93.1.2.2 Organic Compounds ________________________________________________________________93.1.3 Odour ___________________________________________________________________________93.1.4 Noise ___________________________________________________________________________103.2 Waste___________________________________________________________________________103.3 Water___________________________________________________________________________11
SECTION FOUR ____________________________________________________________ 12
Environmental Best Practices ______________________________________________________ 124.1 Controlling Particulate _____________________________________________________________124.1.1 Open Fugitive Dust Controls_________________________________________________________124.1.1.1 Yard Operations __________________________________________________________________124.1.2 Material Transfer Through the Plant___________________________________________________134.1.3 Ducted Dust Control Systems ________________________________________________________134.1.3.1 Baghouse________________________________________________________________________134.1.3.2 Cyclone/Ductwork/Knockout Box ____________________________________________________154.1.3.3 Rotary Air Locks / Vane Feeders _____________________________________________________164.1.3.4 Tipping Valves ___________________________________________________________________174.2 Controlling Combustion Emissions ___________________________________________________174.2.1 Burner __________________________________________________________________________174.2.2 Air Seals ________________________________________________________________________174.2.3 Exhaust Fans _____________________________________________________________________184.2.4 Damper _________________________________________________________________________184.2.5 Dryer Flights _____________________________________________________________________194.2.6 Primary and Secondary Collectors ____________________________________________________194.2.7 Hot Oil Heater Systems_____________________________________________________________194.2.8 Thermocouples and Pressure Sensors __________________________________________________194.2.9 Trucks and Loaders________________________________________________________________204.3 Controlling Organic Emissions and Odour ______________________________________________204.3.1 Fuel Storage and Fuel Delivery_______________________________________________________204.3.2 Asphalt Cement Discharge and Storage ________________________________________________204.3.3 Anti Stripping Additives ____________________________________________________________214.3.4 Hot Mix Asphalt Mixing and AC Pumping Temperatures __________________________________214.3.5 Discharge Areas __________________________________________________________________224.4 Controlling Noise Emissions_________________________________________________________224.5 Standard Practices for Waste Management______________________________________________234.6 Standard Practices for Water Management ______________________________________________234.6.1 General _________________________________________________________________________23

ONTARIO HOT MIX PRODUCERS ASSOCIATION ENVIRONMENTAL PRACTICE GUIDE 2010 Page 3 of 85
4.6.2 Wet Scrubbers – Centrifugal/Venturi __________________________________________________244.6.3 Settling Ponds ____________________________________________________________________24
SECTION FIVE_____________________________________________________________ 26
Records Keeping and Complaint Response ___________________________________________ 265.1 Records Keeping __________________________________________________________________265.2 Complaint Documentation and Response _______________________________________________26
SECTION 6 ________________________________________________________________ 28
Dust Management Plan and Spills Contingency Plan ___________________________________ 286.1 Dust Management Plan _____________________________________________________________286.2 Spills Preparedness, Response and Reporting____________________________________________29
SECTION 7 ________________________________________________________________ 30
Glossary of Terms, Acronyms and References_________________________________________ 30Terms and Acronyms _________________________________________________________________________30Key References______________________________________________________________________________33
APPENDIX A_______________________________________________________________ 35
Sample Output from ECHO 127 for a Portable Plant___________________________________ 35
APPENDIX B_______________________________________________________________ 49
Sample Output from Echo 127 for a Permanent Drum Mix Plant_________________________ 49
APPENDIX C_______________________________________________________________ 63
Sample Plant Diagrams ___________________________________________________________ 63
APPENDIX D ______________________________________________________________ 66
Sample Weather Record for a 5 day a Week Operation _________________________________ 66
Weather Record__________________________________________________________________ 67
APPENDIX E_______________________________________________________________ 68
Environmental Best Practices Sample Checklists for Plant Operations ____________________ 68Checklist for Plant Yard _______________________________________________________________________69Checklist for Aggregate Delivery/Stockpiling ______________________________________________________70Checklist for Material Transfer _________________________________________________________________71Checklist for Cyclone / Duct Work ______________________________________________________________72Checklist for Baghouse________________________________________________________________________73Checklist for Exhaust Fan______________________________________________________________________74Checklist for Damper _________________________________________________________________________75Checklist for Burner Operation _________________________________________________________________76Checklist for Air Seals: Dryer, Duct Work, and Fugitive Emission Systems_______________________________77Checklist for Fuel Delivery and Storage___________________________________________________________78Checklist for Asphalt Cement Discharge and Storage; and Hot Mix Discharge ____________________________79Checklist for Settling Ponds ____________________________________________________________________80Checklist for Wet Scrubbers____________________________________________________________________81Checklist for Noise Issues _____________________________________________________________________82Checklist for Site Management of Waste __________________________________________________________83
APPENDIX F_______________________________________________________________ 84
Sample Complaint Response Form __________________________________________________ 84Complaint Response Form _____________________________________________________________________85

ONTARIO HOT MIX PRODUCERS ASSOCIATION ENVIRONMENTAL PRACTICE GUIDE 2010 Page 4 of 85
SECTION ONEIntroductionThe Ontario Hot Mix Producers Association (OHMPA) and its member companies arecommitted to operating their hot mix asphalt production facilities in a safe,environmentally responsible manner. This “Hot Mix Plant Environmental PracticesGuide (EPG)” was developed by OHMPA, in consultation with the Ontario Ministry ofEnvironment (MOE). The guide includes sections on sources of air emissions includingconventional contaminants such as particulate and volatile organic compounds (VOCs)as well as odour and noise; best practices to control and minimize air emissions anddocumentation requirements to demonstrate that the best practices are in place and arebeing utilized. The guide also includes sections on site management of waste andwater.
This Guide is intended to assist plant operators in operating and maintaining theirfacilities in a manner that minimizes potential environmental impact. It attempts tooutline a “best available practices” approach to environmental management, but doesnot claim to be all-inclusive or to cover all possible options. Users are advised to seekmanufacturer and/or consultant advice where more extensive process and equipmentcontrols are necessary.
The Guide may be used as a reference for dealing with specific concerns or complaints,and to ensure ongoing environmental responsibility. Information in this Guide isintended to assist hot mix producers by outlining “best practices” within the industry. Itis the individual producer’s responsibility to operate their plant(s) in compliance with theMOE’s Certificate of Approval (Air and Noise) or Certificate of Approval (Water).
Any incident with an environmental impact, must by law, be reported to the MOE.
The 2010 EPG revision has been specifically produced to address more recent issuesincluding ground water protection (Clean Water Act) and storm water management.Further direction on odour control, dust management, spills management and watermanagement have also been included in this most recent edition (4th) of the OHMPAGuide. Since the last EPG revision in 2002 OHMPA has updated its air emissionscalculator (ECHO 127 2007) to incorporate new requirements dictated by MOE and byEnvironment Canada’s National Pollutant Release Inventory (NPRI) including theharmonization of emissions reporting to both agencies through Environment Canada’sOWNERS on line site.
A typical report for an average producer is included as an example in this Guide inAppendix A. It should be noted that in all cases the reporting thresholds in theregulations are not the legal limits for emission generation, but simply a level that MOEand Environment Canada have chosen to begin collecting data.
ONTARIO HOT MIX PRODUCERS ASSOCIATION ENVIRONMENTAL PRACTICE GUIDE 2010 Page 5 of 85
SECTION TWO
Environmental RegulationsGoverning Hot Mix AsphaltProduction
2.1 Air / Noise
Hot mix asphalt production is a highly regulated industry. With respect to air emissions(including noise), facilities must demonstrate compliance with the Ministry of theEnvironment Ontario Regulation 419/05 for Local Air Quality and with the Ministry’sNoise Pollution Control (NPC) Documents in order to obtain a Certificate of Approval(Air & Noise) to operate as well as meeting rigid standards set out in Ontario Regulation349 for Hot Mix Asphalt Facilities. Additional site-specific conditions can also beimposed in the Certificate of Approval (C of A). Facilities must also meet local municipalbylaw requirements.
On an annual basis facilities must determine if they need to report annual air emissions(and in a few cases waste transfers and water discharges) to the federal and provincialgovernments through the National Pollutant Release Inventory (NPRI) Regulation andOntario Regulation 127. Over time Ontario Regulation 127 has been harmonized withEnvironment Canada’s NPRI such that currently only air emissions of acetone areincluded under Ontario Regulation 127. For hot mix asphalt producers only theemissions that exceed the contaminant thresholds set out in the regulations need to bereported.
The annual reporting example for a typical hot mix asphalt production facility provided inAppendix A details less than a handful of substances that approach reporting levels.These substances, however, include Particulate Matter (PM), which includes PM10 andPM2.5. (PM10 means particulate smaller than10 micrometres in diameter and PM2.5means particulate smaller 2.5 micrometres in diameter.)
It must be made clear that the reporting “thresholds” in NPRI and Ontario Regulation127 are not related to the maximum amounts mandated by the federal and provincialgovernments but simply the point where each jurisdiction has decided it is of sufficientinterest to them to begin the collection of data.

ONTARIO HOT MIX PRODUCERS ASSOCIATION ENVIRONMENTAL PRACTICE GUIDE 2010 Page 6 of 85
2.2 Waste
Waste is defined and regulated in Part V of Ontario’s Environmental Protection Act(“EPA”) and in Regulation 347 under the EPA. The EPA defines waste as somethingthat “includes ashes, garbage, refuse, domestic waste, industrial waste, or municipalrefuse and such other materials as are designated in the regulations”. These definitionsand how to apply them may in some cases be unclear. Ontario case law can provide thebest guidance and clarification on the legislated definitions and designations of waste.
Notably, if a material which could be defined as a waste is one that has a reasonablevalue to the owner, and can be sold or has a legitimate use, then the material may notbe subject to the requirement of Part V of the EPA. With that said, it is important for theproducer to be able to demonstrate as well that the material in question does not haveany hazardous environmental impacts associated with it.
If it is waste then to not be subject to waste approval and other waste requirements itmust meet some exemption in Section 3 of O.Reg. 347, such as the exemptions forrecycling activities.
2.3 Water
With respect to water regulations there are four aspects of current legislation that theoperator should be aware of and plan accordingly.
The Clean Water Act regulates water quality and is designed to protect existing andfuture sources of drinking water from activities that are determined to be significantdrinking water threats. In Ontario, area specific Source Protection Plans detailrequirements that have to be complied with and operators are encouraged to sourcethis information. These Plans are being developed by Source Protection Committee’sand should be made available as early as 2010.
The Ontario Water Resources Act (OWRA), specifically Section 53, details obligationsof a landowner with respect to the construction and operation of a “sewage works”. Apermit is required for such an undertaking (Certificate of Approval - Industrial SewageWorks). The Act’s definition of a sewage works is very broad and typical endeavoursthat could trigger a potential permit requirement would be a settlement pond for a wetscrubber, and surface water discharges leaving the site. These permits will carry withthem terms and conditions that the permit holder must comply with.
The OWRA Section 34 details obligations of the landowner to secure a permit (Permit toTake Water – PTTW) for the taking of water from a well or surface water source, if theremoval is greater than 50,000 litres in any given day.

ONTARIO HOT MIX PRODUCERS ASSOCIATION ENVIRONMENTAL PRACTICE GUIDE 2010 Page 7 of 85
Finally the Ontario government is developing new regulations that will impose chargeson industrial water under Ontario Regulation 450/07 – Charges for Industrial andCommercial Water Users. This regulation could also apply to the asphalt industry.
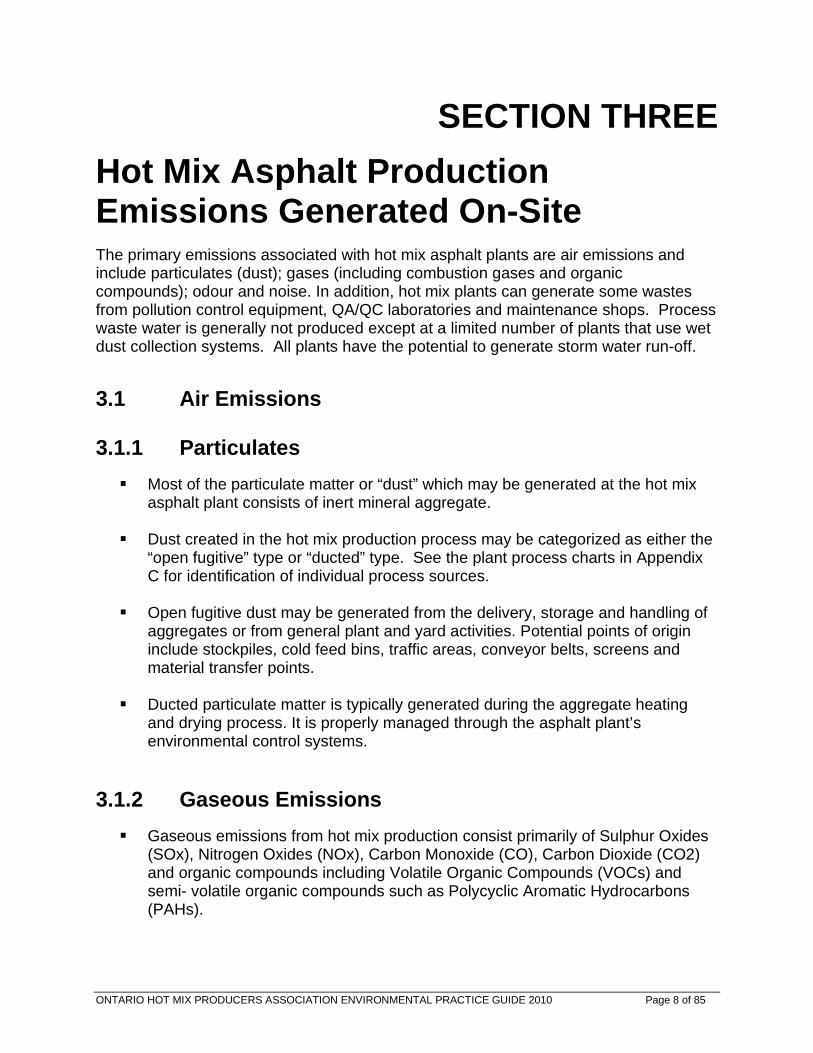
ONTARIO HOT MIX PRODUCERS ASSOCIATION ENVIRONMENTAL PRACTICE GUIDE 2010 Page 8 of 85
SECTION THREE
Hot Mix Asphalt ProductionEmissions Generated On-SiteThe primary emissions associated with hot mix asphalt plants are air emissions andinclude particulates (dust); gases (including combustion gases and organiccompounds); odour and noise. In addition, hot mix plants can generate some wastesfrom pollution control equipment, QA/QC laboratories and maintenance shops. Processwaste water is generally not produced except at a limited number of plants that use wetdust collection systems. All plants have the potential to generate storm water run-off.
3.1 Air Emissions
3.1.1 Particulates
Most of the particulate matter or “dust” which may be generated at the hot mixasphalt plant consists of inert mineral aggregate.
Dust created in the hot mix production process may be categorized as either the“open fugitive” type or “ducted” type. See the plant process charts in AppendixC for identification of individual process sources.
Open fugitive dust may be generated from the delivery, storage and handling ofaggregates or from general plant and yard activities. Potential points of origininclude stockpiles, cold feed bins, traffic areas, conveyor belts, screens andmaterial transfer points.
Ducted particulate matter is typically generated during the aggregate heatingand drying process. It is properly managed through the asphalt plant’senvironmental control systems.
3.1.2 Gaseous Emissions
Gaseous emissions from hot mix production consist primarily of Sulphur Oxides(SOx), Nitrogen Oxides (NOx), Carbon Monoxide (CO), Carbon Dioxide (CO2)and organic compounds including Volatile Organic Compounds (VOCs) andsemi- volatile organic compounds such as Polycyclic Aromatic Hydrocarbons(PAHs).
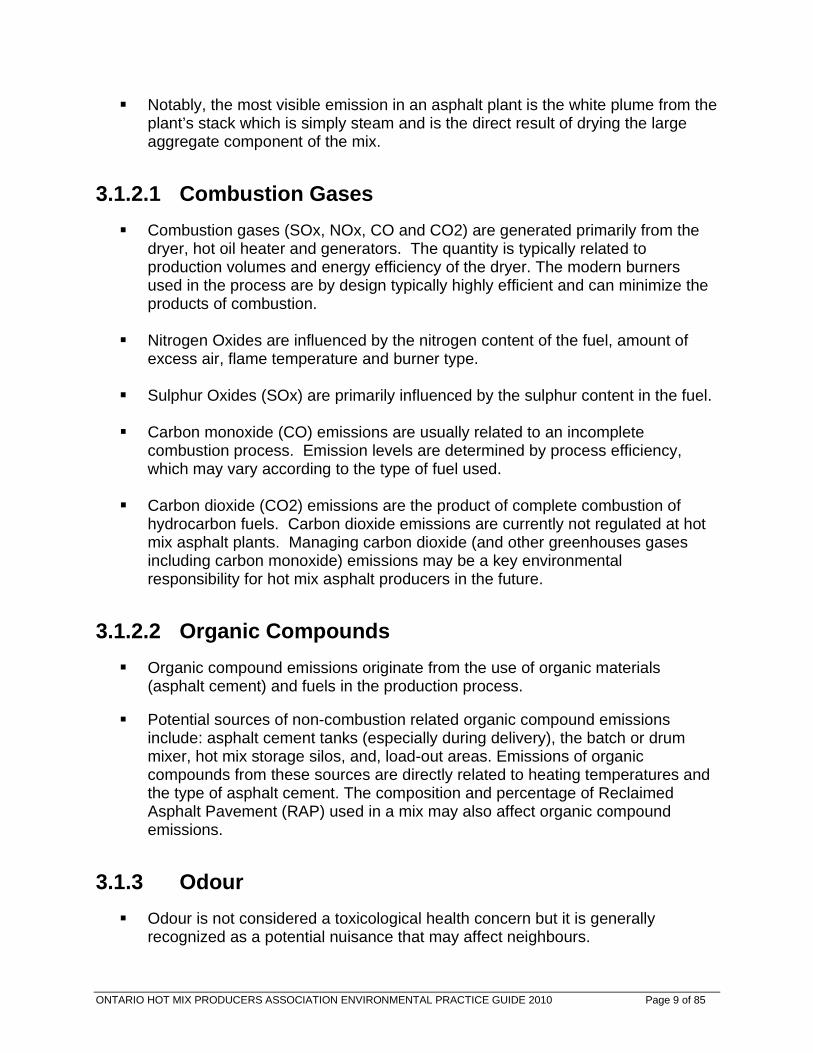
ONTARIO HOT MIX PRODUCERS ASSOCIATION ENVIRONMENTAL PRACTICE GUIDE 2010 Page 9 of 85
Notably, the most visible emission in an asphalt plant is the white plume from theplant’s stack which is simply steam and is the direct result of drying the largeaggregate component of the mix.
3.1.2.1 Combustion Gases
Combustion gases (SOx, NOx, CO and CO2) are generated primarily from thedryer, hot oil heater and generators. The quantity is typically related toproduction volumes and energy efficiency of the dryer. The modern burnersused in the process are by design typically highly efficient and can minimize theproducts of combustion.
Nitrogen Oxides are influenced by the nitrogen content of the fuel, amount ofexcess air, flame temperature and burner type.
Sulphur Oxides (SOx) are primarily influenced by the sulphur content in the fuel.
Carbon monoxide (CO) emissions are usually related to an incompletecombustion process. Emission levels are determined by process efficiency,which may vary according to the type of fuel used.
Carbon dioxide (CO2) emissions are the product of complete combustion ofhydrocarbon fuels. Carbon dioxide emissions are currently not regulated at hotmix asphalt plants. Managing carbon dioxide (and other greenhouses gasesincluding carbon monoxide) emissions may be a key environmentalresponsibility for hot mix asphalt producers in the future.
3.1.2.2 Organic Compounds
Organic compound emissions originate from the use of organic materials(asphalt cement) and fuels in the production process.
Potential sources of non-combustion related organic compound emissionsinclude: asphalt cement tanks (especially during delivery), the batch or drummixer, hot mix storage silos, and, load-out areas. Emissions of organiccompounds from these sources are directly related to heating temperatures andthe type of asphalt cement. The composition and percentage of ReclaimedAsphalt Pavement (RAP) used in a mix may also affect organic compoundemissions.
3.1.3 Odour
Odour is not considered a toxicological health concern but it is generallyrecognized as a potential nuisance that may affect neighbours.

ONTARIO HOT MIX PRODUCERS ASSOCIATION ENVIRONMENTAL PRACTICE GUIDE 2010 Page 10 of 85
A major source of odour in hot mix production is asphalt cement. The degree ofodour is related to the AC grade, its crude oil source and type, sulphur contentand temperature. Points of origin include delivery vehicles, storage tanks andload-out areas.
Other contributing sources of odour emissions may include the use of someaggregate types, special additives such as certain liquid anti-stripping agents orpolymers, and the use of RAP in the mix.
Historically petroleum-based solvents used as cleaners or release agents werea potential source of odours. These have essentially been replaced byenvironmentally friendly low odour products.
3.1.4 Noise
Sources of noise emissions related to the hot mix plant operation originate fromthe burner and burner stack, fans, bucket elector or flat conveyor, drum/dryer,pugmill, pneumatic gates, dust augers, and diesel generators.
Noise may also arise from associated yard activities, primarily related toequipment and vehicle operations including back-up alarms and truck tailgates.
The perception of noise emissions are greatly influenced by the time of day ornight, surrounding ambient noise levels, on and off-site structures, and terrain.
3.2 Waste
The basic component materials for hot mix asphalt production are aggregates(processed virgin and RAP materials) and asphalt cement, and these materialsare supplied in bulk and do not generate packaging wastes.
In some plants surplus filler from a wet scrubber and fines from a baghouse maybe discharged infrequently.
A quality control laboratory may be a source of low volumes of solvents.
Waste oils generated from periodic equipment maintenance (e.g. loaders, gear-boxes, hot oil heaters)
Sources of conventional municipal waste may include the shop and office staffareas. Sanitary waste is generated in the normal day-to-day operation of theplant.
Notably, if a material which could be defined as a waste is one that has a reasonable

ONTARIO HOT MIX PRODUCERS ASSOCIATION ENVIRONMENTAL PRACTICE GUIDE 2010 Page 11 of 85
value to the owner, and can be sold or has a legitimate use, then the material maynot be subject to the requirement of Part V of the EPA. With that said, it is importantfor the producer to be able to demonstrate as well that the material in question doesnot have any hazardous environmental impacts associated with it.
If it is waste then to not be subject to waste approval and other waste requirements itmust meet some exemption in Section 3 of O.Reg. 347, such as the exemptions forrecycling activities.
3.3 Water
With the exception of plants utilizing wet dust collection systems (less than 10%of plants in Ontario), process waste water is not generated. Process wastewater is typically collected in closed-circuit settling ponds.
The only other source of water on-site is from storm water run-off.

ONTARIO HOT MIX PRODUCERS ASSOCIATION ENVIRONMENTAL PRACTICE GUIDE 2010 Page 12 of 85
SECTION FOUR
Environmental Best PracticesThe best practices presented in this section of the Guide outline the suggestedmaintenance and operations procedures to mitigate plant emissions. Implementation ofmany of these environmental best practices can have added benefits of improvedproduction efficiency and product quality.
Sample checklists for various components in the operation of a hot mix plant have beenincluded for reference in Appendix E. These samples are available for use but shouldbe modified by the user to be specific to their site and operations.
4.1 Controlling Particulate
As described in Section 3.1.1, sources of particulate matter may be defined as “openfugitive” or “ducted”. Section 4.1.1 describes environmental best practices for “openfugitive” sources, and Section 4.1.2 describes environmental best practices for “ducted”sources.
4.1.1 Open Fugitive Dust Controls
4.1.1.1 Yard Operations
Dust control methods include:
When conditions dictate (very dry, windy, etc.) all roadways and working areasshould be adequately watered, swept or given an application of a suitable dustsuppressant to minimize the impact of airborne dust being created as the resultof vehicle traffic. Sites should be assessed regularly to determine the need fordust control.
The placement of recycled asphalt products or the paving of roadways andhaulage ways will also reduce the amount of airborne dust created as the resultof vehicle traffic
All stockpile areas should be kept neat and orderly; stockpile heights should bekept to a reasonable minimum in order to reduce wind erosion.
Stockpiles should be located as close as to possible to the cold feed bins inorder to minimize travel distance with front end loaders from stockpiles to bins.

ONTARIO HOT MIX PRODUCERS ASSOCIATION ENVIRONMENTAL PRACTICE GUIDE 2010 Page 13 of 85
Stockpiles should be positioned to take advantage of existing wind screens e.g.on site buildings, tree screens and berms.
The speed of vehicular traffic should be controlled by setting speed limits oninternal roads. Reduced speed limits reduce the amount of airborne dustcreated as the result of vehicle traffic.
All vehicles delivering aggregates to the site should be tarped.
4.1.2 Material Transfer Through the Plant
The height of material drop points at transfer locations should be kept to aminimum and be partially or fully enclosed as required.
Conveyed materials should be effectively protected from wind by the troughconfiguration of the conveyor belt or shielded by a guard from wind erosion.
Where installed, hydrated lime storage silos should be equipped with aventilation filter and a vent valve. (Vent through a coupling to dust collectionsystem.)
The elevator housing and plant tower should be inspected for cracks and holesand repaired as required.
Tight seals should be maintained at connections between elevator and screens.
Rubbing-type seals should be properly fitted to maintain negative pressure at theconnection to the dryer/collection system.
Discharge valves, ducts and seals around dryer intake should be inspected andrepaired or replaced as required.
The number of transfer points in the whole system should be minimized – atdesign or during refit.
4.1.3 Ducted Dust Control Systems
All dust control systems should function in accordance with the prescribedoperator/maintenance manual recommendations and all maintenance recordsshould be maintained.
4.1.3.1 Baghouse
A baghouse is a large airtight structure placed in the exhaust air stream betweenthe cyclone and the exhaust fan. Its sole function is to remove particulate / dust

ONTARIO HOT MIX PRODUCERS ASSOCIATION ENVIRONMENTAL PRACTICE GUIDE 2010 Page 14 of 85
from the aggregate that is entrained in the combustion / process air during theaggregate drying process. This is accomplished by passing the combustion airthrough cloth filter bags or socks contained within the baghouse.
If the baghouse is sized and maintained properly, the collection efficiency forparticles 10 micrometres to 1 micrometres in diameter is greater than 99%.
To maintain proper collection and control efficiencies, the following operatingprocedures should be followed:
o The baghouse should always be pre-heated to dry out any moisture orcondensation prior to starting production.
o Upon completion of production, a low fire setting to dry out the baghouseshould be used.
o While operating, the internal operating temperature / exhaust air enteringthe baghouse should be kept above the dew point (approximately 120o C(250o F) ). This will prevent condensation in the baghouse that couldcause “mudding” of the bags and reduced airflow.
o The high temperature baghouse protection device should be workingproperly.
o For Nomex bags, a high temperature setting of approximately 205o C(400o F) should be used. For any other fabric, talk to your filter bagsupplier for specific operating temperatures.
o All thermocouples should be the rapid response type and should befunctioning properly.
o Pressure-sensing devices should be operating properly, as they sense thepressure drop across the baghouse and activate the cleaning cycle whenthe pressure drop reaches a preset limit.
Note: In general the preference is to have pressure drops closer to the lowerend of the spectrum.
Bags should not be over-cleaned, as this removes the filter cake, which reducesthe filter efficiency of the bags.
Over-cleaning can also have the following negative effects:
o Premature failure of the filter bag.o Addition of unnecessary excess air that the system must handle, reducing
efficiency (reverse air systems only).o Lower baghouse temperature, causing increased fuel usage (reverse air
systems only).

ONTARIO HOT MIX PRODUCERS ASSOCIATION ENVIRONMENTAL PRACTICE GUIDE 2010 Page 15 of 85
The air compressor should be sized to maintain a constant air pressure inaccordance with manufacturer’s specification and should be able to recoverquickly after pulsing.
Air leaks will keep you plant from running at peak efficiency.
All bag access doors on top of the baghouse should be sealed to prevent airinfiltration.
A proper seal between the baghouse and cage should be maintained.
The clean side of baghouse should be inspected from top inspection doors. Anydust present in this area will indicate holes in the bags or poor bag and cageseals. Replace bags or reseal as necessary.
A black light inspection system should be used on the clean side of thebaghouse to inspect for holes or improperly sealed bags that cannot be detectedby the naked eye. Inspection should be completed annually as a minimum.
The cleaning cycle should be adjusted to match production or type of mix beingproduced. General rule:
o increase production = increase cleaning cycleo finer mixes = increase cleaning cycle
Note: If the system is designed to clean based on pressure drop acrossbaghouse, then this will not be required, as it will occur automatically.
Proper alignment of cleaning air jets should be maintained. Improper alignmentcould damage bags.
All rotary air locks and valves should be adjusted and operate properly, asdiscussed in the cyclone / duct work section.
Compressed air used for pulse cleaning should be dry and free of oil residue.Moisture or oil will cause the dust to mud or blind the bags, reducing theefficiency of the baghouse.
4.1.3.2 Cyclone/Ductwork/Knockout Box
A cyclone is a primary particulate collection device that uses centrifugal force toremove particulate/dust from an asphalt plant’s production air stream. If sizedand maintained properly, the cyclone is about 99% efficient at removing 30micron-particulate and larger and about 60% efficient at removing 10 micronparticulate. The knockout box is also a primary collection device that helpscapture large particulates before entering the baghouse and returns them to themix.
ONTARIO HOT MIX PRODUCERS ASSOCIATION ENVIRONMENTAL PRACTICE GUIDE 2010 Page 16 of 85
Proper operation and maintenance of the primary collection equipment willprovide the following benefits:
o Allows re-introduction of the large particulate into the asphalt mix separatefrom the fine particulate, which must be very specifically controlled so asnot to have a detrimental effect on mix quality.
o Prevents premature wear on the bags in the baghouse that would occur ifthe large size particulate were not removed from the air stream.
o Ensures properly sized fine particulates reach the baghouse to form a verydense cake on the bags, which increases their filtering efficiency.
To maintain proper collection and control efficiencies, the following operatingprocedures should be followed:
o All ductwork between the dryer and stack should be inspected so thatholes or air leaks can be repaired.
o The main body of the cyclone should be inspected so that holes in themain shell or liners can be repaired, worn outlet tubes can be replacedand plugged outlets can be unplugged.
o Build-up of fines inside the cyclone or the valves should be prevented.
o Any foreign debris that may become lodged in the cyclone or ductworkshould be removed.
o Exhaust gas volume at rates compatible with the production rate, andwithin the design parameters of the cyclone should be maintained.
o Dust/particulate discharge valves should be operating properly. Valvesmust allow the particulate to be discharged without allowing excess air intothe cyclone. Generally these valves are made up of two types: Rotary AirLocks and Tipping Valves.
4.1.3.3 Rotary Air Locks / Vane Feeders
The tips of the vane should be adjusted to manufacturer’s clearancespecifications to ensure a tight seal and no blowback.
Any build-up or caking on vanes should be removed, as this would reduce thevolume of dust being removed, which could allow re-entrainment of the dust intothe air.
Seals should be checked to maintain proper operation.

ONTARIO HOT MIX PRODUCERS ASSOCIATION ENVIRONMENTAL PRACTICE GUIDE 2010 Page 17 of 85
4.1.3.4 Tipping Valves
These valves can be very sensitive to binding or dragging, therefore,counterweights and seals should be adjusted to allow easy operation of thevalve.
4.2 Controlling Combustion Emissions
Gaseous emissions from the production of hot mix asphalt are primarily a resultof the combustion process used to dry the moisture from aggregate prior tomixing with the asphalt cement.
It is important to maintain the proper air to fuel ratio in the aggregate dryerburner in order to completely burn the fuel provided. Incomplete burning of fuelproduces higher levels of carbon monoxide and hydrocarbons.
It is important that the two vehicles of combustion, the burner and air systemswork in harmony providing the two-fold environmental benefit of saving fuel whileminimizing carbon monoxide and hydrocarbon emissions.
4.2.1 Burner
All burner valves and linkages should be inspected for wear.
Fuel pressure, air-fuel ratios, and combustion air pressure should functionaccording the manufacturer’s specifications.
All moving parts should be lubricated as per the manufacturer’s specifications.
All filter systems and strainers should be regularly maintained.
All nozzles should be clear of foreign materials.
All blowers should be maintained according to manufacturer’s specifications.
Qualified personnel should perform any tune-ups or repairs as necessary. It issuggested that a tune-up be conducted annually to maintain efficiency.
4.2.2 Air Seals
All drum and duct air seal points should be intact and in proper working order.
Leaking air at any point throughout the system directly affects the air to fuel ratio.

ONTARIO HOT MIX PRODUCERS ASSOCIATION ENVIRONMENTAL PRACTICE GUIDE 2010 Page 18 of 85
4.2.3 Exhaust Fans
The exhaust fan is an integral part of the asphalt production process. Its mainfunctions are to:
o Provide air for efficient combustion.
o Remove products of combustion, (i.e. carbon dioxide, carbon monoxideand water vapour (steam) ).
o Remove and carry away moisture dissipated during the drying process ofthe aggregates.
o Proper sizing, operation and maintenance of the exhaust fan promotescomplete combustion and efficient operation of the asphalt plant.
o Correct tension on drive belts should be maintained.
o Fan blades should be checked for wear or dust build-up. This is anindication of holes in the bags or improper seals in the baghouse. Sincethe fan is on the clean side of the baghouse no dust should be present.
o In wet scrubber applications, premature wear of the exhaust fan indicatesineffective or faulty primary dust collector efficiency, such as worn bafflesand caking.
o The fan impeller should be properly balanced.
4.2.4 Damper
The fan damper is probably the most useful piece of equipment for controllingefficiency. The damper is most effective when the plant is running at less thanfull capacity. Proper operation of the exhaust fan damper will provide the correctamount of air for the combustion process.
General rule of thumb is to adjust the damper to the point where it is justpreventing puff back at the burner end of the drum.
A properly maintained and operated damper will provide the following:
o Decreased fuel consumption (less emissions).
o Increased productivity.
o Reduced process air velocity.
o Limit entrainment of fines into the air.

ONTARIO HOT MIX PRODUCERS ASSOCIATION ENVIRONMENTAL PRACTICE GUIDE 2010 Page 19 of 85
o Increased contact time in the drum for air and aggregates (more efficientdrying).
o Reduced abrasion of ductwork and equipment due to lower internal airspeeds, and less particle entrainment.
o Reduced electrical savings, due to decreased load on the fan.
o Reduced load on the generator in a portable plant.
o Reduced pressure across the baghouse, thus extending the life of thebags and increasing efficiency.
4.2.5 Dryer Flights
Dryer flights should be properly maintained to manufacturer’s specifications.Proper veiling of aggregate enables the burner system to work at optimumlevels.
IMPORTANT: Never allow aggregate to veil or pass through the combustionzone of the burner’s flame. This will create incomplete combustion, which willcause increased carbon monoxide and residual hydrocarbon levels.
4.2.6 Primary and Secondary Collectors
Regularly inspect collector systems for material build up that may impede thesmooth flow of air throughout the system.
4.2.7 Hot Oil Heater Systems
Hot oil heater burner systems should be kept clean and functioning according tothe manufacturer’s specifications. Test the hot oil annually within the system tomonitor for and prevent oxidation.
Hot oil heater lines should be in good working order.
4.2.8 Thermocouples and Pressure Sensors
Thermocouples and other sensors throughout the system are in place to monitortemperature and pressure changes within the system. It is important to regularlycalibrate thermocouples and other sensors to keep them functioning at optimumlevels.

ONTARIO HOT MIX PRODUCERS ASSOCIATION ENVIRONMENTAL PRACTICE GUIDE 2010 Page 20 of 85
4.2.9 Trucks and Loaders
Vehicles and equipment not in use should be shut off during idle periods toreduce tailpipe emissions.
Engines and equipment should be properly maintained, serviced and tuned up atregular intervals.
4.3 Controlling Organic Emissions and Odour
This section deals with the management of odours originating from the delivery andstorage of asphalt cement and fuels at the plant. The Best Practices contained hereinoffer assistance to the plant manager to manage and minimize organic emissions andodours. For instance, maintaining the asphalt cement at the proper workingtemperature helps to diminish odour emissions and alleviates a potential nuisance toyour neighbours.
General
Be aware of the effects that prevailing winds have on odour distribution whenconsidering plant location.
Establish a complaint response plan.
Monitor and record weather information daily. Include temperature, humidity,wind direction and speed on a regular basis.
4.3.1 Fuel Storage and Fuel Delivery
Schedule fuel delivery during periods when the neighbours are least affected.
If necessary, install an odour mitigation system on fuel storage tanks.
Keep lids on fuel storage tanks closed.
Establish a spills response plan.
Fuel storage should comply with current Technical Standards and SafetyAuthority requirements.
4.3.2 Asphalt Cement Discharge and Storage
Schedule asphalt cement delivery preferably during periods of least impact toneighbours.

ONTARIO HOT MIX PRODUCERS ASSOCIATION ENVIRONMENTAL PRACTICE GUIDE 2010 Page 21 of 85
Require and check that the asphalt cement supplier maintains proper deliverytemperatures.
Maintain proper asphalt cement storage temperatures.
If necessary, install an odour mitigation system on asphalt cement storage tanks.
Record daily weather and wind information during asphalt cement unloading.
Keep lids on asphalt cement storage tanks closed.
Inspect all asphalt cement lines to keep them secure and in good working order.
Design the load-out area to minimize spillage.
Clean up any spillage immediately as per MSDS.
4.3.3 Anti Stripping Additives
Utilize low odour anti-stripping additives whenever possible.
Anti-stripping additives should be well blended.
Store anti-stripping additives in accordance with manufacturer’srecommendations
4.3.4 Hot Mix Asphalt Mixing and AC PumpingTemperatures
Asphalt cement should not exceed recommended temperatures for pumping,delivery and mixing, as outlined in the following chart. The lower the asphaltcement temperature the lower the emissions.
Plant Mixing Temperature Chart
HMA MIXING TEMP. AC PUMPING TEMP. (Delivery)Performance GradedAsphalt Cement(PGAC)*
Min. Max. Min. Max.
PG 52-34 120oC 150oC 110oC 160oCPG 52-40 120oC 150oC 110oC 160oCPG 58-22 125oC 160oC 115oC 165oCPG 58-28 125oC 160oC 115oC 165oCPG 58-34 125oC 160oC 115oC 165oCPG 64-28 130
oC 165
oC 120
oC 170
oC
PG 64-34 135oC 170
oC 125
oC 170
oC
PG 70-28 135oC 170
oC 125
oC 170
oC
PG 70-34 135oC 170oC 125
oC 170
oC

ONTARIO HOT MIX PRODUCERS ASSOCIATION ENVIRONMENTAL PRACTICE GUIDE 2010 Page 22 of 85
For specialty asphalt cements check with the asphalt cement supplier.
4.3.5 Discharge Areas
Tarp all loads immediately following discharge of load from plant.
Ensure HMA mix temperature at discharge does not exceed the temperaturesindicated in the chart below.
PerformanceGradedAsphaltCement(PGAC)*
HOT MIX ASPHALT TEMPERATURE
AmbientTemp.
35oC 25
oC 15
oC 5
oC -5
oC
PG 52-34 140oC 145
oC 150
oC 155
oC 155
oC
PG 52-40 135oC 140
oC 145
oC 150
oC 150
oC
PG 58-22 145oC 150
oC 155
oC 160
oC 160
oC
PG 58-28 145oC 150
oC 155
oC 160
oC 160
oC
PG 58-34 145oC 150
oC 155
oC 160
oC 160
oC
PG 64-28 155oC 160
oC 165
oC 165
oC 165
oC
PG 64-34 150oC 155
oC 160
oC 165
oC 170
oC
PG 70-28 150oC 155
oC 160
oC 165
oC 170
oC
PG 70-34 150oC 155
oC 160
oC 165
oC 170
oC
Notes:
o For specialty asphalt cements check with the asphalt cement supplier.
o For time to placement exceeding one hour, add 5 oC. For haul timeexceeding two hours, add 10 oC (not to exceed 170 oC maximum).
o
o For very windy conditions at the paver, add 5 oC.
o For special mix types, recommended temperatures may requireadjustments per consultant’s recommendations.
4.4 Controlling Noise Emissions
The following steps can be taken to minimize noise:
o Aggregate stockpiles should be located strategically to act as a buffer tonoise.
o Landscaping and berms should be employed around the plant to reducenoise levels.

ONTARIO HOT MIX PRODUCERS ASSOCIATION ENVIRONMENTAL PRACTICE GUIDE 2010 Page 23 of 85
o Acoustical shields, insulated screens, timber walls and berms should beinstalled at strategically placed locations to absorb noise.
o Specialized acoustical abatement methods should be used on high noisesources, i.e., burners, fans.
o Rules should be enforced to restrict excessive braking, engine revving,horn blowing and tailgate slamming in the plant yard.
o A complaint response procedure should be established to deal with noiseissues immediately.
o Appropriate back-up alarms should be considered.
4.5 Standard Practices for Waste Management
Hot mix asphalt plant operations are traditionally low volume generators ofexcess materials that could be classified as waste as defined by the MOE andwhich would be subject to Part V of the EPA. Basic common sense sitemanagement practices should therefore be followed to deal with the handlingand disposal of any waste that is generated. Recycling options should beexercised whenever possible.
Laboratory solvents, waste oils and lubricants should be collected and disposedof off-site in conformance with MOE Regulations.
Conventional municipal waste is subject to individual municipal requirements forhandling and disposal. Wherever possible all municipal recycling practicesshould be used.
Sanitary waste handling and disposal should comply with local municipalrequirements.
4.6 Standard Practices for Water Management
4.6.1 General
Clean storm water from lawns, parking lots, roads and natural areas is typicallyreleased into ditches, swales and other normal drainage ways. Processingplants should be enclosed to prevent storm water contact.
Materials used in the asphalt process should be contained and controlled whereappropriate to prevent contaminant release:
o Aggregates (sand and stone) are natural earth materials that cangenerally be safely stored in outdoor stockpiles.

ONTARIO HOT MIX PRODUCERS ASSOCIATION ENVIRONMENTAL PRACTICE GUIDE 2010 Page 24 of 85
o Fuels and lubricants should be delivered, stored and used in accordancewith the requirements of the Technical Standards & Safety Act.
o Asphalt cement cools rapidly and turns solid at ambient temperatures; itwill not penetrate into the ground.
o Recycled concrete and asphalt stockpiles are not significant sources ofcontamination. These same materials are used everywhere for publicinfrastructure, including drinking water transmission and storage. OHMPAhas confirmed this through recent leach testing of recycled concrete andasphalt (DBA Engineering, August 31, 2007).
o Biodegradable products should be used for truck box cleaning, replacingdiesel fuel.
4.6.2 Wet Scrubbers – Centrifugal/Venturi
Wet Scrubbers are operated in conjunction with settling ponds, and can bedivided into the following two types: Low Energy Centrifugal Scrubbers and HighEnergy Venturi Scrubbers.
Wet scrubbers should be sized correctly and operated according tomanufacturers’ specifications.
Standard practices for plants having a wet scrubber include:
o Water should be recycled using contained settling ponds.
o The quantities of “make-up” water required to top up the water supply isnormally less than 50,000 litres/day and does not require a Permit to TakeWater.
o The dust settling in the bottom of the ponds may be re-used in theprocessing plant, or it may be removed to an approved wastemanagement site.
4.6.3 Settling Ponds
In general, two ponds are used, one for settlement of the particulate and theother for clean water supply to the scrubber.
Ponds should be sized to hold a minimum of one half day’s wet scrubberrequirements. Ponds should be a minimum 1.8m deep but with sufficient surfacearea to promote settling and cooling of the water.

ONTARIO HOT MIX PRODUCERS ASSOCIATION ENVIRONMENTAL PRACTICE GUIDE 2010 Page 25 of 85
When the depth of settled fines reaches approximately one-third of the totalpond depth, the material should be removed.
Maintain the check-dam height to allow only clean water to pass from settlingpond to supply pond.
The supply side pond should be kept clean enough so as not to interfere with thepump, foot valve etc.
Sufficient make up water should be added daily to maintain the pond volume.

ONTARIO HOT MIX PRODUCERS ASSOCIATION ENVIRONMENTAL PRACTICE GUIDE 2010 Page 26 of 85
SECTION FIVE
Records Keeping and ComplaintResponse5.1 Records Keeping
A copy of the plant Certificate(s) of Approval and the supporting documentationthat made up the original application should be kept on site.
The Environmental Practices Guide checklist should be maintained andreviewed in a timely manner by a knowledgeable representative of the company.
The hot mix asphalt producer should maintain a file of up-to-date operating andmaintenance instructions
Records should be kept describing any maintenance, calibration and repairs toequipment.
A wind vane or flag is suggested to monitor wind speed and direction on site. Asa minimum observed weather information should be recorded daily. See weatherrecord form included in Appendix D.
Where continuous temperature recording equipment is not available, recordmixing and load-out temperatures on a daily basis, or with changes in AC grade.
Checklists should be developed, or borrowed from this guide, for regularmaintenance and environmental management inspections. Records of theinspections should be kept, including documentation of all corrective actionstaken. (See Appendix E.)
Note any significant change to plant equipment or operations may affect yourCertificate of Approval (Air).
5.2 Complaint Documentation and Response
The hot mix producer should have in place a response plan to deal with caseswhere complaints are registered directly with the company, through the Ministryof Environment (MOE), or through appropriate municipal government agencies.The complaint response plan should document details such as:
.
o Date and time of the complaint.o Nature of the complaint.o Weather and wind conditions.

ONTARIO HOT MIX PRODUCERS ASSOCIATION ENVIRONMENTAL PRACTICE GUIDE 2010 Page 27 of 85
o Identification of the suspected source of the problem giving rise to thecomplaint.
o Measures taken to correct the problem.o Assessment of the relative success of the measures taken in correcting
the problem.o Record of follow-up on the complaint.
Most Certificates of Approval require that the plant notify the MOE in writing ofan environmental complaint within 2 business days of receiving the complaint.
The “Complaint Response Form”, Appendix F in this guide may be used as amodel for documentation of complaint response.
In the event of a formal complaint, the hot mix producer should use the checklists such as those contained in the appropriate sections of this EnvironmentalPractices Guide to assist in investigating the cause of the complaint.
Note: a plant may wish to keep a “no complaint” record as part of the dailychecklist.

ONTARIO HOT MIX PRODUCERS ASSOCIATION ENVIRONMENTAL PRACTICE GUIDE 2010 Page 28 of 85
SECTION 6
Dust Management Plan and SpillsContingency PlanOHMPA Environmental Practices Guide recommends that each plant have a site-specific Dust Management Plan and Spills Contingency Plan. Examples of such Plansare available through the Association.
The following sections provide general guidance on aspects that should be consideredin these Plans.
6.1 Dust Management Plan
The hot mix producer should have in place a Best Management Practices Planfor the control of fugitive dust emissions (i.e. a Dust Management Plan). ThePlan should include:
Identification of the main sources of fugitive dust emissions specific to each sitesuch as:
o On site traffic.o Paved roads/areas.o Un-paved roads/areas.o Material stockpiles.o Loading/unloading areas and loading/unloading techniques.o Material spills.o Material conveyance systems.o Exposed openings in process and storage buildings; ando General work areas.
The plan should also address the potential causes for high dust emissionsresulting from these sources along with preventative and control measures inplace or under development to minimize the likelihood of high dust emissionsfrom the sources of fugitive dust emissions. Details of the preventative andcontrol measures should include:
o A description of the control equipment (existing or to be installed)o A description of the preventative procedures (implemented or to be
implemented); and/oro The frequency of occurrence of periodic preventative activities, including
material application rates, as applicable
Where the plan is not fully implemented or is in a state of change, animplementation schedule for the Best Management Practices Plan should beprovided, including training of facility personnel.

ONTARIO HOT MIX PRODUCERS ASSOCIATION ENVIRONMENTAL PRACTICE GUIDE 2010 Page 29 of 85
The plan should address inspection and maintenance procedures andverification initiatives to ensure effective implementation of the preventative andcontrol measures.
In order to be effective, the Plan must also employ on site and make readilyavailable records that document the implementation of the elements of the planon a periodic basis (daily, weekly, monthly, etc. as required by that portion of theplan). The record keeping requirements for each operation covered by the planshould be listed in the plan for clarity.
Records should be reviewed frequently and the overall Plan should be reviewedannually to confirm that the fugitive dust is being well controlled on site.
6.2 Spills Preparedness, Response and Reporting
The Hot Mix Producer should have a Spills Contingency Plan in place to dealwith cases where liquid materials are released into the environment. Typicalliquid materials at a hot mix plant may include (but may not be limited to) thefollowing:
o Asphalt Cemento Diesel/Furnace Oilo Gasolineo Heat Transfer Oilo Anti-stripping Agentso Asphalt Release Agentso Glycol/Antifreezeo Asphalt Emulsion (Tack Coat)
A Spills Contingency Plan will help a hot mix producer to be prepared for a liquidspill, and will detail appropriate actions, roles and responsibilities in the event ofa liquid spill. The Plan should be reviewed periodically, and training should bedone (and documented) on a regular basis.
The foundation of an effective Plan is built around an overview of the site,potential spill scenarios, and environmental impacts.

ONTARIO HOT MIX PRODUCERS ASSOCIATION ENVIRONMENTAL PRACTICE GUIDE 2010 Page 30 of 85
SECTION 7
Glossary of Terms, Acronyms andReferences
Terms and Acronyms
Actual Cubic Feet Per Minute (ACFM)Volumetric flow rate of a gas or liquid at process or equipment conditions – temperatureand pressure at elevation of equipment. Generally includes moisture volume.
ECHO 127 2007Air Emissions Calculator revised in 2007.
Ambient Air Quality Criteria (AAQC’s)MOE limits for air contaminants released to the atmosphere.
Carbon Dioxide (CO2)A product of complete combustion.
Carbon Monoxide (CO)A gas which occurs in the atmosphere and is a primary product of incompletecombustion. Mobile sources, such as cars, trucks, etc., combined with other sourcesconcentrate the gases, particularly in urban areas.
Combustion ProductsThe gaseous products resulting from the burning of any kind of material containingcarbon and hydrogen, in a free or combined state. These products are primarily carbonoxides, nitrogen oxides, sulphur oxides, and water vapour.
Cubic Feet Per Minute (CFM)Volumetric flow rate of a gas or liquid at operating conditions (temperature andpressure).
EPAOntario’s Environmental Protection Act
FlightsAngled or cup-shaped lengths of metal attached to the interior of the drum for thepurpose of lifting and dropping aggregates through the hot exhaust gas to achievemaximum heat transfer.

ONTARIO HOT MIX PRODUCERS ASSOCIATION ENVIRONMENTAL PRACTICE GUIDE 2010 Page 31 of 85
MSDSMaterial Safety Data Sheets. A MSDS is a document that contains information on thepotential hazards (health, fire, reactivity and environmental) and how to work safely withthe chemical product.
NPRINational Pollutant Release Inventory (NPRI) Regulation annual federal reportingregulation.
Nitrogen Oxides (NOX)An air pollution term applied to a class of nitrogen bearing gases that are a primaryproduct of combustion. The gases are known to be a primary factor in the formation ofsmog and acid rain. Usually expressed as nitrogen dioxide (NO2).
Organic CompoundChemical compounds which contain carbon. Coal and oil based products are rich incarbon.
OWNERSEnvironment Canada’s site which stands for “One Window to National EnvironmentalReporting System” for the purposes of reporting annual emissions to NPRI and O.Reg.127.
Oxygen (O2)Oxygen, in its natural state, the active component of air in combustion chemistry.
Particulate Matter (PM2.5)Particles which have an average diameter of 2.5 microns or less. These arecomponents of dust, smoke, fumes, etc.
Particulate Matter (PM-10)Particles which have an average diameter of 10 microns or less. These arecomponents of dust, smoke, fumes, etc.
Polycyclic Aromatic Hydrocarbons (PAHs) or Polynuclear Aromatics(PNAs)Two air pollution terms used synonymously to describe a class of organic compoundsthat are largely associated with combustion and petroleum-based products.
Reclaimed Asphalt Pavement (RAP)Pavement that has been removed from a roadway or other paved area and is destinedto be used as part of a recycled hot mix asphalt (HMA) pavement.
Stationary SourceAny building, structure, facility, or installation which emits, or has the potential to emitany air pollutant.

ONTARIO HOT MIX PRODUCERS ASSOCIATION ENVIRONMENTAL PRACTICE GUIDE 2010 Page 32 of 85
Sulphur Dioxide (SO2)A product of combustion when sulphur is present in the fuel or aggregates.
Sulphur Oxides (SOX)An air pollution term applied to a class of gases which are made of up sulphur andoxygen in different combinations. It is usually associated with the burning of fuels whichcontain sulphur, i.e. diesel, coal, #6 fuel oil, etc. The “x” is used to denote anycombination of SO2 and SO3, believed to be contributors to acid rain.
Total Hydrocarbons (THCs)An air pollution term often used to describe gases (organic compounds) emitted fromcombustion processes. It is often used synonymously with the term volatile organiccompounds (VOCs) in non-combustion processes.
Total Organic Compounds (TOCs)An air pollution term often used to describe gases (organic compounds) in theemissions from a manufacturing process. It is often used synonymously with the termvolatile organic compounds (VOCs).
Volatile Organic Compounds (VOCs)Sometimes used synonymously with THCs and TOCs. An air pollution term used todescribe gases or vapours which are typically emitted from combustion ormanufacturing processes and also which are known to participate in the chemicalformation of ozone in the presence of sunlight and other gases, e.g. smog. Sincemobile sources such as autos and trucks are a significant source of VOCs, urbancentres are likely to be areas with higher concentrations.

ONTARIO HOT MIX PRODUCERS ASSOCIATION ENVIRONMENTAL PRACTICE GUIDE 2010 Page 33 of 85
Key References
UN 13 (CEMP –ET) “Hot Mix Asphalt Paving Handbook”(Part Two Section 1-7)U.S. Army Corps of Engineerings
IS 52 & 52A(Combined) “The Maintenance and Operation of Exhaust Systems in the Hot
Mix Batch Plant”National Asphalt Pavement Association (NAPA)
QIP 120 “Control of Baghouse Fines”National Asphalt Pavement Association (NAPA)
IS 123 “Recycling Hot Mix Asphalt Pavements”National Asphalt Pavement Association (NAPA)
IS 73 “Fugitive Dust Control and Hot Mix Plants”National Asphalt Pavement Association (NAPA)
IS 101 “Guidelines for the Use of Baghouse Fines”National Asphalt Pavement Association (NAPA)
SR 177 “Determination of Non-Process Fugitive Dust Emissions FromHMA Facility Operations”National Asphalt Pavement Association (NAPA)
IS 86 “Preventing Fires and Explosions in Hot Mix Asphalt Plants”National Asphalt Pavement Association (NAPA)
IS 52 & 52A “The Maintenance and Operation of Exhaust Systems in the HotMix Batch Plant”National Asphalt Pavement Association (NAPA)
SR 166 “Evaluation of Stack Emissions From HMA Facility Operations”National Asphalt Pavement Association (NAPA)
IS 75 “Noise In and Around Asphalt Plants”National Asphalt Pavement Association (NAPA)
IS 122 “Spill Prevention Control and Countermeasures (SPCC) PlanGuidance Manual”National Asphalt Pavement Association (NAPA)
SR 167 “Storm Water Pollution Prevention Plan and Guidance Manual”National Asphalt Pavement Association (NAPA)

ONTARIO HOT MIX PRODUCERS ASSOCIATION ENVIRONMENTAL PRACTICE GUIDE 2010 Page 34 of 85
ASTEC
T 119 Dryer Drum Mixer(J. Don Brock)
T 121 Baghouse Fines(J. Don Brock)
T 126 Productivity(J. Don Brock & John Milstead)
T 128 Emissions(E. Gail Mize)
T 129 Stockpiles(George H. Simmons)
T 132 Aggregate Drying Theory & Practice(Malcolm Swanson & John Preston)
T 133 Heating, Mixing and Storing Modified Asphalt(Jim May & Tom Wilkey)
Websites:
Asphalt Institute: www.asphaltinstitute.org
National Asphalt Paving Association: www.hotmix.org
Astec: www.astecinc.com

ONTARIO HOT MIX PRODUCERS ASSOCIATION ENVIRONMENTAL PRACTICE GUIDE 2010 Page 35 of 85
APPENDIX A
Sample Output from ECHO 127 for aBatch Plant

ONTARIO HOT MIX PRODUCERS ASSOCIATION ENVIRONMENTAL PRACTICE GUIDE 2010 Page 36 of 85
Sample Output from Echo 127 for a Batch Plant

ONTARIO HOT MIX PRODUCERS ASSOCIATION ENVIRONMENTAL PRACTICE GUIDE 2010 Page 37 of 85
Sample Output from Echo 127 for a Batch Plant

ONTARIO HOT MIX PRODUCERS ASSOCIATION ENVIRONMENTAL PRACTICE GUIDE 2010 Page 38 of 85
Sample Output from Echo 127 for a Batch Plant

ONTARIO HOT MIX PRODUCERS ASSOCIATION ENVIRONMENTAL PRACTICE GUIDE 2010 Page 39 of 85
Sample Output from Echo 127 for a Batch Plant

ONTARIO HOT MIX PRODUCERS ASSOCIATION ENVIRONMENTAL PRACTICE GUIDE 2010 Page 40 of 85
Sample Output from Echo 127 for a Batch Plant

ONTARIO HOT MIX PRODUCERS ASSOCIATION ENVIRONMENTAL PRACTICE GUIDE 2010 Page 41 of 85
Sample Output from Echo 127 for a Batch Plant

ONTARIO HOT MIX PRODUCERS ASSOCIATION ENVIRONMENTAL PRACTICE GUIDE 2010 Page 42 of 85
Sample Output from Echo 127 for a Batch Plant
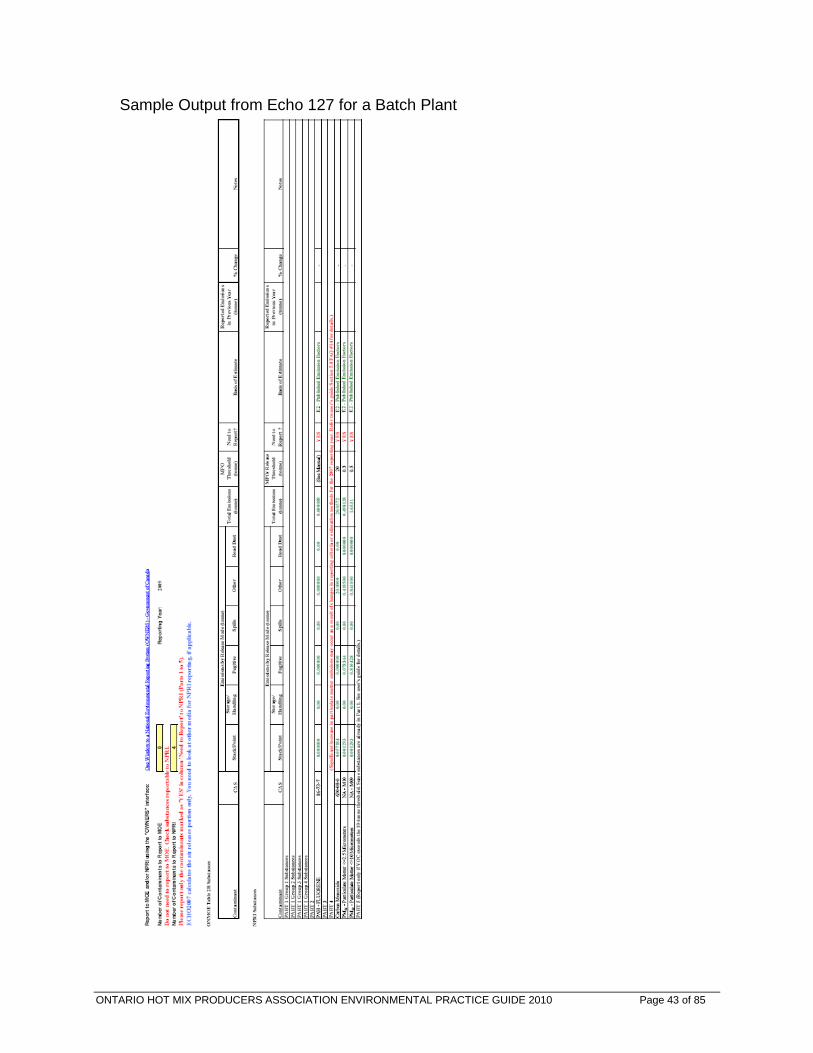
ONTARIO HOT MIX PRODUCERS ASSOCIATION ENVIRONMENTAL PRACTICE GUIDE 2010 Page 43 of 85
Sample Output from Echo 127 for a Batch Plant

ONTARIO HOT MIX PRODUCERS ASSOCIATION ENVIRONMENTAL PRACTICE GUIDE 2010 Page 44 of 85
Sample Output from Echo 127 for a Batch Plant

ONTARIO HOT MIX PRODUCERS ASSOCIATION ENVIRONMENTAL PRACTICE GUIDE 2010 Page 45 of 85
Sample Output from Echo 127 for a Batch Plant

ONTARIO HOT MIX PRODUCERS ASSOCIATION ENVIRONMENTAL PRACTICE GUIDE 2010 Page 46 of 85
Sample Output from Echo 127 for a Batch Plant

ONTARIO HOT MIX PRODUCERS ASSOCIATION ENVIRONMENTAL PRACTICE GUIDE 2010 Page 47 of 85
Sample Output from Echo 127 for a Batch Plant

ONTARIO HOT MIX PRODUCERS ASSOCIATION ENVIRONMENTAL PRACTICE GUIDE 2010 Page 48 of 85
Sample Output from Echo 127 for a Batch Plant

ONTARIO HOT MIX PRODUCERS ASSOCIATION ENVIRONMENTAL PRACTICE GUIDE 2010 Page 49 of 85
APPENDIX B
Sample Output from Echo 127 for aPermanent Drum Mix Plant

ONTARIO HOT MIX PRODUCERS ASSOCIATION ENVIRONMENTAL PRACTICE GUIDE 2010 Page 50 of 85
Sample Output from Echo 127 for a Drum Mix Plant

ONTARIO HOT MIX PRODUCERS ASSOCIATION ENVIRONMENTAL PRACTICE GUIDE 2010 Page 51 of 85
Sample Output from Echo 127 for a Drum Mix Plant
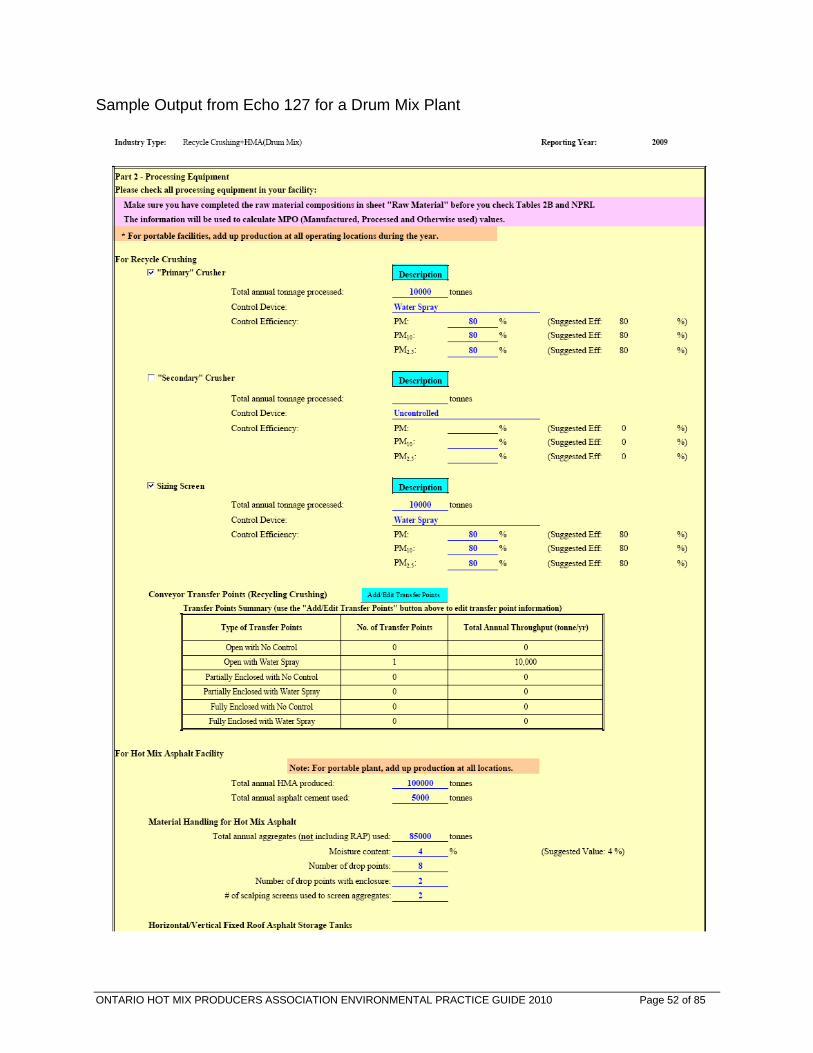
ONTARIO HOT MIX PRODUCERS ASSOCIATION ENVIRONMENTAL PRACTICE GUIDE 2010 Page 52 of 85
Sample Output from Echo 127 for a Drum Mix Plant

ONTARIO HOT MIX PRODUCERS ASSOCIATION ENVIRONMENTAL PRACTICE GUIDE 2010 Page 53 of 85
Sample Output from Echo 127 for a Drum Mix Plant

ONTARIO HOT MIX PRODUCERS ASSOCIATION ENVIRONMENTAL PRACTICE GUIDE 2010 Page 54 of 85
Sample Output from Echo 127 for a Drum Mix Plant

ONTARIO HOT MIX PRODUCERS ASSOCIATION ENVIRONMENTAL PRACTICE GUIDE 2010 Page 55 of 85
Sample Output from Echo 127 for a Drum Mix Plant

ONTARIO HOT MIX PRODUCERS ASSOCIATION ENVIRONMENTAL PRACTICE GUIDE 2010 Page 56 of 85
Sample Output from Echo 127 for a Drum Mix Plant

ONTARIO HOT MIX PRODUCERS ASSOCIATION ENVIRONMENTAL PRACTICE GUIDE 2010 Page 57 of 85
Sample Output from Echo 127 for a Drum Mix Plant

ONTARIO HOT MIX PRODUCERS ASSOCIATION ENVIRONMENTAL PRACTICE GUIDE 2010 Page 58 of 85
Sample Output from Echo 127 for a Drum Mix Plant

ONTARIO HOT MIX PRODUCERS ASSOCIATION ENVIRONMENTAL PRACTICE GUIDE 2010 Page 59 of 85
Sample Output from Echo 127 for a Drum Mix Plant

ONTARIO HOT MIX PRODUCERS ASSOCIATION ENVIRONMENTAL PRACTICE GUIDE 2010 Page 60 of 85
Sample Output from Echo 127 for a Drum Mix Plant
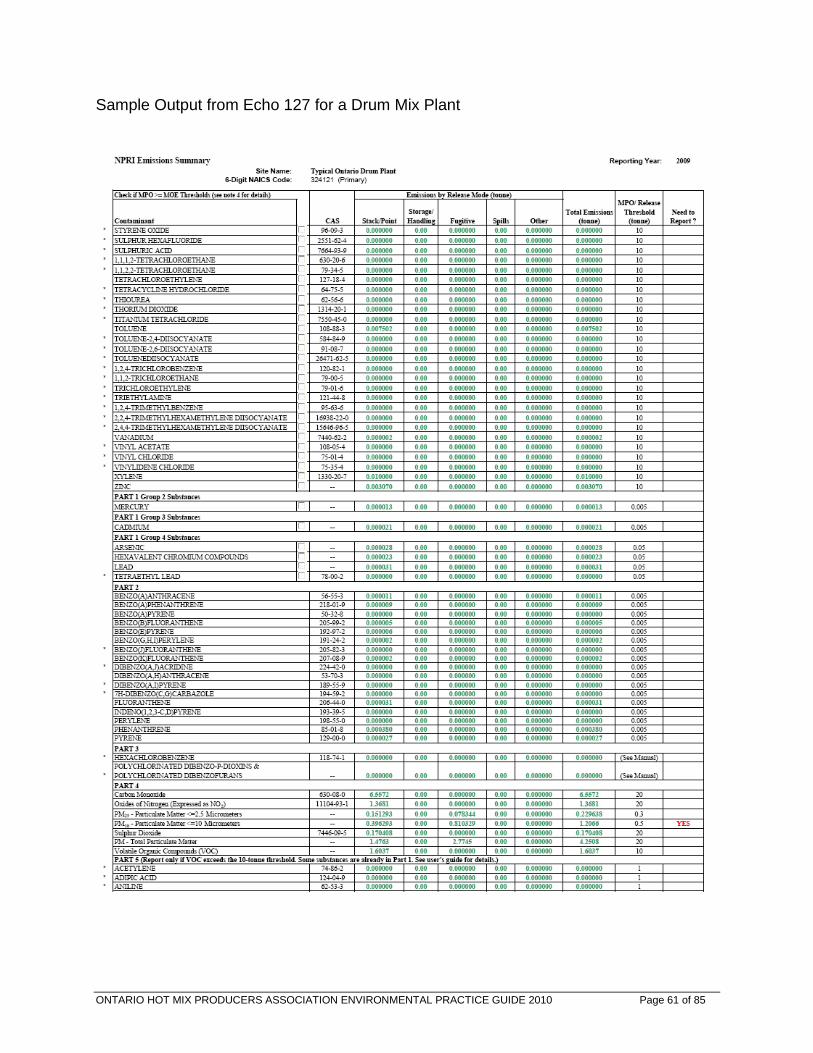
ONTARIO HOT MIX PRODUCERS ASSOCIATION ENVIRONMENTAL PRACTICE GUIDE 2010 Page 61 of 85
Sample Output from Echo 127 for a Drum Mix Plant

ONTARIO HOT MIX PRODUCERS ASSOCIATION ENVIRONMENTAL PRACTICE GUIDE 2010 Page 62 of 85
Sample Output from Echo 127 for a Drum Mix Plant

ONTARIO HOT MIX PRODUCERS ASSOCIATION ENVIRONMENTAL PRACTICE GUIDE 2010 Page 63 of 85
APPENDIX C
Sample Plant Diagrams

ONTARIO HOT MIX PRODUCERS ASSOCIATION ENVIRONMENTAL PRACTICE GUIDE 2010 Page 64 of 85
General Process Flow Diagram for Batch Mix Asphalt Plants

ONTARIO HOT MIX PRODUCERS ASSOCIATION ENVIRONMENTAL PRACTICE GUIDE 2010 Page 65 of 85
General Process Flow Diagram for Drum Mix Asphalt Plants

ONTARIO HOT MIX PRODUCERS ASSOCIATION ENVIRONMENTAL PRACTICE GUIDE 2010 Page 66 of 85
APPENDIX D
Sample Weather Record for a 5 day aWeek Operation

ONTARIO HOT MIX PRODUCERS ASSOCIATION ENVIRONMENTAL PRACTICE GUIDE 2010 Page 67 of 85
Weather Record
Mon. Date: Temp. Hi Lo
Conditions: Sunny Pt. Cloudy Cloudy Overcast
Wind: Still Light Gusting Strong
Direction: Plant Operating Times: Start: End:
Tue. Date: Temp. Hi Lo
Conditions: Sunny Pt. Cloudy Cloudy Overcast
Wind: Still Light Gusting Strong
Direction: Plant Operating Times: Start: End:
Wed. Date: Temp. Hi Lo
Conditions: Sunny Pt. Cloudy Cloudy Overcast
Wind: Still Light Gusting Strong
Direction: Plant Operating Times: Start: End:
Thur. Date: Temp. Hi Lo
Conditions: Sunny Pt. Cloudy Cloudy Overcast
Wind: Still Light Gusting Strong
Direction: Plant Operating Times: Start: End:
Fri. Date: Temp. Hi Lo
Conditions: Sunny Pt. Cloudy Cloudy Overcast
Wind: Still Light Gusting Strong
Direction: Plant Operating Times: Start: End:

ONTARIO HOT MIX PRODUCERS ASSOCIATION ENVIRONMENTAL PRACTICE GUIDE 2010 Page 68 of 85
APPENDIX E
Environmental Best Practices SampleChecklists for Plant Operations

ONTARIO HOT MIX PRODUCERS ASSOCIATION ENVIRONMENTAL PRACTICE GUIDE 2010 Page 69 of 85
Checklist for Plant Yard
Plant yard paved areas maintained clean and dust free. Yes No
Unpaved yard areas treated regularly with water or otherenvironmentally friendly suppressant.
Yes No
Efficiently designed traffic patterns enforced. Yes No
Vehicle speeds in yard enforced to minimize dust generation. Yes No
Comments:

ONTARIO HOT MIX PRODUCERS ASSOCIATION ENVIRONMENTAL PRACTICE GUIDE 2010 Page 70 of 85
Checklist for Aggregate Delivery/Stockpiling
Ensure vehicles delivering aggregates are tarped. Yes No
Fine aggregate piles protected from wind by coarse piles. Yes No
Plant stockpiles located as close as possible to cold feed bins. Yes No
Plant stockpiles covered or treated with water or suitable wettingagent when material is especially dusty or when required by windconditions.
Yes No
Comments:

ONTARIO HOT MIX PRODUCERS ASSOCIATION ENVIRONMENTAL PRACTICE GUIDE 2010 Page 71 of 85
Checklist for Material Transfer
Hydrated lime storage silos ventilation filter and vent valve working. Yes No
Inspect elevator housing and plant tower for cracks and holes. Repairas required.
Yes No
Inspect seal at connections between elevator and screens. Repair orcorrect as needed.
Yes No
Inspect rubbing-type seals at the connection to the dryer/collectionsystem. Repair or correct as needed.
Yes No
Inspect discharge valves, ducts and seals around dryer intake.Repair or replace, as required.
Yes No
(Batch Plants) Purging or draining for change in mix has dustcreation minimized.
Yes No
Comments:

ONTARIO HOT MIX PRODUCERS ASSOCIATION ENVIRONMENTAL PRACTICE GUIDE 2010 Page 72 of 85
Checklist for Cyclone / Duct Work
Are all joints sealed and airtight in the duct work? Yes No
Are any holes present in duct work or cyclone? Yes No
Is there any damage or wear to internal cyclone components?(i.e. outlet tube or liners?)
Yes No
Is any of the duct work thin or worn? Yes No
Are cyclone and all duct work free from dust build-up orcaking?
Yes No
Are all rotary air locks and/or tipping valve adjusted andoperating properly?
Yes No
If you answer No to any item, please provide details below
____________________________________________________________________
____________________________________________________________________
____________________________________________________________________

ONTARIO HOT MIX PRODUCERS ASSOCIATION ENVIRONMENTAL PRACTICE GUIDE 2010 Page 73 of 85
Checklist for Baghouse
Is baghouse preheated before start-up? Yes No
Is baghouse operated above dew point 121o C (250o F)? Yes No
Is the baghouse high temperature protection device operatingproperly?
Yes No
Is the high temperature set point set 50o F below the high operatingtemperature of the filter fabric?
Yes No
Are all plant pressure sensing devices operating properly? Yes No
Are all thermocouples operating properly? Yes No
Are there any leaks in the shell of the baghouse? Or around any doorseals?
Yes No
Is the clean air cycle time set to clean the bags only as, and when,needed?
Yes No
Inspect the baghouse bag:a) Are all bag seals intact?b) Is any dust present in this area?
YesYes
NoNo
Inspect bag with black light inspection system. Are there anyindications of bag failure? Yes No
Are air jets properly aligned in the center of the bag aiming straightdown into the bag?
Yes No
If you answer No to any item, please provide details below.
____________________________________________________________________
____________________________________________________________________
____________________________________________________________________

ONTARIO HOT MIX PRODUCERS ASSOCIATION ENVIRONMENTAL PRACTICE GUIDE 2010 Page 74 of 85
Checklist for Exhaust Fan
Are fan belts adjusted to the proper tension? Yes No
Are sheaves properly aligned and in good repair? Yes No
Is there any dust build-up on the fan impeller or internal fanhousing?
Yes No
Is fan balanced and running smoothly? Yes No
Are there any cracks / holes in the fan impeller (very dangerous -fix immediately).
Yes No
Are there any signs of abrasive wear on the impeller? Yes No
If you answer No to any item, please provide details.
____________________________________________________________________
____________________________________________________________________
____________________________________________________________________

ONTARIO HOT MIX PRODUCERS ASSOCIATION ENVIRONMENTAL PRACTICE GUIDE 2010 Page 75 of 85
Checklist for Damper
Is damper modulating motor functioning properly? Yes No
Are the damper linkages intact and lubricated? Yes No
Are the pressure sensors that actuate the damper functioningproperly?
Yes No
Are the blades of damper showing any signs of abrasive wear? Yes No
If you answer No to any item, please provide details.
____________________________________________________________________
____________________________________________________________________
____________________________________________________________________

ONTARIO HOT MIX PRODUCERS ASSOCIATION ENVIRONMENTAL PRACTICE GUIDE 2010 Page 76 of 85
Checklist for Burner Operation
Check fuel valves for leaks. Yes No
Inspect and ensure linkages are in proper adjustment. Yes No
Lubricate moving parts. Yes No
Check nozzle for foreign materials to ensure proper flow of fuel. Yes No
Are filters and strainers in clean working order as per manufacturer’srecommendations?
Yes No
Are thermocouples couplers functioning properly? Yes No
Comments:

ONTARIO HOT MIX PRODUCERS ASSOCIATION ENVIRONMENTAL PRACTICE GUIDE 2010 Page 77 of 85
Checklist for Air Seals: Dryer, Duct Work, and FugitiveEmission Systems
Are Front and rear drums seals in working order? Yes No
Check and maintain flanges at interconnecting equipment. Yes No
Are all bag house seals in good working order? Yes No
Are seals at access points functioning properly? Yes No
Are joint seals on the fugitive emission system operating asspecified?
Yes No
Are seals at recycling collar and gate functioning as specified? Yes No
Are there signs of wear on the exhaust fan? Yes No
Are fan bearings in good working order? Yes No
Are drive belts in good working order? Yes No
Comments:

ONTARIO HOT MIX PRODUCERS ASSOCIATION ENVIRONMENTAL PRACTICE GUIDE 2010 Page 78 of 85
Checklist for Fuel Delivery and Storage
Has fuel delivery time and weather information been noted? Yes No
Are odour mitigation filters installed and in clean working order? Yes No
Has the supplier provided the requested fuel type? Yes No
Are all fuel lines within the system operating properly? Yes No
Are access points to fuel tanks closed? Yes No
Has the fuel supplier provided clean tanker verification? Yes No
Comments:

ONTARIO HOT MIX PRODUCERS ASSOCIATION ENVIRONMENTAL PRACTICE GUIDE 2010 Page 79 of 85
Checklist for Asphalt Cement Discharge and Storage; andHot Mix Discharge
Are AC delivery temperatures within the proper dischargetemperature range?
Yes No
Are odour mitigation controls functioning properly? Yes No
Are AC storage temperatures within the prescribed temperaturerange?
Yes No
Are AC storage tank lids closed? Yes No
Are all AC transfer lines intact and functioning properly? Yes No
Has weather information and time been recorded during unloadingof AC?
Yes No
Has anti stripping additive been well blended? Yes No
Is the fugitive emission collection system on the HMA functioning asdesigned?
Yes No
Are transport vehicles tarping loads immediately following load out? Yes No
Are proper temperatures being maintained at HMA discharge? Yes No
Comments:

ONTARIO HOT MIX PRODUCERS ASSOCIATION ENVIRONMENTAL PRACTICE GUIDE 2010 Page 80 of 85
Checklist for Settling Ponds
Are settling ponds constructed to proper size and volume as permanufacturer’s recommendations?
Yes No
Is the sludge removed from the settling pond to maintain correctdepth of water?
Yes No
Is foot-valve free from debris? Yes No
Is sludge being disposed of in accordance with the plant C of A orlocal M.O.E. requests?
Yes No

ONTARIO HOT MIX PRODUCERS ASSOCIATION ENVIRONMENTAL PRACTICE GUIDE 2010 Page 81 of 85
Checklist for Wet Scrubbers
Is water supply pump operating at correct pressure and volume? Yes No
Are water spray nozzles providing correct spray pattern andcoverage?
Yes No
Are all valves, manifolds and pipes free from plugging and leaking? Yes No
Is venturi adjusted to manufacturer’s recommendations? Yes No
Are manometer/pressure drop readings in recommended operatingranges?
Yes No
Is exhaust gas velocity and temperature entering the scrubber at themanufacturer’s recommended design ranges?
Yes No
Is the exit exhaust gas through the stack at recommendedtemperature range?
Yes No
Is the plume form the stack visually acceptable and free from anydust tail?
Yes No
Comments:

ONTARIO HOT MIX PRODUCERS ASSOCIATION ENVIRONMENTAL PRACTICE GUIDE 2010 Page 82 of 85
Checklist for Noise Issues
Check large horsepower electric motors for transmission ofvibrations. Are vibration isolation motor mounts working correctly?
Yes No
If equipped, is turbo blower intake silencer working correctly? Yes No
Is exhaust fan balanced and operating without vibrations? Yes No
Are chains on slat conveyors, bucket elevators and drum/dryerdrives adjusted to the correct tension, without excess slack?
Yes No
Are all bearings, gear boxes and drives lubricated correctly toprevent excess noise?
Yes No
Are screen decks properly isolated and sealed? Yes No
Are screen deck mounting springs working correctly? Yes No
Comments:

ONTARIO HOT MIX PRODUCERS ASSOCIATION ENVIRONMENTAL PRACTICE GUIDE 2010 Page 83 of 85
Checklist for Site Management of Waste
Are environmentally-friendly (non-solvent) truck box release agents andasphalt cleaners used exclusively?
Yes No
If no, action should be taken to eliminate release agents such as diesel fuel.
Are asphalt cement and fuel storage tanks located according to Fuel SafetyBranch regulations (Ministry of Labour) with appropriate containmentsystems?
Yes No
If no, action should be taken to ensure compliance with Provincial regulationsand site management practices.
Are procedures and materials in place to clean up asphalt cement or fuelspills immediately?Use sand to absorb spills prior to removal.
Yes No
If no, materials such as sand or other environmental acceptable absorbentproducts should be made available as part of the site management plan andspill response procedures.
Are there dedicated vehicle maintenance areas on site with containmentsystems to address the collection, storage and disposal of waste oil andlubricants?
Yes No
If no, site management activities should be amended to eliminate the risk ofsurface oil and grease contamination. Waste oil should be collected andstored in a proper container and disposed of through a licensed disposal firm.
Does the site management plan include maintenance logs for companyvehicles and equipment and periodic in-house inspections to identify problemareas with respect to lubricant leakage?
Yes No
If no, site management documentation requirements should be amended toinclude vehicle/equipment maintenance data.
Are laboratory solvents and chemicals recycled? Yes No
If no and recycling is not undertaken, the method of off-site disposal for usedmaterials should be outlined in the site management plan and should meetMinistry of Environment regulations.
Does the plant have wet scrubber settling ponds? Yes No
If yes, the site management plan should address removal/disposal of sludgefrom the settling ponds in accordance with Certificate of Approvalrequirements (Wet Scrubber Systems). The groundwater and/or surfacewater quality should also be monitored as part of the management plan.

ONTARIO HOT MIX PRODUCERS ASSOCIATION ENVIRONMENTAL PRACTICE GUIDE 2010 Page 84 of 85
APPENDIX F
Sample Complaint Response Form

ONTARIO HOT MIX PRODUCERS ASSOCIATION ENVIRONMENTAL PRACTICE GUIDE 2010 Page 85 of 85
Complaint Response Form
Source of Complaint
Date Time
Nature of Complaint
Odour Noise Particulate Emission
Gaseous Emission Groundwater Preservation Waste
Give Specific Details of Complaint
Plant/Production Information
Plant Type: Batch Drum Other
Mix Type: HL Mix RAP Mix Other
Asphalt Cement type/grade
Additives
If RAP mix, note percentage of recycled material
Environmental Data
Air Temperature
Wind Speed Wind Direction
Sunshine Overcast Rain
Identify suspected source of problem
Identify measures taken to resolve complaint
Identify measures taken to follow up with complaint
Other Comments
Form Completed by Date
Signature
Date Submitted to MOE

BRONTE ASPHALT PLANT HPAQB APPLICATION FOR APPROVAL
April 2013 Report No. 12-1151-0213
APPENDIX C Emission Rate Calculations

12-1151-0213
Activity Description Raw materials are received on-site by truck and stored in outdoor storage piles prior to transfer to asphalt batch plant.
Emission Source: Emissions from raw material delivery and transfers
Methodology: US EPA Emission Factor, Rating A
Source: US EPA AP-42, Section 13.2.4 Aggregate Handling & Storage (11/06)
Equation (1) Particle Size Multiplier (k )
< 30 <15 <10 <5 <2.5
0.74 0.48 0.35 0.2 0.053
Wind Speed Data
Annual Average: 4.1 m/sWhere: E = Emission Factor (kg/Mg) Data Source Toronto (Pearson Airport) Climate Normals
k = particle sized multiplier (dimesionless)U = mean wind speed (m/s)M = material moisture content (%)
Emission Factor Calculation
Pollutant MaterialMoisture Content
Data Source of
Moisture Content
Emission Factor
(Uncontrolled) Quality Rating[%] kg/Mg
PM2.5 RAP 5.0 1 0.00005 AAgg/Sand 4.0 OHMPA 0.00007 ARecycled Concrete 6.2 OHMPA 0.00004 A
*OHMPA = Ontario Hot Mix Asphalt Producers Association
WORST CASE EMISSIONS
Raw Material Deliveries to Site BP Capacity 300,000 TPY
Composition[%]
RAP 30500298 20% 60,000 218.2 275Agg/Sand 30500298 75% 225,000 818.2 275Recycled Concrete 30500298 — 72,964 265.3 2751 Recycled concrete received is equal to 50% capacity of crusher.
2 RAP received is equal to production requirements for Batch Plant
Source ID Quantity Per Day Number of Drop Emission Factor Control Type Control Efficiency [%] Daily Worst Case Annual Worst Case [tonnes] [#] [kg/tonne] [kg/day] [kg/year]
MH_01 RAP Receipt of RAP 218.2 1 0.00005 windbreak 75% 0.003 0.788MH_02 Agg/Sand Receipt of Agg/Sand 818.2 1 0.00007 windbreak 75% 0.015 4.039MH_03 Recycled Concrete Receipt of Concrete 265.3 1 0.00004 windbreak 75% 0.003 0.709
Total 0.020 5.536
MovementRaw Material
ACTIVITY EMISSIONS FROM MATERIAL TRANSFERS - MATERIAL RECEIPT
EMISSION CALCULATION
Raw Material SCC Code Tonnes Per Day Days Per YearTonnes Per Year
EMISSION ESTIMATION METHODOLOGY
Aerodynamic Particle Size Multiplier (k)
[1] "Quantification of Recycled Concrete Aggregate (RCA) Properties". Transportation Association of Canada Recycled Materials Resource Centre. Reclaimed Asphalt Pavement http://www.rmrc.unh.edu/tools/uguidelines/rap131.asp
Maximum Material Movements
)/(
2
2.2)0016.0(
4.1
3.1
megagramkgM
U
kE
÷ø
öçè
æ
÷ø
öçè
æ
=
N:\Active\2012\1151\12-1151-0213 DCC - Oakville ByLay - Oakville\Calculations\12-1151-0213 DCC Oakville Bylaw Final Calculations Revision 2Made By: TMH
Checked By: LAB

12-1151-0213
Comments:For the purposes of this assessment it was assumed that the quantity of material received per year is equivalent to the quantity of material requried in the process.
Sample Calculation:
Annual Worst Case Emission [kg/year] = Emission Factor [kg/t] * Production Rate [tonnes/year] * Control Efficiency
Annual Worst Case Emission [kg/year] = 0.0000525 [kg/t] * 60,000 [tpy RAP] * [1 - 0.75]
Annual Worst Case Emission [kg/year] = 0.788 [kg/yr]
Daily Worst Case Emission [kg/year] = Annual Emission Rate [kg/year]/ Operating Days Per Year
Daily Worst Case Emission [kg/year] = 0.788/275
Daily Worst Case Emission [kg/year] = 0.003
AVERAGE EMISSION TOTALS
Raw Material Deliveries to Site BP Average 181,660 TPY
Composition[%]
RAP 30500298 20% 36331.9 132.1 275Agg/Sand 30500298 75% 136244.6 495.4 275Recycled Concrete 30500298 — 36481.8 132.7 2751 Recycled concrete received is equal to 50% capacity of crusher.
2 RAP received is equal to production requirements for Batch Plant
Source ID Material Received Quantity Per DayNumber of Drop
PointsEmission Factor Control Type Control Efficiency [%]
Average Emission
Rate
Average Daily
Emission[tonnes] [#] [kg/tonne] [kg/day] [kg/year]
MH_01 RAP Receipt of RAP 132.1 1 0.00005 windbreak 75% 0.002 0.477MH_02 Agg/Sand Receipt of Agg/Sand 495.4 1 0.00007 windbreak 75% 0.009 2.446MH_03 Recycled Concrete Receipt of Concrete 132.7 1 0.00004 windbreak 75% 0.001 0.355Total Total 0.012 3.277
Movement
Days Per YearTonnes Per Year
AVERAGE MATERIAL MOVEMENTS
Raw Material SCC Code Tonnes Per Day
N:\Active\2012\1151\12-1151-0213 DCC - Oakville ByLay - Oakville\Calculations\12-1151-0213 DCC Oakville Bylaw Final Calculations Revision 2Made By: TMH
Checked By: LAB

12-1151-0213
Activity Description
Emission Source: Emissions from raw material transfers to batch plant
Methodology: US EPA Emission Factor, Rating A
Source: US EPA AP-42, Section 13.2.4 Aggregate Handling & Storage (11/06)
Equation (1) Particle Size Multiplier (k )
< 30 <15 <10 <5 <2.5
0.74 0.48 0.35 0.2 0.053
Wind Speed DataWhere: E = Emission Factor (kg/Mg) Annual Average: 4.1 m/s
k = particle sized multiplier (dimesionless) Data Source Toronto (Pearson Airport) Climate NormalsU = mean wind speed (m/s)M = material moisture content (%)
Emission Factor Calculation
Pollutant MaterialMoisture Content
Data Source of
Moisture Content
Emission Factor
(Uncontrolled) Quality Rating[%] kg/Mg
PM2.5 RAP 5.0 OHMPA 0.00005 AAggregate/Sand 4.0 OHMPA 0.00007 ARecycled Concrete 6.2 OHMPA 0.00004 A
*OHMPA = Ontario Hot Mix Asphalt Producers Association
WORST CASE EMISSIONS
Material Transfers From Piles to Processing Plant BP Capacity 300,000 TPY
Aggregate/Sand 30500298 75% 225,000 818.18 275RAP 30500298 20% 60,000 218.18 275
Quantity Per Day Number of Drop Points Emission FactorDaily Worst Case
Emission Rate
Annual Worst Case
Emission Rate[tonnes] [#] [kg/tonne] [kg/day] [kg/year]
MH_04 Aggregate/Sand Agg/Sand to Feed Hopper 818.2 1 0.00007 windbreak 75% 0.015 4.039MH_05 RAP RAP to Feed Hopper 218.2 1 0.00005 windbreak 75% 0.003 0.788
Total 0.018 4.827
Aggregates/Sand and RAP are transferred from storage piles to the batch plant via front-end loader. The RAP is transferred from the RAP storage pile to the RAP feed hopper located on the north end of the batch plant. The
aggregate/sand are transferred to the aggregate/sand feedhopper located on the south end of the plant.
Aerodynamic Particle Size Multiplier (k)
ACTIVITY EMISSIONS FROM MATERIAL TRANSFERS - BATCH PLANT OPERATIONS
Control Type Control Efficiency [%]
% Composition of BP Mix Tonnes Per Year
[1] "Quantification of Recycled Concrete Aggregate (RCA) Properties". Transportation Association of Canada Recycled Materials Resource Centre. Reclaimed Asphalt Pavement http://www.rmrc.unh.edu/tools/uguidelines/rap131.asp
EMISSION ESTIMATION METHODOLOGY
EMISSION CALCULATION
Raw Material SCC Code Tonnes Per Day Days Per Year
Maximum Material Movements
Source ID Raw Material Movement
)/(
2
2.2)0016.0(
4.1
3.1
megagramkgM
U
kE
÷ø
öçè
æ
÷ø
öçè
æ
=
N:\Active\2012\1151\12-1151-0213 DCC - Oakville ByLay - Oakville\Calculations\12-1151-0213 DCC Oakville Bylaw Final Calculations Revision 2Made By: TMH
Checked By: LAB

12-1151-0213
Sample Calculation:
Annual Worst Case Emission [kg/year] = Emission Factor [kg/t] * Production Rate [tonnes/year] * Control EfficiencyAnnual Worst Case Emission [kg/year] = 0.0000525 [kg/t] * 60,000 [tpy RAP] * [1 - 0.75]Annual Worst Case Emission [kg/year] = 0.788 [kg/yr]
Daily Worst Case Emission [kg/year] = Annual Emission Rate [kg/year]/ Operating Days Per YearDaily Worst Case Emission [kg/year] = 0.788/275Daily Worst Case Emission [kg/year] = 0.003
CommentsRecycled concrete is not used in the production of asphalt cement. It is crushed on site and delivered to offsite customers.
AVERAGE EMISSIONS TOTALS
Material Transfers From Piles to Processing Plant BP Average 181,660 TPY
Aggregate/Sand 30500298 75% 136,245 495.44 275RAP 30500298 20% 36,332 132.12 275
Source ID Material Received Quantity Per Day Number of Drop Points Emission FactorDaily Worst Case
Emission Rate
Annual Worst Case
Emission Rate[tonnes] [#] [kg/tonne] [kg/day] [kg/year]
MH_04 Aggregate/Sand Agg/Sand to Feed Hopper 495.4 1 0.00007 windbreak 75% 0.009 2.446MH_05 RAP RAP to Feed Hopper 132.1 1 0.00005 windbreak 75% 0.002 0.477
Total 0.011 2.923
Raw Material SCC Code % Composition of BP Mix Tonnes Per Year
Movement Control Efficiency [%]
Average Material Movements
Tonnes Per Day Days Per Year
Control Type
N:\Active\2012\1151\12-1151-0213 DCC - Oakville ByLay - Oakville\Calculations\12-1151-0213 DCC Oakville Bylaw Final Calculations Revision 2Made By: TMH
Checked By: LAB

12-1151-0213
Activity Description
Emission Source: Emissions From Batch Plant Processing (Dryer/Screens/Mixer)Methodology: US EPA Emission Factor
Source: Section 11.1 Hot Mix Asphalt Plants (3/04)
SCC lb/ton kg/Mg Methodology Rating Source
Dryer/Screens/Mixer 3-05-002-47 0.0083 0.0042 US EPA EF E Table 11.1-14
WORST CASE EMISSIONS
HMA Production 300000 1091 275
Daily Worst Case Emission
Rate
Annual Worst Case
Emission Rate[kg/day] [kg/year]
DS_01 Dryer/Screens/Mixer 4.53 1245.00
AVERAGE EMISSION TOTALS
HMA Production 181660 661 275
Daily Average Emission
Rate
Annual Average Emission
Rate[kg/day] [kg/year]
DS_01 Dryer/Screens/Mixer 2.74 753.89
Source Description
Average Production
Rate [tonnes/year]Operating Days Per Year
SourceMaximum Production Rate
[tonnes/day]
SourceAverage Production Rate
[tonnes/day]
Source Description
ACTIVITY EMISSIONS FROM DRYER STACK - BATCH PLANT
EMISSION ESTIMATION METHODOLOGY
Emission Factors
EMISSION CALCULATION
ActivityEmission Factor Calculation Details
Raw materials are processed to hot mix asphalt using a batch operation. The dryer is NG fired.
Operating Days Per YearMaximum Production
Rate [tonnes/year]
N:\Active\2012\1151\12-1151-0213 DCC - Oakville ByLay - Oakville\Calculations\12-1151-0213 DCC Oakville Bylaw Final Calculations Revision 2Made By: TMH
Checked By: LAB

12-1151-0213
Activity Description
Emission Source: Emissions From Silo Filling and Loadout
Methodology: US EPA Emission Factor
Source: Section 11.1 Hot Mix Asphalt Plants (3/04)
Volatility
HMA 325oF -0.5
SILO FILLING LOAD OUT
PM2.5 Predictive Emission Factor EF = 0.000332 + 0.00105(-V)e((0.0251)(T+460)-20.43)
PM2.5 Predictive Emission Factor EF = 0.000181 + 0.00141(-V)e((0.0251)(T+460)-20.43)
*assume TSP factor is 100% PM2.5 *assume TSP factor is 100% PM2.5
Calculation for SPM (PM2.5) Sample Calculation for SPM (Total PM)
EF = 0.000332 + 0.00105(-(-0.5)e((0.0251)(325+460)-20.43)
EF = 0.000181 + 0.00141(-(-0.5)e((0.0251)(325+460)-20.43)
EF = 0.000332 + 0.00105(0.5)e(-0.7265)
EF = 0.000181 + 0.00141(0.5)e(-0.7265)
EF = 0.000332 + 0.0002539 EF = 0.000181 + 0.00034EF = 0.0005859 lbs/ton of asphalt loaded EF = 0.0005219 lbs/ton of asphalt loadedEF = 0.00068 * 0.5 (conversion from lbs/ton to kg/tonne) EF = 0.0005219 * 0.5 (conversion from lbs/ton to kg/tonne)EF = 0.000293 kg/tonne asphalt produced EF = 0.00026 kg/tonne asphalt loaded
Emission FactorSCC kg/tonne Methodology Rating Source
Silo Filling 3-05-002-13 2.93E-04 US EPA EF C Table 11.1-14Load Out 3-05-002-14 2.61E-04 US EPA EF C Table 11.1-14
WORST CASE EMISSIONS
Silo Filling 80% 240000 873 275Load Out 20% 60000 218 275
Source ID Description Quantity Per Day Emission FactorDaily Worst Case
Emission Rate
Annual Worst Case
Emission Rate[tonnes] [kg/tonne] [kg/day] [kg/year]
BP_01 Silo Filling 872.73 0.00029 0.256 70.307BP_02 Load Out 218.18 0.00026 0.057 15.658Total 0.313 85.965
EMISSIONS FROM BATCH PLANT - SILO FILLING AND LOAD OUT
EMISSION ESTIMATION METHODOLOGY
EMISSION FACTORS
ACTIVITY
Source
Final HMA is either loaded directly to the truck, or temporarily stored in one of three HMA storage silos prior to delivery to off-site customers. Approximately 20% of product is directly truck loaded and
80% goes through the silo system.
EMISSION CALCULATION
Operating Days Per
Year
Maximum
Production Rate
[tonnes/year]
% of HMA Flow
Through
Maximum
Production Rate
[tonnes/day]
Temperature
ActivityCalculation Details
N:\Active\2012\1151\12-1151-0213 DCC - Oakville ByLay - Oakville\Calculations\12-1151-0213 DCC Oakville Bylaw Final Calculations Revision 2Made By: TMH
Checked By: LAB

12-1151-0213
AVERAGE EMISSION TOTALS
Average Production Operating Days Per
Silo Filling 80% 145328 528 275Load Out 20% 36332 132 275
Source ID Description Quantity Per Day Emission FactorAverage Emission
Rate
Annual Average
Emission Rate[tonnes] [kg/tonne] [kg/day] [kg/year]
BP_01 Silo Filling 528.46 0.00029 0.155 42.573BP_02 Load Out 132.12 0.00026 0.034 9.481Total 0.1893 52.054
SourceMaximum
Production Rate
% of HMA Flow
Through
N:\Active\2012\1151\12-1151-0213 DCC - Oakville ByLay - Oakville\Calculations\12-1151-0213 DCC Oakville Bylaw Final Calculations Revision 2Made By: TMH
Checked By: LAB

12-1151-0213
Activity Description
Emission Source: Recycled Concrete Crushing Operations
Methodology: US EPA Emission Factor
Source: Section 11.19.2 Crushed Stone Processing and Pulverized Mineral Processing (11/06)
Section 13.2.4 Aggregate Handling & Storage (11/06)
Maximum Annual 145927.0 tonnes Double average crushing conditionsDaily Operation 2432.1 tonnesOperating Days 60.0 days Maximum allowable by permit
Maximum Annual 13702.0 tonnes Double typical sales valueDaily Operation 49.8 tonnesOperating Days 275.0 days Assume shipping occurs daily
WORST CASE EMISSIONS
Emission Factor
(controlled)Controls Control Efficiency
Daily Worst Case
Emission Rate
Annual Worst Case
Emission RateComments
kg/Tonne [%] [kg/day] (kg/year)RCC-01 Primary Crushing 3-05-020-01 0.00005 water 90% 0.012 0.730 [1]RCC-02 Screening 3-05-020-02,03 0.00003 water 90% 0.006 0.365 [2]
RCC-03 Crushed Stone Sales 3-05-020-98 0.00004 water 90% 0.000 0.053 [3]Totals 0.018 1.148
[1] Emission factor from Table 11.19.2-1 for Tertiary Crushing (controlled)[2] Emission factor from Table 11.19.2-1 for Screening (controlled)[3] Emission factor from US EPA AP-42, Section 13.2.4 Aggregate Handling & Storage (11/06)[4] Water spray is utilized during crushing operations
EMISSION ESTIMATION METHODOLOGY
EMISSIONS FROM RECYCLE CRUSHING OPERATIONS
Recycled concrete product and RAP are received and stored in outdoor storage piles. These materials are crushed periodically throughout the year by a third party contractor. The
RAP is used in the HMA process. Recycled concrete is delivered to off-site customers
Comments
Crushed Stone Sales
Crushing Operations
Comments
EMISSION CALCULATION
Source ID Description SCC
ACTIVITY
N:\Active\2012\1151\12-1151-0213 DCC - Oakville ByLay - Oakville\Calculations\12-1151-0213 DCC Oakville Bylaw Final Calculations Revision 2Made By: TMH
Checked By: LAB

12-1151-0213
AVERAGE EMISSION TOTALS
Average Annual 72,964 tonnes Average crushing rate.Daily Operation 1779.6 tonnesOperating Days 41.0 days Based on average days of third party contractor onsite
Average Annual 6851 tonnes Based on actual salesDaily Operation 24.9 tonnesOperating Days 275.0 days Assume shipping occurs daily
Emission Factor
(controlled)Controls Control Efficiency
Daily Average
Emission Rate
Annual Average
Emission RateComments
kg/Tonne [%] [kg/day] (kg/year)RCC-01 Primary Crusher 3-05-020-01 0.00005 water 90% 0.0089 0.365 [1]RCC-02 Secondary Crusher 3-05-020-02,03 0.00003 water 90% 0.0044 0.182 [2]
RCC-03 Crushed Stone Sales 3-05-020-98 0.00004 water 90% 0.0001 0.027 [3]Total 0.013 0.574
[1] Emission factor from Table 11.19.2-1 for Tertiary Crushing (controlled)[2] Emission factor from Table 11.19.2-1 for Screening (controlled)[3] Emission factor from US EPA AP-42, Section 13.2.4 Aggregate Handling & Storage (11/06)
CommentsCrushing Operations
Source ID Description SCC
CommentsCrushed Stone Sales
N:\Active\2012\1151\12-1151-0213 DCC - Oakville ByLay - Oakville\Calculations\12-1151-0213 DCC Oakville Bylaw Final Calculations Revision 2Made By: TMH
Checked By: LAB

12-1151-0213
Activity Description
Emission Source: Recycled Concrete Crushing OperationsMethodology: Emission FactorSource: Tier III Emission Standards for Non-Road Diesel Engines
Contaminant SCC Emission Factor Referenceg/Hp-Hr
PM2.5 2-02-001-02 0.15 Tier II*assume all SPM is less then 2.5 µm in diameter
WORST CASE EMISSIONS
Max Hours Per Day 10 hour per dayDays Per Year 60 days
Source ID Max CapacityEmission Factor
(controlled)Base Load Factor
Daily Worst Case
Emission Rate
Annual Worst Case
Emission RateHP-Hr g/Hp-Hr [kg/day] (kg/year)
GEN-01 400.00 0.15 40% 0.239 14.317
GEN-02 400.00 0.15 60% 0.358 21.476
GEN-03 60.00 0.20 35% 0.042 2.520
Total 0.639 38.314
AVERAGE EMISSION TOTALS
Average Hours Per Day 10 hours per dayDays Per Year 41 days
Source ID Max CapacityEmission Factor
(controlled)Base Load Factor
Daily Average Case
Emission Rate
Annual Average Case
Emission RateHP-Hr (g/Hp-Hr) [kg/day] (kg/year)
GEN-01 400.00 0.149 40% 0.239 9.784
GEN-02 400.00 0.15 60% 0.358 14.675
GEN-03 60.00 0.20 35% 0.042 1.722
Total 0.639 26.181
EMISSIONS FROM RECYCLE CRUSHING OPERATIONS - Diesel Generator
EMISSION ESTIMATION METHODOLOGY
EMISSION CALCULATION
ACTIVITY
Crushers/screener is powered by diesel generators.
N:\Active\2012\1151\12-1151-0213 DCC - Oakville ByLay - Oakville\Calculations\12-1151-0213 DCC Oakville Bylaw Final Calculations Revision 2Made By: TMH
Checked By: LAB

12-1151-0213
Activity Description
Emission Source: Wind Erosion From Storage Piles
Methodology: Emission Factor
Source: WRAP Document, Chapter 9, alternate methodology
Formula:
Where: E = Total Suspend Particulate Emission Factor
s = silt content of aggregate (%)
p = number of days with >= 0.25 mm precipitation per year
f =
WORST CASE EMISSIONS
SCCExposed Surface
Area 3Active Area Active Area
s p f kg/acre/day kg/acre/day acre % acres kg/day [kg/year]
SP-1 RAP 30500203 1 191.8 30 0.17 0.02 0.494 5% 0.025 0.0004 0.114
SP-2 Agg/Sand 1 30500203 2.1 191.8 30 0.37 0.04 0.074 5% 0.004 0.0001 0.036
SP-3 Agg/Sand 2 30500203 2.1 191.8 30 0.37 0.04 0.099 5% 0.005 0.0002 0.049
SP-4 Agg/Sand 3 30500203 2.1 191.8 30 0.37 0.04 0.052 5% 0.003 0.0001 0.026
SP-5 Agg/Sand 4 30500203 2.1 191.8 30 0.37 0.04 0.074 5% 0.004 0.0001 0.036
SP-6 Agg/Sand 5 30500203 2.1 191.8 30 0.37 0.04 0.111 5% 0.006 0.0002 0.055
SP-7 Recycled Concrete (uncrushed) 30500203 1 191.8 30 0.17 0.02 1.152 5% 0.058 0.0010 0.266
SP-8 Recycled Concrete (crushed 30500203 1.6 191.8 30 0.27 0.03 0.758 5% 0.038 0.0010 0.280
Notes: Total 0.003 0.862
1 Silt content from OHMPA ECHO Calculator
2 From Climate Normals, Pearson Airport, Toronto, Ontario (precipitation + snow depth >5 cm)
3 For worst case scenario it was assumed that each day of the year 5% of the pile is made "available" for erosion potential
4 Assume watering control prior to wind event, 90 % control efficiency
EMISSIONS FROM STORAGE PILESACTIVITY
Source ID Source Uncontrolled
PM2.5 Emission
Factor
Daily Worst Case
Emissions
Controlled
Emission Factor4
EMISSION ESTIMATION METHODOLOGY
Raw materials are stored in outdoor storage piles. Piles are controlled through management of active areas and water spray
percentage of time unobstructed windspeed exceeds 5.4 m/s
at mean pile height
EMISSION CALCULATION
Pile Surface Area
Annual Worst
Case Emissions % silt1
Number of Days
with >= 2 mm
precipitation2
Fraction of time
wind >5.4 m/s at
mean pile height3
÷ø
öçè
æ=155.1
13.0)//(5.2fsacredaylbPM
N:\Active\2012\1151\12-1151-0213 DCC - Oakville ByLay - Oakville\Calculations\12-1151-0213 DCC Oakville Bylaw Final Calculations Revision 2Made By: TMH
Checked By: LAB

12-1151-0213
AVERAGE EMISSION TOTALS
SCCExposed Surface
Area 3Active Area Active Area
s p f kg/acre/day kg/acre/day acre % acres kg/day [kg/year]
SP_1 RAP 30500203 1 191.8 29.71 0.17 0.02 0.494 5% 0.0247 0.0004 0.114
SP_2 Agg/Sand 1 30500203 2.1324 191.8 29.71 0.37 0.04 0.0741 5% 0.003705 0.0001 0.036
SP_3 Agg/Sand 2 30500203 2.1324 191.8 29.71 0.37 0.04 0.0988 5% 0.00494 0.0002 0.049
SP_4 Agg/Sand 3 30500203 2.1324 191.8 29.71 0.37 0.04 0.05187 5% 0.0025935 0.0001 0.026
SP_5 Agg/Sand 4 30500203 2.1324 191.8 29.71 0.37 0.04 0.073853 5% 0.00369265 0.0001 0.036
SP_6 Agg/Sand 5 30500203 2.1324 191.8 29.71 0.37 0.04 0.11115 5% 0.0055575 0.0002 0.055
SP_7 Recycled Concrete (uncrushed) 30500203 1 191.8 29.71 0.17 0.02 1.1521068 5% 0.05760534 0.0010 0.266
SP_8 Recycled Concrete (crushed) 30500203 1.6 191.8 29.71 0.27 0.03 0.75766756 5% 0.037883378 0.0010 0.280
Notes: Total 0.003 0.862
1 Silt content from AP-24, Section 13.2.4
2 From Climate Normals, Pearson Airport, Toronto, Ontario (precipitation + snow depth >5 cm)
3 For average scenario it was assumed that each day of the year 5% of the pile is made "available" for erosion potential
4 Assume watering control prior to wind event
Pile Surface Area
Daily Average
Emissions
Annual Average
Emissions
Source ID Source
% silt1
Number of Days
with >= 2 mm
precipitation2
Fraction of time
wind >5.4 m/s at
mean pile height3
Uncontrolled
PM2.5 Emission
Factor
Controlled
Emission Factor4
N:\Active\2012\1151\12-1151-0213 DCC - Oakville ByLay - Oakville\Calculations\12-1151-0213 DCC Oakville Bylaw Final Calculations Revision 2Made By: TMH
Checked By: LAB

12-1151-0213
Emission Source: Boilers and Heaters
Methodology: US EPA Emission Factor
US EPA AP-42 Section 1.4 - Natural Gas Combustion (7/98)
US EPA AP-42 Section 1.3 - Fuel Oil Combustion (7/98)
Max Capacity
MMBtu/hr
CS-01 Asphalt Plant NG 3.00
CS-02 Wash Bay NG 0.37
CS-03 Wash Bay #2 Fuel Oil 0.16
RH-01 Garage - Welding NG 0.13
RH-02 Garage - Welding NG 0.13
RH-03 Garage - Shop NG 0.13
RH-04 Garage - Shop NG 0.13
RH-05 Garage - Shop NG 0.13
RH-06 Garage - Shop NG 0.13
RH-07 Garage - Shop NG 0.13
RH-08 Garage - Shop NG 0.13
RH-09 Garage - Shop NG 0.13
RH-10 Garage - Shop NG 0.13
RH-11 Garage - Shop NG 0.13
Emission Factor
Fuel Type SCC Quality Rating
lbs/106 scf lbs/103 gal lb/MMBtu g/MMBtu g/MMBtu
Natural Gas 1-03-006-02 7.6 — 0.007 3.38 D
Fuel Oil 1-02-005-02/03 — 2 0.014 6.48 A
kg/10^6 m3 Source
HMA Heater 1-02-005-03 30.435 EC NPRI Toolbox
*assume SPM is 100% PM2.5
EMISSIONS FROM SUPPORT OPERATIONS - OTHER HEATING SOURCES
EMISSION ESTIMATION METHODOLOGY
ACTIVITY
Sources:
Emission Factor
Gas Fired Heater
Emission Calculation
Gas Fired Heater
Gas Fired Heater
Gas Fired Heater
Gas Fired Heater
Gas Fired Heater
Gas Fired Heater
Gas Fired Heater
Gas Fired Heater
Equipment Details
Source ID Description Fuel Type
HMA Storage Heater
Steam Washer
Oil Heater Furnance
Gas Fired Heater
Gas Fired Heater
SCC
N:\Active\2012\1151\12-1151-0213 DCC - Oakville ByLay - Oakville\Calculations\12-1151-0213 DCC Oakville Bylaw Final Calculations Revision 2Made By: TMH
Checked By: LAB

12-1151-0213
WORST CASE EMISSIONS
Max Hours 24 hours per day
Fuel Type Hours Per Day Days Per Year Max Capacity Emisison Factor
MMBtu/hr [g/MMBtu]
CS-01 NG 24 275 3.00 3.38 0.24 66.92
CS-02 NG 3 275 0.37 3.38 0.00 1.03
CS-03 #2 Fuel Oil 24 182 0.16 6.48 0.02 4.53
RH-01 NG 24 182 0.13 3.38 0.01 1.85
RH-02 NG 24 182 0.13 3.38 0.01 1.85
RH-03 NG 24 182 0.13 3.38 0.01 1.85
RH-04 NG 24 182 0.13 3.38 0.01 1.85
RH-05 NG 24 182 0.13 3.38 0.01 1.85
RH-06 NG 24 182 0.13 3.38 0.01 1.85
RH-07 NG 24 182 0.13 3.38 0.01 1.85
RH-08 NG 24 182 0.13 3.38 0.01 1.85
RH-09 NG 24 182 0.13 3.38 0.01 1.85
RH-10 NG 24 182 0.13 3.38 0.01 1.85
RH-11 NG 24 182 0.13 3.38 0.01 1.85
Total Emissions for all Combustion Sources 0.38 92.78
*Heaters only run during winter months
AVERAGE EMISSION TOTALS
Emission Calculations
Fuel Type Hours Per Day Days Per Year Avg Capacity Emisison Factor
MMBtu/hr [g/MMBtu]
CS-01 NG 24 275 2.40 3.38 0.19 53.53
CS-02 NG 1 275 0.30 3.38 0.00 0.28
CS-03 #2 Fuel Oil 24 182 0.13 6.48 0.02 3.62
RH-01 NG 24 182 0.10 3.38 0.01 1.48
RH-02 NG 24 182 0.10 3.38 0.01 1.48
RH-03 NG 24 182 0.10 3.38 0.01 1.48
RH-04 NG 24 182 0.10 3.38 0.01 1.48
RH-05 NG 24 182 0.10 3.38 0.01 1.48
RH-06 NG 24 182 0.10 3.38 0.01 1.48
RH-07 NG 24 182 0.10 3.38 0.01 1.48
RH-08 NG 24 182 0.10 3.38 0.01 1.48
RH-09 NG 24 182 0.10 3.38 0.01 1.48
RH-10 NG 24 182 0.10 3.38 0.01 1.48
RH-11 NG 24 182 0.10 3.38 0.01 1.48
Total Emissions for all Combustion Sources 0.30 73.67
[1] Heaters only operate during cold months (October through March)
Annual
Emission Rate
[kg/year]
Gas Fired Heater
Oil Heater Furnance
Daily Emission Rate
[kg/day]
Gas Fired Heater
Gas Fired Heater
Gas Fired Heater
Gas Fired Heater
Gas Fired Heater
HMA Storage Heater
Source ID
HMA Storage Heater
Steam Washer
Gas Fired Heater
Gas Fired Heater
Gas Fired Heater
Gas Fired Heater
Gas Fired Heater
Description
Gas Fired Heater
Source ID DescriptionDaily Emission Rate
[kg/day]
Gas Fired Heater
Gas Fired Heater
Gas Fired Heater
Gas Fired Heater
Gas Fired Heater
Gas Fired Heater
Gas Fired Heater
Annual
Emission Rate
[kg/year]
Steam Washer
Gas Fired Heater
Gas Fired Heater
Gas Fired Heater
Oil Heater Furnance
N:\Active\2012\1151\12-1151-0213 DCC - Oakville ByLay - Oakville\Calculations\12-1151-0213 DCC Oakville Bylaw Final Calculations Revision 2Made By: TMH
Checked By: LAB

12-1151-0213
Emission Source: Weld-01
Methodology: US EPA AP-42
Source: 12.19 Electric Arc Welding (1/95)
Details of Weld Rods
Rod Type E7018
Useage Rate Actual 5 kg every 2 weeks
E7018 3-09-051 - 18.40 0.0010 US EPA EF C
WORST CASE EMISSIONS
Weld Rod Usage 0.5 kg/day
Emisison
Factor
Emission
Rate
[g/kg] [g/s]
Weld-01 18.40 0.01 2.39 0.0001
AVERAGE EMISSION TOTALS
Weld Rod Usage 0.5 kg/day
Emisison
Factor
Emission
Rate
[g/kg] [g/s]
Weld-01 18.40 0.01 2.39 0.0001
CAS
Emission
Factor
(g/kg)
Emission
Rate (g/s)
ACTIVITY EMISSIONS FROM SUPPORT OPERATIONS - WELDING
Process Description: Welding of various parts occurs in the maintenance shop. Typical weld rod usage is 5 kg of rod every
two weeks. For emission calculation purposes it was assummed that all emission occur during a 1/2-
hour period
Emission Calculation
Maintenance Welding
Source ID Description
Daily
Emission
Rate
[kg/day]
Annual
Emission
Rate
[kg/year]
Maintenance Welding
Source ID Description
Daily
Emission
Rate
[kg/day]
Annual
Emission
Rate
[kg/year]
Estimateion
Methodolol
ogy
Data QualityWeld Rod Type Contaminant
N:\Active\2012\1151\12-1151-0213 DCC - Oakville ByLay - Oakville\Calculations\12-1151-0213 DCC Oakville Bylaw Final Calculations Revision 2Made By: TMH
Checked By: LAB
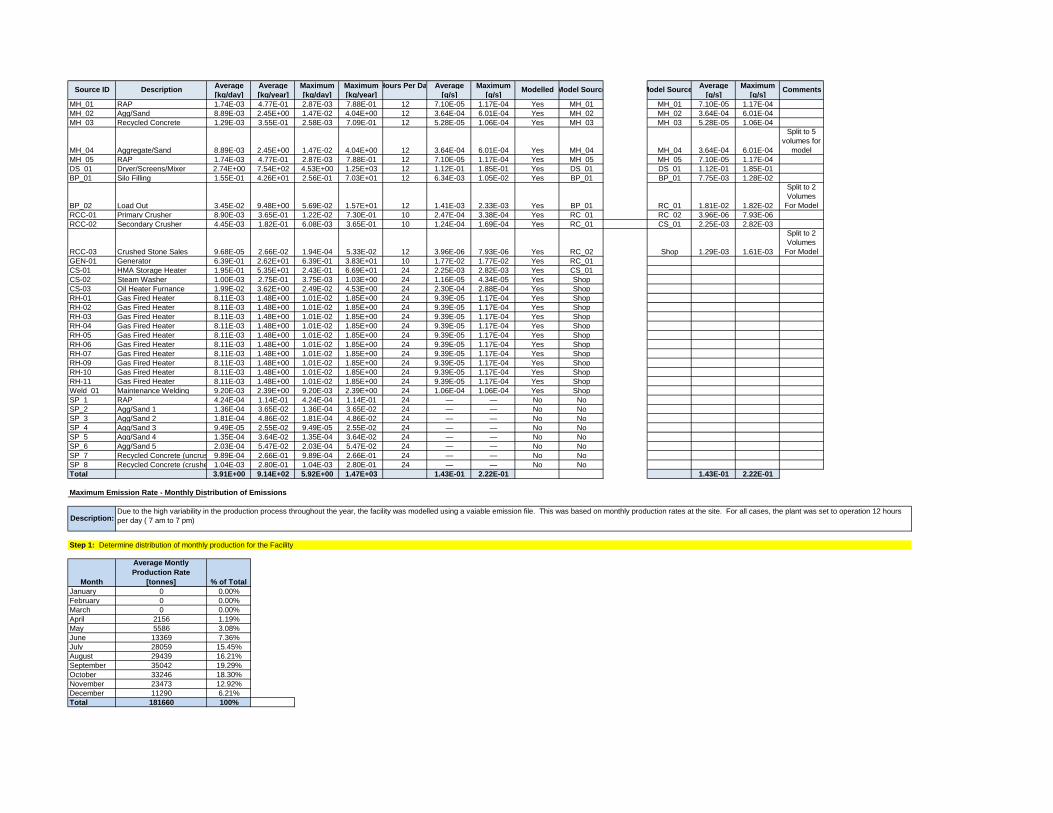
Average Average Maximum Maximum Hours Per Day Average Maximum Average Maximum[kg/day] [kg/year] [kg/day] [kg/year] [g/s] [g/s] [g/s] [g/s]
MH_01 RAP 1.74E-03 4.77E-01 2.87E-03 7.88E-01 12 7.10E-05 1.17E-04 Yes MH_01 MH_01 7.10E-05 1.17E-04MH_02 Agg/Sand 8.89E-03 2.45E+00 1.47E-02 4.04E+00 12 3.64E-04 6.01E-04 Yes MH_02 MH_02 3.64E-04 6.01E-04MH_03 Recycled Concrete 1.29E-03 3.55E-01 2.58E-03 7.09E-01 12 5.28E-05 1.06E-04 Yes MH_03 MH_03 5.28E-05 1.06E-04
MH_04 Aggregate/Sand 8.89E-03 2.45E+00 1.47E-02 4.04E+00 12 3.64E-04 6.01E-04 Yes MH_04 MH_04 3.64E-04 6.01E-04
Split to 5 volumes for
model
MH_05 RAP 1.74E-03 4.77E-01 2.87E-03 7.88E-01 12 7.10E-05 1.17E-04 Yes MH_05 MH_05 7.10E-05 1.17E-04DS_01 Dryer/Screens/Mixer 2.74E+00 7.54E+02 4.53E+00 1.25E+03 12 1.12E-01 1.85E-01 Yes DS_01 DS_01 1.12E-01 1.85E-01BP_01 Silo Filling 1.55E-01 4.26E+01 2.56E-01 7.03E+01 12 6.34E-03 1.05E-02 Yes BP_01 BP_01 7.75E-03 1.28E-02
BP_02 Load Out 3.45E-02 9.48E+00 5.69E-02 1.57E+01 12 1.41E-03 2.33E-03 Yes BP_01 RC_01 1.81E-02 1.82E-02
Split to 2 Volumes
For Model
RCC-01 Primary Crusher 8.90E-03 3.65E-01 1.22E-02 7.30E-01 10 2.47E-04 3.38E-04 Yes RC_01 RC_02 3.96E-06 7.93E-06RCC-02 Secondary Crusher 4.45E-03 1.82E-01 6.08E-03 3.65E-01 10 1.24E-04 1.69E-04 Yes RC_01 CS_01 2.25E-03 2.82E-03
RCC-03 Crushed Stone Sales 9.68E-05 2.66E-02 1.94E-04 5.33E-02 12 3.96E-06 7.93E-06 Yes RC_02 Shop 1.29E-03 1.61E-03
Split to 2 Volumes
For Model
GEN-01 Generator 6.39E-01 2.62E+01 6.39E-01 3.83E+01 10 1.77E-02 1.77E-02 Yes RC_01CS-01 HMA Storage Heater 1.95E-01 5.35E+01 2.43E-01 6.69E+01 24 2.25E-03 2.82E-03 Yes CS_01CS-02 Steam Washer 1.00E-03 2.75E-01 3.75E-03 1.03E+00 24 1.16E-05 4.34E-05 Yes ShopCS-03 Oil Heater Furnance 1.99E-02 3.62E+00 2.49E-02 4.53E+00 24 2.30E-04 2.88E-04 Yes ShopRH-01 Gas Fired Heater 8.11E-03 1.48E+00 1.01E-02 1.85E+00 24 9.39E-05 1.17E-04 Yes ShopRH-02 Gas Fired Heater 8.11E-03 1.48E+00 1.01E-02 1.85E+00 24 9.39E-05 1.17E-04 Yes ShopRH-03 Gas Fired Heater 8.11E-03 1.48E+00 1.01E-02 1.85E+00 24 9.39E-05 1.17E-04 Yes ShopRH-04 Gas Fired Heater 8.11E-03 1.48E+00 1.01E-02 1.85E+00 24 9.39E-05 1.17E-04 Yes ShopRH-05 Gas Fired Heater 8.11E-03 1.48E+00 1.01E-02 1.85E+00 24 9.39E-05 1.17E-04 Yes ShopRH-06 Gas Fired Heater 8.11E-03 1.48E+00 1.01E-02 1.85E+00 24 9.39E-05 1.17E-04 Yes ShopRH-07 Gas Fired Heater 8.11E-03 1.48E+00 1.01E-02 1.85E+00 24 9.39E-05 1.17E-04 Yes ShopRH-09 Gas Fired Heater 8.11E-03 1.48E+00 1.01E-02 1.85E+00 24 9.39E-05 1.17E-04 Yes ShopRH-10 Gas Fired Heater 8.11E-03 1.48E+00 1.01E-02 1.85E+00 24 9.39E-05 1.17E-04 Yes ShopRH-11 Gas Fired Heater 8.11E-03 1.48E+00 1.01E-02 1.85E+00 24 9.39E-05 1.17E-04 Yes ShopWeld_01 Maintenance Welding 9.20E-03 2.39E+00 9.20E-03 2.39E+00 24 1.06E-04 1.06E-04 Yes ShopSP_1 RAP 4.24E-04 1.14E-01 4.24E-04 1.14E-01 24 — — No NoSP_2 Agg/Sand 1 1.36E-04 3.65E-02 1.36E-04 3.65E-02 24 — — No NoSP_3 Agg/Sand 2 1.81E-04 4.86E-02 1.81E-04 4.86E-02 24 — — No NoSP_4 Agg/Sand 3 9.49E-05 2.55E-02 9.49E-05 2.55E-02 24 — — No NoSP_5 Agg/Sand 4 1.35E-04 3.64E-02 1.35E-04 3.64E-02 24 — — No NoSP_6 Agg/Sand 5 2.03E-04 5.47E-02 2.03E-04 5.47E-02 24 — — No NoSP_7 Recycled Concrete (uncrushed)9.89E-04 2.66E-01 9.89E-04 2.66E-01 24 — — No NoSP_8 Recycled Concrete (crushed)1.04E-03 2.80E-01 1.04E-03 2.80E-01 24 — — No NoTotal 3.91E+00 9.14E+02 5.92E+00 1.47E+03 1.43E-01 2.22E-01 1.43E-01 2.22E-01
Maximum Emission Rate - Monthly Distribution of Emissions
Step 1: Determine distribution of monthly production for the Facility
Month
Average Montly
Production Rate
[tonnes] % of Total
January 0 0.00%February 0 0.00%March 0 0.00%April 2156 1.19%May 5586 3.08%June 13369 7.36%July 28059 15.45%August 29439 16.21%September 35042 19.29%October 33246 18.30%November 23473 12.92%December 11290 6.21%Total 181660 100%
Source ID Description Modelled Model Source CommentsModel Sources
Description:Due to the high variability in the production process throughout the year, the facility was modelled using a vaiable emission file. This was based on monthly production rates at the site. For all cases, the plant was set to operation 12 hours per day ( 7 am to 7 pm)

Step 2: Determine monthly emission rate for each source for the batch plant. From the table below, hourly variable emission files were developed for the model sources
Montly Emission Rate [g/s] =
Sample Calculation for June, MH_01
Annual Emission Rate 0.788 kg/yearDays Per Month 30Hours Per Day 12Percent of Production 7.36%
June Emission Rate [g/s] =
June Emission Rate [g/s] = 4.475E-05 g/s
Maximum Emission Rate - Monthly Distribution of Emissionsjan feb mar apr may june july aug sept oct nov dec
Maximum # Days 31 28 31 30 31 30 31 31 30 31 30 31[kg/year] % Prod. 0.00% 0.00% 0.00% 1.19% 3.08% 7.36% 15.45% 16.21% 19.29% 18.30% 12.92% 6.21%
MH_01 RAP 0.788 0.00E+00 0.00E+00 0.00E+00 7.21E-06 1.81E-05 4.47E-05 9.09E-05 9.54E-05 1.17E-04 1.08E-04 7.86E-05 3.66E-05 1.17E-04MH_02 Agg/Sand 4.039 0.00E+00 0.00E+00 0.00E+00 3.70E-05 9.27E-05 2.29E-04 4.66E-04 4.89E-04 6.01E-04 5.52E-04 4.03E-04 1.87E-04 6.01E-04MH_03 Recycled Concrete 0.709 0.00E+00 0.00E+00 0.00E+00 6.49E-06 1.63E-05 4.03E-05 8.18E-05 8.58E-05 1.06E-04 9.69E-05 7.07E-05 3.29E-05 1.06E-04MH_04 Aggregate/Sand 4.039 0.00E+00 0.00E+00 0.00E+00 3.70E-05 9.27E-05 2.29E-04 4.66E-04 4.89E-04 6.01E-04 5.52E-04 4.03E-04 1.87E-04 6.01E-04MH_05 RAP 0.788 0.00E+00 0.00E+00 0.00E+00 7.21E-06 1.81E-05 4.47E-05 9.09E-05 9.54E-05 1.17E-04 1.08E-04 7.86E-05 3.66E-05 1.17E-04DS_01 Dryer/Screens/Mixer 1245.000 0.00E+00 0.00E+00 0.00E+00 1.14E-02 2.86E-02 7.07E-02 1.44E-01 1.51E-01 1.85E-01 1.70E-01 1.24E-01 5.78E-02 1.85E-01BP_01 Silo Filling 70.307 0.00E+00 0.00E+00 0.00E+00 6.44E-04 1.61E-03 3.99E-03 8.11E-03 8.51E-03 1.05E-02 9.61E-03 7.01E-03 3.26E-03 1.05E-02BP_02 Load Out 15.658 0.00E+00 0.00E+00 0.00E+00 1.43E-04 3.60E-04 8.89E-04 1.81E-03 1.89E-03 2.33E-03 2.14E-03 1.56E-03 7.27E-04 2.33E-03RCC-03 Crushed Stone Sales 0.053 0.00E+00 0.00E+00 0.00E+00 4.88E-07 1.22E-06 3.02E-06 6.14E-06 6.45E-06 7.93E-06 7.28E-06 5.31E-06 2.47E-06 7.93E-06
Calculation of Scaling Factor
jan feb mar apr may june july aug sept oct nov dec0.00 0.00 0.00 0.06 0.15 0.38 0.77 0.81 1.00 0.92 0.67 0.310.00 0.00 0.00 0.06 0.15 0.38 0.77 0.81 1.00 0.92 0.67 0.310.00 0.00 0.00 0.06 0.15 0.38 0.77 0.81 1.00 0.92 0.67 0.310.00 0.00 0.00 0.06 0.15 0.38 0.77 0.81 1.00 0.92 0.67 0.310.00 0.00 0.00 0.06 0.15 0.38 0.77 0.81 1.00 0.92 0.67 0.310.00 0.00 0.00 0.06 0.15 0.38 0.77 0.81 1.00 0.92 0.67 0.310.00 0.00 0.00 0.06 0.15 0.38 0.77 0.81 1.00 0.92 0.67 0.310.00 0.00 0.00 0.06 0.15 0.38 0.77 0.81 1.00 0.92 0.67 0.310.00 0.00 0.00 0.06 0.15 0.38 0.77 0.81 1.00 0.92 0.67 0.31
jan feb mar apr may june july aug sept oct nov decMaximum # Days 31 28 31 30 31 30 31 31 30 31 30 31[kg/year] % Prod. 0.00% 0.00% 0.00% 1.19% 3.08% 7.36% 15.45% 16.21% 19.29% 18.30% 12.92% 6.21%
MH_01 RAP 0.477 0E+00 0E+00 0E+00 4E-06 1E-05 3E-05 6E-05 6E-05 7E-05 7E-05 5E-05 2E-05 7.10E-05MH_02 Agg/Sand 2.446 0E+00 0E+00 0E+00 2E-05 6E-05 1E-04 3E-04 3E-04 4E-04 3E-04 2E-04 1E-04 3.64E-04MH_03 Recycled Concrete 0.355 0E+00 0E+00 0E+00 3E-06 8E-06 2E-05 4E-05 4E-05 5E-05 5E-05 4E-05 2E-05 5.28E-05MH_04 Aggregate/Sand 2.446 0E+00 0E+00 0E+00 2E-05 6E-05 1E-04 3E-04 3E-04 4E-04 3E-04 2E-04 1E-04 3.64E-04MH_05 RAP 0.477 0E+00 0E+00 0E+00 4E-06 1E-05 3E-05 6E-05 6E-05 7E-05 7E-05 5E-05 2E-05 7.10E-05DS_01 Dryer/Screens/Mixer 753.887 0E+00 0E+00 0E+00 7E-03 2E-02 4E-02 9E-02 9E-02 1E-01 1E-01 8E-02 3E-02 1.12E-01BP_01 Silo Filling 42.573 0E+00 0E+00 0E+00 4E-04 1E-03 2E-03 5E-03 5E-03 6E-03 6E-03 4E-03 2E-03 6.34E-03BP_02 Load Out 9.481 0E+00 0E+00 0E+00 9E-05 2E-04 5E-04 1E-03 1E-03 1E-03 1E-03 9E-04 4E-04 1.41E-03RCC-03 Crushed Stone Sales 0.027 0E+00 0E+00 0E+00 2E-07 6E-07 2E-06 3E-06 3E-06 4E-06 4E-06 3E-06 1E-06 3.96E-06
Calculation of Scaling Factor0.00 0.00 0.00 0.06 0.15 0.38 0.77 0.81 1.00 0.92 0.67 0.310.00 0.00 0.00 0.06 0.15 0.38 0.77 0.81 1.00 0.92 0.67 0.310.00 0.00 0.00 0.06 0.15 0.38 0.77 0.81 1.00 0.92 0.67 0.310.00 0.00 0.00 0.06 0.15 0.38 0.77 0.81 1.00 0.92 0.67 0.310.00 0.00 0.00 0.06 0.15 0.38 0.77 0.81 1.00 0.92 0.67 0.310.00 0.00 0.00 0.06 0.15 0.38 0.77 0.81 1.00 0.92 0.67 0.310.00 0.00 0.00 0.06 0.15 0.38 0.77 0.81 1.00 0.92 0.67 0.310.00 0.00 0.00 0.06 0.15 0.38 0.77 0.81 1.00 0.92 0.67 0.310.00 0.00 0.00 0.06 0.15 0.38 0.77 0.81 1.00 0.92 0.67 0.31
Description
Maximum
Emission
Rate (g/s)Source ID
Maximum
Emission
Rate (g/s)Source ID Description
30 * 12 * 36000.788 [kg/year] * 1000 * 7.36%
days per month * 12 hours per day * 3600 seconds per hourAnnual Emission Rate [kg/year] * 1000 [g/kg] * Month Production Percentage [%]

12-1151-0213
POINT SOURCES
Source ID Descriptionx
[UTM]
y
[UTM]
Stack Height
Above Grade
[m]
Elevation
Stack Inner
Diameter
[m]
Stack Exit
Velocity
[m/s]
Stack Exit
Gas
Temperature
[°C]
Stack
Volumetric
Flow Rate
[m³/s]
Stack Height
Above Roof
[m]
Average
[g/s]
Max
[g/s]
DS_01 Asphalt Plant Dryer Stack 603756.50 4808481.40 15.2 99.07 1.2 22.55 418.15 25.50 — 1.12E-01 1.85E-01CS_01 Asphalt Plant Heater 603721.80 4808504.00 3.3 99.45 0.35 36.07 418.15 3.47 1.3 2.25E-03 2.82E-03
VOLUME SOURCES
Volume Emission Rates
Source ID Description x yRelease
HeightElevation Initial Lateral
Initial
VerticalLength Width
Average
[g/s]
Max
[g/s]
BP_01 Silo Filling and Loadout 603722.40 4808484.20 16.5 99.19 2.093 7.69 9 9 7.75E-03 1.28E-02MH_01 Rap Delivery 603682.70 4808483.00 1.5 100.24 0.70 2.74 3 3 7.10E-05 1.17E-04MH_02A Aggregate and Sand Delivery 603766.80 4808509.40 1.5 98.08 0.70 2.74 3 3 7.28E-05 1.20E-04MH_02B Aggregate and Sand Delivery 603731.90 4808532.20 1.5 99.20 0.70 2.74 3 3 7.28E-05 1.20E-04MH_02C Aggregate and Sand Delivery 603782.90 4808485.60 1.5 98.06 0.70 2.74 3 3 7.28E-05 1.20E-04MH_02d Aggregate and Sand Delivery 603749.40 4808514.60 1.5 99.02 0.70 2.74 3 3 7.28E-05 1.20E-04MH_02e Aggregate and Sand Delivery 603791.20 4808469.20 1.5 98.58 0.70 2.74 3 3 7.28E-05 1.20E-04MH_03 Recycled Concrete Delivery 603681.60 4808441.20 1.5 100.73 0.70 2.74 3 3 5.28E-05 1.06E-04MH_04a BP Feed Hopper 603764.50 4808473.00 5.0 99.0 0.70 2.79 3 3 1.21E-04 2.00E-04MH_04b BP Feed Hopper 603769.30 4808470.00 5.0 99.0 0.70 2.79 3 3 1.21E-04 2.00E-04MH_04c BP Feed Hopper 603774.00 4808467.00 5.0 99.0 0.70 2.79 3 3 1.21E-04 2.00E-04MH_05 RAP Feed Hopper 603710.00 4808505.30 3.8 99.7 0.70 2.33 3 3 7.10E-05 1.17E-04RC_01 Recycle Crushing Plant - Concrete 603658.80 4808415.60 5 101.04 2.326 2.33 10.0 10.0 9.05E-03 9.12E-03RC_03 Recycle Crushing Plant - RAP 603658.40 4808480.00 5.0 101.0 2.326 2.33 10.0 10.0 9.05E-03 9.12E-03VS_01 Shop (1) 603620.40 4808422.20 10.7 102.0 6.05 4.98 26.0 26.0 6.44E-04 8.06E-04VS_02 Shop (2) 603589.90 4808429.30 10.7 102.3 6.05 4.98 26.0 26.0 6.44E-04 8.06E-04Note: The emission rates listed are based on the maximum monthly emission rate. The actual modelled emission rates were based on a variable emission file.
CALPUFF
MODELLINGMODEL INPUT PARAMETERS
Emission RatesStack Parameters
N:\Active\2012\1151\12-1151-0213 DCC - Oakville ByLay - Oakville\Calculations\12-1151-0213 DCC Oakville Bylaw Final Calculations Revision 2Made By: TMH
Checked By: LAB

BRONTE ASPHALT PLANT HPAQB APPLICATION FOR APPROVAL
April 2013 Report No. 12-1151-0213
APPENDIX D CALPUFF Model Files (on CD)

Golder Associates Ltd. 6925 Century Avenue, Suite #100 Mississauga, Ontario, L5N 7K2 Canada T: +1 (905) 567 4444