11B Topic 4_2. Model Find the exact value of: (a) (b) (c) We are now familiar with the Unit Circle,...
47
11B Topic 4_2
-
Upload
melvin-bradford -
Category
Documents
-
view
213 -
download
0
Transcript of 11B Topic 4_2. Model Find the exact value of: (a) (b) (c) We are now familiar with the Unit Circle,...

11B Topic 4_2
ModelFind the exact value of: (a)
(b)
(c)
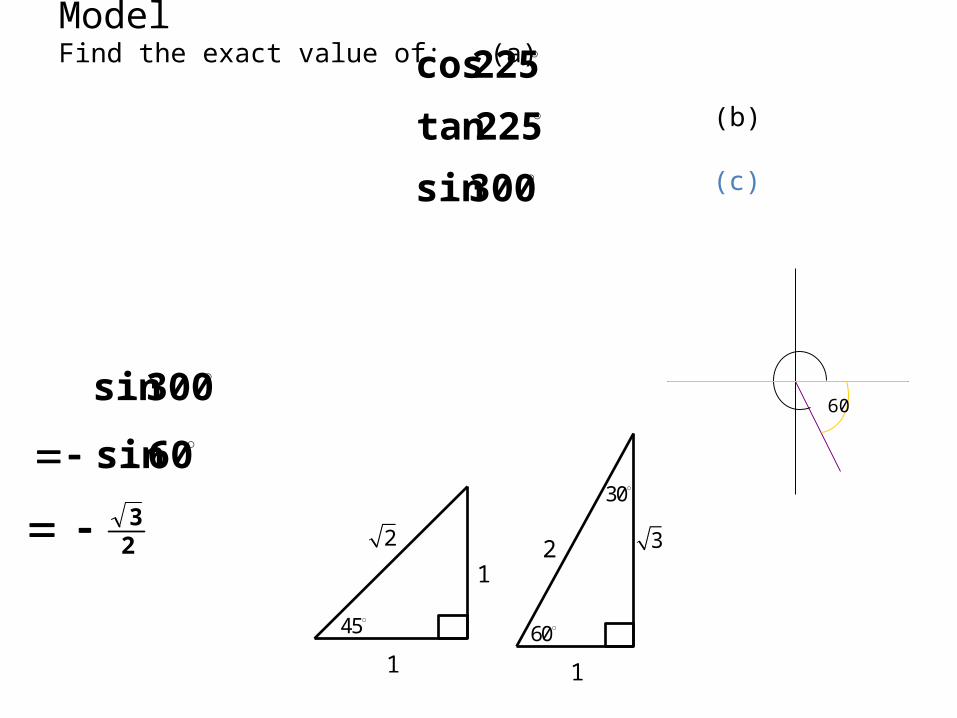
300sin
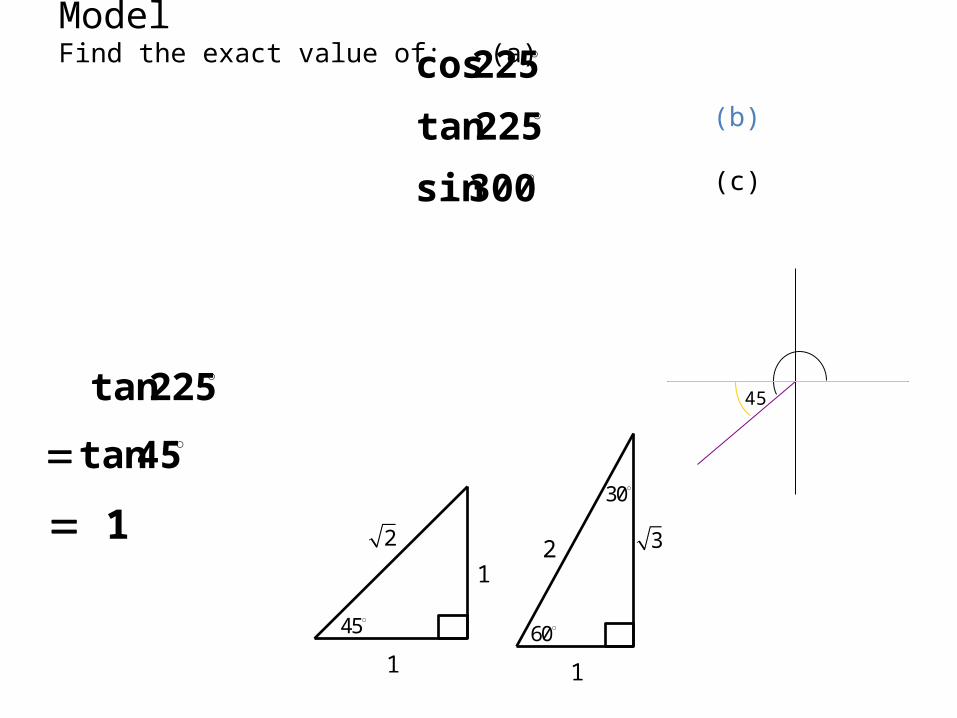
225tan
225cos
We are now familiar with the Unit Circle, but to answer these questions we will
need to use the Unit Triangles as well…
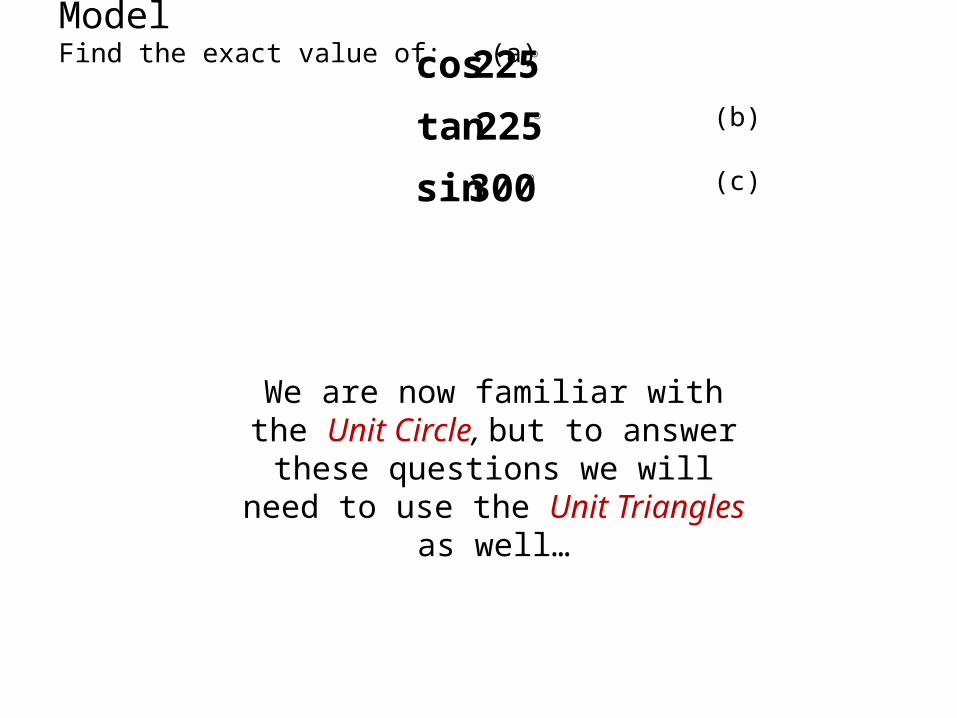
45
1
1
2
1sin 45
21
cos 452
tan 45 1
60
30
1
2 3
3sin 60
21
cos602
tan 60 3
1sin 30
2
3cos30
21
tan 303
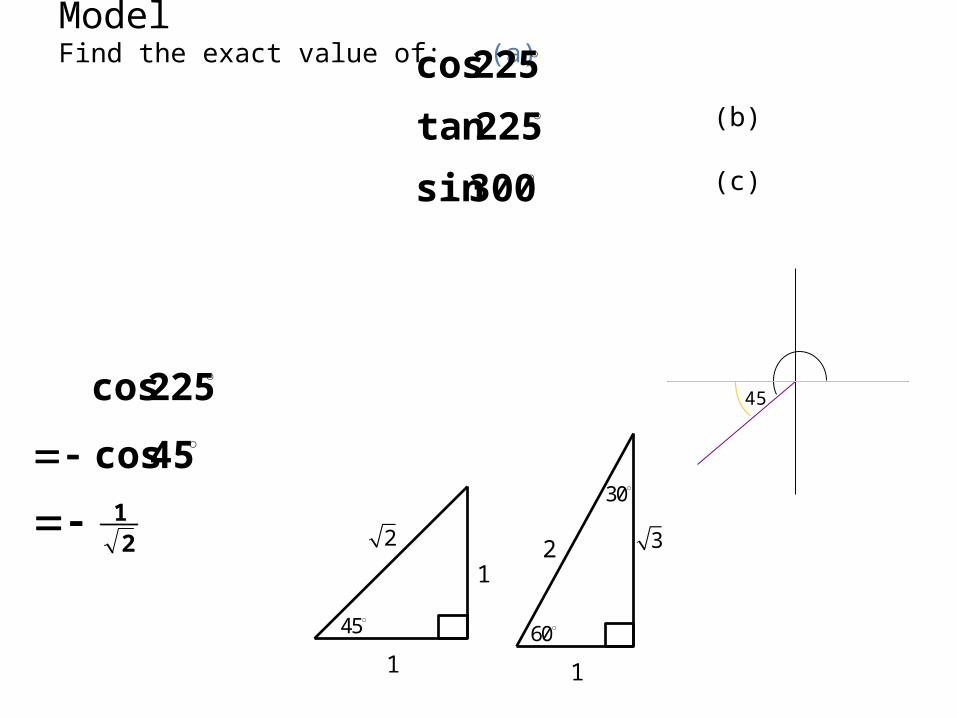
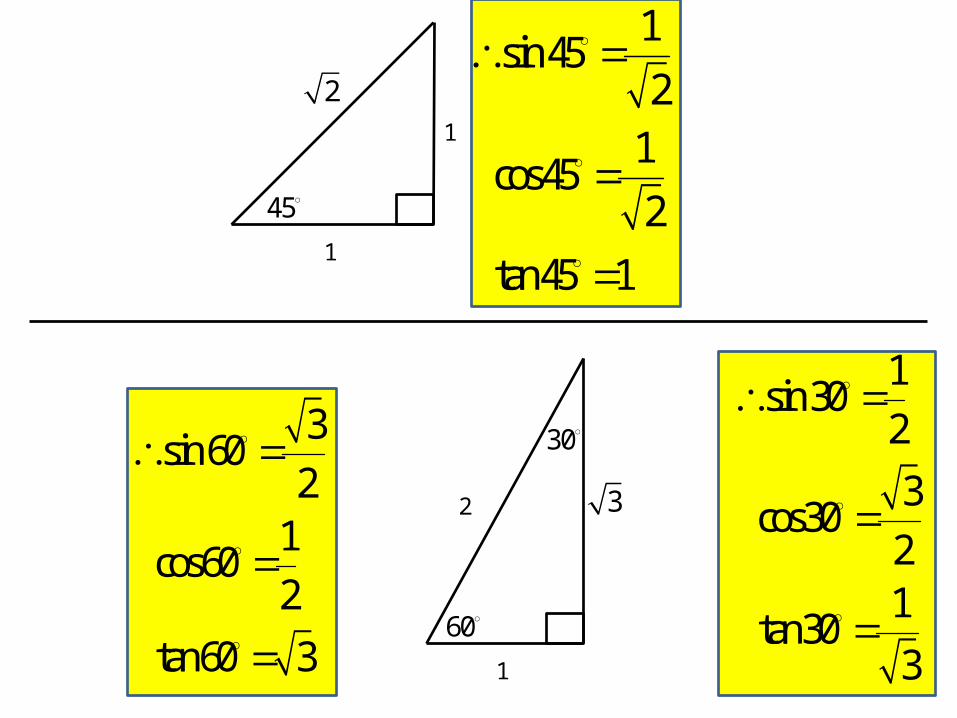
ModelFind the exact value of: (a)
(b)
(c)
300sin
225tan
225cos
225cos45cos
21
45
45
1
1
2
60
30
1
2 3
ModelFind the exact value of: (a)
(b)
(c)
300sin
225tan
225cos
225tan45tan
1
45
45
1
1
2
60
30
1
2 3
ModelFind the exact value of: (a)
(b)
(c)
300sin
225tan
225cos
300sin60sin
23
60
45
1
1
2
60
30
1
2 3
Now let’s do the same again, using radians
Scootle: 11 Maths B folder• Topic 4 (PWJXSR)• Trig Radians
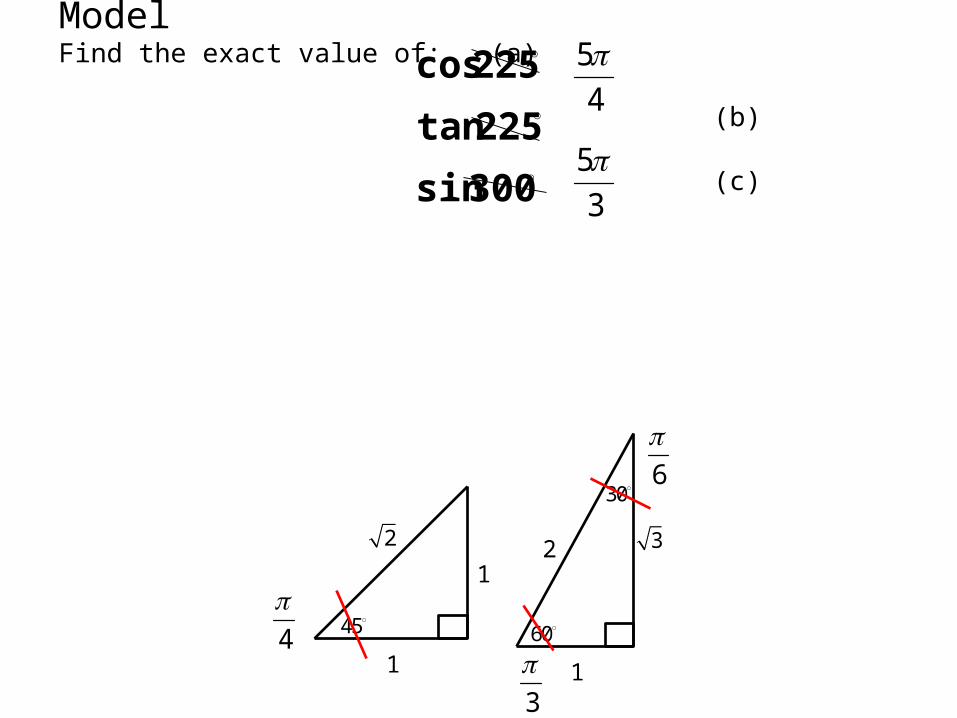
ModelFind the exact value of: (a)
(b)
(c)
300sin
225tan
225cos4
5
3
5
45
1
1
2
60
30
1
2 3
4
6
3
ModelFind the exact value of: (a)
(b)
(c)
3
5sin
4
5tan
4
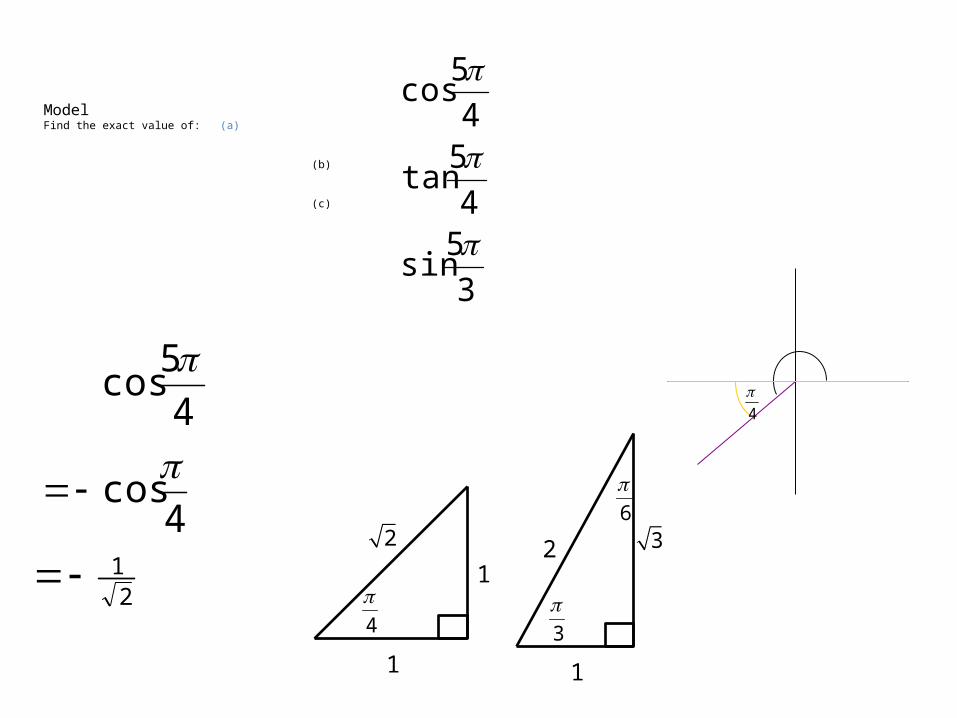
5cos
4
5cos
4cos
21
4
1
1
2
1
2 3
4
6
3
ModelFind the exact value of: (a)
(b)
(c)
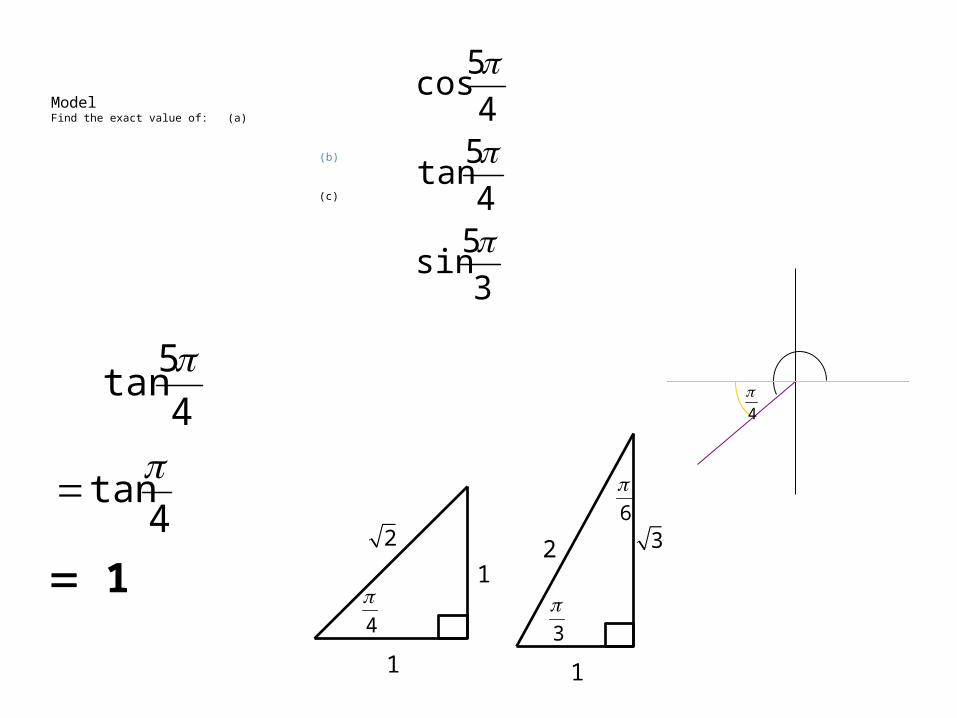
4
5tan
4tan
1
3
5sin
4
5tan
4
5cos
4
1
1
2
1
2 3
4
6
3
ModelFind the exact value of: (a)
(b)
(c)
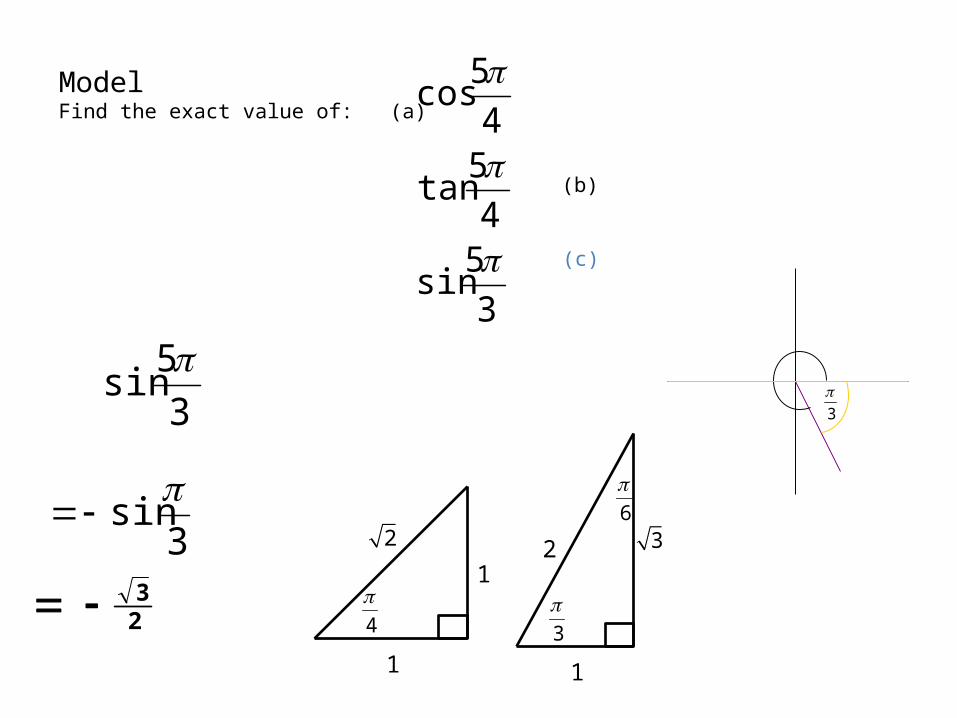
3
5sin
3sin
23
3
5sin
4
5tan
4
5cos
3
1
1
2
1
2 3
4
6
3
Exercise
NewQ P 307 Set 9.2
Numbers 1, 2, 8-11
For Homework, look at…Scootle: 11 Maths B folder• Topic 4 (PWJXSR)• Trig degrees• Trig radians
For Homework, look at…Scootle: 11 Maths B folder• Topic 4 (PWJXSR)• Trigonometry: assessment
You should now be familiar with the general shape of the three major trignometric graphs
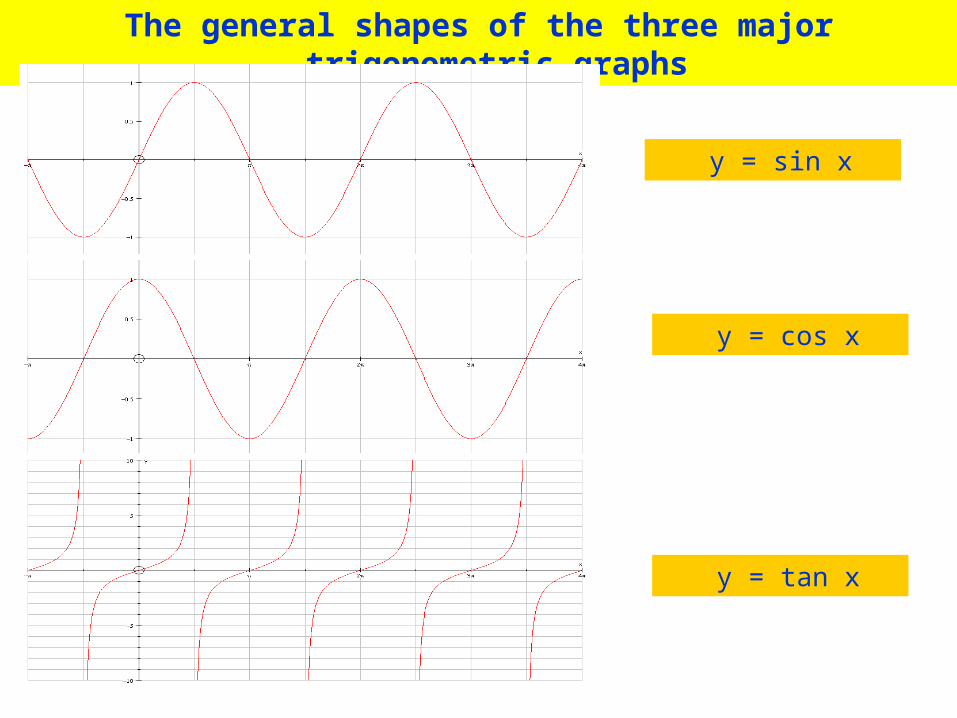
The general shapes of the three major trigonometric graphs
y = sin x
y = cos x
y = tan x

5. Significance of the constants A,B and D on the graphs of…
y = A sin[B(x + C)] + D
y = A cos[B(x + C) ]+ D
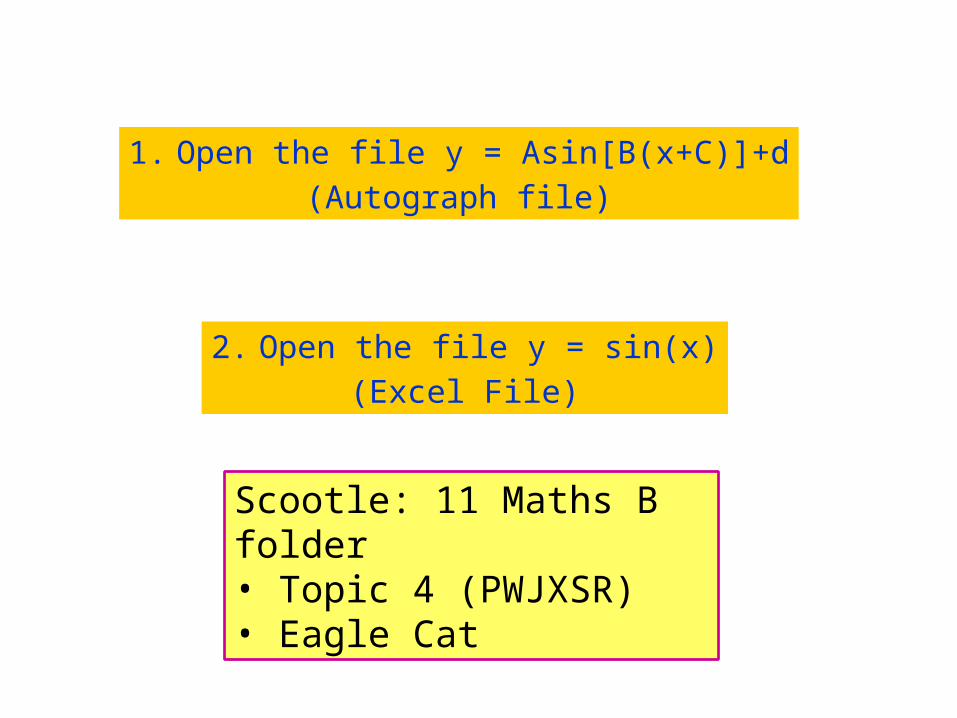
2. Open the file y = sin(x)(Excel File)
Scootle: 11 Maths B folder• Topic 4 (PWJXSR)• Eagle Cat
1. Open the file y = Asin[B(x+C)]+d(Autograph file)
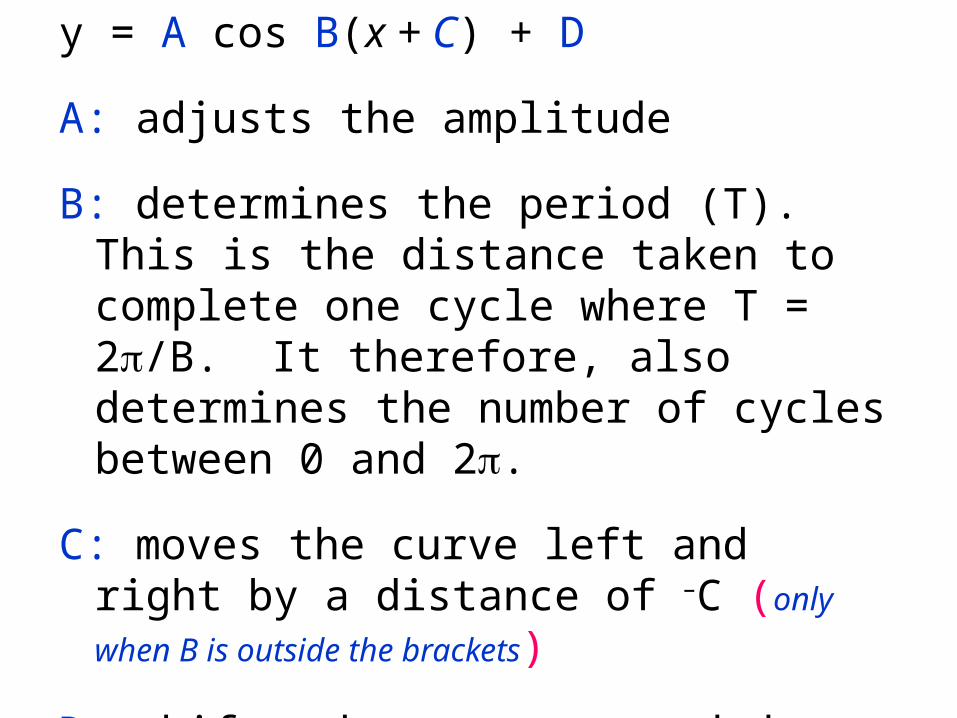
y = A cos B(x + C) + D
A: adjusts the amplitude
B: determines the period (T). This is the distance taken to complete one cycle where T = 2/B. It therefore, also determines the number of cycles between 0 and 2.
C: moves the curve left and right by a distance of –C (only when B is outside the brackets)
D: shifts the curve up and down the y-axis
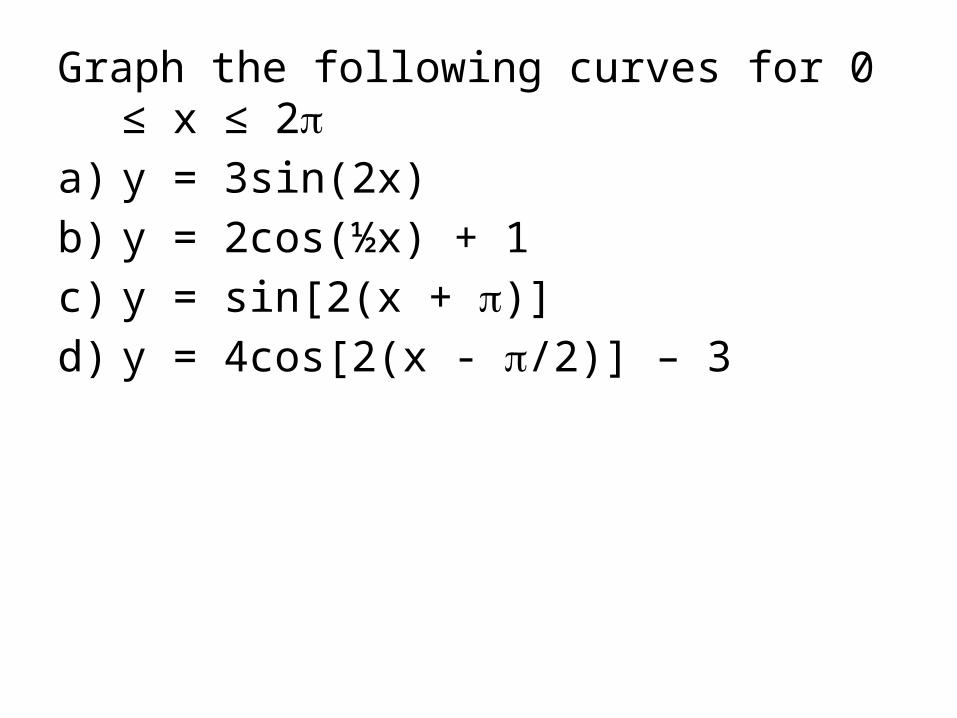
Graph the following curves for 0 ≤ x ≤ 2a) y = 3sin(2x)b) y = 2cos(½x) + 1c) y = sin[2(x + )]d) y = 4cos[2(x - /2)] – 3

Exercise
NewQ P 318 Set 9.4 1 - 6
6. Applications of periodic functions
Challenge Question (1)
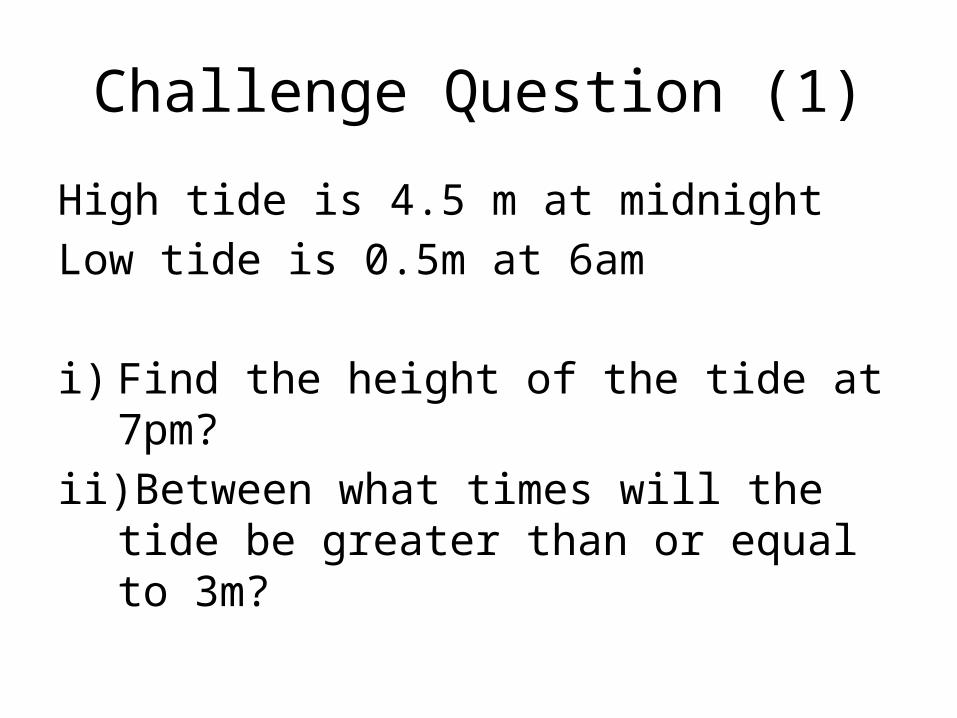
High tide is 4.5 m at midnightLow tide is 0.5m at 6am
i) Find the height of the tide at 7pm?ii) Between what times will the tide be greater
than or equal to 3m?
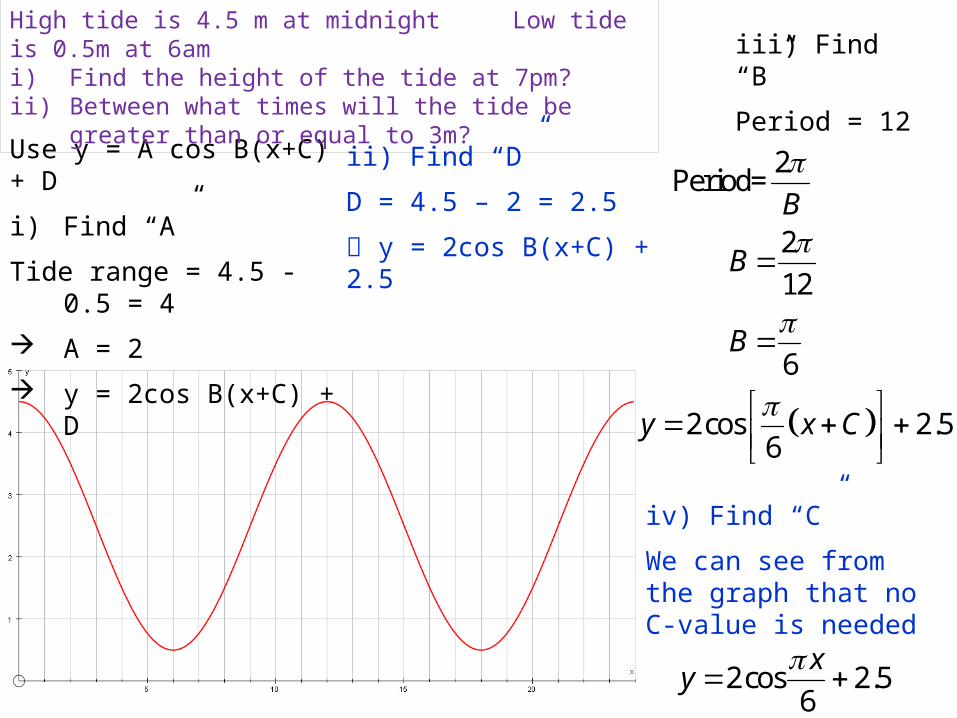
Use y = A cos B(x+C) + D
i) Find “A”
Tide range = 4.5 - 0.5 = 4
A = 2
y = 2cos B(x+C) + D
iii) Find “B”
Period = 12
ii) Find “D”
D = 4.5 – 2 = 2.5
y = 2cos B(x+C) + 2.5
2Period=
2
12
6
2cos 2.56
B
B
B
y x C
iv) Find “C”
We can see from the graph that no C-value is needed
High tide is 4.5 m at midnight Low tide is 0.5m at 6ami) Find the height of the tide at 7pm?ii) Between what times will the tide be greater than or equal
to 3m?
2cos 2.56
xy
2cos 2.56
xy
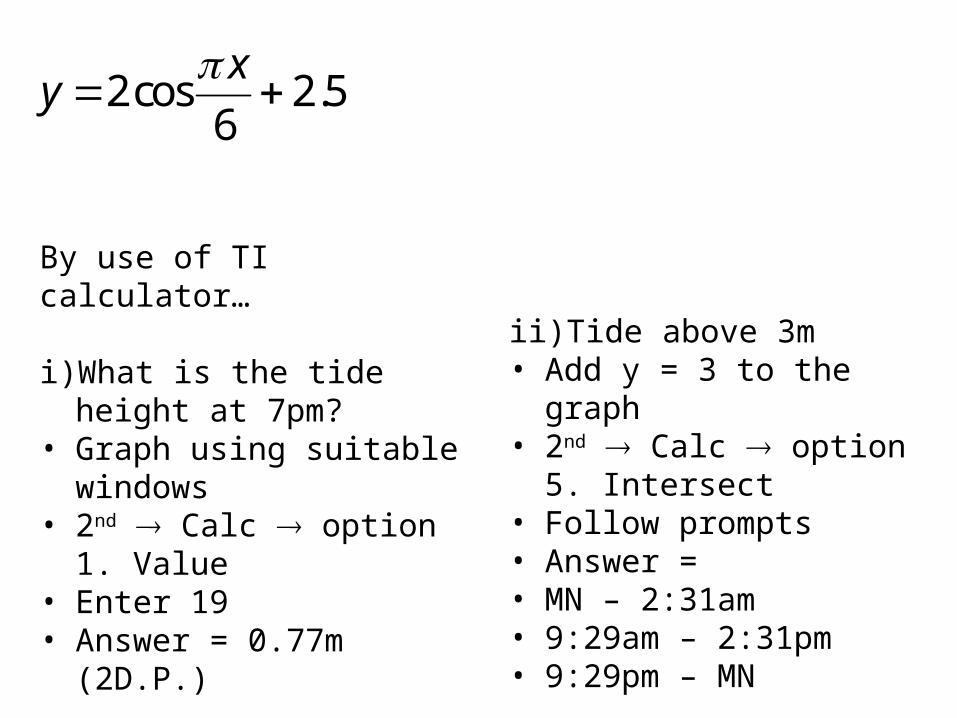
By use of TI calculator…
i) What is the tide height at 7pm?
• Graph using suitable windows• 2nd Calc option 1. Value• Enter 19• Answer = 0.77m (2D.P.)
ii) Tide above 3m• Add y = 3 to the graph• 2nd Calc option 5. Intersect• Follow prompts• Answer = • MN – 2:31am • 9:29am – 2:31pm• 9:29pm – MN
Challenge Question (2)
High tide of 4.2m occurs in a harbor at 4am Tuesday and the following low tide of 0.8m occurs 6¼ hours later. If a ship entering the harbor needs a minimum depth of water of 3m, what times on Tuesday can this vessel enter?
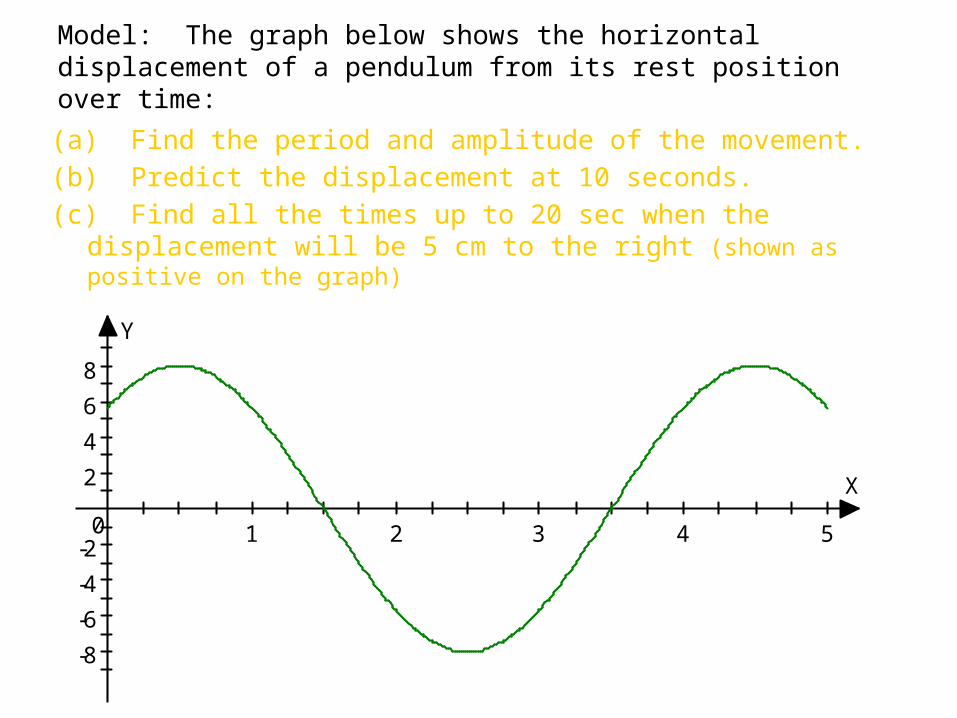
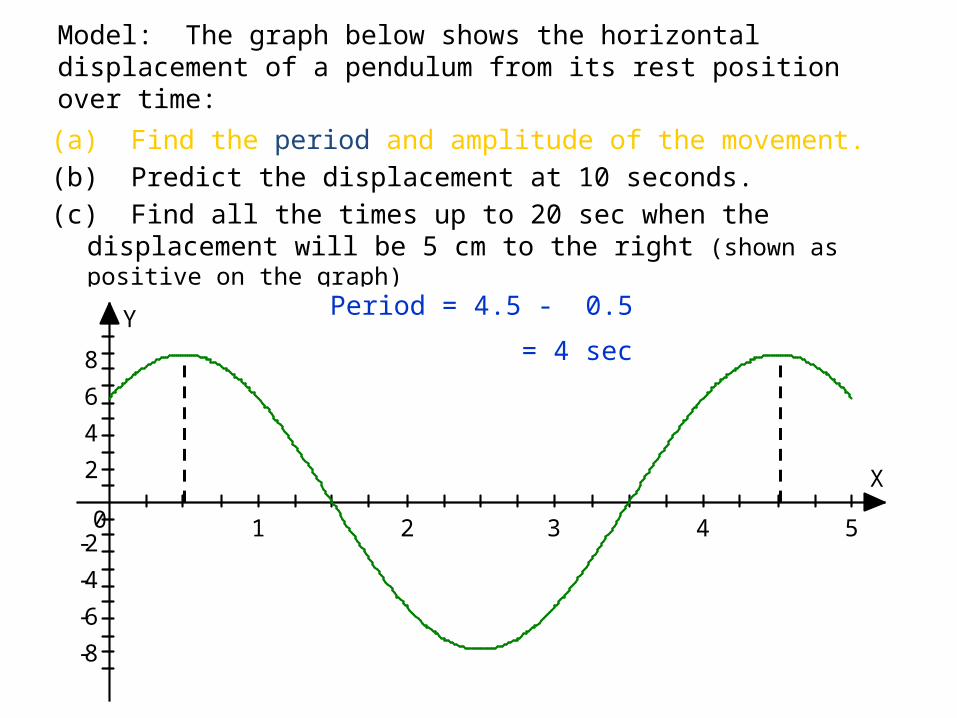
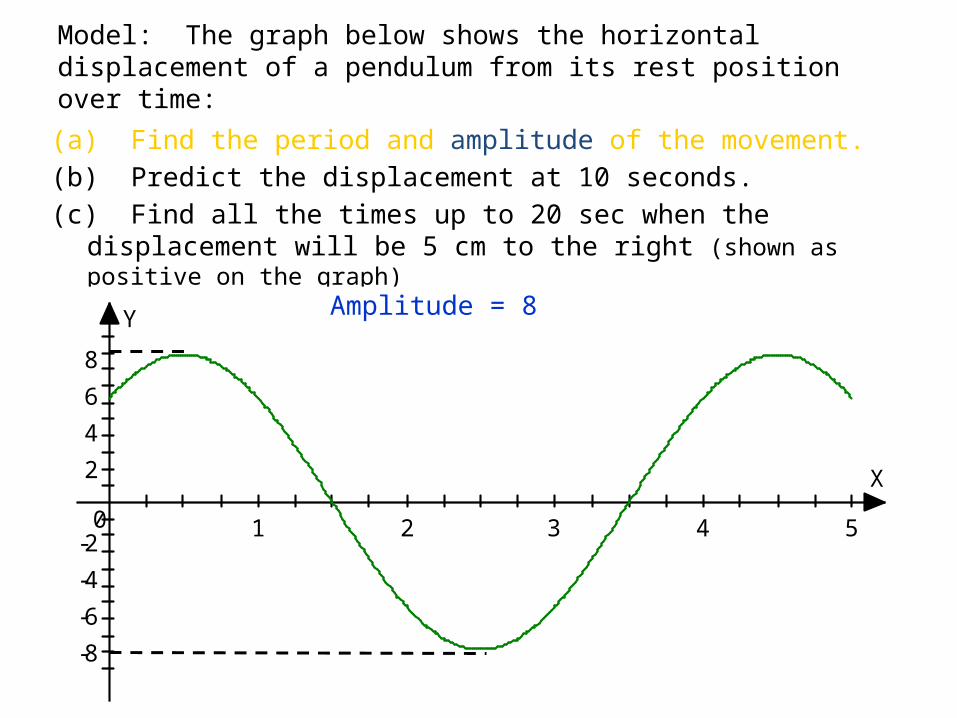
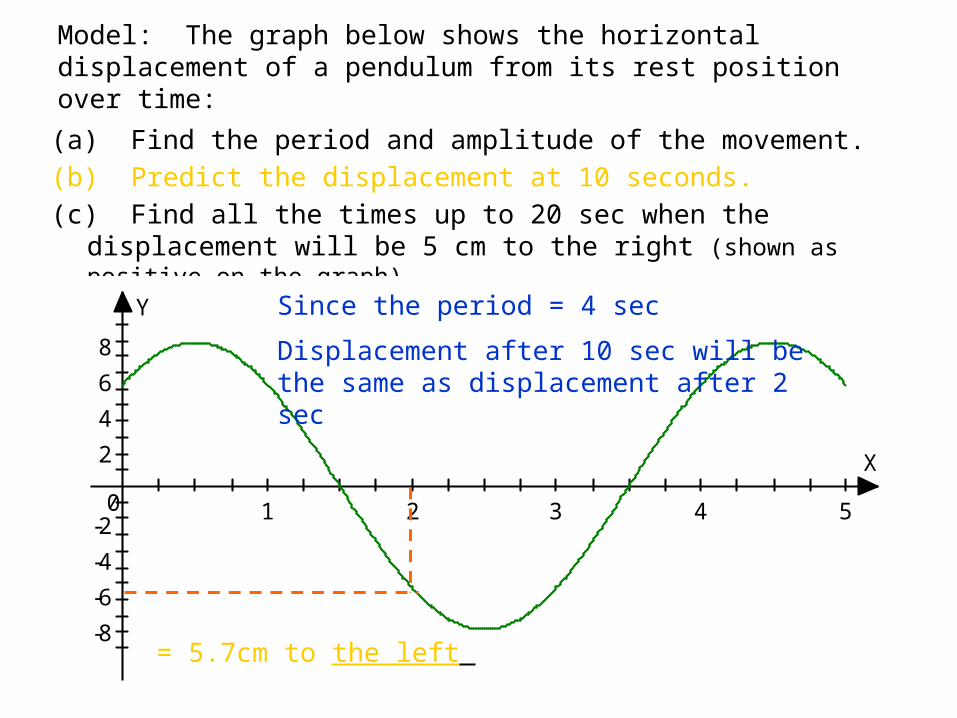
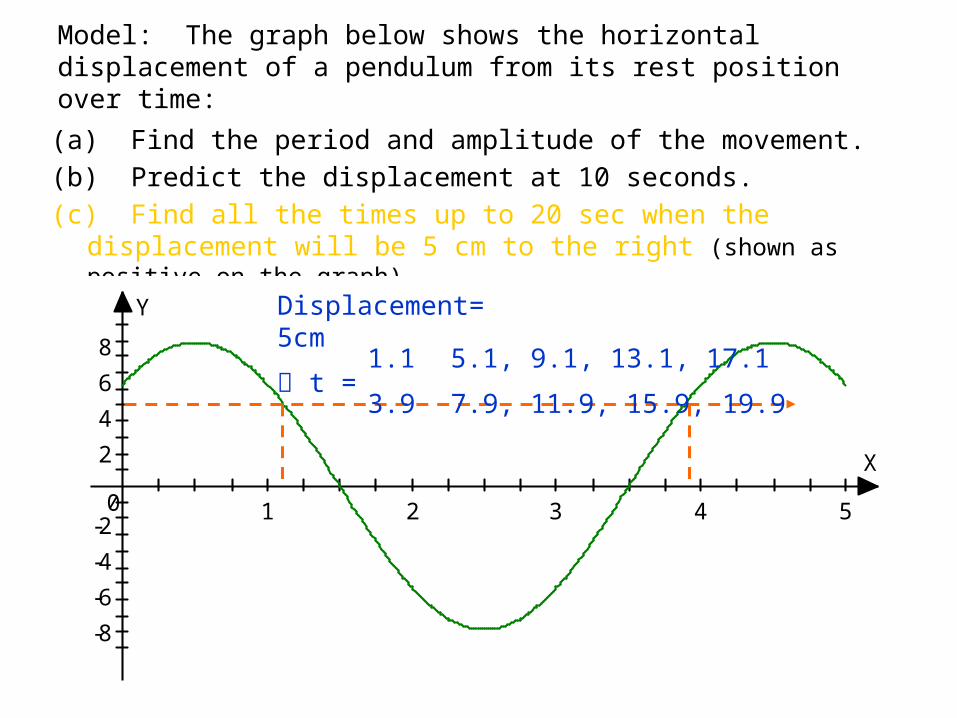
Model: The graph below shows the horizontal displacement of a pendulum from its rest position over time:
(a) Find the period and amplitude of the movement.(b) Predict the displacement at 10 seconds.(c) Find all the times up to 20 sec when the displacement will be 5 cm to the
right (shown as positive on the graph)
X
Y
1 2 3 4 5
-8
-6
-4
-2
2
4
6
8
0
Period = 4.5 - 0.5
= 4 sec
Model: The graph below shows the horizontal displacement of a pendulum from its rest position over time:
(a) Find the period and amplitude of the movement.(b) Predict the displacement at 10 seconds.(c) Find all the times up to 20 sec when the displacement will be 5 cm to the
right (shown as positive on the graph)
X
Y
1 2 3 4 5
-8
-6
-4
-2
2
4
6
8
0
Amplitude = 8
Model: The graph below shows the horizontal displacement of a pendulum from its rest position over time:
(a) Find the period and amplitude of the movement.(b) Predict the displacement at 10 seconds.(c) Find all the times up to 20 sec when the displacement will be 5 cm to the
right (shown as positive on the graph)
X
Y
1 2 3 4 5
-8
-6
-4
-2
2
4
6
8
0
Since the period = 4 sec
Displacement after 10 sec will be the same as displacement after 2 sec
= 5.7cm to the left
Model: The graph below shows the horizontal displacement of a pendulum from its rest position over time:
(a) Find the period and amplitude of the movement.(b) Predict the displacement at 10 seconds.(c) Find all the times up to 20 sec when the displacement will be 5 cm to the
right (shown as positive on the graph)
X
Y
1 2 3 4 5
-8
-6
-4
-2
2
4
6
8
0
Displacement= 5cm
t = 1.1
3.9 7.9, 11.9, 15.9, 19.9
5.1, 9.1, 13.1, 17.1

Exercise
NewQ P 179 Set 5.2 1,3

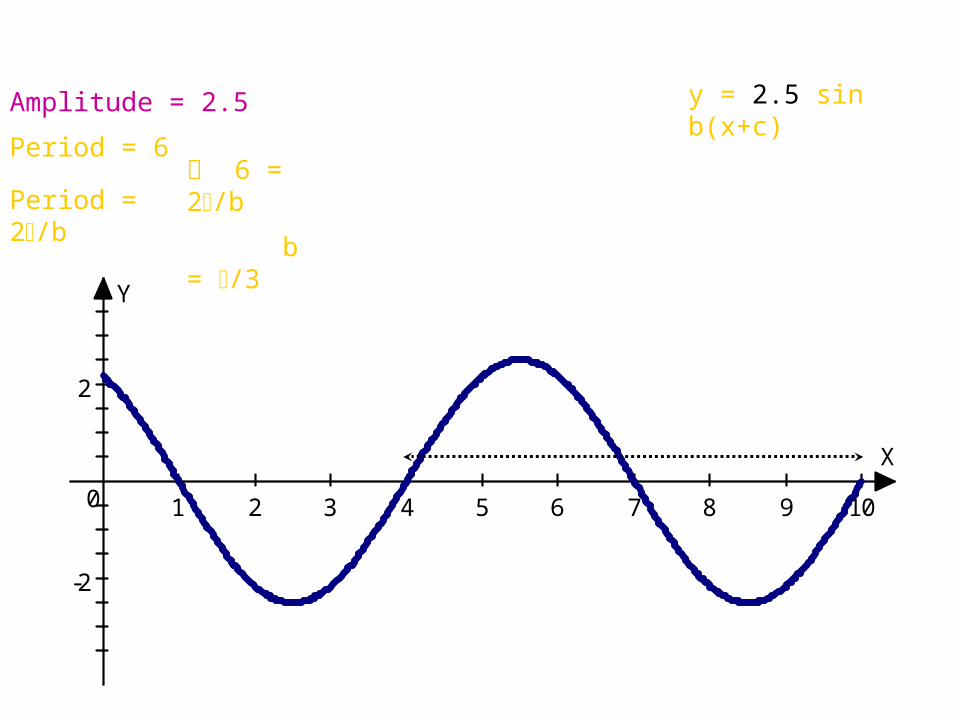
Model: Find the equation of the curve below.
X
Y
1 2 3 4 5 6 7 8 9 10
-2
2
0
Amplitude = 2.5 y = a sin b(x+c)
Model: Find the equation of the curve below.
X
Y
1 2 3 4 5 6 7 8 9 10
-2
2
0
Amplitude = 2.5 y = 2.5 sin b(x+c)
Period = 6
Period = 2/b 6 = 2/b
b = /3
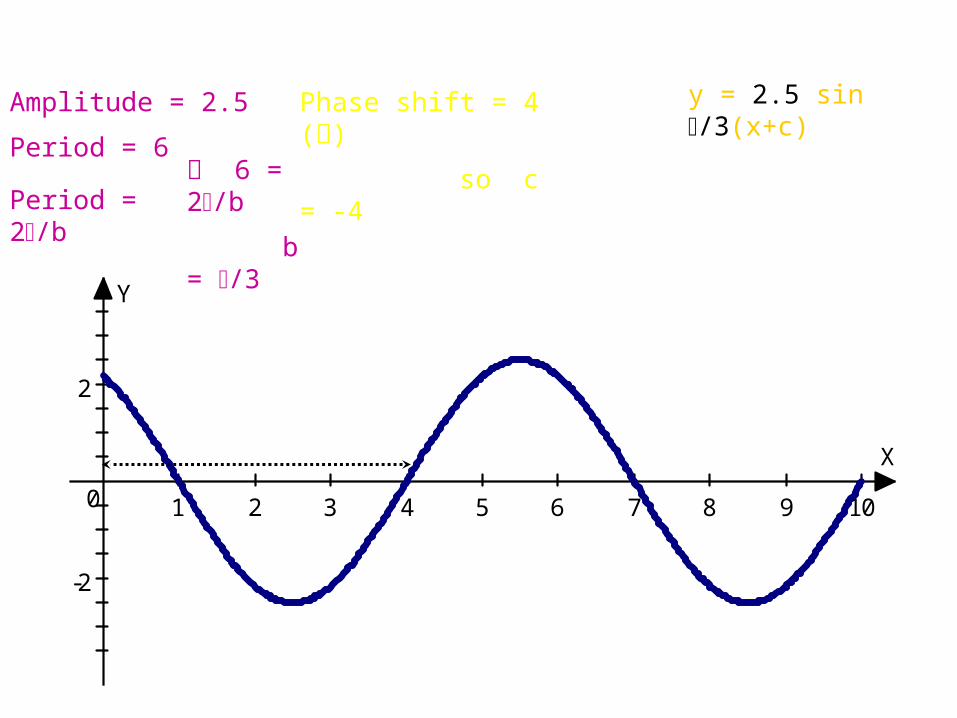
Model: Find the equation of the curve below.
X
Y
1 2 3 4 5 6 7 8 9 10
-2
2
0
Amplitude = 2.5 y = 2.5 sin /3(x+c)
Period = 6
Period = 2/b 6 = 2/b
b = /3
Phase shift = 4 ()
so c = -4
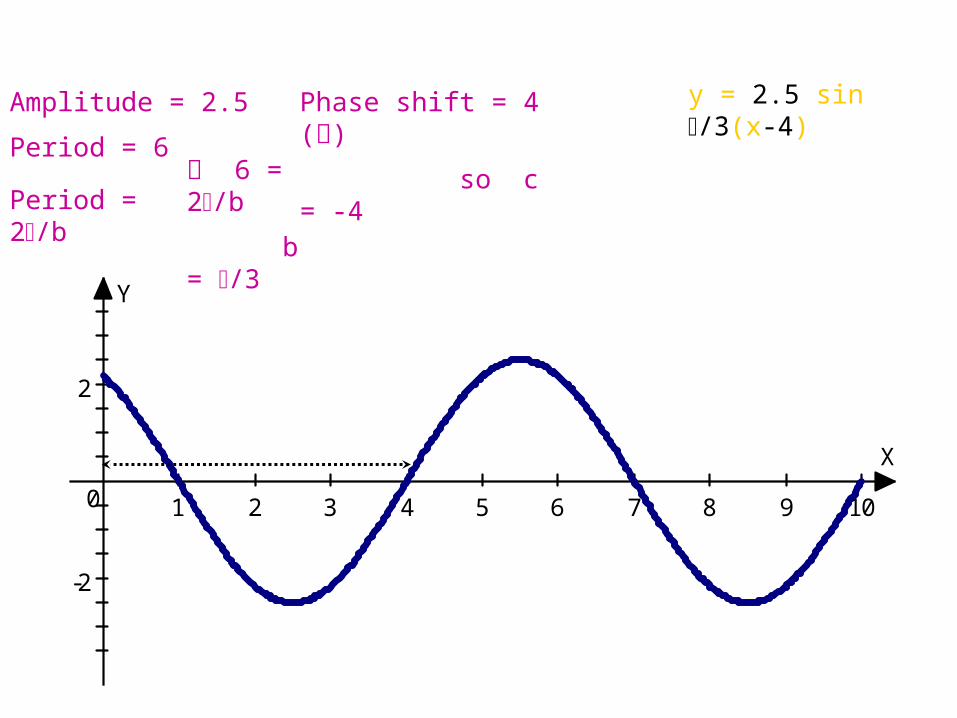
Model: Find the equation of the curve below.
X
Y
1 2 3 4 5 6 7 8 9 10
-2
2
0
Amplitude = 2.5 y = 2.5 sin /3(x-4)
Period = 6
Period = 2/b 6 = 2/b
b = /3
Phase shift = 4 ()
so c = -4
Exercise
NewQ P 183 Set 5.3 1,4
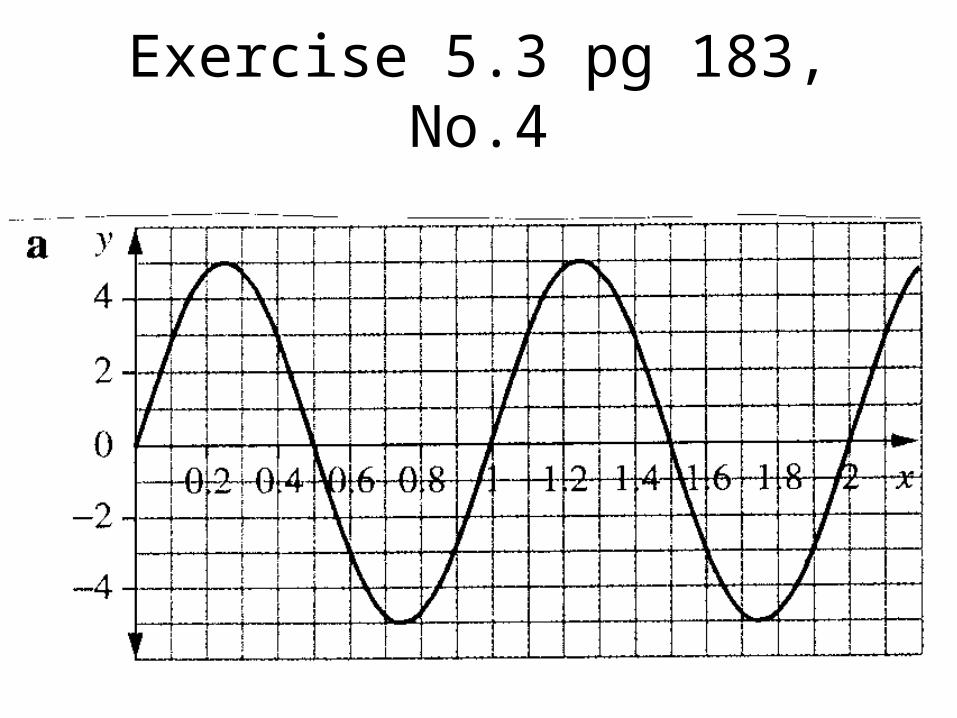
Exercise 5.3 pg 183, No.4
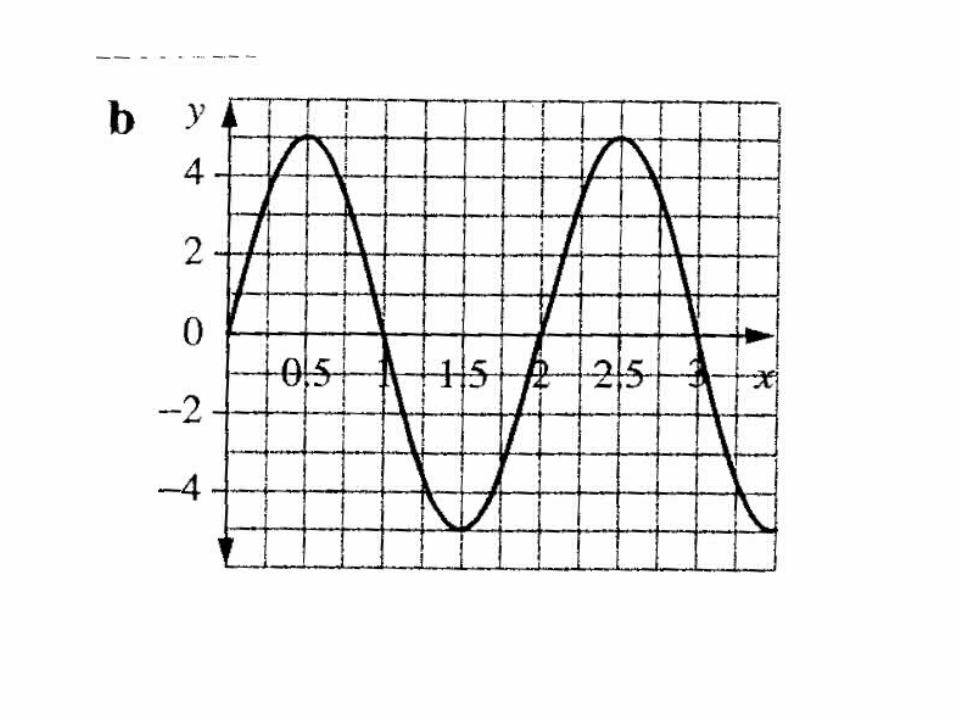
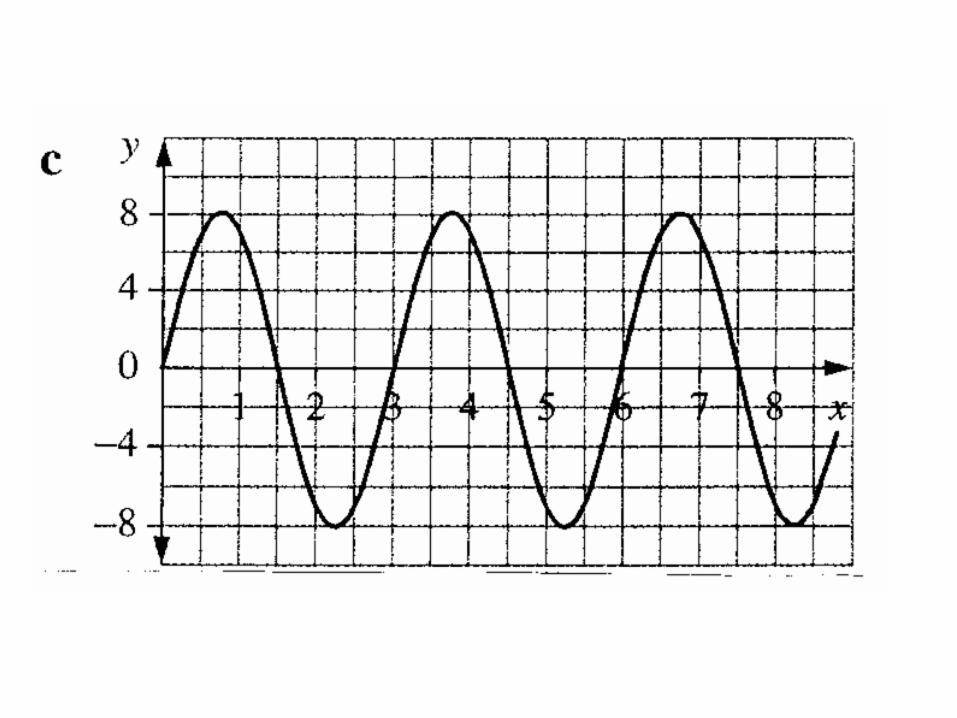

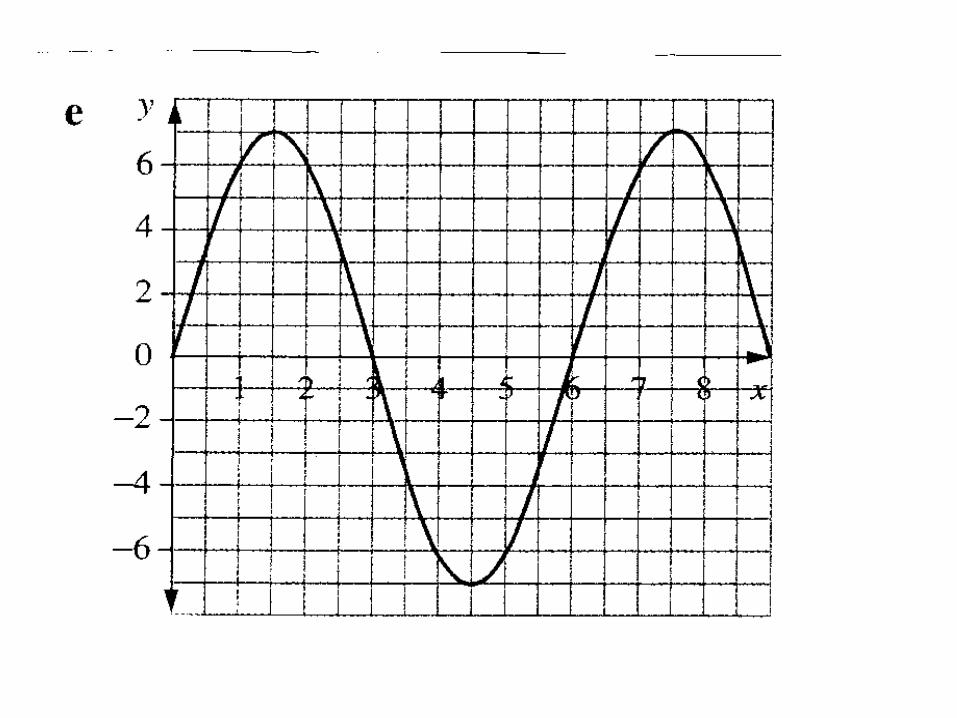


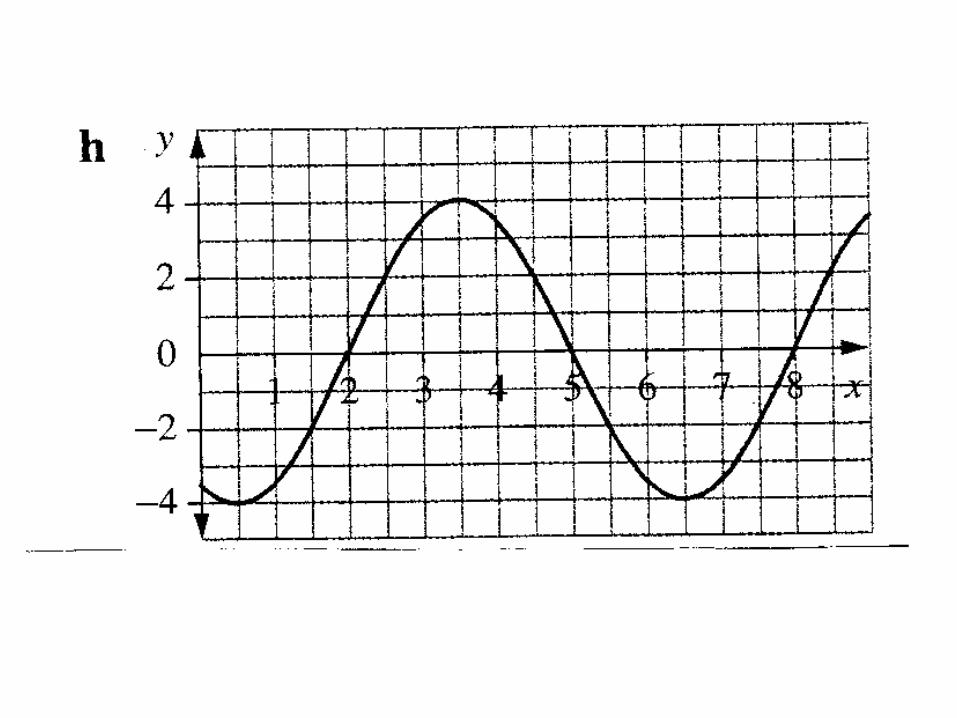

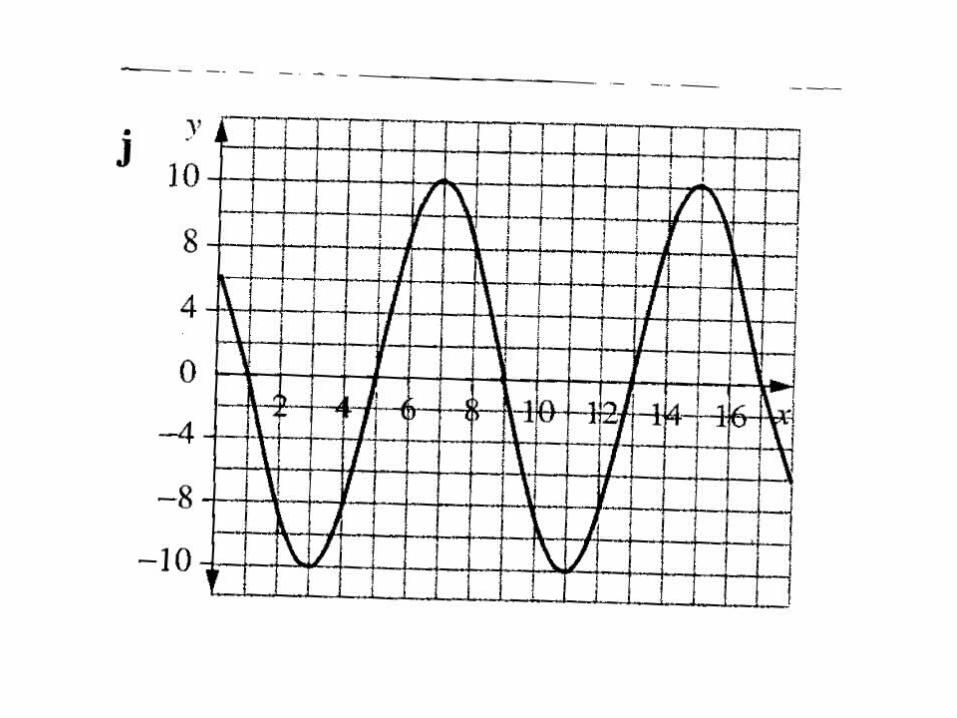
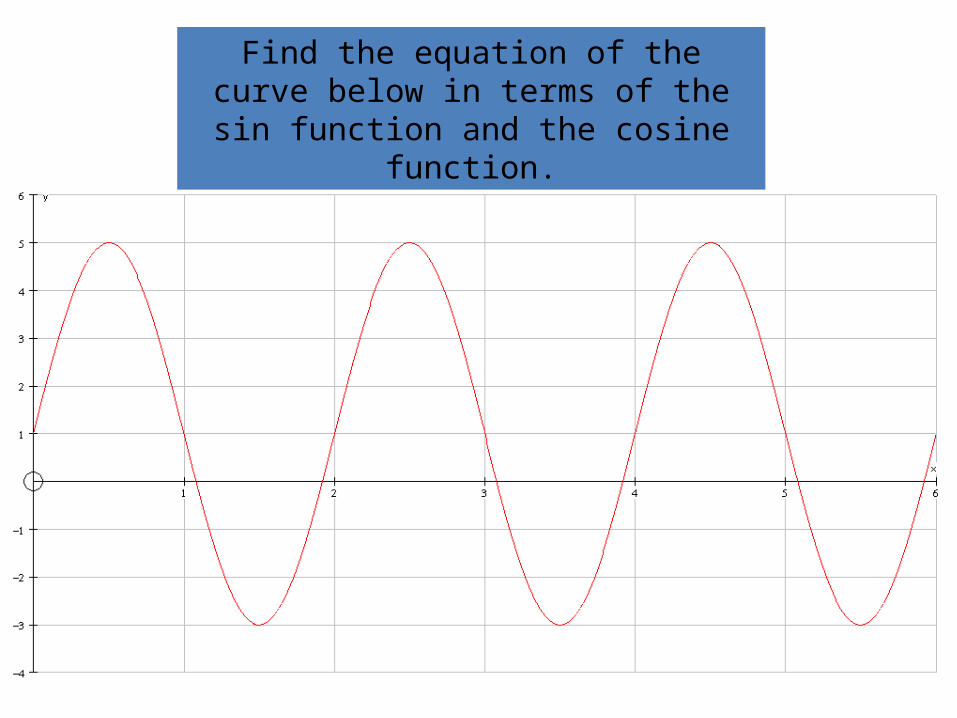
Find the equation of the curve below in terms of the sin function and the cosine
function.