1.1 INTRODUCTION - a reservoir of Indian...
21
1 1.1 INTRODUCTION The history of textiles and garments in India dates back to the use of cynical dyes and printing blocks around 3000 BC. The diversity of fibres found in India, complex weaving on its state-of-art manual looms and its organic dyes attracted buyers from all over the world for centuries. The British colonization of India and its industrial policies destroyed the innovative eco-system and left it technologically destitute. Independent India saw the building up of textile capabilities, diversification of its product base, and its emergence, once again, as an important global player (Pankaj Chandra 2006). Today, the textile and garment sector employs 35.0 million people and is the 2nd largest employer, generates 1/5th of the total export earnings and contributes 4 per cent to the GDP thereby making it the largest industrial sector of the country. This textile economy is worth US $37 bn and its share of the global market is about 5.90 per cent. The sector aspires to grow its revenue to US $85bn, its export value to US $50bn and employment to 12 million by the year 2010 (Texmin 2005). It is estimated that there exist around 68,000 garment units in the organized sector, of which about 88 per cent are for woven cloth while the remaining are for knits. However, only 30–40 units are large in size. While these firms are spread all over the country, there are clusters emerging in the National Capital Region (NCR),
Transcript of 1.1 INTRODUCTION - a reservoir of Indian...

1
1.1 INTRODUCTION
The history of textiles and garments in India dates back to the use of cynical dyes
and printing blocks around 3000 BC. The diversity of fibres found in India,
complex weaving on its state-of-art manual looms and its organic dyes attracted
buyers from all over the world for centuries. The British colonization of India and
its industrial policies destroyed the innovative eco-system and left it
technologically destitute. Independent India saw the building up of textile
capabilities, diversification of its product base, and its emergence, once again, as
an important global player (Pankaj Chandra 2006).
Today, the textile and garment sector employs 35.0 million people and is the 2nd
largest employer, generates 1/5th of the total export earnings and contributes 4 per
cent to the GDP thereby making it the largest industrial sector of the country. This
textile economy is worth US $37 bn and its share of the global market is about
5.90 per cent. The sector aspires to grow its revenue to US $85bn, its export value
to US $50bn and employment to 12 million by the year 2010 (Texmin 2005).
It is estimated that there exist around 68,000 garment units in the organized sector,
of which about 88 per cent are for woven cloth while the remaining are for knits.
However, only 30–40 units are large in size. While these firms are spread all over
the country, there are clusters emerging in the National Capital Region (NCR),
2
Mumbai, Bangalore, Tirupur/Coimbatore, and Ludhiana employing about 35
million people. The total value of production in the garment sector is around Rs.
1,050–1,100 billion of which about 81 per cent comes from the domestic market.
The value of Indian garments (e.g. Saree, Dhoti, Salwar, Kurta, etc.) is around
Rs.200–250 bn. About 40 per cent of fabric for garment production is imported – a
figure that is expected to rise in coming years. The weaving and knits sector lies at
the heart of the industry. Three distinctive technologies are used in the sector –
handlooms, power looms and knitting machines. They also represent very
distinctive supply chains. The handloom sector (including khadi, silk and some
wool) serves the low and the high ends of the value chain – both mass
consumption products for use in rural India as well as niche products for urban &
exports markets. It produces, chiefly, textiles with geographical characterization
(e.g., cotton and silk sarees in Pochampally or Varanasi) and in small batches.
Handloom production is mostly rural (employing about 10 million, mostly,
household weavers) and revolves around master-weavers who provide designs,
raw material and often the loom.
Weaving, using power looms was traditionally done by composite mills that
combined it with spinning and processing operations. Over the years, government
incentives and demand for low cost, high volume, standard products moved the
production towards power loom factories and away from composite mills (that

3
were essentially full line variety producers). While some like Arvind Mills or
Ashima transformed themselves into competitive units, others gradually closed
down. In 2003-04, there remained 223 composite mills that produced 1434 million
sq mts of cloth. Most of these mills are located in Gujarat and Maharashtra. Most
of the woven cloth comes from the power looms (chiefly at Surat, Bhiwandi,
NCR, Chennai). In 2005, there were 425,792 registered power loom units that
produced 26,947 million. sq. mts of cloth and employed about 4,757,383 workers.
(Annual Review, Ministry of textiles 2009).Weaving sector is predominantly
small scale, has on an average 4.5 power looms per unit, suffers from outdated
technology, and incurs high co-ordination costs. Knits have been more successful
especially in export channels.
Strong production clusters like Tirupur and Ludhiana have led to growth of
accessories sector as well, although slowly. The hosiery sector, on the other hand,
has largely a domestic focus and is growing rapidly. The spinning sector is
perhaps most competitive globally in terms of variety, unit prices and production
quantity. Though cotton is the fibre of preference, man-made fibre (polyster fibre
and polyster filament yarn) is also produced by about 100 large and medium size
producers.
Spinning is done by 1566 mills and 1170 Small and Medium Enterprises (Annual
review, Ministry of textiles 2009) Mills, chiefly located in North India, deploy

4
34.24 million. Spindles and 0.385 million rotors while the SME units produce
their yarn on 3.29 million spindles and 0.119 million. Rotors producing 2270
million kg of cotton yarn, 950 million kg of blended yarn and about 1106 million
kg of man-made filament yarn every year.
Indian Readymade garments industries have been the single largest net foreign
exchange earner among all the products in the country’s export basket. The
performance of Indian garments export shows that how an efficiently managed
labour intensive sector can be transferred into a prolific foreign exchange earner.
Exports of readymade garments have taken place with very little import content.
Garments production is carried out largely with less modern technology and
automation because it is reserved for small scale sector. The garments
manufacturing and export activities in India are mainly located in Mumbai,
Chennai, Tirupur, Bangalore, Ahmedabad, Jaipur, Ludhiana and NCR region
(Delhi, Gurgaon, Noida).The bulk of Indian garments export goes to USA and EU
(around 90%) and rest to Australia, Canada, Norway, middle east etc (CRISIL
Research, Annual Review,2009). The garments sector has centered on an
extensive subcontracting system which made use of power looms fabrics and
second hand machinery. (Sunder A. Shetty, 2001)
India’s garment/apparel sector is highly fragmented, comprising more than 8,000
units and employing some 5 million people (AEPC 2009). Most apparel sector

5
units are family-run businesses having 50-60 sewing machines, often on contract
to apparel wholesalers, usually using old production equipment and methods. The
EOUs tend to operate on a much larger scale in more modern facilities and offer
brand-name quality goods, especially menswear. Exporters of ready-made
garments are classified as either manufacturer-exporters or merchant-exporters.
(Anju Sneh, 1999).
Some 2,000 manufacturer-exporters export apparel, while the roughly 26,000
merchant-exporters serve as export brokers on behalf of apparel manufacturers.
For tax purposes, export-oriented apparel firms generally own several units
registered as either manufacturer-exporters or merchant-exporters (Tewari Meenu,
2006). India has about 6,000 knitting units registered as producers or exporters;
the majority of the units are registered as SSI units. The knitting segment has
grown by 76 percent since 1993, with current annual output of knitwear (sweaters,
polo shirts, T- shirts, and underwear) at 6.4 billion square meters, valued at nearly
Rs80 billion. (Ahluwalia, 2000).
Garment industry is textile based industry. India’s garment exports have been
growing at a CAGR of 10% in the last decade. Garment manufacturing is the most
labour intensive of all other segments of textile value chain, thus has the maximum
potential to leverage India’s comparative advantage in labour cost; labour being
cheap in India. Moreover, low capital requirements and high value additions make
6
this an ideal sector for India to focus on. However, competing countries have left
far behind India. In the last decade, China’s share of world apparel exports jumped
from 4% in 1980 to 21% in 2005, India could only manage to increase it from 1%
to 3%. One of the key issues in the Indian garment industry has been the lack of
scale of operation primarily caused by archaic labour laws and obligation to export
50% of the output for an export-oriented unit. Above all, the productivity levels in
the Indian garment industry are substantially lower compared with best Asian
competitors.
The present study is concerned with Marketing Strategies of Readymade garments
industries in India. The marketing practices of garments units, problems faced by
them in implementing the marketing strategies and measures needed to solve these
problems, come under the purview of this study. The main focus is on the
marketing strategies used by the various sectors in the area of production,
promotion, distribution and pricing. In a layman language the term strategy is a
term related to ‘warfare or a plan to win a war’. But in the business world it refers
to plans relating to marketing, financing and manufacturing operations. Executives
of different business organizations concentrate their efforts to win the biggest
possible share of the targeted market. The field of strategy planning is much
wider. It deals with the adjustment of controllable factors, viz, production,
physical distribution, promotion and pricing within the environment of

7
uncontrollable factors, viz, competition, legal barriers, interference of different
behaviors’ and scientific and technological differentiation.
It is a job of crucial significance to formulate the business. Failure or survival of a
business depends upon the effectiveness of strategic planning. For e.g. to increase
the prices of a product to a significant extent the management will have to explore
and evaluate the competitors towards the change in price. If the change leads to
market dominance, competitors by changing the prices of their products will rush
to grab the market share. The management of a company should look at defensive
tools to be used to safeguard its market position. This requires a continuous review
of controllable factors within the atmosphere of uncontrollable ones.
A marketing strategy serves as the base of a marketing plan. A marketing plan
contains a list of specific actions required to successfully implement a specific
marketing strategy. An example of marketing strategy is as follows: "Use a low
cost product to attract consumers. Once our organization, via our low cost product,
has established a relationship with consumers, our organization will sell
additional, higher-margin products and services that enhance the consumer's
interaction with the low-cost product or service." Without a sound marketing
strategy, a marketing plan has no foundation. Marketing strategies serve as the
fundamental foundation of marketing plans designed to reach marketing
objectives. It is important that these objectives have measurable results.

8
1.2 STATEMENT OF THE PROBLEM
The present study is concerned with Marketing Strategies of Readymade garments
industries in India. The marketing practices of garments units, problems faced by
them in implementing the marketing strategies and measures needed to solve these
problems, come under the purview of this study. The main focus is on the
marketing strategies used by the various sectors in the area of production,
promotion, distribution and pricing.
The readymade garments industry has been chosen for various reasons.
First it plays an important role as it’s directly concerned to one of the basic needs
of every citizen. The garments industry operates in a highly complex environment.
Indian garments industries has been creating in a rapidly changing environment
particularly since mid seventies. It is therefore important to examine what the
modern trend are being introduced by the companies in their marketing strategies
and cope with the changing environment because this is a fashion age and
everyone is concerned about the new fashion and wants the new test specially the
young generation.
Second reason to choose the readymade garments industry is that the contribution
of the garments sector in the sphere of production, earning of foreign exchange
and investment in the Indian economy has been quite significant.

9
Third, the functional performance of majority of the garments sector that is in the
private sector deserves a significant consideration. The profitability trends,
working of garment units’ dependence of garments industries on imports are some
of the areas which have also been touched upon and lastly the leadership role of
garments sector in India as this is the second employment providing sector after
agriculture. The garments industry alone provides the major employment to the
Indian citizen as this sector is concerned to small scale industries sector.
1.3 OBJECTIVES OF THE STUDY
1. To find out the existing marketing policies of the Indian readymade
garments sector in the context of prevailing business environment in the
country.
2. To assess the impact of marketing operations on the performance of
readymade garments industries.
3. To review the conceptual framework of marketing strategies specially
concerned to Indian readymade garments industries.
4. To have a detailed review of the Indian readymade garments industries as a
whole from the beginning so as to assess the prevailing marketing trends.

10
5. To assess the customer satisfaction level for analysis of marketing
strategies developed by readymade garments industries in India.
6. To analyse the attitudes and views of garments owners/managers towards
the marketing sector practices of readymade garments industries.
7. To suggest measures for improving the existing marketing strategies of
readymade garments industries in the light of analysis, findings and
conclusions drawn from them.
1.4 HYPOTHESES
In the light of the objectives above, the following hypotheses have been
formulated and tested:
1. On the basis of age the null hypothesis is that there is no significant
difference in overall satisfaction level of the customers in the Readymade
garments industries in India, On the other hand alternate hypothesis is that
there is significant difference in overall satisfaction level when it is
classified with the age of customers of readymade garments in India.
2. On the basis of gender the null hypothesis is that there is no significant
difference in overall satisfaction level of the customers in the Readymade
garments Industries in India, On the other hand alternate hypothesis is that

11
there is significant difference in overall satisfaction level when it is
classified with the customers’ gender variable in the readymade garments
industries in India.
3. On the basis of Income the null hypothesis is that there is no significant
difference in overall satisfaction level when it is classified with the income
of the readymade garment customers in India, on the other hand alternate
hypothesis is that there is significant difference in overall satisfaction level
when it is classified with the income of the readymade garment customers
in India.
4. H0: Null hypothesis assumes that there is no relationship between owner’s
factors such as (ownership, Scale of production, Number of machines) and
marketing strategies that is Product, Price, Promotion and Distribution
Strategies. Whereas alternative hypothesis H1: assumes that there is
significant relationship between Owner’s factors such as of (ownership,
Scale production, Number of machines) and marketing strategies that is
Product, Price, Promotion and Distribution Strategies.
Sub Hypotheses
a. H0: Null hypothesis assumes that there is no relationship between
ownership factors and marketing strategies that is Product, Price,

12
Promotion and Distribution Strategies. Whereas alternative
hypothesis H1 assumes that there is significant relationship between
Ownership factors and marketing strategies that is Product, Price,
Promotion and Distribution Strategies.
b. H0: Null hypothesis assumes that there is no relationship between
scale of production factors and marketing strategies that is Product,
Price, Promotion and Distribution Strategies. Whereas alternative
hypothesis H1 assumes that there is significant relationship between
Scale production and marketing strategies that is Product, Price,
Promotion and Distribution Strategies.
c. H0: Null hypothesis assumes that there is no relationship between
No. of machinery factors and marketing strategies that is Product,
Price, Promotion and Distribution Strategies. Whereas alternative
hypothesis H1 assumes that there is significant relationship between
No. of machinery and marketing strategies that is Product, Price,
Promotion and Distribution Strategies
13
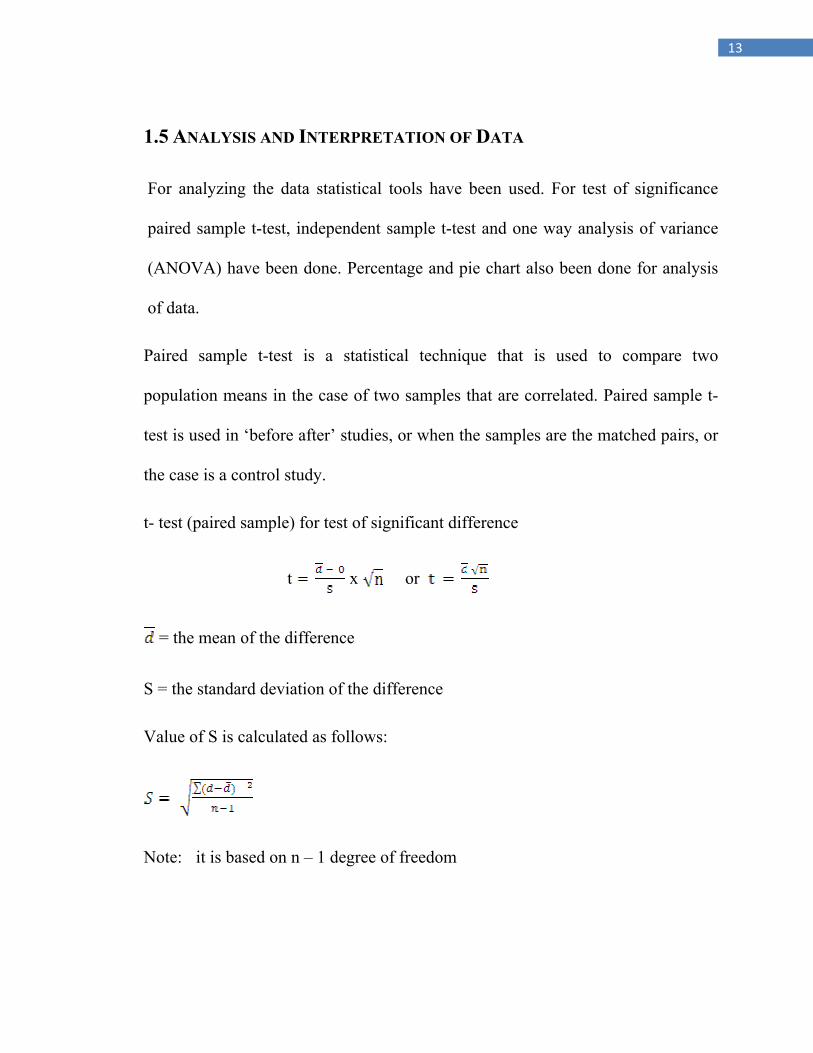
1.5 ANALYSIS AND INTERPRETATION OF DATA
For analyzing the data statistical tools have been used. For test of significance
paired sample t-test, independent sample t-test and one way analysis of variance
(ANOVA) have been done. Percentage and pie chart also been done for analysis
of data.
Paired sample t-test is a statistical technique that is used to compare two
population means in the case of two samples that are correlated. Paired sample t-
test is used in ‘before after’ studies, or when the samples are the matched pairs, or
the case is a control study.
t- test (paired sample) for test of significant difference
t x or
= the mean of the difference
S = the standard deviation of the difference
Value of S is calculated as follows:
Note: it is based on n – 1 degree of freedom

14
An independent samples t-test is used to determine differences between the means
of two distinct samples within a population. It is also referred to as a between-
subjects design.
The formula for the independent samples t-test is:
The numerator is the difference in means between the two samples, and the
denominator is the estimated standard error of the difference. Where (x1 – x2) is
the standard error that is calculated for using the pooled variance.
One-way analysis of variance (ANOVA) is a technique used to compare means of
two or more samples (using the F distribution). It produces an F statistic, the ratio
of the variance among the means to the variance within the samples. Essentially,
the ratio of variance is a comparison of the variance amongst the different groups
to the variance amongst all the individuals within those groups. In ANOVA two
sets of variances are calculated i.e. between group means, “how different are the
means”: variation due to the systematic differences and within group’s means,
“how much spread is in the population” because of random error.

15
k= Number of groups
N = total number of subjects in study
nj= total number in relevant group
MM = mean of the means
Mj = mean of each individual group
F= variance between groups / variance within groups
1.6 LIMITATIONS OF THE STUDY
Although every effort was made to conduct survey as rigorously as possible but
certain limitations were unavoidable and such limitations are as follows.
1- The study is based on primary data through survey and questionnaire. So
this study has been confined to 60 respondents among manufacturer, and
300 customers from NCR of Delhi and Aligarh Regions because of limited
resources and time limitations.

16
2- The information collected for the purpose of the study was obtained with
the help of questionnaire framed in a well manner and send to the various
groups of the sector especially to the marketing managers of the companies.
3- It follows from the above that some element of bias on the part of the
informant can’t altogether be ruled out although however possible cross
checks were used to verify the corrections of the information.
4- The major part of the study is based on primary source of information but
somewhere due to non availability of information from direct source
secondary source is used.
5- The present study is basically qualitative in nature but wherever needed an
appropriate data were used in support or otherwise of the statement made.
6- It would have been better to include some more parts of the readymade
garments producing areas but the choice was restricted keeping in view the
limitations of the resources and time and the difficulty of obtaining
information from private sector undertakings.
1.7 METHODOLOGY
The study is based on both primary and secondary data. For primary data
collection purpose interview and questionnaire was considered to be the best
17
alternative. For primary data two sets of questionnaire were prepared to collect
primary data from the following categories of information namely:
(i) Manufacturers
(ii) Customers
One set of questionnaire was designed for the Manufacturers, Exporters &
Retails Outlets and the second set of questionnaire was designed for the
customers. Respondents were selected on a random basis. Criteria basis
depends on sex, age & Income was considered for the collection of data in
case of customers. Data from owners have been collected on the basis of
factor, Ownership, Scale of production and No of Machineries implied.
The secondary data for the study have been collected from various secondary
sources of information such as relevant Books, Journals and periodicals; Research
Papers, Published Theses, Articles, News Dailies, Reports such as Annual Review
of Indian Garments Industries by CRISIL Research and Websites etc are consulted
by the Researcher for better referencing. Among the various journals and
periodicals, used in obtaining the information specific are The Indian Textile
Journal, All India Textile Directory, Asian Textile Journal, Apparel Export
Promotion Council (AEPC) ,Fashion and beyond (NIIFT), Indian cotton growing

18
review, Journal of textile association, Journal of Apparel Export promotion
council India, and Other Business and Economic Journals.
The collected data is compiled, tabulated and analyzed with the help of the various
statistical tools. Tables were prepared on the basis of questionnaire responses from
manufacturers, and customers of readymade garments Industry.
1.7.1 SAMPLE SIZE
Two sets of questionnaire have been prepared. First is for Manufacturers,
exporters and retailers outlets. The survey was conducted on 60 respondent of
NCR Region. 20 each has been taken from Delhi, Noida and Gurgaon.
The second set of questionnaire was prepared for the customers. The questionnaire
was administered to 300 respondents. Out of 300 respondents 200 have taken from
NCR where as 100 respondents have been taken from Aligarh (U.P).
1.8 CHAPTER SCHEME
The whole study has been divided into six chapters, First chapter is on
Introduction which is detailed above. Second chapter is devoted to selective

19
reviews of readymade garments industries, despite the fact that a lesser work has
been done especially on marketing strategies of readymade garments industries.
Third chapter depicts conceptual frame work of the marketing strategies & the
various strategies adopted specially for garments industry. Fourth chapter gives a
detail overview of readymade garment industries in India & It deals with the
overall development from the beginning the latest position. Fifth chapter is heart
of thesis and focused on marketing strategies of readymade garments industries in
India and gives detail analysis of information obtained with the help of
questionnaire and interviews and interpretation of formulated hypotheses for this
research work. Sixth chapter gives all conclusions, findings and suggestions.

20
REFERENCES
Chandra, P.(2004), “Competitiveness of Indian Textiles & Garment Industry:
Some Perspectives,” a presentation, Indian Institute of Management,
Ahmedabad, December 2004.
Chandra, P.(1998), “Technology, Practices, and Competitiveness: The Primary
Textiles Industry in Canada, China, and India,” ed. P. Chandra, Himalaya
Publishing House, Mumbai, 1998.
FICCI, “Trends Analysis of India & China’s Textiles and Apparel Exports to USA
Post MFA, FICCI, New Delhi, July 2005.
Henrietta Lake (2007), “Steering towards the High Road: A Study of Human
Resource Management in Two Indian Garment Factories” IZA discussion
paper no 3227, U.K.
Khaliq Ahmad (1987), “Marketing Strategies of drugs and pharmaceuticals
Industry in the public sector”. Thesis submitted to the Deptt. of Commerce,
AMU, Aligarh.

21
Nargundkar & Bajaj (2002) “International Marketing Strategy for Indian
Companies: Value, Image and Other Issues”, ICFAI Journal of Marketing,
vol.1, No.1, November 2002, pp.67-73
Office of Textile Commissioner (2004), “Compendium of Textile Statistics”,
Ministry of Textiles, Government of India, Mumbai, 2004.
Texmin(2005) Official website of Ministry of Textiles, Government of Indian,
http://texmin.nic.in,
Tewari, Meenu (2006), ‘Is Price and Cost Competitiveness Enough for Apparel
Firms to Gain Market Share in the World after Quotas? A Review,’ Global
Economy Journal, Vol. 6, Issue 4, Article no. 5.