Chapter 7 Land-Man Ratio - a reservoir of Indian...
21
Chapter 7 Land-Man Ratio 198 Chapter - 7 Land–Man Ratio Land and people are the two basic constituents of all forms of state. They are the most important natural resources that are mutually inter-related and inter-dependent for their sustainable development. Though land is a fixed, scarce, tangible and an immovable resource but being degradable and transferable entity it could be sustainable only if properly used by the human population which unlike land is in a continuous flux, growing with geometric progression. In order to understand the population-resource relationship in any geographic region, it is imperative to understand the distribution and density of the population. Although the concepts of distribution and density of population are not identical but being very intimately related to each other there is a genuine reason to discuss the two simultaneously 1 . It is always a difficult task to define the spatial differentiation and organization of human activity and the human usage of the physical environment. With the passage of time, as knowledge grows and culture advances, the relationship between man and his land also changes. However, since land is fixed and immovable, therefore, it is the size of population and its growth-trend which have a direct bearing on the economic development, social well-being, cultural values and political stability of a region 2 . 1 There is distinction between population distribution and population density. The distribution of population is more locational, while the density is more proportional. The former refers to the spatial pattern in which the population finds its location such as linear, dispersed, nucleated, agglomerate, etc and the later is concerned with the ratios between the size of population and the area. Therefore, distribution is more concerned with spread of population and density with some kind of man- land ratio. For more details see R.C. Chandana, Geography of Population (New Delhi: Kalyani Publishers, 2007), p. 39. 2 Majid Hussain, Geography of Jammu and Kashmir (New Delhi: Rawat Publications, 2003), p. 111.
Transcript of Chapter 7 Land-Man Ratio - a reservoir of Indian...

Chapter 7 Land-Man Ratio
198
Chapter - 7
Land–Man Ratio
Land and people are the two basic constituents of all forms of state.
They are the most important natural resources that are mutually inter-related
and inter-dependent for their sustainable development. Though land is a fixed,
scarce, tangible and an immovable resource but being degradable and
transferable entity it could be sustainable only if properly used by the human
population which unlike land is in a continuous flux, growing with geometric
progression.
In order to understand the population-resource relationship in any
geographic region, it is imperative to understand the distribution and density
of the population. Although the concepts of distribution and density of
population are not identical but being very intimately related to each other
there is a genuine reason to discuss the two simultaneously1.
It is always a difficult task to define the spatial differentiation and
organization of human activity and the human usage of the physical
environment. With the passage of time, as knowledge grows and culture
advances, the relationship between man and his land also changes. However,
since land is fixed and immovable, therefore, it is the size of population and its
growth-trend which have a direct bearing on the economic development, social
well-being, cultural values and political stability of a region2.
1 There is distinction between population distribution and population density. The
distribution of population is more locational, while the density is more proportional. The former refers to the spatial pattern in which the population finds its location such as linear, dispersed, nucleated, agglomerate, etc and the later is concerned with the ratios between the size of population and the area. Therefore, distribution is more concerned with spread of population and density with some kind of man- land ratio. For more details see R.C. Chandana, Geography of Population (New Delhi: Kalyani Publishers, 2007), p. 39.
2 Majid Hussain, Geography of Jammu and Kashmir (New Delhi: Rawat Publications, 2003), p.
111.

Chapter 7 Land-Man Ratio
199
In the developing countries the rapid population growth has been of
much concern as it reflects the fear of insufficiency in local food production3.
Despite a growing body of literature on the theme of ‘population growth and its
consequences’ much of the discussion in the third world countries is based on
simplistic notions regarding the relationship between population growth and
its consequences for agricultural production4, thus bringing in focus the
relation between man and land. According to Thomas Malthus, the economic
progress of a state has negative relationship with the growth of the population.
Towing the same line classical growth theorists consider population growth
and diminishing returns to labour as the forces limiting all economic progress5.
Contrary to this, the most representative argument is that of Ester Boserup
(1965) who states that population pressure might drive farmers towards the
innovation of new land-use practices and mitigate resource degradation6.
Giving a very different treatment to the population factor, she argues that
population growth tends to be the stochastic variable, with variation in the rate
resulting from a host of natural, climatic, and biological forces as well as
variation in economic conditions7. In her view, the economic problem for most
societies is how to adopt agricultural technology and land-use for population in
the best possible way, given the supply of land and other factors8. In other
words, factor proportions and income per capita follow from population growth
in relation to the land available, not the other way around9. The shifts from
primitive slash and burn agriculture to short- fallow rotation and ultimately to
3 For details see, Lee, R. E., Arthur, W. B., Kelley, A. C., Rodgers, G., and T. N Srinivasan
(eds.), Population, Food and Rural Development (Clarendon: Oxford, 1988). 4 J. I. Uitto, (1995). Population, land management and environmental change: The genesis of
PLEC within the United Nations University programme. Global Environmental Change 5: 267-270.
5 Warren Robinson and Wayne Schutjer, “Agricultural Development and Demographic
Change: A Generalization of the Boserup Model”, in Economic Development and Cultural Change, Vol. 32, No. 2 (Chicago: The University of Chicago Press, Jan., 1984), pp. 355-366.
6 For details see, Ester Boserup, The Conditions of Agricultural Growth: The Economics of
Agrarian Change under Population Pressure (Chicago: Aldine Publishing Co., 1965) 7 Warren Robinson, Agricultural Development and Demographic Change: A Generalization of
the Boserup Model, op. cit., p. 356. 8 Ibid.
9 Ibid.

Chapter 7 Land-Man Ratio
200
settled annual cultivation are, in her model, the responses of society to
population pressure10. The basic point of view is optimistic and stresses that
most rural societies have an unrealized potential for further technological
adaptation, if and when population pressure does begin to build up. Boserup's
theory derives agricultural development in many pre-industrial societies from
population growth: "population growth is regarded as an independent variable
which in its turn is a major factor determining agricultural developments"11. A
steadily increasing population within a given land area necessitates new
agricultural techniques and more intensive land use in order to feed the
expanding population.
Notwithstanding the fact that there are both pessimistic and optimistic
views regarding the ‘population growth and its consequences’ but it would not
be out of place to mention that land-man relationship had historically been
highly uneven which could generally be attributed to the availability of arable
land and water, age of civilization, accessibility of places and restrictions of the
national boundaries. Therefore, in order to study the Land-Man relationship of
any state, it is obligatory to study the physical features of its land, and the
growth, pattern and density of population; and then the relative study of both i,
e the analysis of each with respect to the other.
Man-land ratio provides an important element in such analysis. The
simplest measure, Crude Density of Population, is the number of people per
square kilometer or per unit area and is most useful for small units such as
districts and blocks rather than national states or continents, where internal
environmental conditions vary markedly12. This concept of the number of
persons per unit area is particularly important in marginal regions where
production of crops is precarious, however, it cannot be treated as a measure of
population pressure on land because it merely spells out a simple quantitative
10
Ibid. 11 Boserup Ester, The Conditions of Agricultural Growth, op. cit., p. 11
12 Majid Hussain, op. cit., p. 114.

Chapter 7 Land-Man Ratio
201
relationship between man and land, both of which may be of widely varying
quality13. Moreover, as neither the whole population of a region is dependent on
land for its livelihood nor all land available in a particular area is cultivated,
therefore, the ratio which emerges from dividing population by total land area
is misleading. Therefore, with an objective to arrive at a better understanding of
the population-resource relationship geographers, demographers, economists,
sociologists and statisticians have devised various other types of densities, Viz.
physiological density, agricultural density and economic density, having a
varying degree of utility in different situations. The Nutritional or Physiological
density is the ratio between total population and the total cultivated area and is
expressed in terms of persons per sq km of cultivated land or persons per unit
of cultivated land14. Though it gives rather a concrete picture, yet it again fails
to convey the true picture of population pressure as all population of the area
may not be dependent on land for their livelihood15. In an overwhelmingly
agricultural region like Jammu and Kashmir the pressure of population on land
can thus be better expressed if the ratios are established between agricultural
population and total agricultural land16. It is known as agricultural density17.
Projecting deep into the heart of Asia, the state of Jammu and Kashmir is
the North-western state of India. The state, richly endowed with natural
resources and competitive advantages, covers a total geographical area of
2,22,236 Sq. km, stretching from 320 17/ to 360 58/ N latitudes and 730 26/ to 800
30/ E longitudes.18 However, the original area of the state has undergone a
considerable change as about an area of 120849 Km2 are under the unlawful
occupation of China and Pakistan, leaving thereby an area of 101387 km2 on this
13
Chandana, op. cit., p. 42. 14
Ibid. 15
Ibid. 16
By Agricultural land is meant the net area sown and the Agricultural population comprises of both the cultivators and the agricultural labourers.
17 Chandana, op. cit., p. 42.
18 Techno-Economic Survey of Jammu and Kashmir (New Delhi: National Council of Applied
Economic Research, 1969), p. 1.

Chapter 7 Land-Man Ratio
202
side of the Line of Control.19 Area wise the undivided state of Jammu and
Kashmir ranks 6th among the Indian states, but the area of 101387 Sq. Km on
this side of the Line of Control /Ceasefire Line places the state 11th in order.20
Morphologically the state of Jammu and Kashmir can be divided into
three main distinct physiographic units– Jammu, Kashmir and Ladakh which
differ from each other not only in topography but also in culture. These regions
are also referred to as Sub-Himalayan Jammu; Himalayan Kashmir and the
Trans- Himalayan Ladakh.21 The spatial distribution of population in Jammu
and Kashmir is highly uneven. The distribution and density of population differ
from district to district and from micro to meso regions.22 In general, about 85
per cent of the total population of the state is occupying the Jammu plain and
the Kashmir valley (Jhelum floor), and 14 per cent is sprinkled in the Kandi
(lower hilly slopes) areas and the side valleys within 2000 m above the sea level,
while remaining one percent is sprinkled in the high latitudinal zones of
Himalayas, Zanaskar, Ladakh and Karakoram Ranges.’23
The physical factors like terrain, topography, slope, climate
(temperature and precipitation), drainage soil, natural vegetation, mineral
resources and accessibility have largely controlled the distributional pattern
and density of population in the state.24 Taking into account the total area of
the state on this side of the cease fire line and the figures of population
according to 1971 census, the density of population worked out to be 33 per
sq.km was the lowest among the states of India except that of Nagaland and
was very low as compared to the all Indian average25. However, the figures may
19
Government of Jammu and Kashmir, Economic Survey of Jammu and Kashmir, 2006-07 (Srinagar: Directorate of Economics and statistics), p. 8.
20 Ibid. p. 8.
21 A. R. Khan, S. A. Bhat, Jammu, Kashmir and Ladakh: A Geographical Study (Srinagar:
Gulshan Publishers, 2001), p. 12. 22
Majiid Hussain, op. cit., p. 112. 23
Ibid. p. 110. 24
Ibid. 25
N.S Gupta and Amarjit Singh, Agricultural Development of States in India, Vol. 1: Jammu and Kashmir (New Delhi: Seema Publications, 1979), p. 48.

Chapter 7 Land-Man Ratio
203
be misleading as a vast area of the state is mountainous and unfit for
habitation- the district of Ladakh for example occupies 70 per cent of the
geographical area of the state and habitats only 2-3 percent of its population26-
therefore, causing the uneven distribution of population in the state. The
following table shows the uneven distribution of the population in the state:
Table 7. 1
Density of Population of Different Districts of the State, 1971
District Density of
population per
km2 on
geographical area
Density of
population per
Km2 on cultivated
area
Percentage of
cultivated area to
total area.
Anantnag 155 616 25
Srinagar 275 1052 26
Baramulla 104 592 16
Ladakh N.A N.A N.A
Doda 29 618 5
Udhampur 74 567 13
Jammu 231 648 36
Kathua 104 435 24
Rajouri 81 545 15
Poonch 103 724 14
Source: Census of India 1971 (Jammu and Kashmir), Director of Census Operation, Jammu and Kashmir.
The table clearly reflects that the density of population had been more
in those districts which had more percentage of land under cultivation. The
high population density of Srinagar and Jammu was however, the cumulative
26
According to the 1971 Census the District of Ladakh accounted for about 70% area of the state and accommodated only 2.3 % of its population, Government of India, Report of the Census of India, 1971.

Chapter 7 Land-Man Ratio
204
impact of the higher percentage of cultivated land as well the districts being the
administrative headquarters of the respective regions.
Demographically the state of Jammu and Kashmir had a much
checkered history. Prior to 1921, the population of the state grew at a very slow
rate. The beginning of the twentieth century i.e. the decade 1901-11 witnessed
breakout of cholera three times in the Kashmir division, followed by
pneumonia, both of which took heavy toll of life27. It also witnessed three
floods and eight earthquakes. In the Jammu Division plague, enteric fever and
famine remained active throughout this period.28 The following decade also
witnessed four dangerous epidemics Viz. influenza, cholera, and smallpox in
Kashmir and plague and small pox in Jammu. During the decade 1921-31, the
state experienced severe famine in Jammu division followed by cholera,
smallpox and plague in the state.29 After 1931, the population of the state
increased steadily, however the increase in population was not the result of any
improvement in the standards of living- the people continued to be poor,
malnourished and there was no decline in the death rates- but can be
attributed to the decline in the frequency of famines, epidemic, floods and
earthquakes.30 However, it was after 1961 that the population of the state
increased at a very fast rate. In fact, the year 1961 can be termed as the year of
great divide in the demographic evolution of the state31. Between 1961 and 1971,
the state registered a growth rate of 29.65 percent as compared to 24.80 percent
for India32. The same was the case during the decade 1971-81 with the growth
rates of population being 29.69 per cent and 24.66 per cent for the state of
Jammu and Kashmir and India respectively. The following table depicts the
growth-trend of population in the state:
27
Government of Jammu and Kashmir, State Development Report (New Delhi: Planning Commission of India, September, 2003), p. 25.
28 Ibid.
29 Ibid.
30 Ibid. p. 25.
31 M.L Misri and Bhat M.S, Poverty, Planning and Economic Change in Jammu and Kashmir,
(New Delhi: Vikas Publishing House, 1992), P. 25. 32
Ibid.

Chapter 7 Land-Man Ratio
205
Table 7.2
Decadal Population Variations in Jammu and Kashmir
Year Population Absolute
change
% Decadal
variation in
Population J&K
% Decadal
variation in
Population India
1901 2139362 0 0 0
1911 2292535 153173 +7.16 (1901-11) 5.75
1921 2424359 131824 +5.75(1911-21) -0.31
1931 2670208 245849 +10.14(1921-31) 11
1941 29466728 276520 +10.36(1931-41) 14.22
1951# 3253852 307124 +10.42( 1941-51) 13.31
1961 3560976 307124 +9.44( 1951-61) 21.64
1971 4616632 1o55656 +29.65(1961-71) 24.80
1981 5987389 1370757 +29.69(1971-81) 24.66
1991* 7718700 1731311 +30.34(1981-91) 23.86
2001 10069917 2351217 +29.98(1991-01) 21.34
Source: Census of India, Part: Jammu and Kashmir
#. There was no census in 1951. The figure given by the Census Department is the mean value of the 1941 and 1961 populations.
*. The 1991 census was not held in J&K. The population of India includes the projected population of Jammu and Kashmir as on 1. 3. 1991 made by the Standing Committee of Experts on population projections (Oct.1989).The projected population of J&K excludes the population of area under occupation of Pakistan and China.
The lower rates of population growth prior to 1961, besides the natural
disasters, were the offshoot of high mortality rates caused by the cumulative
effect of overall economic backwardness, natural calamities, lack of elementary
medical facilities, poverty of large segments of the population, high incidence
of fatal diseases and above all, illiteracy33. The spurt in population growth since
33
Ibid.
Chapter 7 Land-Man Ratio
206
1961 has been caused by a number of factors which according to the census
report of 1971 included34:
i) Eradication of epidemics like cholera, small pox, plague etc. which in
the past were a recurrent phenomena taking a heavy toll of human
lives;
ii) Quantitative dispersal and qualitative improvement in the medical
facilities ;
iii) General economic prosperity and social change registered during the
post- independence era;
iv) Sizeable immigration of such elements as displaced persons, different
categories of labor working on various central and state
developmental projects, service personnel of all kinds, etc;
v) Lesser impact of family planning programme in the state; and
vi) Improved census methodology and techniques ensuring complete
coverage of the population.
Besides, the aforementioned factors the increase in population of the
state resulted as a consequence of the decline in the mortality rates and
constant high birth rate35. The improvements in the levels of living, access to
food, education and medical facilities even in the remote areas had also
reduced the mortality rates considerably36. Furthermore, in comparison to
other states of India the state of Jammu and Kashmir had a younger
population- a demographic situation (characterized by high percentage of
young population)37 which could have been turned out into an extraordinary
opportunity had the state trained and educated its youth to fit the demographic
gap that had opened up in the developed world (characterized by aging
population). But instead of acting as productive asset– contributing to
34
Government of India, Census of India, 1971: Jammu and Kashmir, Series 8, p. 73. 35
Misri M. L., op. cit., p. 25. 36
Ibid. p. 25. 37
Government of Jammu and Kashmir, Jammu and Kashmir: Fifty Years (Srinagar: Department of Information, 1998), p. 282.

Chapter 7 Land-Man Ratio
207
economic growth, more level economic distribution and poverty alleviation-
the Youth Bulge in the state in combination with urbanization, lack of
professional education, lack of industrialization and high unemployment acted
as a suitable ground for social unrest.
In the absence of other suitable alternatives the population of the state,
therefore, became increasingly dependent on the agricultural sector– thereby
increasing the pressure on the land. Here it is pertinent to mention that being
hilly and mountainous and with a major area under thick forests the state had
very little cultivable land. The impact of population increase on agriculture of
the state can be gauged from the table below:
Table 7.3
Physiological and Agricultural Densities in the State of Jammu and
Kashmir, (1951-52 and 2001-02.)
Year Total
population [TP]
Net Area Sown [NAS]
(000)hectares
Agricultural Population
[AG]
NAS per capita of Agricultural population [NAS/AGP]
Land-Man ratio
[NAS/TP
Agricultural Density
AGP/NSA [Agricultural persons per
Sq km]
1951-52 3253852* 596 N.A- Can’t be
determined
0.4579
acres
Can’t be
determined
1961-62 3560976 660 1171820 1.40806 acres 0.4633 177.5
1971-72 4616632 700 931924 1.87783 acres 0.3790 1.33.1
1981-82 5987389 718 1547819 1.15969 0.2997 215.57
1991-92 7803900* 734 N.A- Can’t be
determined
0.235138 Can’t be
determined
2001-02 10143700 748 1837935 1.01744 0.18 245.57
Source: i) District Census Handbooks for Srinagar, Baramulla and Anantnag.
ii) Land Commission Report, 1968, Government of Jammu and Kashmir
iii) Digest of Statistics (various issues), Department of planning and
Development, Government of Jammu and Kashmir
iv) Indicators of Regional Development, Directorate of Economics and
Statistics, Jammu and Kashmir

Chapter 7 Land-Man Ratio
208
From the table above, it is very much clear that there had been a
significant difference between the rate of increase of population and the
corresponding increase in the Net Area Sown- the population of the state
increased by about 119% between 1960-61 and 1991-92 where as the Net Area Sown
increased by only 23% during the same period- leading to the continuous decline
in the land-man ratio, availability of cultivated land per capita of agricultural
population and increase in the agricultural density during the period 1950-2001
except for the decade of 1961-71. The land-man ratio decreased from 0.45 acres
in 1951-52 to 0.18 acres in 2001-02, which means that there had been a decline of
about 61 % during the period under reference, while as the Net Area Sown per
agricultural person decreased a bit slightly- it was 1.4 acres in 1961-62 and
1.01744 in 2000-01. The unusual trend in the per capita Net Area Sown during
the decade of 1961-71 was the result of a large scale conversion of non-
agricultural lands into agricultural land through the development of irrigation
facilities, introduction of tractors and high yielding varieties of crops38.
Afterwards the trend continued as before with the pressure on agriculture
growing with the growth in population. Moreover, the increase in population in
the state besides leading to sub-division and fragmentation of landholdings had
also a direct bearing on the land use pattern of the state. According to the
Economic Reforms Committee Report 1998, the total reported area, area under
forests and other uncultivated land excluding fallow land had declined by 0.12%,
1.19 % and 27% respectively between 1965-66 and 1987-88 and area not available
for cultivation and net area sown had increased by 5.3% and 0.59% during the
same period. The following table showing the land use pattern in the state
depicts the same situation39:
38
Tractors played a key role in bringing the uncultivated lands under cultivation and the high yielding varieties worked as a main motivation for such a change. For more details on the impact of new technologies refer to the chapter Technological Changes in agriculture.
39 The concepts and definitions used are the same as prescribed by the Union Ministry of
Agriculture. For the sake of the proper understanding of the problem the different land categories are introduced as under:
Total area according to Village Papers: Area according to the village papers comprises of the reported area or the cadastrally surveyed area i.e. the area for which data on land use classification are available. The estimates of the reported area are prepared by the village

Chapter 7 Land-Man Ratio
209
Table 7.4
Land use Pattern in Jammu and Kashmir,
Area (000 hectares)
Year
Total area
according to
village papers
Area
under
forests
Area not
available for
cultivation
Other
uncultivated
land excluding
fallows
Fallow
lands
Area under
Permanent
pastures and
Grazing lands
Area under
Miscellaneous
trees
1955-56 2397 566 730 283 204 132 132
1960-61 2416 678 549 413 119 121 130
1965-66 2418 671 547 392 133 125 121
1970-71 2419 669 560 393 91 133 110
1974-75 2415 665 560 389 113 125 109
1980-81 2414 658 565 374 102 124 103
1985-86 2415 658 571 362 93 126 72
1990-91 2416 658 586 337 103 127 73
1995-96 2416 658 582 374 103 126 72
2000-01 2416 658 582 338 90 126 72
Source: Compiled from Different Issues of the Digest of Statistics, Directorate of Economics and Statistics, Government of Jammu and Kashmir
The overall increase in the Net Sown Area, during the period 1960-61 to
2000-01 as shown in the table 7.3 can therefore, be attributed to the decline, as
patwari. It does not correspond to the total geographical area which is not fit for habitation. The area maintained by the forest department also does not form a part of the reported area.
Area under forests: They cover the berun-line forests viz. The forests falling outside the forest area, demarcated by the Forest Department for maintenance
Area not available for cultivation: It consists of two categories of lands, i) land put to non-agricultural uses – consisting of entire land occupied by buildings, rivers, canals and other lands put to use other than agriculture. ii) Barren and un-culturable lands- this category consists of lands like deserts, mountains and lands which cannot be brought under cultivation except at an exorbitant cost.
Fallow lands: This includes all lands which were taken up for cultivation but are temporarily out of cultivation for a period of not less than one year and not more than 5 years. Area under permanent pastures and other Grazing lands: All grazing lands whether they are permanent pastures and meadows or not, are categorized as permanent pastures and other grazing lands. It also includes the common grazing land in the village. Area under Miscellaneous tree crops etc.: This constitutes the cultivable land which is not included in net area sown but is put to some agricultural uses. For example, the land under thatching grasses, bamboo bushes and other groves for fuel etc not included under orchards fall under this category.
Chapter 7 Land-Man Ratio
210
shown in table 7.4, in the Area not available for cultivation, Fallow lands, Area
under pastures and grazing lands, Area under miscellaneous trees and
cultivable waste, and Area under forests which were brought under cultivation.
The introduction of new technologies like fertilizers, high yielding variety of
seeds, tractors and other modern implements also played a key in bringing such
lands under cultivation40. This is a dangerous trend as besides impeding the
pastoral activities it also has a direct bearing on the ecological balance of the
region.
The increase in the population had not only drastically reduced the
availability of the per capita cultivated land but had also led to the large scale
fragmentation and sub-division of landholdings, which had enhanced in the
presence of the prevailing law of succession.41 It is worth to mention here that
the size of landholding and fragmentation of holdings have a direct bearing on
the agricultural practices, cropping patterns and yield per unit area42.
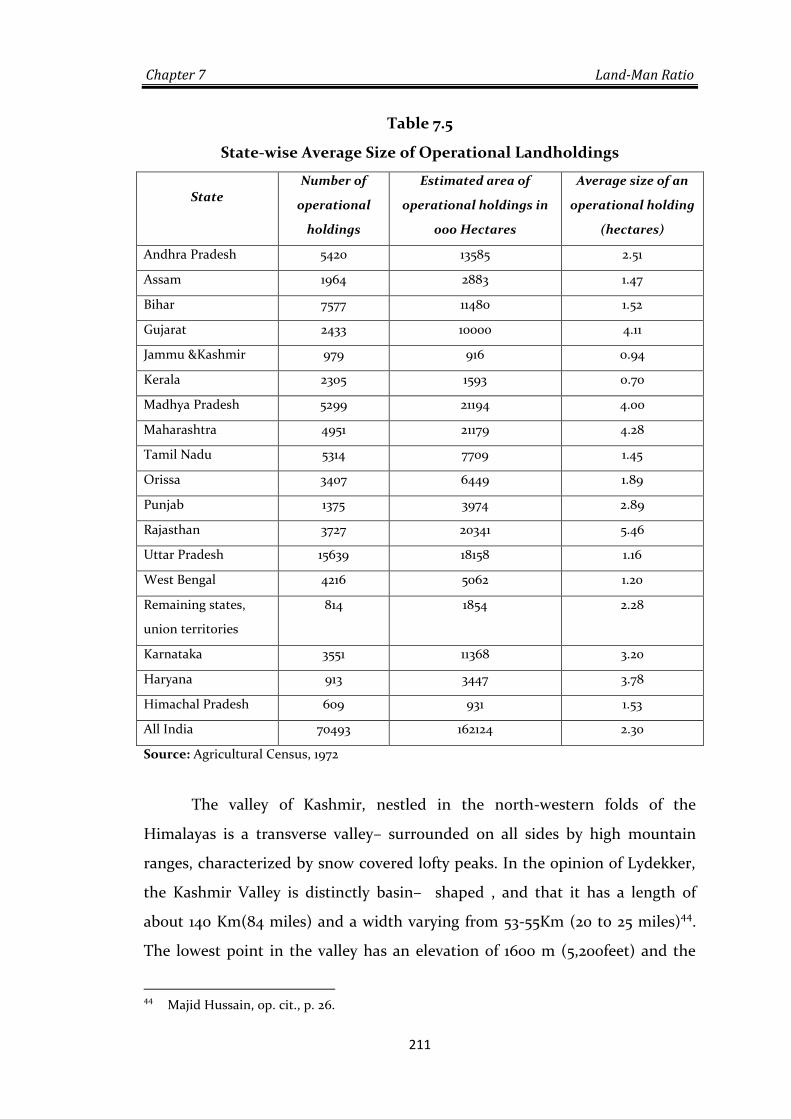
Moreover, the problem of operational holdings in Jammu and Kashmir had
been more severe as compared to other states of the India, hence proving
detrimental for the development of agriculture.43 The following table
substantiates the fact:
40
For more on the technological changes in agriculture, see the chapter “ Technological Changes in Agriculture”
41 There are other causes of the sub-division and fragmentation of the holdings like laws of
inheritance –it leads to the division of the parental property between the children, the farms get split up further and further with every passing generation, decline of joint family system – in the past land was held together even if the members of the family increased from generation to generation but the breakup of the joint family system as a result of modernization and other socio-economic factors led to sub-division and fragmentation of holdings with each passing generation. All of these factors can be seen in operation in the state of Jammu and Kashmir throughout the period under reference.
42 Majid Hussain, op. cit., p. 176.
43 Although the New agricultural technology had exploded the concept of large farms and
large productivity yet there is no denying the fact that there is a minimum size of farm below which farming becomes unprofitable, whatever the technology may be. Also the sub-division and fragmentation of land leads to the wastage of land- sometimes the land holdings become so low that cultivation becomes extremely difficult and the land remains uncultivated, land is wasted in drawing boundaries and hedges as, difficulties in modernization especially mechanization, difficulties in land management, disputes over boundaries etc, for more details on disadvantages of sub-division and fragmentation. For more details see, S. K. Misri and Puri V. K, Indian Economy (New Delhi: Himalayan Publishing house, 24
th edition, 2006), p. 323.
Chapter 7 Land-Man Ratio
211
Table 7.5
State-wise Average Size of Operational Landholdings
State
Number of
operational
holdings
Estimated area of
operational holdings in
000 Hectares
Average size of an
operational holding
(hectares)
Andhra Pradesh 5420 13585 2.51
Assam 1964 2883 1.47
Bihar 7577 11480 1.52
Gujarat 2433 10000 4.11
Jammu &Kashmir 979 916 0.94
Kerala 2305 1593 0.70
Madhya Pradesh 5299 21194 4.00
Maharashtra 4951 21179 4.28
Tamil Nadu 5314 7709 1.45
Orissa 3407 6449 1.89
Punjab 1375 3974 2.89
Rajasthan 3727 20341 5.46
Uttar Pradesh 15639 18158 1.16
West Bengal 4216 5062 1.20
Remaining states,
union territories
814 1854 2.28
Karnataka 3551 11368 3.20
Haryana 913 3447 3.78
Himachal Pradesh 609 931 1.53
All India 70493 162124 2.30
Source: Agricultural Census, 1972
The valley of Kashmir, nestled in the north-western folds of the
Himalayas is a transverse valley– surrounded on all sides by high mountain
ranges, characterized by snow covered lofty peaks. In the opinion of Lydekker,
the Kashmir Valley is distinctly basin– shaped , and that it has a length of
about 140 Km(84 miles) and a width varying from 53-55Km (20 to 25 miles)44.
The lowest point in the valley has an elevation of 1600 m (5,200feet) and the
44
Majid Hussain, op. cit., p. 26.

Chapter 7 Land-Man Ratio
212
mean elevation is 184 m (60,00feet) above the sea level.45 The oval shaped valley
is filled with thick deposits of alluvium which have blanketed even the lower
slopes of the surrounding ranges. On the borders of the Kashmir valley and
even the valley floor occurs extensive elevated plateaus of alluvial and
lucustrine material, locally known as karewas46. Owing to their elevated
positions the karewas cannot generally be brought under irrigation47. Though
the mountains have stood as sentinels guarding the valley, historically they
have the character of no man’s land48. According to Monis Raza, “The Kashmiri
peasant never came to terms with the mountains. They remained alien to him –
the abode of gods and demons, to be dreaded and revered but not to be
assimilated into the tamed environment. Such a negative attitude towards the
surrounding mountains led to squeezing in the peasantry within the restricted
confines of the valley floor”49. Within the valley, there are three important side
valleys, namely: i) The Liddar Valley ii) The Sind Valley, and iii) The Lolab
Valley. Moreover, owing to different topographical features the different
regions of the valley are fit/unfit for different economic activities. The Valley
floor is the ‘rice bowl’ of the valley and hub of commercial activities and the
major urban centres– Srinagar, Sopore, Anantnag and Baramulla fall in the
region50. Horticulture is the predominant activity in the karewa regions while
as the pastoral activity is the predominant activity in the side valleys which also
have a good hydroelectric potential.51
The demographic history of the valley was no different than that of the
state as a whole. There was a tremendous increase in the population of the
valley since 1961– the year marked a watershed in the demographic history of
the state. It goes without saying that the factors responsible for the
demographic changes, Viz. decrease in mortality rates, increase in birth rates 45
Ibid. p. 27. 46
Majid Hussain, op. cit., p. 29 47
Ibid. 48
Monis Raza, The valley of Kashmir: A Geographical Interpretation (New Delhi: Vikas Publishing House, 1978), p. x.
49 Ibid.
50 Misri, op. cit., p. 236.
51 Ibid. p. 237.
Chapter 7 Land-Man Ratio
213
and the less frequency of natural disasters etc, in the region/valley were almost
the same as those responsible for the whole state. The increase in population of
the valley and its subsequent impact on the agriculture can be gauged from the
following table:
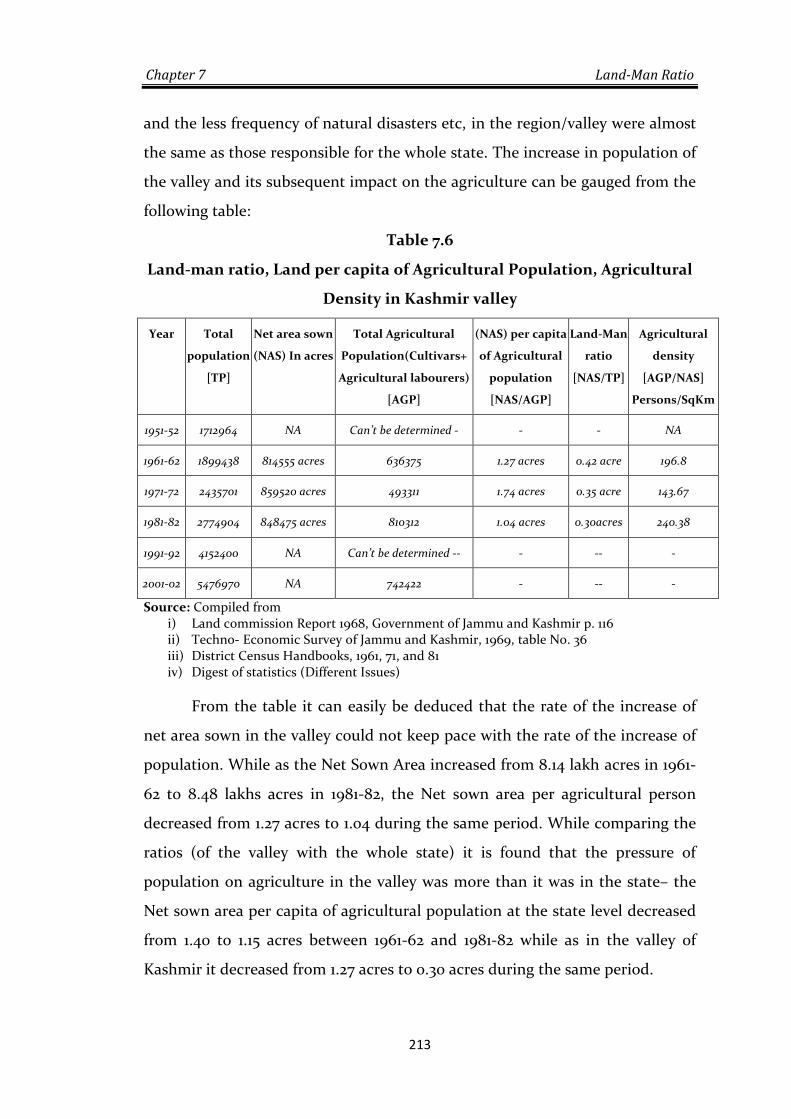
Table 7.6
Land-man ratio, Land per capita of Agricultural Population, Agricultural
Density in Kashmir valley
Year Total
population
[TP]
Net area sown
(NAS) In acres
Total Agricultural
Population(Cultivars+
Agricultural labourers)
[AGP]
(NAS) per capita
of Agricultural
population
[NAS/AGP]
Land-Man
ratio
[NAS/TP]
Agricultural
density
[AGP/NAS]
Persons/SqKm
1951-52 1712964 NA Can’t be determined - - - NA
1961-62 1899438 814555 acres 636375 1.27 acres 0.42 acre 196.8
1971-72 2435701 859520 acres 493311 1.74 acres 0.35 acre 143.67
1981-82 2774904 848475 acres 810312 1.04 acres 0.30acres 240.38
1991-92 4152400 NA Can’t be determined -- - -- -
2001-02 5476970 NA 742422 - -- -
Source: Compiled from i) Land commission Report 1968, Government of Jammu and Kashmir p. 116 ii) Techno- Economic Survey of Jammu and Kashmir, 1969, table No. 36 iii) District Census Handbooks, 1961, 71, and 81 iv) Digest of statistics (Different Issues)
From the table it can easily be deduced that the rate of the increase of
net area sown in the valley could not keep pace with the rate of the increase of
population. While as the Net Sown Area increased from 8.14 lakh acres in 1961-
62 to 8.48 lakhs acres in 1981-82, the Net sown area per agricultural person
decreased from 1.27 acres to 1.04 during the same period. While comparing the
ratios (of the valley with the whole state) it is found that the pressure of
population on agriculture in the valley was more than it was in the state– the
Net sown area per capita of agricultural population at the state level decreased
from 1.40 to 1.15 acres between 1961-62 and 1981-82 while as in the valley of
Kashmir it decreased from 1.27 acres to 0.30 acres during the same period.
Chapter 7 Land-Man Ratio
214
Being topographically difficult to access, the valley of Kashmir witnessed almost
the absence of industries and had therefore been exclusively dependent on the
agricultural sector. Furthermore, owing to the uneven distribution of
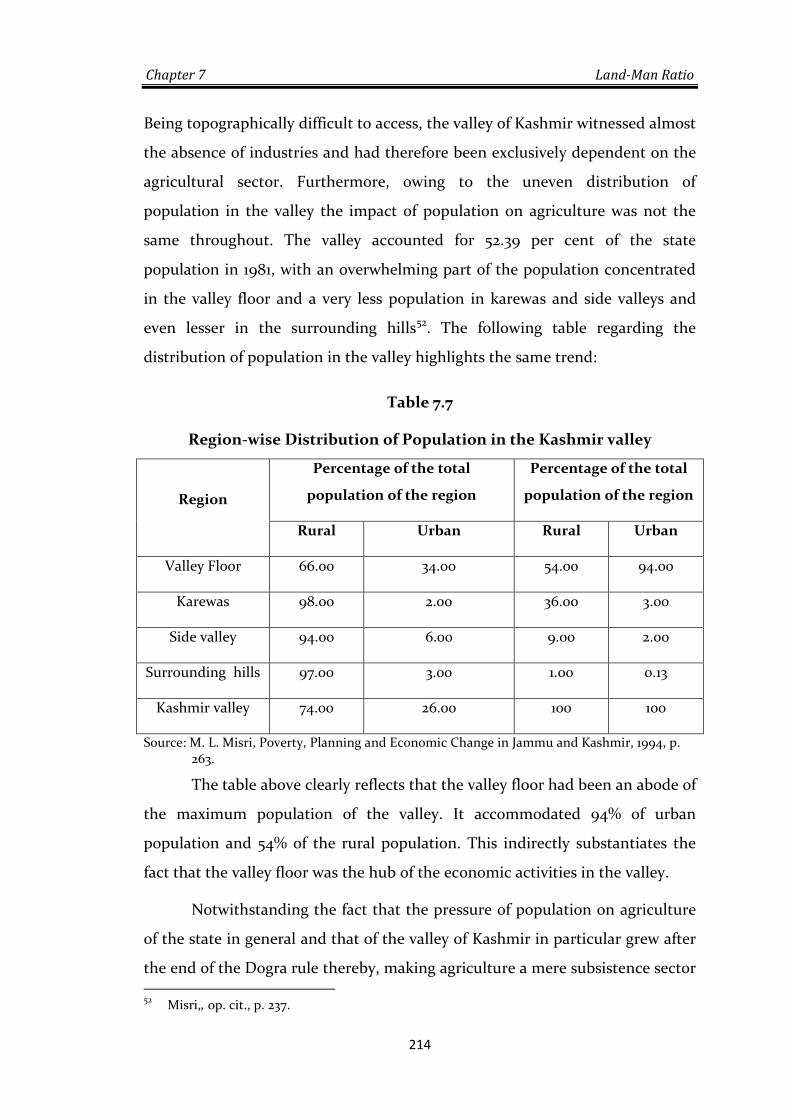
population in the valley the impact of population on agriculture was not the
same throughout. The valley accounted for 52.39 per cent of the state
population in 1981, with an overwhelming part of the population concentrated
in the valley floor and a very less population in karewas and side valleys and
even lesser in the surrounding hills52. The following table regarding the
distribution of population in the valley highlights the same trend:
Table 7.7
Region-wise Distribution of Population in the Kashmir valley
Region
Percentage of the total
population of the region
Percentage of the total
population of the region
Rural Urban Rural Urban
Valley Floor 66.00 34.00 54.00 94.00
Karewas 98.00 2.00 36.00 3.00
Side valley 94.00 6.00 9.00 2.00
Surrounding hills 97.00 3.00 1.00 0.13
Kashmir valley 74.00 26.00 100 100
Source: M. L. Misri, Poverty, Planning and Economic Change in Jammu and Kashmir, 1994, p. 263.
The table above clearly reflects that the valley floor had been an abode of
the maximum population of the valley. It accommodated 94% of urban
population and 54% of the rural population. This indirectly substantiates the
fact that the valley floor was the hub of the economic activities in the valley.
Notwithstanding the fact that the pressure of population on agriculture
of the state in general and that of the valley of Kashmir in particular grew after
the end of the Dogra rule thereby, making agriculture a mere subsistence sector 52
Misri,, op. cit., p. 237.
Chapter 7 Land-Man Ratio
215
especially in those regions of the valley which continued with the traditional
cropping pattern, but there is no denying the fact that the pressure of
population on agriculture was not the same throughout the valley and varied
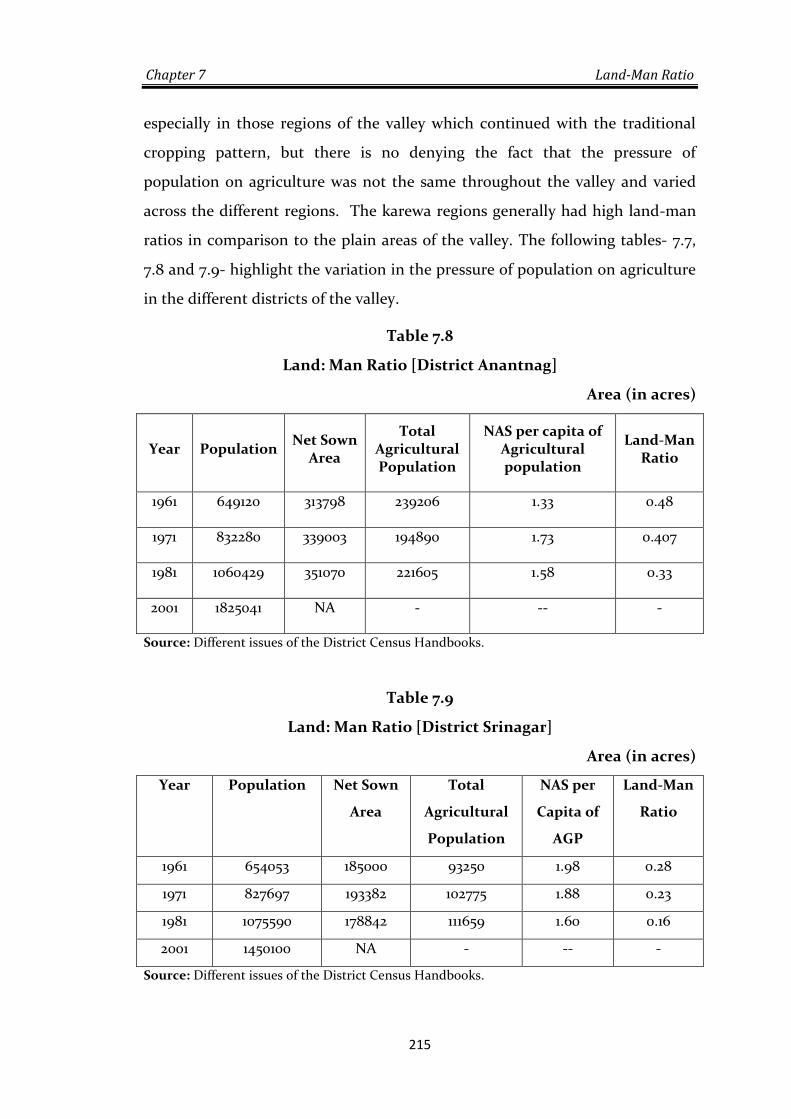
across the different regions. The karewa regions generally had high land-man
ratios in comparison to the plain areas of the valley. The following tables- 7.7,
7.8 and 7.9- highlight the variation in the pressure of population on agriculture
in the different districts of the valley.
Table 7.8
Land: Man Ratio [District Anantnag]
Area (in acres)
Year Population Net Sown
Area
Total Agricultural Population
NAS per capita of Agricultural population
Land-Man Ratio
1961 649120 313798 239206 1.33 0.48
1971 832280 339003 194890 1.73 0.407
1981 1060429 351070 221605 1.58 0.33
2001 1825041 NA - -- -
Source: Different issues of the District Census Handbooks.
Table 7.9
Land: Man Ratio [District Srinagar]
Area (in acres)
Year Population Net Sown
Area
Total
Agricultural
Population
NAS per
Capita of
AGP
Land-Man
Ratio
1961 654053 185000 93250 1.98 0.28
1971 827697 193382 102775 1.88 0.23
1981 1075590 178842 111659 1.60 0.16
2001 1450100 NA - -- -
Source: Different issues of the District Census Handbooks.

Chapter 7 Land-Man Ratio
216
Table 7.10
Land: Man Ratio [District Baramulla]
Area (in Acres)
Year Population Net Sown
Area
Total agricultural
population
NAS Per
Capita of
AGP
Land-Man
Ratio
1961 596265 315757 acres 141500 2.23 acres 0.52
1971 775724 327135 187719 1.742 acres 0.42
1981 998885 318561 209158 1.52 0.31
2001 1820173 - -- -
Source: Different issues of the District Census Handbooks.
The comparative analysis of the above three tables reveals the fact that
the pressure of population on agriculture had not been same in all the districts
of the valley. Whereas the cultivated land per agricultural person increased in
the district of Anantnag from 1.33 acres to 1.58 acres during the period 1961-62
to 1981-82, the same ratio in case of the districts of Baramulla and Srinagar
decreased from 2.23 to 1.58 and 1.98 to 1.60 respectively during the same period.
The increase in the land per agricultural person in the district of Anantnag was
most probably the result of the large scale conversion of other category lands
Viz pastures, forests etc into agricultural land. This had been so because the
new agricultural strategy in the state of Jammu and Kashmir had made its
debut in the same district.
Nevertheless, it is important to mention that land-man ratio and
agricultural densities varied within the districts as well. Being less populous the
size of landholdings in the karewa areas of the district had been comparatively
bigger and so were the different types of land-man ratios. However, since most
of the cultivated land in the karewas fell in the un-irrigated category, the bigger
size of landholdings had but marginally helped the inhabitant population. The
following table [7.10] highlights the non-uniformity of population pressure on
agriculture within the Anantnag district. It is pertinent to mention here that
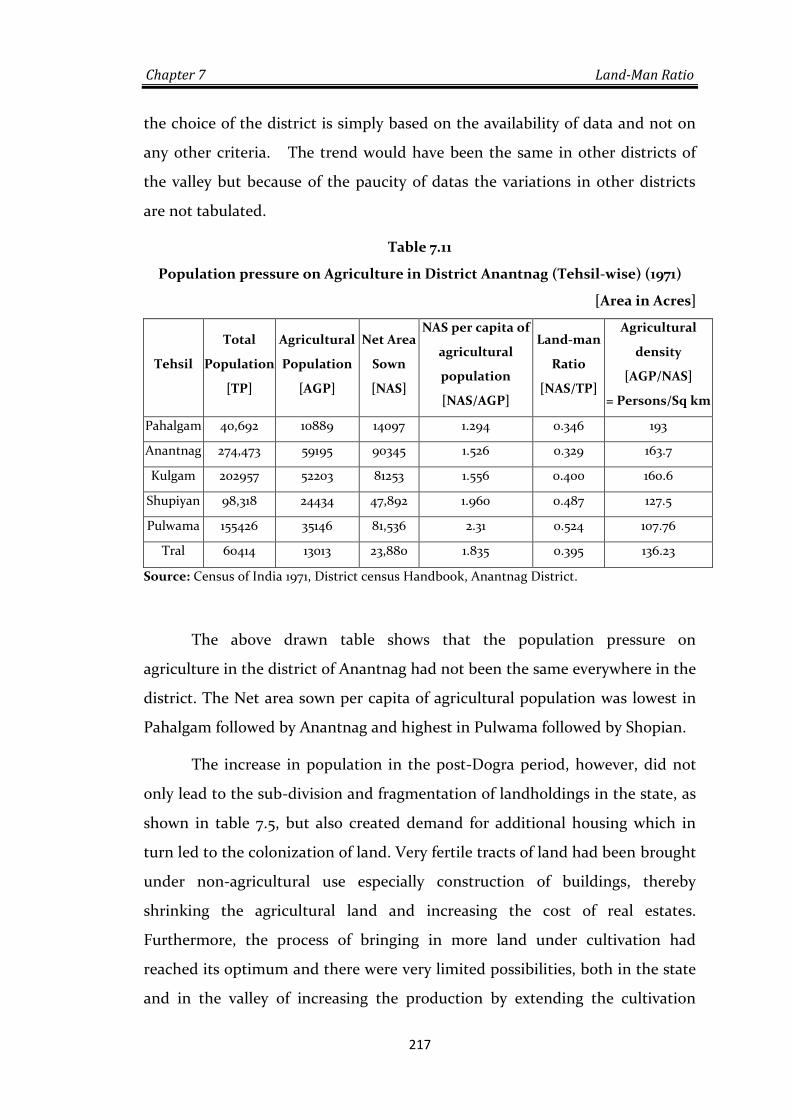
Chapter 7 Land-Man Ratio
217
the choice of the district is simply based on the availability of data and not on
any other criteria. The trend would have been the same in other districts of
the valley but because of the paucity of datas the variations in other districts
are not tabulated.
Table 7.11
Population pressure on Agriculture in District Anantnag (Tehsil-wise) (1971)
[Area in Acres]
Tehsil
Total
Population
[TP]
Agricultural
Population
[AGP]
Net Area
Sown
[NAS]
NAS per capita of
agricultural
population
[NAS/AGP]
Land-man
Ratio
[NAS/TP]
Agricultural
density
[AGP/NAS]
= Persons/Sq km
Pahalgam 40,692 10889 14097 1.294 0.346 193
Anantnag 274,473 59195 90345 1.526 0.329 163.7
Kulgam 202957 52203 81253 1.556 0.400 160.6
Shupiyan 98,318 24434 47,892 1.960 0.487 127.5
Pulwama 155426 35146 81,536 2.31 0.524 107.76
Tral 60414 13013 23,880 1.835 0.395 136.23
Source: Census of India 1971, District census Handbook, Anantnag District.
The above drawn table shows that the population pressure on
agriculture in the district of Anantnag had not been the same everywhere in the
district. The Net area sown per capita of agricultural population was lowest in
Pahalgam followed by Anantnag and highest in Pulwama followed by Shopian.
The increase in population in the post-Dogra period, however, did not
only lead to the sub-division and fragmentation of landholdings in the state, as
shown in table 7.5, but also created demand for additional housing which in
turn led to the colonization of land. Very fertile tracts of land had been brought
under non-agricultural use especially construction of buildings, thereby
shrinking the agricultural land and increasing the cost of real estates.
Furthermore, the process of bringing in more land under cultivation had
reached its optimum and there were very limited possibilities, both in the state
and in the valley of increasing the production by extending the cultivation
Chapter 7 Land-Man Ratio
218
without disturbing the ecological balance. Therefore, the state needed (and still
needs) to invest heavily in agricultural research to increase the productivity of
the land so that the growing population’s dependence on imported food and
fibre could be kept under control. Also, in order to keep the population in
control, there is an immediate need to popularize the programme of family
planning.
Nevertheless, it needs to be mentioned that the state had not been
active in legislating new laws to stop the diversion of agricultural land to non-
agricultural practices; the already existing laws in this regard had also fallen
prey to the corrupt revenue officials and it is, therefore, not surprising to see
that lands even under saffron cultivation had been brought under construction
of real estates. The state apathy led to the large scale conversion of otherwise
fertile tracts of lands into residential areas especially in and around the Srinagar
city. Moreover, since the growing population had created demand for
additional housing, therefore, the government had to take initiatives of
providing housing to the people which, however, it did not. It ultimately led to
large scale horizontal expansion of the construction work, consuming the
fertile tracts of land, thereby shrinking the already meagre agricultural space of
the valley. The state needed to take some remedial measures to tackle the
alarming situation by constructing earthquake proof multi-storey buildings as
were seen in the other states of India which, however, is still not in the
priorities of the government.