11 21-2016-teranga-gold-swiss-mining-final
44
TSX & ASX: TGZ Investor Presentation November 21-25, 2016
-
Upload
teranga-gold -
Category
Investor Relations
-
view
1.251 -
download
0
Transcript of 11 21-2016-teranga-gold-swiss-mining-final
TSX & ASX: TGZ
Investor PresentationNovember 21-25, 2016
Richard YoungPresident & CEO
This presentation contains certain statements that constitute forward-looking information within the meaning of applicable securities laws (“forward-looking statements”),
which reflects management’s expectations regarding Teranga Gold Corporation’s (“Teranga” or the “Company”) future growth, results of operations (including, without
limitation, future production and capital expenditures), performance (both operational and financial) and business prospects (including the timing and development of new
deposits and the success of exploration activities) and opportunities. Wherever possible, words such as “plans”, “expects”, “does not expect”, “budget”, “scheduled”, “trends”,
“indications”, “potential”, “estimates”, “predicts”, “forecasts”, “focused on”, “anticipate” or “does not anticipate”, “believe”, “intend”, “ability to” and similar expressions or
statements that certain actions, events or results “may”, “could”, “would”, “might”, “will”, or are “likely” to be taken, occur or be achieved, have been used to identify such
forward looking information. Specific forward-looking statements in this presentation include the commencement of expected drill programs, anticipated future life of mine
cash flows, anticipated future interests in Joint Venture projects, anticipated construction readiness activities for the Company’s Banfora gold project in Burkina Faso as well
as well as the anticipated completion of construction of the Banfora project - including the first gold pour, the anticipated discovery of reserves at the Banfora project, the
timing of completion of a Feasibility Study for the Banfora project, and Teranga’s estimated full year financial and operating totals, such as production. Although the forward-
looking information contained in this presentation reflect management’s current beliefs based upon information currently available to management and based upon what
management believes to be reasonable assumptions, Teranga cannot be certain that actual results will be consistent with such forward looking information. Such forward-
looking statements are based upon assumptions, opinions and analysis made by management in light of its experience, current conditions and its expectations of future
developments that management believe to be reasonable and relevant but that may prove to be incorrect. These assumptions include, among other things, the ability to
obtain any requisite Senegalese governmental approvals, the accuracy of mineral reserve and mineral resource estimates, gold price, exchange rates, fuel and energy costs,
future economic conditions, anticipated future estimates of free cash flow, and courses of action. Teranga cautions you not to place undue reliance upon any such forward-
looking statements
The risks and uncertainties that may affect forward-looking statements include, among others: the inherent risks involved in exploration and development of mineral
properties, including government approvals and permitting, changes in economic conditions, changes in the worldwide price of gold and other key inputs, changes in mine
plans and other factors, such as project execution delays, many of which are beyond the control of Teranga, as well as other risks and uncertainties which are more fully
described in Teranga’s Amended and Restated Annual Information Form dated November 15, 2016, and in other filings of Teranga with securities and regulatory authorities
which are available at www.sedar.com. Teranga does not undertake any obligation to update forward-looking statements should assumptions related to these plans,
estimates, projections, beliefs and opinions change. Nothing in this report should be construed as either an offer to sell or a solicitation to buy or sell Teranga securities.
This presentation is as of November 18, 2016. All references to Teranga include its subsidiaries unless the context requires otherwise.
This presentation contains references to Teranga using the words “we”, “us”, “our” and similar words and the reader is referred to using the words “you”, “your” and similar
words.
All dollar amounts stated are denominated in U.S. dollars unless specified otherwise.
Teranga Gold Forward-Looking Statements
3
4
Global Gold Mining:
The Trends
West Africa:
One of the Fastest Growing Gold Mining Regions
Teranga Gold:
A Compelling Investment Opportunity
Agenda

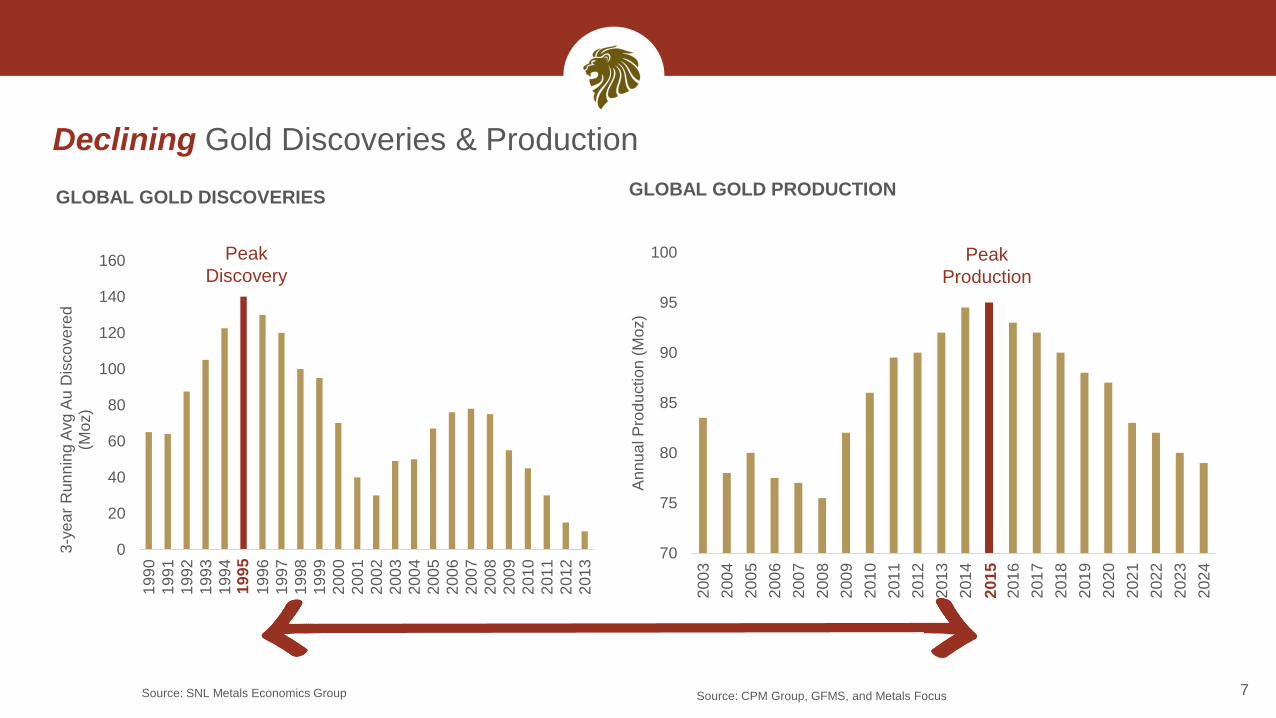
Declining Discoveries
Dwindling Production
Lower Grades
5

6
Discovery Feasibility Development
Up to
5 YearsUp to
1YearUp to
5 YearsUp to
3 Years
Production
Discovery to Commercial Gold Production Typically Takes up to 14 Years
0
20
40
60
80
100
120
140
160
199
0
199
1
199
2
199
3
199
4
199
5
199
6
199
7
199
8
199
9
200
0
200
1
200
2
200
3
200
4
200
5
200
6
200
7
200
8
200
9
201
0
201
1
201
2
201
3
3-y
ea
r R
un
nin
g A
vg A
u D
iscove
red
(M
oz)
19
95
7
Peak
Discovery
GLOBAL GOLD DISCOVERIES
Declining Gold Discoveries & Production
Source: SNL Metals Economics Group
GLOBAL GOLD PRODUCTION
Source: CPM Group, GFMS, and Metals Focus
70
75
80
85
90
95
100
200
3
200
4
200
5
200
6
200
7
200
8
200
9
201
0
201
1
201
2
201
3
201
4
201
5
201
6
201
7
201
8
201
9
202
0
202
1
202
2
202
3
202
4
An
nu
al P
rod
uctio
n (
Mo
z)
Peak
Production
20
15

8Sources: SNL, MineEx
Lack of Discoveries Despite Major Cumulative Exploration Spend
GLOBAL GOLD EXPLORATION SPENDING vs DISCOVERIES & GOLD PRICE
0
2
4
6
8
10
12
0
20
40
60
80
100
120
140
160
1990 1991 1992 1993 1994 1995 1996 1997 1998 1999 2000 2001 2002 2003 2004 2005 2006 2007 2008 2009 2010 2011 2012 2013
Exp
lora
tio
n S
pen
d (
$B
)
3-y
ear
Ru
nn
ing
Avg
Au
Dis
co
ve
red
(M
oz)
3-year Running Avg Au Discovered (Moz) Exploration Spending
Peak
Exploration
Spend
Average Annual Gold Price
GOLD PRICE DOWNTURN
• Steep sell-off in gold equities
• Major capital constraints
• Reserve depletion is challenging
Peak Discovery
$383/oz $271/oz
$1,669/oz
$1,411/oz
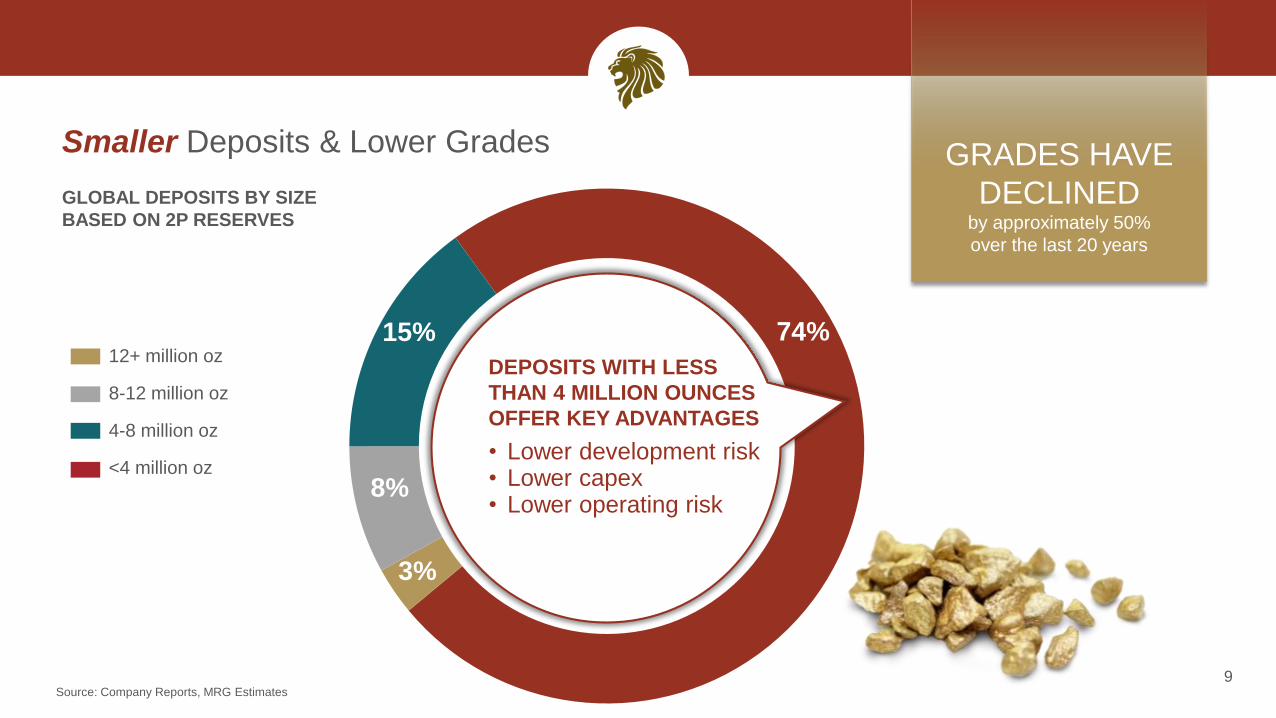
74%
3%
8%
15%
Smaller Deposits & Lower Grades
9Source: Company Reports, MRG Estimates
GLOBAL DEPOSITS BY SIZE
BASED ON 2P RESERVES
12+ million oz
8-12 million oz
4-8 million oz
<4 million oz
GRADES HAVE
DECLINED by approximately 50%
over the last 20 years
DEPOSITS WITH LESS
THAN 4 MILLION OUNCES
OFFER KEY ADVANTAGES
• Lower development risk• Lower capex• Lower operating risk
West Africa: One of the Fastest Growing
Gold Mining Regions
10
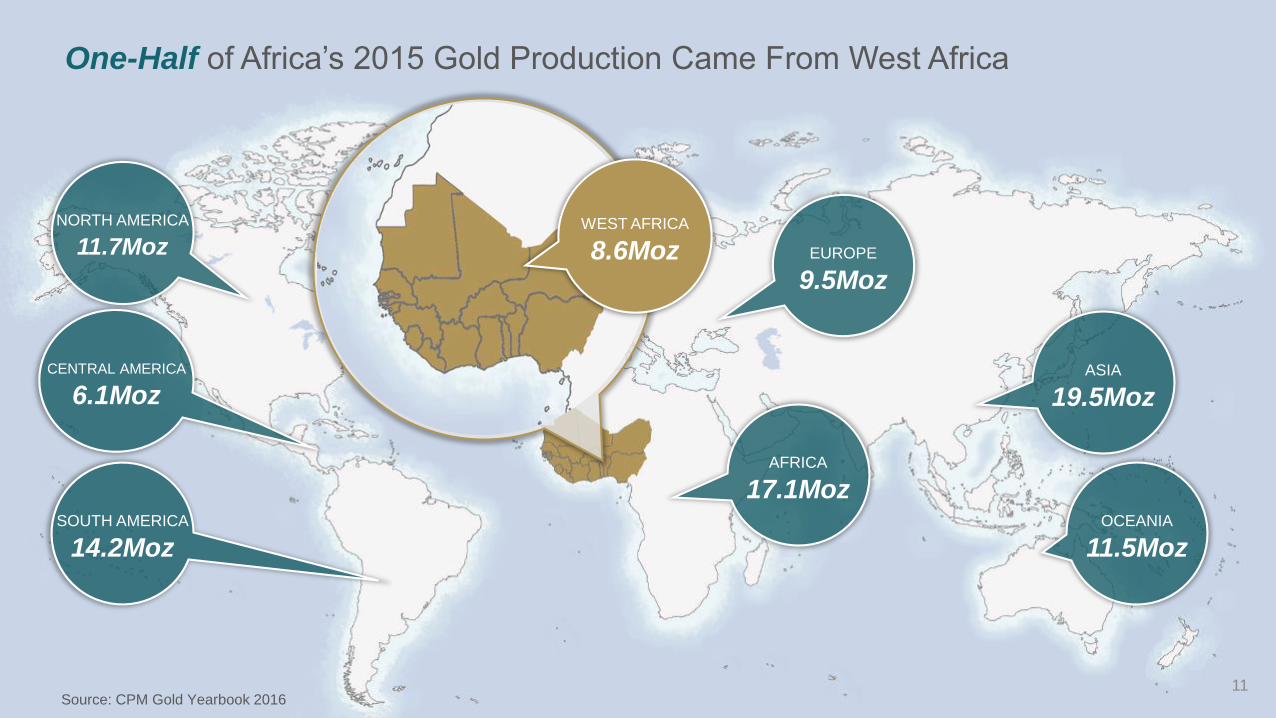
Source: CPM Gold Yearbook 201611
One-Half of Africa’s 2015 Gold Production Came From West Africa
NORTH AMERICA
11.7Moz
CENTRAL AMERICA
6.1Moz
SOUTH AMERICA
14.2Moz
EUROPE
9.5Moz
ASIA
19.5Moz
OCEANIA
11.5Moz
AFRICA
17.1Moz
WEST AFRICA
8.6Moz

Source: CPM Gold Yearbook 201612
GLOBAL GOLD PRODUCTION CAGR
1990 - 2015
3 Out of Top 5 Fastest Growing Gold Mining Regions are in Africa
10.2% 9.9% 9.6%8.5%
7.5%
5.2%
3.9%
0.9%
(0.5%) (0.9%)
(5.6%)CentralAmerica
Europe East Africa West Africa CentralAfrica
Asia SouthAmerica
Oceania SouthernAfrica
NorthAmerica
SouthAfrica
West
Africa
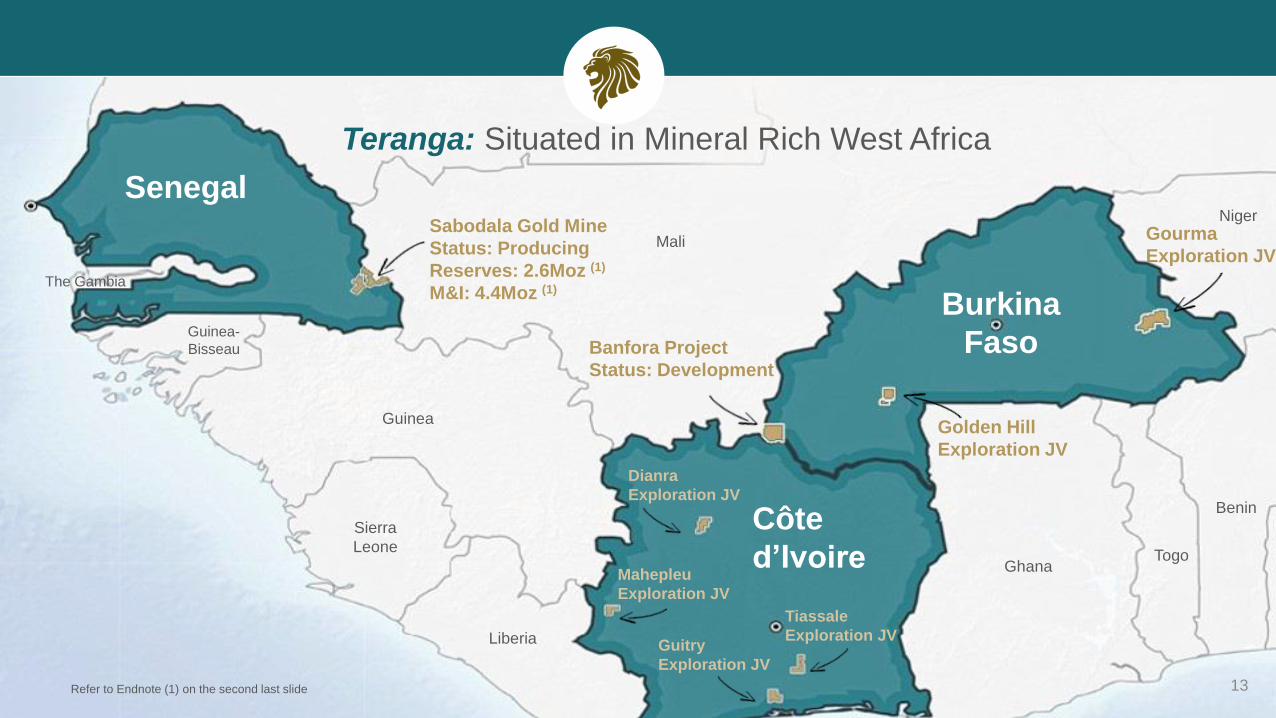
Senegal
Côte
d’Ivoire
Burkina
Faso
Mali
Guinea
Guinea-
Bisseau
The Gambia
Ghana
Benin
Niger
Sierra
Leone
Liberia
Togo
Sabodala Gold Mine
Status: Producing
Reserves: 2.6Moz (1)
M&I: 4.4Moz (1)
13
Teranga: Situated in Mineral Rich West Africa
Banfora Project
Status: Development
Golden Hill
Exploration JV
Gourma
Exploration JV
Refer to Endnote (1) on the second last slide
Guitry
Exploration JV
Dianra
Exploration JV
Mahepleu
Exploration JV
Tiassale
Exploration JV
Refer to Endnotes (1) and (7) on the second last slide 14
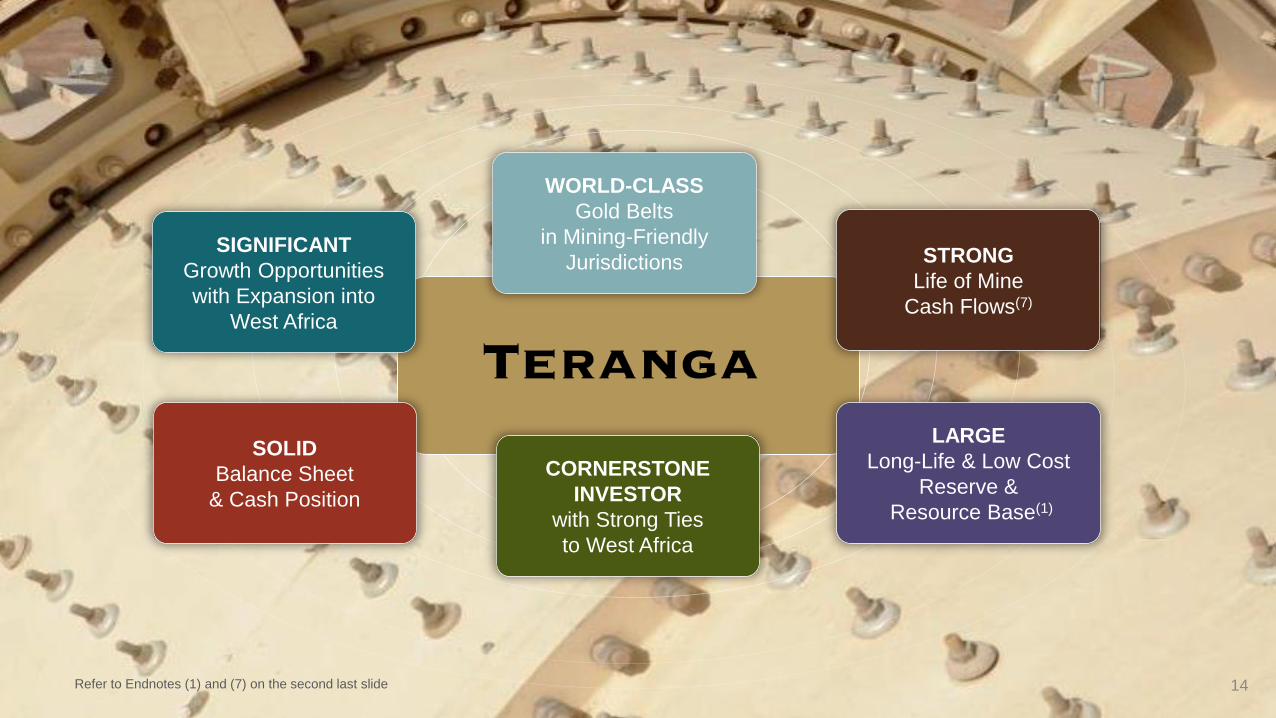
WORLD-CLASS
Gold Belts
in Mining-Friendly
Jurisdictions SIGNIFICANT
Growth Opportunities
with Expansion into
West Africa
SOLID
Balance Sheet
& Cash Position
STRONG
Life of Mine
Cash Flows(7)
CORNERSTONE
INVESTOR
with Strong Ties
to West Africa
LARGE
Long-Life & Low Cost
Reserve &
Resource Base(1)

Sabodala Gold Mine – 1.2 Million Ounces Produced Since 2010
Senegal, West Africa
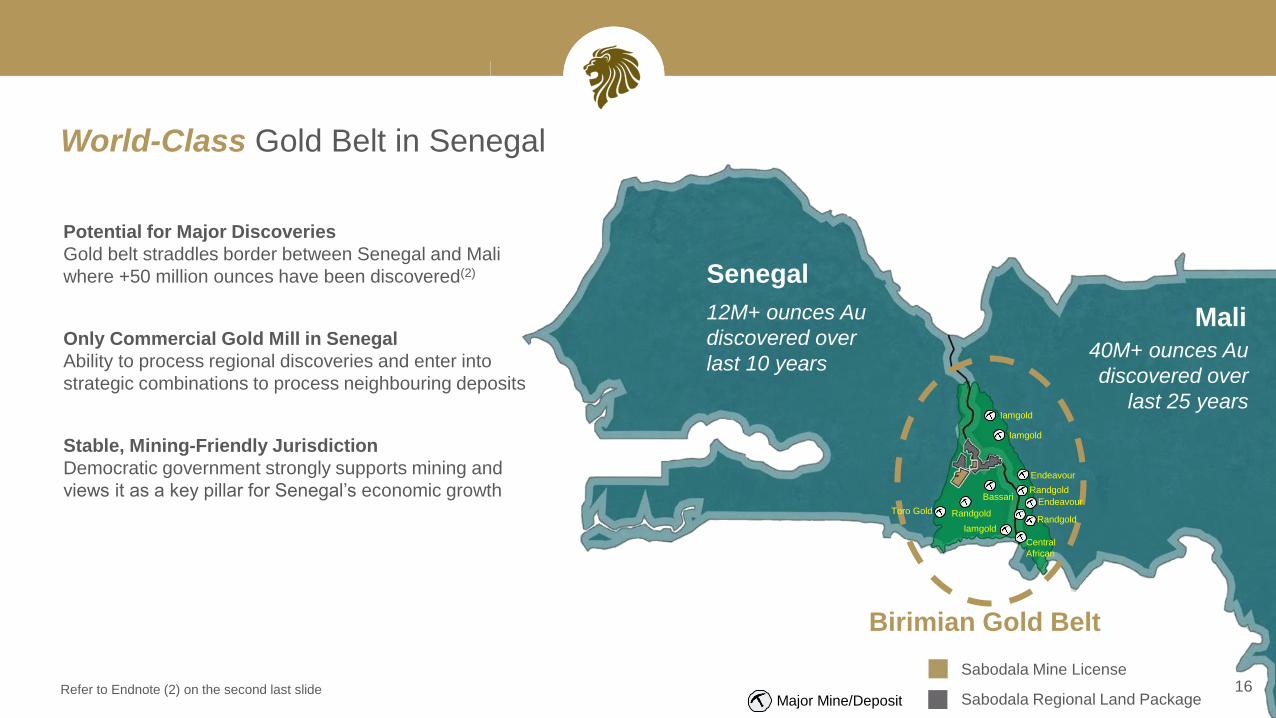
World-Class Gold Belt in Senegal
16Refer to Endnote (2) on the second last slide
Senegal
Mali12M+ ounces Au
discovered over
last 10 years
Sabodala Mine License
Sabodala Regional Land Package
40M+ ounces Au
discovered over
last 25 years
Birimian Gold Belt
Potential for Major Discoveries
Gold belt straddles border between Senegal and Mali
where +50 million ounces have been discovered(2)
Only Commercial Gold Mill in Senegal
Ability to process regional discoveries and enter into
strategic combinations to process neighbouring deposits
Stable, Mining-Friendly Jurisdiction
Democratic government strongly supports mining and
views it as a key pillar for Senegal’s economic growth
Major Mine/Deposit
Toro Gold Randgold
Bassari
Iamgold
Iamgold
Endeavour
Randgold
Iamgold
Central
African
Randgold
Endeavour
Sabodala
Mill
Teranga Prospects
Ore Shells Projected
to Surface
Masato Style Bulk
Tonnage Gold Trend
Golouma Style High-
Grade Gold Trend
Mining Concession
Exploration Permits
Previous Mine License
Gora
Pit
Mali
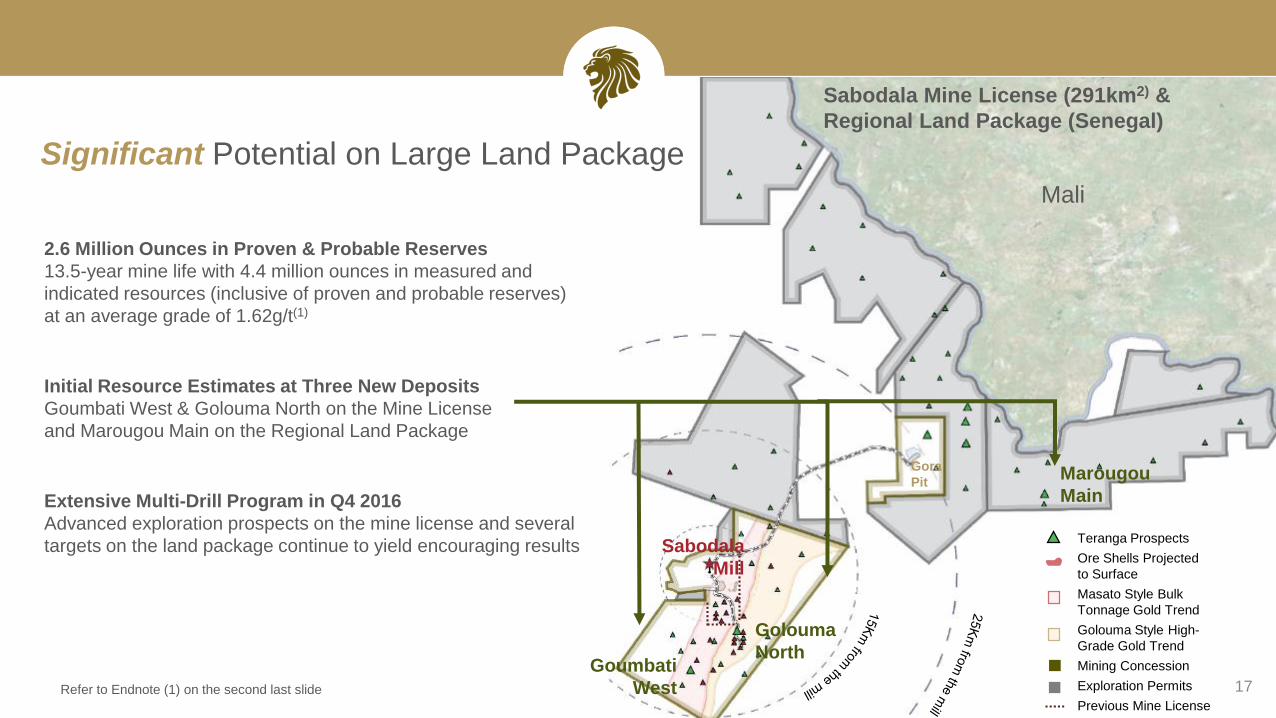
Significant Potential on Large Land Package
17
Sabodala Mine License (291km2) &
Regional Land Package (Senegal)
Golouma
NorthGoumbati
West
Marougou
Main
2.6 Million Ounces in Proven & Probable Reserves
13.5-year mine life with 4.4 million ounces in measured and
indicated resources (inclusive of proven and probable reserves)
at an average grade of 1.62g/t(1)
Initial Resource Estimates at Three New Deposits
Goumbati West & Golouma North on the Mine License
and Marougou Main on the Regional Land Package
Extensive Multi-Drill Program in Q4 2016
Advanced exploration prospects on the mine license and several
targets on the land package continue to yield encouraging results
Refer to Endnote (1) on the second last slide
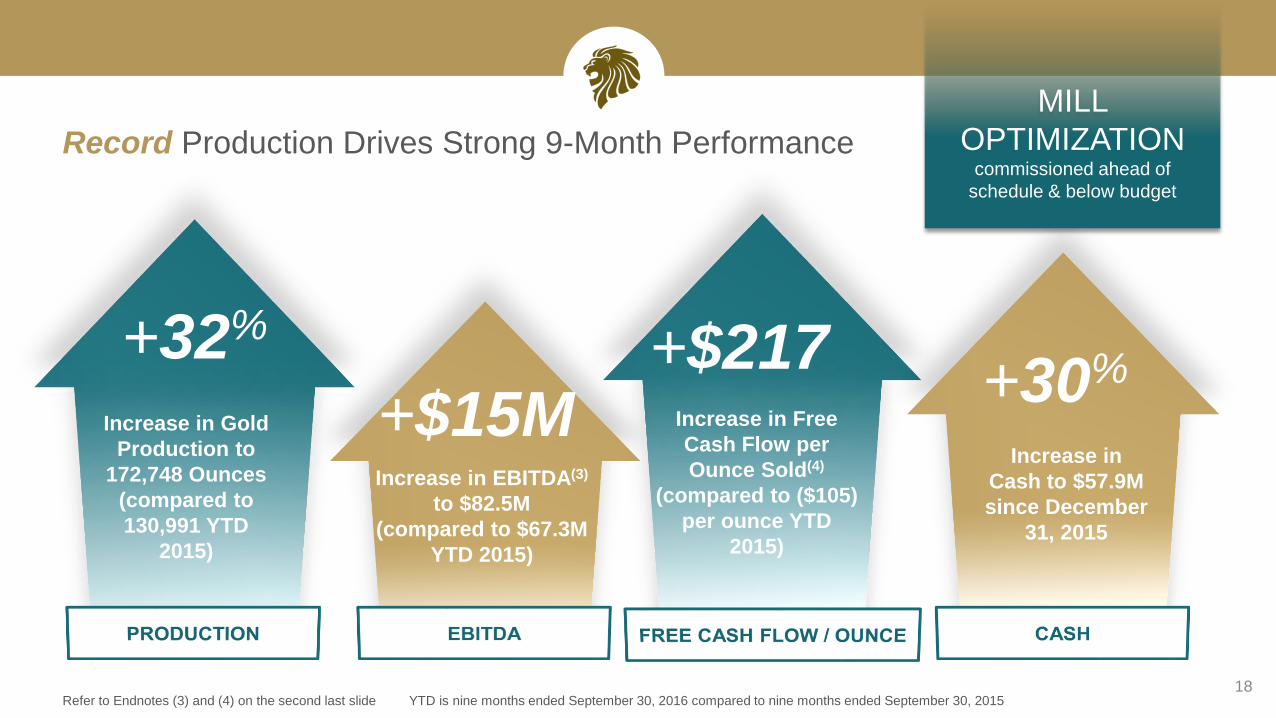
Record Production Drives Strong 9-Month Performance
18
Increase in Gold
Production to
172,748 Ounces
(compared to
130,991 YTD
2015)
+32%
Increase in
Cash to $57.9M
since December
31, 2015
+30%
Refer to Endnotes (3) and (4) on the second last slide YTD is nine months ended September 30, 2016 compared to nine months ended September 30, 2015
Increase in EBITDA(3)
to $82.5M
(compared to $67.3M
YTD 2015)
+$15M Increase in Free
Cash Flow per
Ounce Sold(4)
(compared to ($105)
per ounce YTD
2015)
+$217
MILL
OPTIMIZATION commissioned ahead of
schedule & below budget

Refer to Endnotes (5) and (6) on the second last slide
Significant Upside Potential to Sabodala Production Profile
19
2012 2013 2014 2015 2016E 2017E 2018E 2019E 2020E 2021E 2022E 2023E 2024E 2025E 2026E 2027E 2028E 2029E
Resource conversion
New discoveries(5)
Greater material movement
Underground development
Optimizing higher grade oxide
feed to Sabodala mill
Opportunities to further increase production
Sabodala base case production (Koz Au)(6)
200koz
+200Koz average annual production from 2012- 2024(6)
2016 Guidance: 200,000 – 215,000oz(6)
Produced YTD: 172,748oz
2016E 2017E 2018E 2019E 2020E 2021E 2022E 2023E 2024E 2025E 2026E 2027E 2028E 2029E
Refer to Endnotes (7) and (8) on the second last slide
Attractive Cash Flow & Low Sustaining Capex Over Sabodala Life of Mine
20
ANTICIPATED LIFE OF MINE
CASH FLOW(7)
$240/ozat $1,200 gold
*Fixed portion of Franco-Nevada gold stream ends in 2019 and
will be replaced by variable stream, estimated to be $58/oz Life of
Mine
2016E – 2020E LOM
Gold Price $ 1,200 $ 1,200
All-in Sustaining Costs(8) $ 914 $ 887
$ 286 $ 313
Franco-Nevada Stream* $ 92 $ 73
Cash Flow per oz(7) $ 194 $ 240 2016E 2017E 2018E 2019E 2020E 2021E 2022E 2023E 2024E 2025E 2026E 2027E 2028E 2029E
$21 $65 $37 $42 $13 ($44) $7 $68 $137 $34 $27 $53 $66 $22
ANTICIPATED ANNUAL CASH FLOW ($M)(7)
before interest, taxes, debt, dividends, closure costs, and working capital

Expanding Into Burkina FasoBurkina Faso, West Africa
21
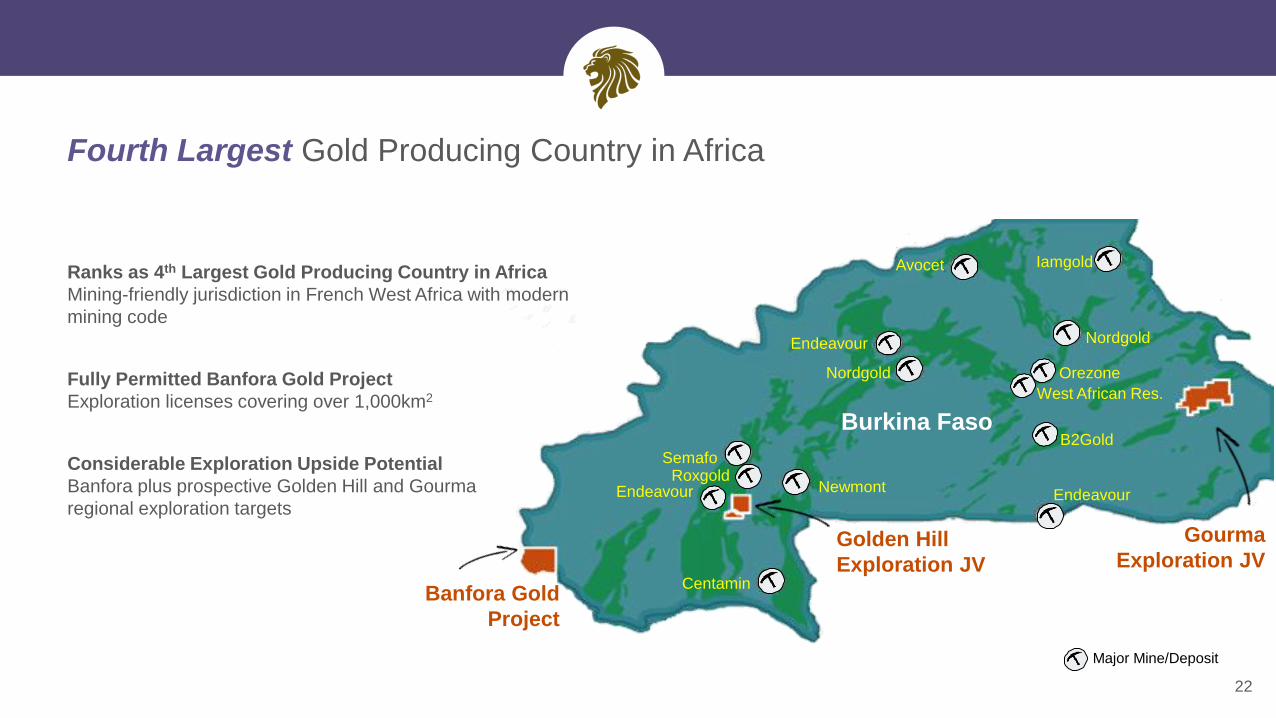
Banfora Gold
Project
Golden Hill
Exploration JV
Gourma
Exploration JV
Burkina Faso
Centamin
Newmont
Semafo
Nordgold
Avocet Iamgold
Nordgold
Ranks as 4th Largest Gold Producing Country in Africa
Mining-friendly jurisdiction in French West Africa with modern
mining code
Fully Permitted Banfora Gold Project
Exploration licenses covering over 1,000km2
Considerable Exploration Upside Potential
Banfora plus prospective Golden Hill and Gourma
regional exploration targets
Major Mine/Deposit
Fourth Largest Gold Producing Country in Africa
22
RoxgoldEndeavour
Endeavour
Orezone
West African Res.
B2Gold
Endeavour

23
Banfora Gold Project (Burkina Faso)
BAGU SUD
/WEAH
KAFINA WEST
OUAHIRI
Multiple Targets Within Trucking Distance to Proposed
Banfora Mill
• Ouahiri prospect is the highest priority target and
displays a similar geochemical footprint in both size
and tenor as Nogbele deposit
• Additional priority prospects are being explored in Q4
where previous work has identified strong gold
anomalies
KONANDOUGOU
BAZOGO
BASSONOGRO
HILLSIDE
MUDDI
SUD
Proposed
Plant
Completed Exploration Work Identifies Mineralisation
Drilling Completed at Nogbele, Fourkoura & Samavogo
• Results confirming mineralisation at Banfora and its
exploration potential
• Drilling to commence at Stinger deposit in Q4
• Comprehensive exploration through 2017 to continue
drilling within the 4 deposits; work underway to complete
a NI 43-101 study by mid-2017
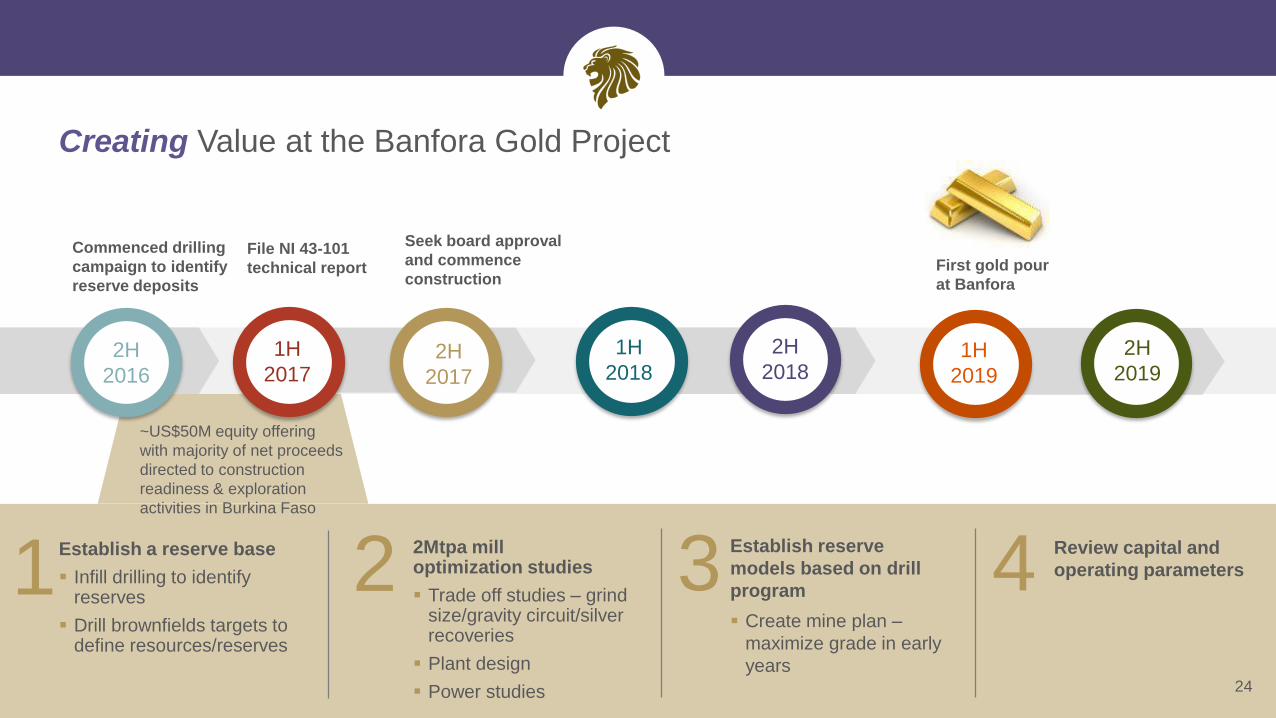
Creating Value at the Banfora Gold Project
24
Establish a reserve base
Infill drilling to identify reserves
Drill brownfields targets to define resources/reserves
2Mtpa mill optimization studies
Trade off studies – grind size/gravity circuit/silver recoveries
Plant design
Power studies
Establish reserve
models based on drill
program
Create mine plan –
maximize grade in early
years
Review capital and
operating parameters
2H
2016
1H
20172H
2017
1H
2018
2H
20181H
2019
2H
2019
Commenced drilling
campaign to identify
reserve deposits
File NI 43-101
technical report
Seek board approval
and commence
constructionFirst gold pour
at Banfora
1 2 3 4
~US$50M equity offering
with majority of net proceeds
directed to construction
readiness & exploration
activities in Burkina Faso
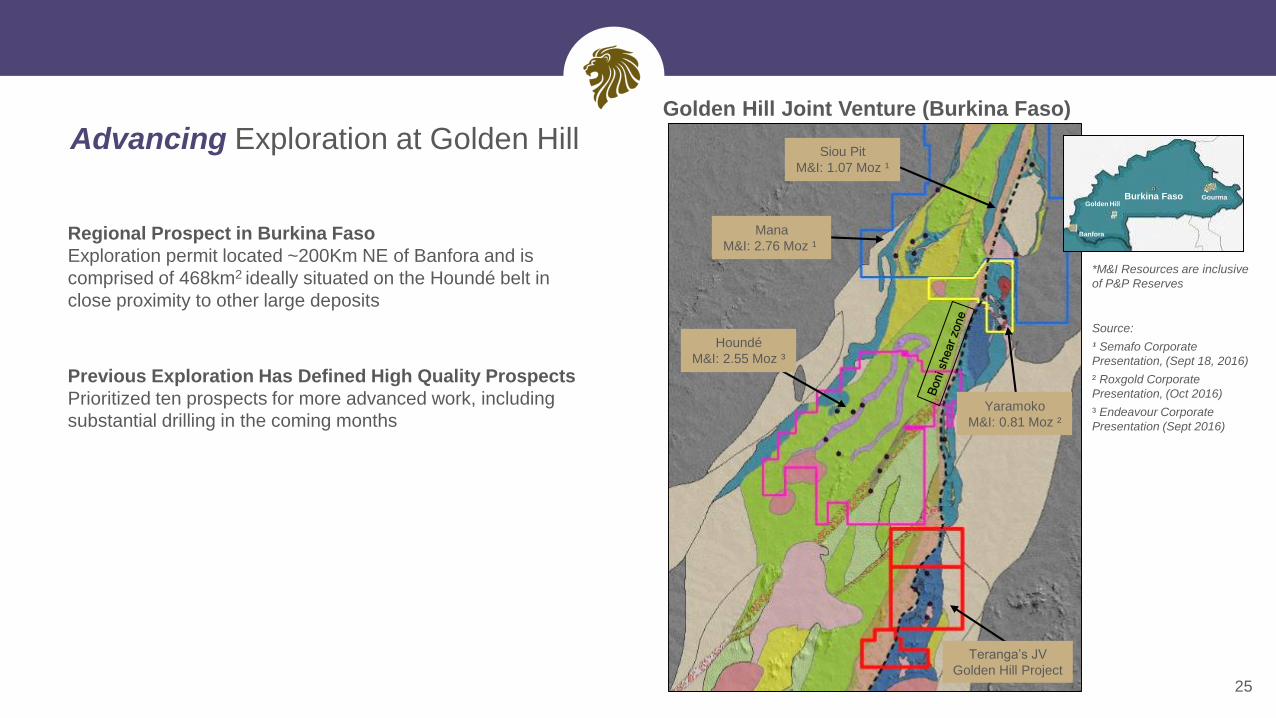
Siou Pit
M&I: 1.07 Moz ¹
Houndé
M&I: 2.55 Moz ³
Yaramoko
M&I: 0.81 Moz ²
Mana
M&I: 2.76 Moz ¹
Teranga’s JV
Golden Hill Project
Advancing Exploration at Golden Hill
Regional Prospect in Burkina Faso
Exploration permit located ~200Km NE of Banfora and is
comprised of 468km2 ideally situated on the Houndé belt in
close proximity to other large deposits
Previous Exploration Has Defined High Quality Prospects
Prioritized ten prospects for more advanced work, including
substantial drilling in the coming months
25
GourmaGolden Hill
Banfora
Burkina Faso
*M&I Resources are inclusive
of P&P Reserves
Source:
¹ Semafo Corporate
Presentation, (Sept 18, 2016)
² Roxgold Corporate
Presentation, (Oct 2016)
³ Endeavour Corporate
Presentation (Sept 2016)
Golden Hill Joint Venture (Burkina Faso)
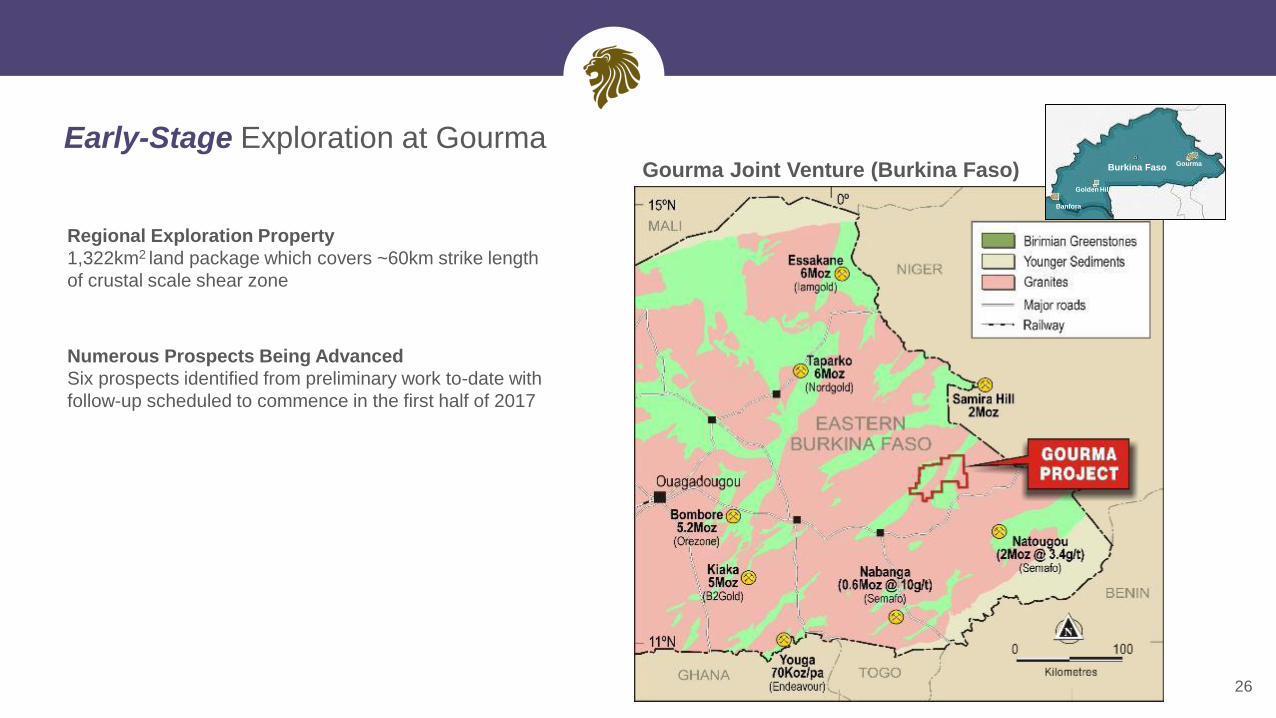
Early-Stage Exploration at Gourma
26
Regional Exploration Property
1,322km2 land package which covers ~60km strike length
of crustal scale shear zone
Numerous Prospects Being Advanced
Six prospects identified from preliminary work to-date with
follow-up scheduled to commence in the first half of 2017
Gourma
Golden Hill
Banfora
Burkina FasoGourma Joint Venture (Burkina Faso)
Joint Venture With Miminvest
Côte d’Ivoire, West Africa
27

Endeavour
Major Mine/Deposit
Endeavour
Taurus
Newcrest
Perseus
Randgold
Cornerstone Investor is Also JV Partner
Miminvest is controlled by David Mimran who also
controls Tablo Corporation – Teranga’s largest investor
with ~98M shares (18%)
Strong Partner With In-depth Local Knowledge
Mimran Group has a long history of operating successfully
and responsibly in Africa and is the largest private sector
employer in both Senegal and Côte d’Ivoire
Four Exploration Permits
Covering 1,400km2 in prolific Côte d'Ivoire, an untapped
frontier for gold in West Africa
Côte d’Ivoire
Optionality in Côte d’Ivoire with Miminvest Joint Venture Agreement
Mahepleu
Exploration JV
Dianra
Exploration JV
Guitry
Exploration JV
Tiassale
Exploration JV
28
A Compelling Growth Story & Investment Opportunity
Teranga Gold
29
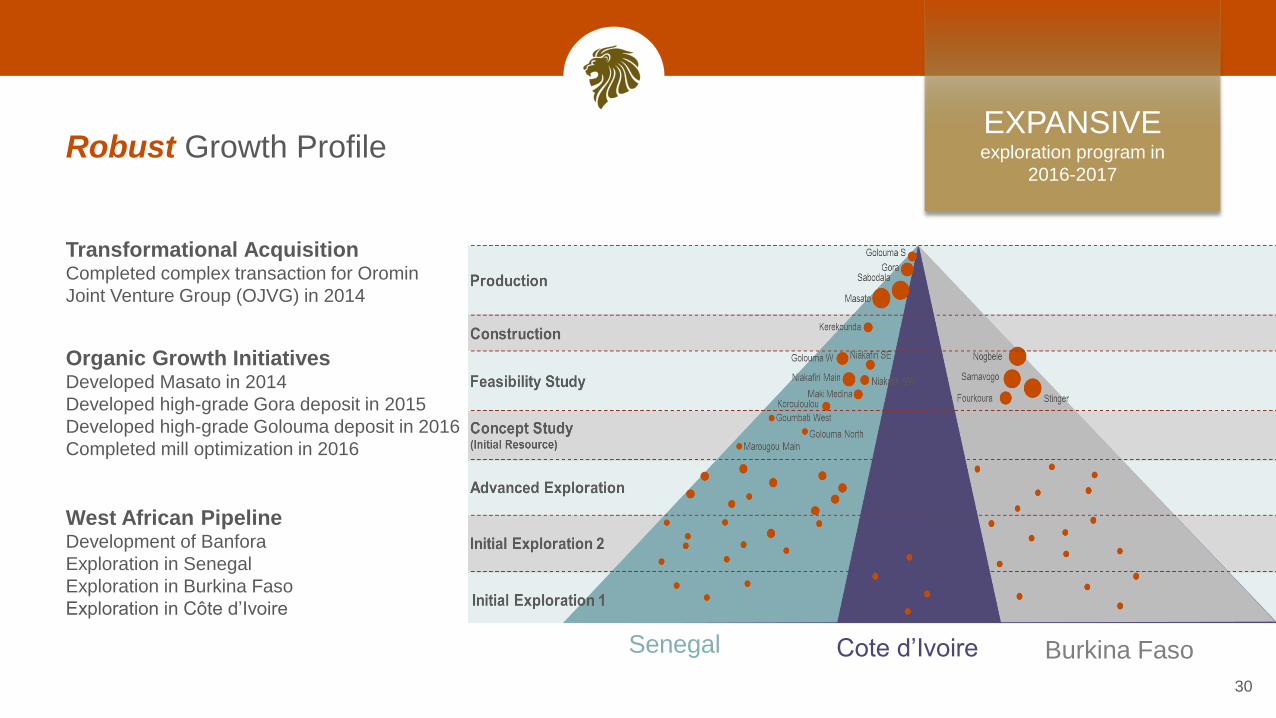
Robust Growth Profile
30
Transformational AcquisitionCompleted complex transaction for Oromin
Joint Venture Group (OJVG) in 2014
Organic Growth InitiativesDeveloped Masato in 2014
Developed high-grade Gora deposit in 2015
Developed high-grade Golouma deposit in 2016
Completed mill optimization in 2016
West African PipelineDevelopment of Banfora
Exploration in Senegal
Exploration in Burkina Faso
Exploration in Côte d’Ivoire
Senegal Cote d’Ivoire Burkina Faso
EXPANSIVEexploration program in
2016-2017
3
6
6
7
8
12
12
23
Teranga
Endeavour
Semafo
Alacer
Golden Star
Asanko
B2Gold
Roxgold
Enterprise Value/2016E EBITDA
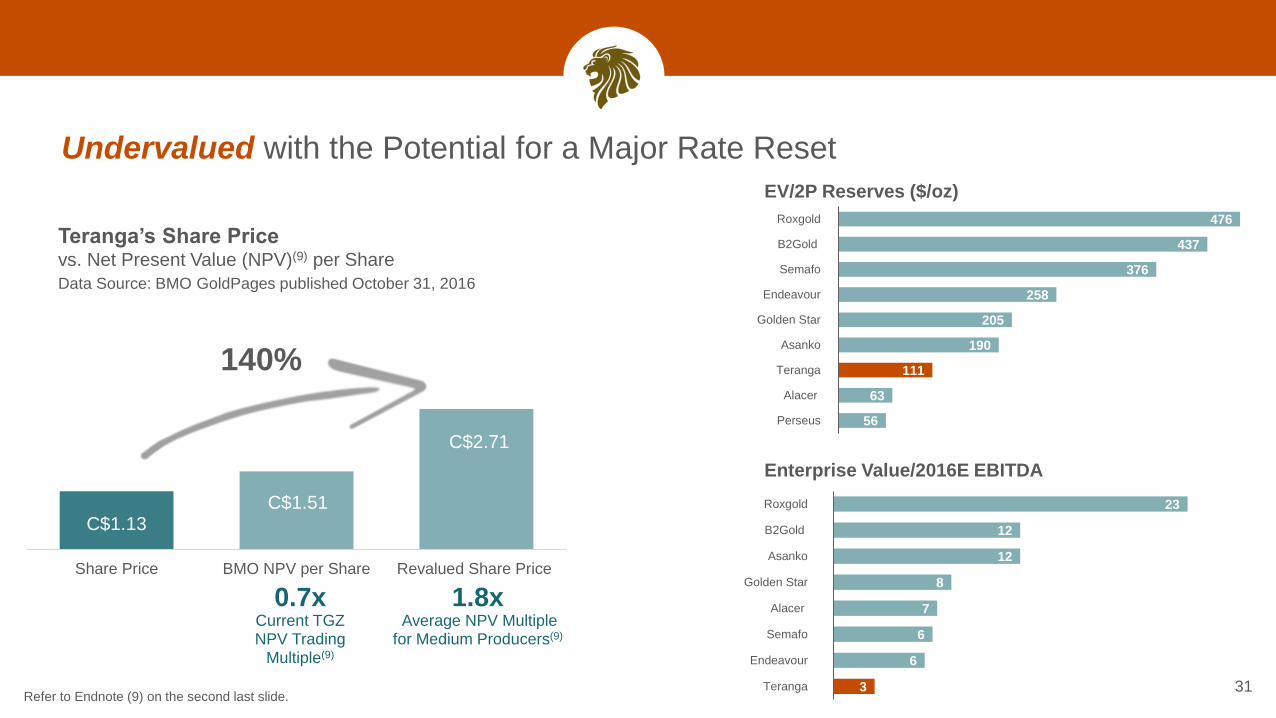
Undervalued with the Potential for a Major Rate Reset
31
Teranga’s Share Price vs. Net Present Value (NPV)(9) per Share
140%
Refer to Endnote (9) on the second last slide.
C$1.13C$1.51
C$2.71
Share Price BMO NPV per Share Revalued Share Price
0.7xCurrent TGZ NPV Trading
Multiple(9)
1.8xAverage NPV Multiple
for Medium Producers(9)
56
63
111
190
205
258
376
437
476
Perseus
Alacer
Teranga
Asanko
Golden Star
Endeavour
Semafo
B2Gold
Roxgold
EV/2P Reserves ($/oz)
Data Source: BMO GoldPages published October 31, 2016

Appendices

33
CAPITAL STRUCTURE
Basic common shares outstanding 536,713,916
Stock options outstanding 28,270,365
Fully diluted 555,699,443
Number of shares owned by insiders 101,497,990
Market capitalization C$472M / US$349M
Enterprise value C$413M / US$305M
Net Cash $44.1M
TGZ SHARE PRICE PERFORMANCE
YTD Share Performance
As of November 18, 2016
+80%
TOP 5 SHAREHOLDERS % O/S POSITION
Tablo Corporation 18.3 97,981,960
Van Eck Associates Corporation 9.9 53,378,305
Rafferty Asset Management 5.4 29,021,160
Ruffer LLP 2.7 14,366,000
Sentry Investments Inc. 2.5 13,309,475
As of November 21, 2016
+78%
+15%
TGZ-TSX
GDXJ
Gold Price
34
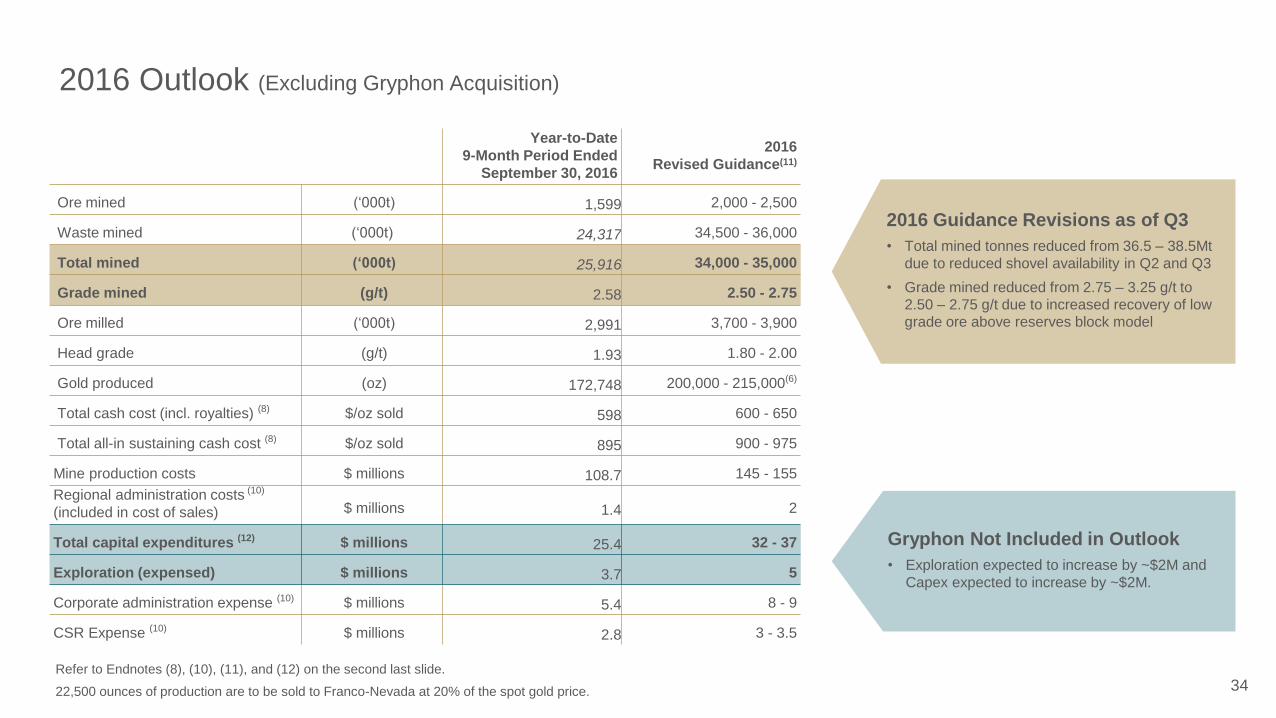
2016 Outlook (Excluding Gryphon Acquisition)
Refer to Endnotes (8), (10), (11), and (12) on the second last slide.
22,500 ounces of production are to be sold to Franco-Nevada at 20% of the spot gold price.
Year-to-Date
9-Month Period Ended
September 30, 2016
2016
Revised Guidance(11)
Ore mined (‘000t) 1,599 2,000 - 2,500
Waste mined (‘000t) 24,317 34,500 - 36,000
Total mined (‘000t) 25,916 34,000 - 35,000
Grade mined (g/t) 2.58 2.50 - 2.75
Ore milled (‘000t) 2,991 3,700 - 3,900
Head grade (g/t) 1.93 1.80 - 2.00
Gold produced (oz) 172,748 200,000 - 215,000(6)
Total cash cost (incl. royalties) (8) $/oz sold 598 600 - 650
Total all-in sustaining cash cost (8) $/oz sold 895 900 - 975
Mine production costs $ millions 108.7 145 - 155
Regional administration costs (10)
(included in cost of sales) $ millions 1.4 2
Total capital expenditures (12) $ millions 25.4 32 - 37
Exploration (expensed) $ millions 3.7 5
Corporate administration expense (10) $ millions 5.4 8 - 9
CSR Expense (10) $ millions 2.8 3 - 3.5
2016 Guidance Revisions as of Q3
• Total mined tonnes reduced from 36.5 – 38.5Mt
due to reduced shovel availability in Q2 and Q3
• Grade mined reduced from 2.75 – 3.25 g/t to
2.50 – 2.75 g/t due to increased recovery of low
grade ore above reserves block model
Gryphon Not Included in Outlook
• Exploration expected to increase by ~$2M and
Capex expected to increase by ~$2M.

Life of Mine
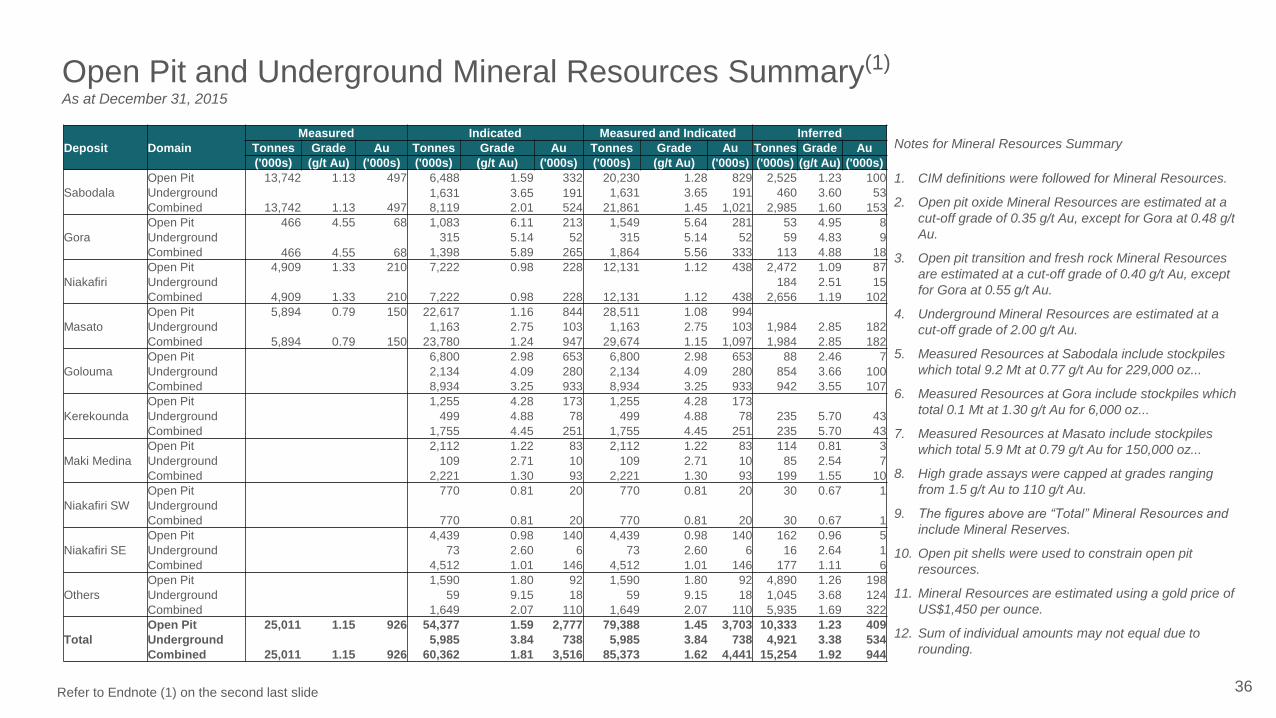
Open Pit and Underground Mineral Resources Summary(1)
As at December 31, 2015
Notes for Mineral Resources Summary
1. CIM definitions were followed for Mineral Resources.
2. Open pit oxide Mineral Resources are estimated at a
cut-off grade of 0.35 g/t Au, except for Gora at 0.48 g/t
Au.
3. Open pit transition and fresh rock Mineral Resources
are estimated at a cut-off grade of 0.40 g/t Au, except
for Gora at 0.55 g/t Au.
4. Underground Mineral Resources are estimated at a
cut-off grade of 2.00 g/t Au.
5. Measured Resources at Sabodala include stockpiles
which total 9.2 Mt at 0.77 g/t Au for 229,000 oz...
6. Measured Resources at Gora include stockpiles which
total 0.1 Mt at 1.30 g/t Au for 6,000 oz...
7. Measured Resources at Masato include stockpiles
which total 5.9 Mt at 0.79 g/t Au for 150,000 oz...
8. High grade assays were capped at grades ranging
from 1.5 g/t Au to 110 g/t Au.
9. The figures above are “Total” Mineral Resources and
include Mineral Reserves.
10. Open pit shells were used to constrain open pit
resources.
11. Mineral Resources are estimated using a gold price of
US$1,450 per ounce.
12. Sum of individual amounts may not equal due to
rounding.
Deposit Domain
Measured Indicated Measured and Indicated Inferred
Tonnes Grade Au Tonnes Grade Au Tonnes Grade Au Tonnes Grade Au
('000s) (g/t Au) ('000s) ('000s) (g/t Au) ('000s) ('000s) (g/t Au) ('000s) ('000s) (g/t Au) ('000s)
Sabodala
Open Pit 13,742 1.13 497 6,488 1.59 332 20,230 1.28 829 2,525 1.23 100
Underground 1,631 3.65 191 1,631 3.65 191 460 3.60 53
Combined 13,742 1.13 497 8,119 2.01 524 21,861 1.45 1,021 2,985 1.60 153
Gora
Open Pit 466 4.55 68 1,083 6.11 213 1,549 5.64 281 53 4.95 8
Underground 315 5.14 52 315 5.14 52 59 4.83 9
Combined 466 4.55 68 1,398 5.89 265 1,864 5.56 333 113 4.88 18
Niakafiri
Open Pit 4,909 1.33 210 7,222 0.98 228 12,131 1.12 438 2,472 1.09 87
Underground 184 2.51 15
Combined 4,909 1.33 210 7,222 0.98 228 12,131 1.12 438 2,656 1.19 102
Masato
Open Pit 5,894 0.79 150 22,617 1.16 844 28,511 1.08 994
Underground 1,163 2.75 103 1,163 2.75 103 1,984 2.85 182
Combined 5,894 0.79 150 23,780 1.24 947 29,674 1.15 1,097 1,984 2.85 182
Golouma
Open Pit 6,800 2.98 653 6,800 2.98 653 88 2.46 7
Underground 2,134 4.09 280 2,134 4.09 280 854 3.66 100
Combined 8,934 3.25 933 8,934 3.25 933 942 3.55 107
Kerekounda
Open Pit 1,255 4.28 173 1,255 4.28 173
Underground 499 4.88 78 499 4.88 78 235 5.70 43
Combined 1,755 4.45 251 1,755 4.45 251 235 5.70 43
Maki Medina
Open Pit 2,112 1.22 83 2,112 1.22 83 114 0.81 3
Underground 109 2.71 10 109 2.71 10 85 2.54 7
Combined 2,221 1.30 93 2,221 1.30 93 199 1.55 10
Niakafiri SW
Open Pit 770 0.81 20 770 0.81 20 30 0.67 1
Underground
Combined 770 0.81 20 770 0.81 20 30 0.67 1
Niakafiri SE
Open Pit 4,439 0.98 140 4,439 0.98 140 162 0.96 5
Underground 73 2.60 6 73 2.60 6 16 2.64 1
Combined 4,512 1.01 146 4,512 1.01 146 177 1.11 6
Others
Open Pit 1,590 1.80 92 1,590 1.80 92 4,890 1.26 198
Underground 59 9.15 18 59 9.15 18 1,045 3.68 124
Combined 1,649 2.07 110 1,649 2.07 110 5,935 1.69 322
Total
Open Pit 25,011 1.15 926 54,377 1.59 2,777 79,388 1.45 3,703 10,333 1.23 409
Underground 5,985 3.84 738 5,985 3.84 738 4,921 3.38 534
Combined 25,011 1.15 926 60,362 1.81 3,516 85,373 1.62 4,441 15,254 1.92 944
36Refer to Endnote (1) on the second last slide
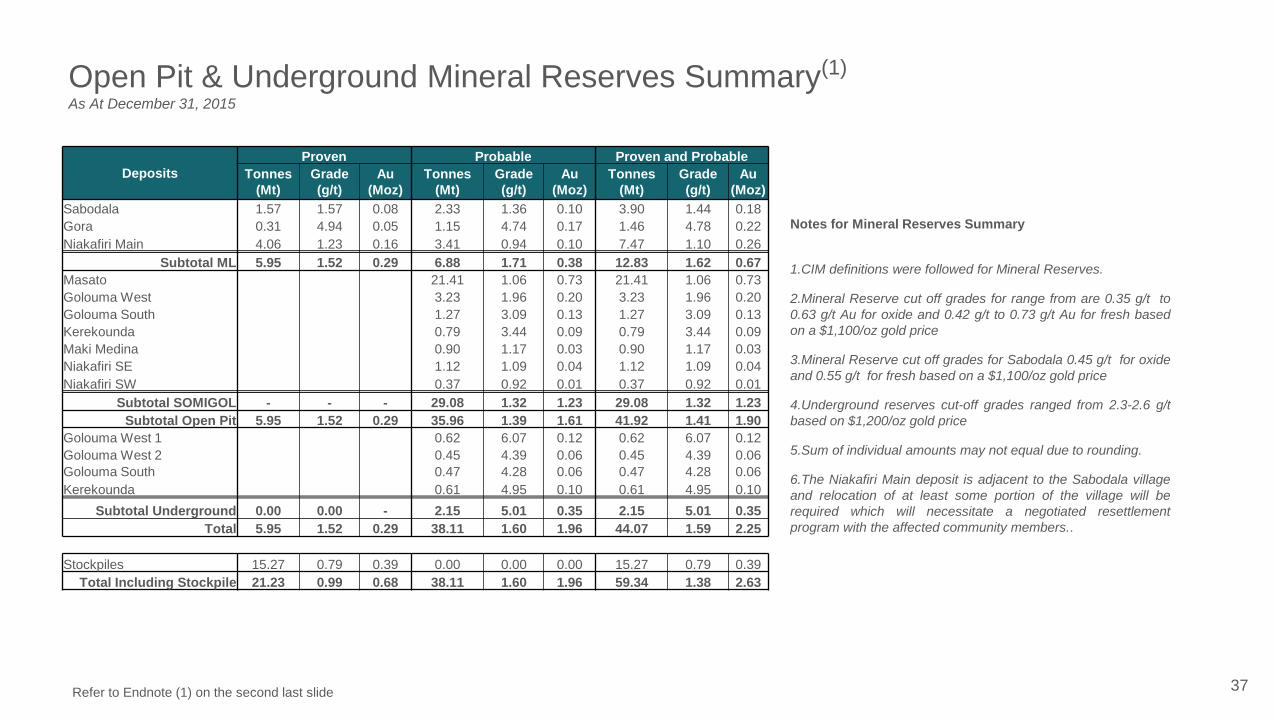
Open Pit & Underground Mineral Reserves Summary(1)
As At December 31, 2015
Notes for Mineral Reserves Summary
1.CIM definitions were followed for Mineral Reserves.
2.Mineral Reserve cut off grades for range from are 0.35 g/t to
0.63 g/t Au for oxide and 0.42 g/t to 0.73 g/t Au for fresh based
on a $1,100/oz gold price
3.Mineral Reserve cut off grades for Sabodala 0.45 g/t for oxide
and 0.55 g/t for fresh based on a $1,100/oz gold price
4.Underground reserves cut-off grades ranged from 2.3-2.6 g/t
based on $1,200/oz gold price
5.Sum of individual amounts may not equal due to rounding.
6.The Niakafiri Main deposit is adjacent to the Sabodala village
and relocation of at least some portion of the village will be
required which will necessitate a negotiated resettlement
program with the affected community members..
Deposits
Proven Probable Proven and Probable
Tonnes
(Mt)
Grade
(g/t)
Au
(Moz)
Tonnes
(Mt)
Grade
(g/t)
Au
(Moz)
Tonnes
(Mt)
Grade
(g/t)
Au
(Moz)
Sabodala 1.57 1.57 0.08 2.33 1.36 0.10 3.90 1.44 0.18
Gora 0.31 4.94 0.05 1.15 4.74 0.17 1.46 4.78 0.22
Niakafiri Main 4.06 1.23 0.16 3.41 0.94 0.10 7.47 1.10 0.26
Subtotal ML 5.95 1.52 0.29 6.88 1.71 0.38 12.83 1.62 0.67
Masato 21.41 1.06 0.73 21.41 1.06 0.73
Golouma West 3.23 1.96 0.20 3.23 1.96 0.20
Golouma South 1.27 3.09 0.13 1.27 3.09 0.13
Kerekounda 0.79 3.44 0.09 0.79 3.44 0.09
Maki Medina 0.90 1.17 0.03 0.90 1.17 0.03
Niakafiri SE 1.12 1.09 0.04 1.12 1.09 0.04
Niakafiri SW 0.37 0.92 0.01 0.37 0.92 0.01
Subtotal SOMIGOL - - - 29.08 1.32 1.23 29.08 1.32 1.23
Subtotal Open Pit 5.95 1.52 0.29 35.96 1.39 1.61 41.92 1.41 1.90
Golouma West 1 0.62 6.07 0.12 0.62 6.07 0.12
Golouma West 2 0.45 4.39 0.06 0.45 4.39 0.06
Golouma South 0.47 4.28 0.06 0.47 4.28 0.06
Kerekounda 0.61 4.95 0.10 0.61 4.95 0.10
Subtotal Underground 0.00 0.00 - 2.15 5.01 0.35 2.15 5.01 0.35
Total 5.95 1.52 0.29 38.11 1.60 1.96 44.07 1.59 2.25
Stockpiles 15.27 0.79 0.39 0.00 0.00 0.00 15.27 0.79 0.39
Total Including Stockpile 21.23 0.99 0.68 38.11 1.60 1.96 59.34 1.38 2.63
37Refer to Endnote (1) on the second last slide
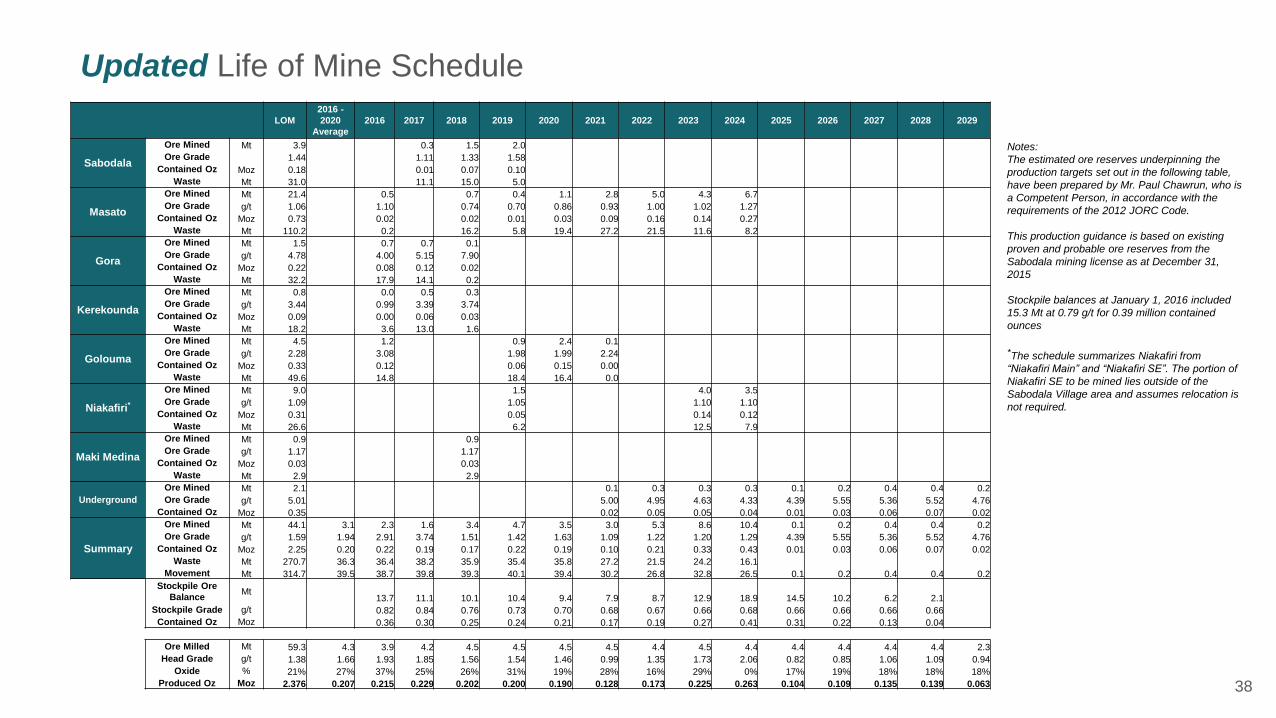
Updated Life of Mine Schedule
Notes:
The estimated ore reserves underpinning the
production targets set out in the following table,
have been prepared by Mr. Paul Chawrun, who is
a Competent Person, in accordance with the
requirements of the 2012 JORC Code.
This production guidance is based on existing
proven and probable ore reserves from the
Sabodala mining license as at December 31,
2015
Stockpile balances at January 1, 2016 included
15.3 Mt at 0.79 g/t for 0.39 million contained
ounces
*The schedule summarizes Niakafiri from
“Niakafiri Main” and “Niakafiri SE”. The portion of
Niakafiri SE to be mined lies outside of the
Sabodala Village area and assumes relocation is
not required.
LOM
2016 -
2020
Average
2016 2017 2018 2019 2020 2021 2022 2023 2024 2025 2026 2027 2028 2029
Sabodala
Ore Mined Mt 3.9 0.3 1.5 2.0
Ore Grade 1.44 1.11 1.33 1.58
Contained Oz Moz 0.18 0.01 0.07 0.10
Waste Mt 31.0 11.1 15.0 5.0
Masato
Ore Mined Mt 21.4 0.5 0.7 0.4 1.1 2.8 5.0 4.3 6.7
Ore Grade g/t 1.06 1.10 0.74 0.70 0.86 0.93 1.00 1.02 1.27
Contained Oz Moz 0.73 0.02 0.02 0.01 0.03 0.09 0.16 0.14 0.27
Waste Mt 110.2 0.2 16.2 5.8 19.4 27.2 21.5 11.6 8.2
Gora
Ore Mined Mt 1.5 0.7 0.7 0.1
Ore Grade g/t 4.78 4.00 5.15 7.90
Contained Oz Moz 0.22 0.08 0.12 0.02
Waste Mt 32.2 17.9 14.1 0.2
Kerekounda
Ore Mined Mt 0.8 0.0 0.5 0.3
Ore Grade g/t 3.44 0.99 3.39 3.74
Contained Oz Moz 0.09 0.00 0.06 0.03
Waste Mt 18.2 3.6 13.0 1.6
Golouma
Ore Mined Mt 4.5 1.2 0.9 2.4 0.1
Ore Grade g/t 2.28 3.08 1.98 1.99 2.24
Contained Oz Moz 0.33 0.12 0.06 0.15 0.00
Waste Mt 49.6 14.8 18.4 16.4 0.0
Niakafiri*
Ore Mined Mt 9.0 1.5 4.0 3.5
Ore Grade g/t 1.09 1.05 1.10 1.10
Contained Oz Moz 0.31 0.05 0.14 0.12
Waste Mt 26.6 6.2 12.5 7.9
Maki Medina
Ore Mined Mt 0.9 0.9
Ore Grade g/t 1.17 1.17
Contained Oz Moz 0.03 0.03
Waste Mt 2.9 2.9
Underground
Ore Mined Mt 2.1 0.1 0.3 0.3 0.3 0.1 0.2 0.4 0.4 0.2
Ore Grade g/t 5.01 5.00 4.95 4.63 4.33 4.39 5.55 5.36 5.52 4.76
Contained Oz Moz 0.35 0.02 0.05 0.05 0.04 0.01 0.03 0.06 0.07 0.02
Summary
Ore Mined Mt 44.1 3.1 2.3 1.6 3.4 4.7 3.5 3.0 5.3 8.6 10.4 0.1 0.2 0.4 0.4 0.2
Ore Grade g/t 1.59 1.94 2.91 3.74 1.51 1.42 1.63 1.09 1.22 1.20 1.29 4.39 5.55 5.36 5.52 4.76
Contained Oz Moz 2.25 0.20 0.22 0.19 0.17 0.22 0.19 0.10 0.21 0.33 0.43 0.01 0.03 0.06 0.07 0.02
Waste Mt 270.7 36.3 36.4 38.2 35.9 35.4 35.8 27.2 21.5 24.2 16.1
Movement Mt 314.7 39.5 38.7 39.8 39.3 40.1 39.4 30.2 26.8 32.8 26.5 0.1 0.2 0.4 0.4 0.2
Stockpile Ore
BalanceMt
13.7 11.1 10.1 10.4 9.4 7.9 8.7 12.9 18.9 14.5 10.2 6.2 2.1
Stockpile Grade g/t 0.82 0.84 0.76 0.73 0.70 0.68 0.67 0.66 0.68 0.66 0.66 0.66 0.66
Contained Oz Moz 0.36 0.30 0.25 0.24 0.21 0.17 0.19 0.27 0.41 0.31 0.22 0.13 0.04
Ore Milled Mt 59.3 4.3 3.9 4.2 4.5 4.5 4.5 4.5 4.4 4.5 4.4 4.4 4.4 4.4 4.4 2.3
Head Grade g/t 1.38 1.66 1.93 1.85 1.56 1.54 1.46 0.99 1.35 1.73 2.06 0.82 0.85 1.06 1.09 0.94
Oxide % 21% 27% 37% 25% 26% 31% 19% 28% 16% 29% 0% 17% 19% 18% 18% 18%
Produced Oz Moz 2.376 0.207 0.215 0.229 0.202 0.200 0.190 0.128 0.173 0.225 0.263 0.104 0.109 0.135 0.139 0.063 38
39
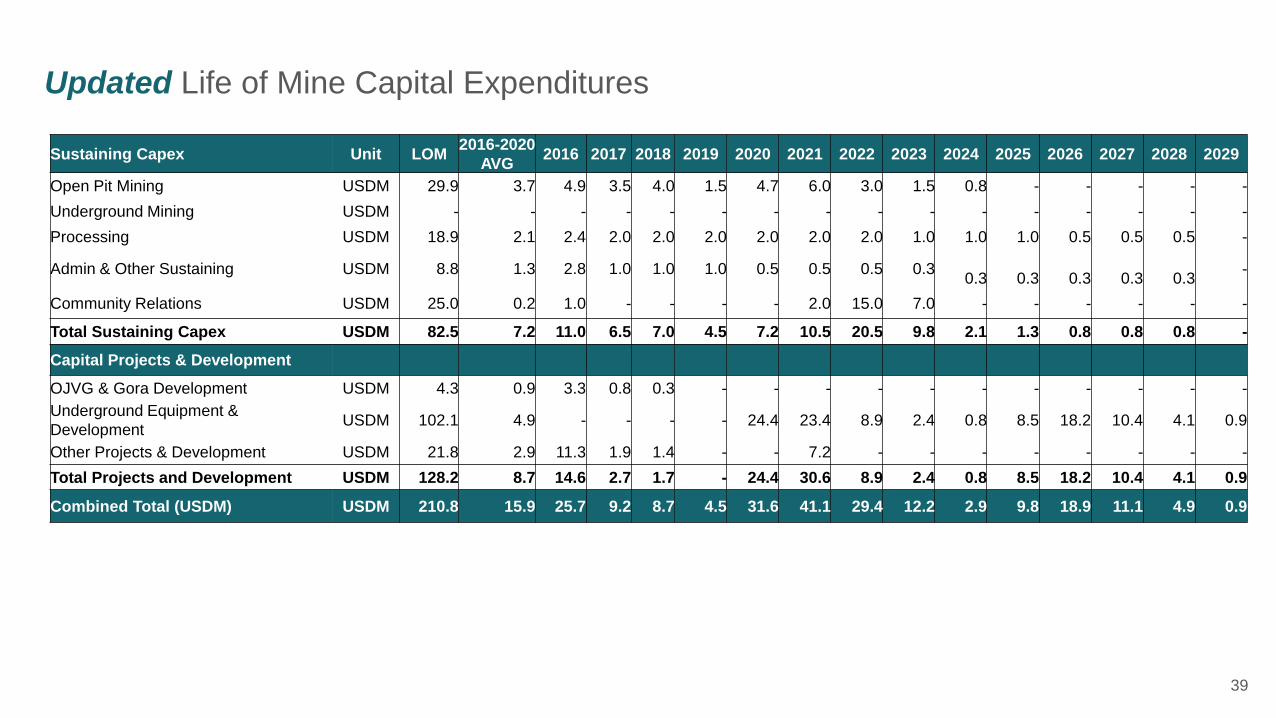
Updated Life of Mine Capital Expenditures
Sustaining Capex Unit LOM2016-2020
AVG2016 2017 2018 2019 2020 2021 2022 2023 2024 2025 2026 2027 2028 2029
Open Pit Mining USDM 29.9 3.7 4.9 3.5 4.0 1.5 4.7 6.0 3.0 1.5 0.8 - - - - -
Underground Mining USDM - - - - - - - - - - - - - - - -
Processing USDM 18.9 2.1 2.4 2.0 2.0 2.0 2.0 2.0 2.0 1.0 1.0 1.0 0.5 0.5 0.5 -
Admin & Other Sustaining USDM 8.8 1.3 2.8 1.0 1.0 1.0 0.5 0.5 0.5 0.3 0.3 0.3 0.3 0.3 0.3
-
Community Relations USDM 25.0 0.2 1.0 - - - - 2.0 15.0 7.0 - - - - - -
Total Sustaining Capex USDM 82.5 7.2 11.0 6.5 7.0 4.5 7.2 10.5 20.5 9.8 2.1 1.3 0.8 0.8 0.8 -
Capital Projects & Development
OJVG & Gora Development USDM 4.3 0.9 3.3 0.8 0.3 - - - - - - - - - - -
Underground Equipment &
DevelopmentUSDM 102.1 4.9 - - - - 24.4 23.4 8.9 2.4 0.8 8.5 18.2 10.4 4.1 0.9
Other Projects & Development USDM 21.8 2.9 11.3 1.9 1.4 - - 7.2 - - - - - - - -
Total Projects and Development USDM 128.2 8.7 14.6 2.7 1.7 - 24.4 30.6 8.9 2.4 0.8 8.5 18.2 10.4 4.1 0.9
Combined Total (USDM) USDM 210.8 15.9 25.7 9.2 8.7 4.5 31.6 41.1 29.4 12.2 2.9 9.8 18.9 11.1 4.9 0.9
40
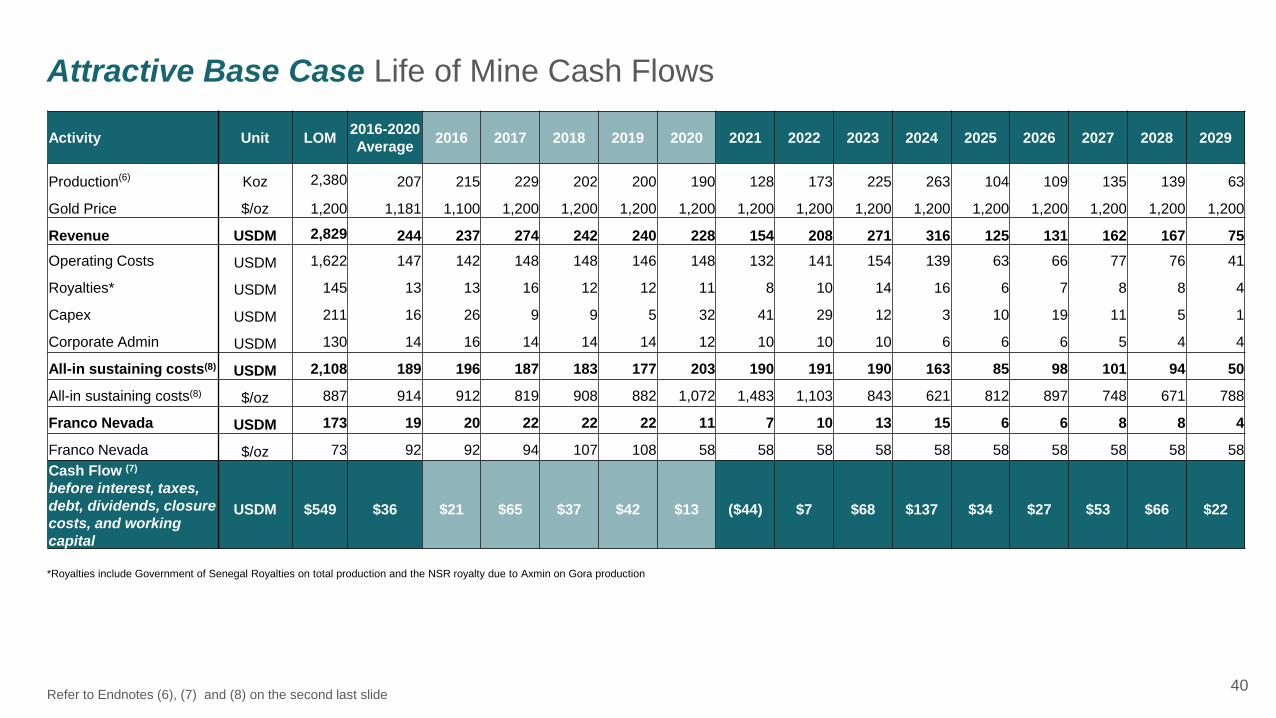
Attractive Base Case Life of Mine Cash Flows
Activity Unit LOM2016-2020
Average2016 2017 2018 2019 2020 2021 2022 2023 2024 2025 2026 2027 2028 2029
Production(6) Koz 2,380 207 215 229 202 200 190 128 173 225 263 104 109 135 139 63
Gold Price $/oz 1,200 1,181 1,100 1,200 1,200 1,200 1,200 1,200 1,200 1,200 1,200 1,200 1,200 1,200 1,200 1,200
Revenue USDM 2,829 244 237 274 242 240 228 154 208 271 316 125 131 162 167 75
Operating Costs USDM 1,622 147 142 148 148 146 148 132 141 154 139 63 66 77 76 41
Royalties* USDM 145 13 13 16 12 12 11 8 10 14 16 6 7 8 8 4
Capex USDM 211 16 26 9 9 5 32 41 29 12 3 10 19 11 5 1
Corporate Admin USDM 130 14 16 14 14 14 12 10 10 10 6 6 6 5 4 4
All-in sustaining costs(8) USDM 2,108 189 196 187 183 177 203 190 191 190 163 85 98 101 94 50
All-in sustaining costs(8) $/oz 887 914 912 819 908 882 1,072 1,483 1,103 843 621 812 897 748 671 788
Franco Nevada USDM 173 19 20 22 22 22 11 7 10 13 15 6 6 8 8 4
Franco Nevada $/oz 73 92 92 94 107 108 58 58 58 58 58 58 58 58 58 58
Cash Flow (7)
before interest, taxes,
debt, dividends, closure
costs, and working
capital
USDM $549 $36 $21 $65 $37 $42 $13 ($44) $7 $68 $137 $34 $27 $53 $66 $22
Refer to Endnotes (6), (7) and (8) on the second last slide
*Royalties include Government of Senegal Royalties on total production and the NSR royalty due to Axmin on Gora production
41
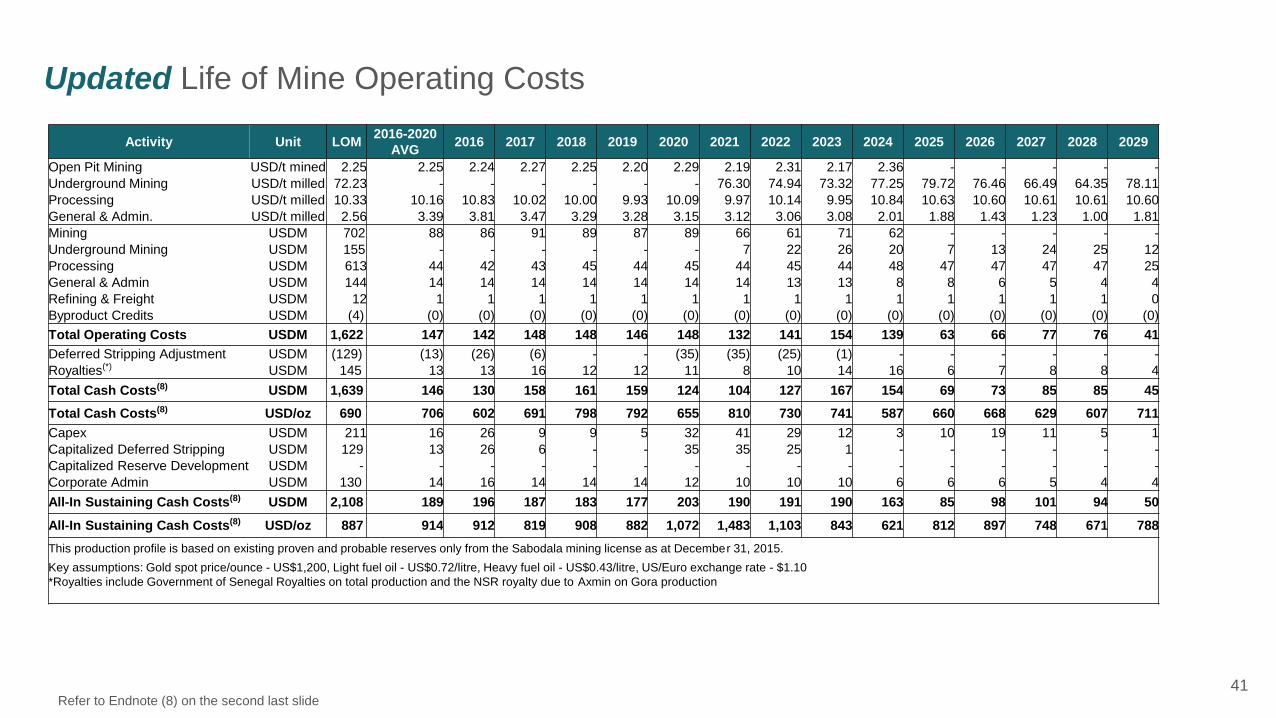
Updated Life of Mine Operating Costs
Activity Unit LOM2016-2020
AVG2016 2017 2018 2019 2020 2021 2022 2023 2024 2025 2026 2027 2028 2029
Open Pit Mining USD/t mined 2.25 2.25 2.24 2.27 2.25 2.20 2.29 2.19 2.31 2.17 2.36 - - - - -
Underground Mining USD/t milled 72.23 - - - - - - 76.30 74.94 73.32 77.25 79.72 76.46 66.49 64.35 78.11
Processing USD/t milled 10.33 10.16 10.83 10.02 10.00 9.93 10.09 9.97 10.14 9.95 10.84 10.63 10.60 10.61 10.61 10.60
General & Admin. USD/t milled 2.56 3.39 3.81 3.47 3.29 3.28 3.15 3.12 3.06 3.08 2.01 1.88 1.43 1.23 1.00 1.81
Mining USDM 702 88 86 91 89 87 89 66 61 71 62 - - - - -
Underground Mining USDM 155 - - - - - - 7 22 26 20 7 13 24 25 12
Processing USDM 613 44 42 43 45 44 45 44 45 44 48 47 47 47 47 25
General & Admin USDM 144 14 14 14 14 14 14 14 13 13 8 8 6 5 4 4
Refining & Freight USDM 12 1 1 1 1 1 1 1 1 1 1 1 1 1 1 0
Byproduct Credits USDM (4) (0) (0) (0) (0) (0) (0) (0) (0) (0) (0) (0) (0) (0) (0) (0)
Total Operating Costs USDM 1,622 147 142 148 148 146 148 132 141 154 139 63 66 77 76 41
Deferred Stripping Adjustment USDM (129) (13) (26) (6) - - (35) (35) (25) (1) - - - - - -
Royalties(*) USDM 145 13 13 16 12 12 11 8 10 14 16 6 7 8 8 4
Total Cash Costs(8) USDM 1,639 146 130 158 161 159 124 104 127 167 154 69 73 85 85 45
Total Cash Costs(8) USD/oz 690 706 602 691 798 792 655 810 730 741 587 660 668 629 607 711
Capex USDM 211 16 26 9 9 5 32 41 29 12 3 10 19 11 5 1
Capitalized Deferred Stripping USDM 129 13 26 6 - - 35 35 25 1 - - - - - -
Capitalized Reserve Development USDM - - - - - - - - - - - - - - - -
Corporate Admin USDM 130 14 16 14 14 14 12 10 10 10 6 6 6 5 4 4
All-In Sustaining Cash Costs(8) USDM 2,108 189 196 187 183 177 203 190 191 190 163 85 98 101 94 50
All-In Sustaining Cash Costs(8) USD/oz 887 914 912 819 908 882 1,072 1,483 1,103 843 621 812 897 748 671 788
This production profile is based on existing proven and probable reserves only from the Sabodala mining license as at December 31, 2015.
Key assumptions: Gold spot price/ounce - US$1,200, Light fuel oil - US$0.72/litre, Heavy fuel oil - US$0.43/litre, US/Euro exchange rate - $1.10
*Royalties include Government of Senegal Royalties on total production and the NSR royalty due to Axmin on Gora production
Refer to Endnote (8) on the second last slide
Teranga Gold Competent & Qualified Persons Statement
42
The technical information contained in this document relating to the open pit mineral reserve estimates is based on, and fairly represents, information compiled by Mr. William Paul
Chawrun, P. Eng who is a member of the Professional Engineers Ontario, which is currently included as a "Recognized Overseas Professional Organization" in a list promulgated by
the ASX from time to time. Mr. Chawrun is a full time employee of Teranga and is not "independent" within the meaning of National Instrument 43-101. However, he is a "Qualified
Person" as defined in NI 43-101. Mr. Chawrun has sufficient experience which is relevant to the style of mineralization and type of deposit under consideration and to the activity
which he is undertaking to qualify as a Competent Person as defined in the 2012 Edition of the "Australasian Code for Reporting of Exploration Results, Mineral Resources and Ore
Reserves". Mr. Chawrun is a "Qualified Person" under National Instrument 43-101 Standards of Disclosure for Mineral Projects. Mr. Chawrun has consented to the inclusion in this
Report of the matters based on his compiled information in the form and context in which it appears in this Report.
The technical information contained in this document relating to mineral resource estimates is based on, and fairly represents, information compiled by Ms. Patti Nakai-Lajoie. Ms.
Nakai-Lajoie, P. Geo., is a Member of the Association of Professional Geoscientists of Ontario, which is currently included as a "Recognized Overseas Professional Organization" in
a list promulgated by the ASX from time to time. Ms. Nakai-Lajoie is a full time employee of Teranga and is not "independent" within the meaning of National Instrument 43-101. Ms.
Nakai-Lajoie has sufficient experience which is relevant to the style of mineralization and type of deposit under consideration and to the activity which she is undertaking to qualify as
a Competent Person as defined in the 2012 Edition of the "Australasian Code for Reporting of Exploration Results, Mineral Resources and Ore Reserves". Ms. Nakai-Lajoie is a
"Qualified Person" under National Instrument 43-101 Standards of Disclosure for Mineral Projects. Ms. Nakai-Lajoie has consented to the inclusion in this Report of the matters
based on her compiled information in the form and context in which it appears in this Report.
Teranga's disclosure of mineral reserve and mineral resource information is governed by NI 43-101 under the guidelines set out in the Canadian Institute of Mining, Metallurgy and
Petroleum (the "CIM") Standards on Mineral Resources and Mineral Reserves, adopted by the CIM Council, as may be amended from time to time by the CIM ("CIM Standards").
CIM definitions of the terms "mineral reserve", "proven mineral reserve", "probable mineral reserve", "mineral resource", "measured mineral resource", "indicated mineral resource"
and "inferred mineral resource", are substantially similar to the 2012 JORC Code corresponding definitions of the terms "ore reserve", "proved ore reserve", "probable ore reserve",
"mineral resource", "measured mineral resource", "indicated mineral resource" and "inferred mineral resource", respectively. Estimates of mineral resources and mineral reserves
prepared in accordance with the 2012 JORC Code would not be materially different if prepared in accordance with the CIM definitions applicable under NI 43-101. There can be no
assurance that those portions of mineral resources that are not mineral reserves will ultimately be converted into mineral reserves.
Scientific and technical information with respect to Gryphon referred to in this presentation has been extracted from and is qualified in its entirety by reference to the January 2013,
Gryphon Minerals 2Mtpa CIL Bankable Feasibility Study and the August 4, 2014 Gryphon Minerals 2Mtpa Heap Leach Feasibility Study. Each of the above referenced persons have
sufficient experience, which is relevant to the style of mineralisation and type of deposits under consideration, and to the activities which they are undertaking, to qualify as
Competent Persons as defined in the 2012 Edition of the “Australasian Code for Reporting of Exploration Results, Mineral Resources and Ore Reserves” (“JORC Code”).
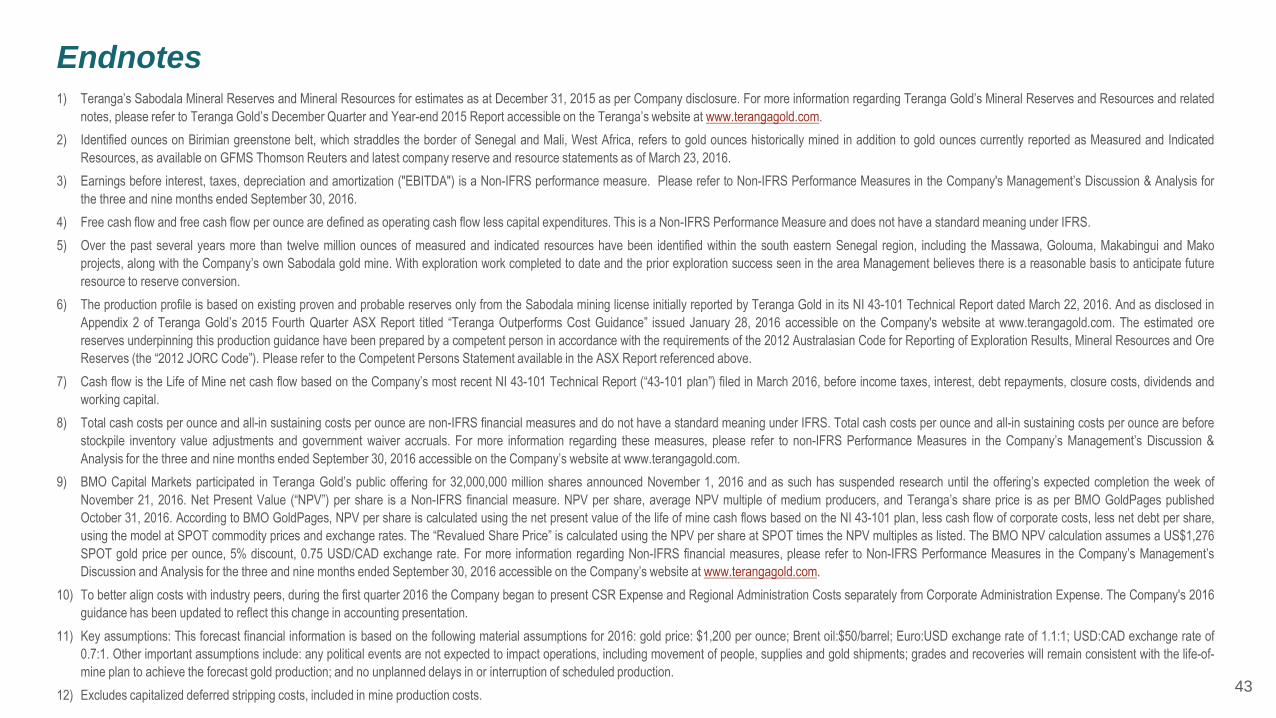
Endnotes
43
1) Teranga’s Sabodala Mineral Reserves and Mineral Resources for estimates as at December 31, 2015 as per Company disclosure. For more information regarding Teranga Gold’s Mineral Reserves and Resources and related
notes, please refer to Teranga Gold’s December Quarter and Year-end 2015 Report accessible on the Teranga’s website at www.terangagold.com.
2) Identified ounces on Birimian greenstone belt, which straddles the border of Senegal and Mali, West Africa, refers to gold ounces historically mined in addition to gold ounces currently reported as Measured and Indicated
Resources, as available on GFMS Thomson Reuters and latest company reserve and resource statements as of March 23, 2016.
3) Earnings before interest, taxes, depreciation and amortization ("EBITDA") is a Non-IFRS performance measure. Please refer to Non-IFRS Performance Measures in the Company's Management’s Discussion & Analysis for
the three and nine months ended September 30, 2016.
4) Free cash flow and free cash flow per ounce are defined as operating cash flow less capital expenditures. This is a Non-IFRS Performance Measure and does not have a standard meaning under IFRS.
5) Over the past several years more than twelve million ounces of measured and indicated resources have been identified within the south eastern Senegal region, including the Massawa, Golouma, Makabingui and Mako
projects, along with the Company’s own Sabodala gold mine. With exploration work completed to date and the prior exploration success seen in the area Management believes there is a reasonable basis to anticipate future
resource to reserve conversion.
6) The production profile is based on existing proven and probable reserves only from the Sabodala mining license initially reported by Teranga Gold in its NI 43-101 Technical Report dated March 22, 2016. And as disclosed in
Appendix 2 of Teranga Gold’s 2015 Fourth Quarter ASX Report titled “Teranga Outperforms Cost Guidance” issued January 28, 2016 accessible on the Company's website at www.terangagold.com. The estimated ore
reserves underpinning this production guidance have been prepared by a competent person in accordance with the requirements of the 2012 Australasian Code for Reporting of Exploration Results, Mineral Resources and Ore
Reserves (the “2012 JORC Code”). Please refer to the Competent Persons Statement available in the ASX Report referenced above.
7) Cash flow is the Life of Mine net cash flow based on the Company’s most recent NI 43-101 Technical Report (“43-101 plan”) filed in March 2016, before income taxes, interest, debt repayments, closure costs, dividends and
working capital.
8) Total cash costs per ounce and all-in sustaining costs per ounce are non-IFRS financial measures and do not have a standard meaning under IFRS. Total cash costs per ounce and all-in sustaining costs per ounce are before
stockpile inventory value adjustments and government waiver accruals. For more information regarding these measures, please refer to non-IFRS Performance Measures in the Company’s Management’s Discussion &
Analysis for the three and nine months ended September 30, 2016 accessible on the Company’s website at www.terangagold.com.
9) BMO Capital Markets participated in Teranga Gold’s public offering for 32,000,000 million shares announced November 1, 2016 and as such has suspended research until the offering’s expected completion the week of
November 21, 2016. Net Present Value (“NPV”) per share is a Non-IFRS financial measure. NPV per share, average NPV multiple of medium producers, and Teranga’s share price is as per BMO GoldPages published
October 31, 2016. According to BMO GoldPages, NPV per share is calculated using the net present value of the life of mine cash flows based on the NI 43-101 plan, less cash flow of corporate costs, less net debt per share,
using the model at SPOT commodity prices and exchange rates. The “Revalued Share Price” is calculated using the NPV per share at SPOT times the NPV multiples as listed. The BMO NPV calculation assumes a US$1,276
SPOT gold price per ounce, 5% discount, 0.75 USD/CAD exchange rate. For more information regarding Non-IFRS financial measures, please refer to Non-IFRS Performance Measures in the Company’s Management’s
Discussion and Analysis for the three and nine months ended September 30, 2016 accessible on the Company’s website at www.terangagold.com.
10) To better align costs with industry peers, during the first quarter 2016 the Company began to present CSR Expense and Regional Administration Costs separately from Corporate Administration Expense. The Company's 2016
guidance has been updated to reflect this change in accounting presentation.
11) Key assumptions: This forecast financial information is based on the following material assumptions for 2016: gold price: $1,200 per ounce; Brent oil:$50/barrel; Euro:USD exchange rate of 1.1:1; USD:CAD exchange rate of
0.7:1. Other important assumptions include: any political events are not expected to impact operations, including movement of people, supplies and gold shipments; grades and recoveries will remain consistent with the life-of-
mine plan to achieve the forecast gold production; and no unplanned delays in or interruption of scheduled production.
12) Excludes capitalized deferred stripping costs, included in mine production costs.
TSX & ASX: TGZ
Trish Moran
Head of Investor Relations
T: +1.416.607.4507
W: terangagold.com
121 King Street West, Suite 2600
Toronto, ON M5H 3T9