Teranga Gold Q1 2015 Investor Presentation
26
Q1 2015 Investor Presentation
-
Upload
terangagold -
Category
Economy & Finance
-
view
762 -
download
1
Transcript of Teranga Gold Q1 2015 Investor Presentation

Q1 2015
Investor Presentation

This presentation contains certain statements that constitute forward-looking information within the meaning of applicable securities laws (“forward-looking
statements”), which reflects management’s expectations regarding Teranga Gold Corporation’s (“Teranga” or the “Company”) future growth, results of operations
(including, without limitation, future production and capital expenditures), performance (both operational and financial) and business prospects (including the timing
and development of new deposits and the success of exploration activities) and opportunities. Wherever possible, words such as “plans”, “expects”, “does not
expect”, “budget”, “scheduled”, “estimates”, “forecasts”, “anticipate” or “does not anticipate”, “believe”, “intend”, “ability to” and similar expressions or statements that
certain actions, events or results “may”, “could”, “would”, “might” or “will” be taken, occur or be achieved, have been used to identify such forward looking
information. Although the forward-looking information contained in this presentation reflect management’s current beliefs based upon information currently available
to management and based upon what management believes to be reasonable assumptions, Teranga cannot be certain that actual results will be consistent with
such forward looking information. Such forward-looking statements are based upon assumptions, opinions and analysis made by management in light of its
experience, current conditions and its expectations of future developments that management believe to be reasonable and relevant. These assumptions include,
among other things, the ability to obtain any requisite Senegalese governmental approvals, the accuracy of mineral reserve and mineral resource estimates, gold
price, exchange rates, fuel and energy costs, future economic conditions and courses of action. Teranga cautions you not to place undue reliance upon any such
forward-looking statements, which speak only as of the date they are made.
The risks and uncertainties that may affect forward-looking statements include, among others: the inherent risks involved in exploration and development of mineral
properties, including government approvals and permitting, changes in economic conditions, changes in the worldwide price of gold and other key inputs, changes
in mine plans and other factors, such as project execution delays, many of which are beyond the control of Teranga, as well as other risks and uncertainties which
are more fully described in the Company’s Revised Annual Information Form dated April 24, 2014, and in other company filings with securities and regulatory
authorities which are available at www.sedar.com. Teranga does not undertake any obligation to update forward-looking statements should assumptions related to
these plans, estimates, projections, beliefs and opinions change. Nothing in this report should be construed as either an offer to sell or a solicitation to buy or sell
Teranga securities.
This presentation is dated as of February 2, 2015. All references to the Company include its subsidiaries unless the context requires otherwise.
This presentation contains references to Teranga using the words “we”, “us”, “our” and similar words and the reader is referred to using the words “you”, “your” and
similar words.
All dollar amounts stated are denominated in U.S. dollars unless specified otherwise.
FORWARD-LOOKING STATEMENTS
2

VISIONTo be the pre-eminent gold producer in Senegal while
setting the benchmark for responsible mining
Strong balance sheet
virtually debt-free
Significant organic
growth profile
Attractive free cash
flow(2) and profitabilityLow all-in
sustaining costs(1)
INVESTMENT HIGHLIGHTS
Large long life reserve
and resource base(5)
3Refer to endnotes (1), (2), (5) on slide 21

4
Canadian-based gold mining company with large mine license
and regional land package in Senegal
Operates only gold mine and mill in Senegal located
90 kilometres from major gold mines in Mali
Large resource base of 6.1Moz in M&I and 2.4Moz in Inferred
with strong likelihood to convert resources into reserves and
make new discoveries
Positive net cash position of $32 million and
generating free cash flow
Publicly listed on Toronto (TSX: TGZ)
and Australian (ASX: TGZ) stock exchanges
EMERGING MID-TIER GOLD PRODUCER WITH LONG-TERM GROWTH
Capital Structure
(as of December 31, 2014)
Basic common shares outstanding 352,801,091
Stock options outstanding 21,470,489
Fully diluted 374,271,580
Number of shares owned by insiders 3,043,030
Market capitalization C$212M / US$168M(as of February 2, 2015 close)

SENEGAL: A LAND OF OPPORTUNITY
Safe, stable democracy that is a member of the West African Economic
and Monetary Union (WAEMU)
Senegalese government views mining as pillar for economic growth
and supports mining companies by offering attractive
royalty and ownership structures
Potential for world-class discoveries similar to the
deposits (+5 million ounces) that have been found
on the same geographical gold belt in Mali
Long-term asset consolidation potential
Franco-Nevada invested $135 million in Teranga to facilitate the
consolidation of OJVG, citing stable cash flows, well-run operation and
excellent exploration potential as reasons for the transaction
Africa
5
SenegalTeranga Gold’s
Sabodala Mine

Commenced mill
expansion to double
throughput
Discovered
high-grade Gora
satellite deposit
Began systematic
regional exploration
program
2010
Acquired Sabodala
gold mine and
regional land
package that
together total
1,488 km2
Completed initial
public offering
Completed mill
expansion
Completed
development plan
for high-grade Gora
satellite deposit
Expanded M&I by
800,000 ounces
Doubled 2P reserves
and mine life through
acquisition of OJVG
Established long-
term fiscal and
investment
agreement with
government of
Senegal
Eliminated inherited
“out-of-money”
hedge book
Successfully
integrated OJVG
Commenced
production at Masato
Reduced AISC per
ounce by 28%
since 2012
Paid off remaining
bank debt
2011 2012 2013 2014
M&I
2.3Moz
M&I
6.1Moz
M&I
6.2MozM&I
2.1MozM&I
2.9Moz
STRONG OPERATIONAL TRACK RECORD
6
EXECUTING AGAINST OUR KEY OBJECTIVES
Growing free cash flow and
increasing profitability
Strengthening our balance
sheet
Investing in high return organic
growth initiatives
7

INCREASING PROFITABILITY BY OPTIMIZING MILL PLAN
AND IMPROVING EFFICIENCY
Q4 2014 production of 71,278 ounces, the second
highest quarterly production in Teranga’s history
Close to 300,000 ounces in low-grade ore stockpile
that can processed at future costs of approximately
$800 to $850 per ounce
2,439
3,152
3,622
3,600 to 3,800
$15.50 - $17.50
$20.39 $20.15
$17.15
Mill
Thro
ughput
(000’s
of
tonnes)
8
Stockpile Cost Analysis @ $1,200 Gold Price
Tonnes 11.1 million tonnes
Grade 0.8 g/t
Recovery 89%
Recovered Ounces 255,000
Processing $15.00 - $16.00 per tonne
G&A and Sustaining CAPEX $2.00 per tonne
Royalty 5%
All-in Cost ~ $800 - $850 per ounce

REDUCING COSTS TO INCREASE PROFITABILITY
9Refer to endnote (1) on slide 21
$556 $641 $710
$1,200
$1,033
$865
2012 2013 2014
Cash Cost/oz
All-In SustainingCost/oz
(1)
$711 $598
$850
$711
Q4-2013 Q4-2014
Cash Cost/oz
All-In SustainingCost/oz
(1)
Acquisition of OJVG in Q1 2014 increased production
flexibility by allowing us to
– minimize material movement
– minimize capital spending
– maximize free cash flow
Reducing input costs and improving efficiencies through:
– improved vendor pricing
– better dilution control
– increased mine productivity and throughput
(1)
(1)

10
2014
General & Administrative Expenses
(including CSR)
Teranga Development Strategy
Launched in 2014
Long-term vision to maximize the benefits of
our operations for regional communities
78 action items for regional development
delivering immediate and long-term benefits
Established after 18-month collaborative
planning process with local, regional and
national stakeholders
In 2014, 26 actions complete, 30 in progress,
and 22 still to commence
Areas of Focus
Economic sustainability
Agriculture and food security
Youth education and training
COMMITTED TO RESPONSIBLE MINING
23% of G&A allocated to comprehensive CSR program and government relations
Corporate Office CSR and Government Relations Legal and Other Depreciation Audit Fees
53%23%
16%5% 3%

GROWING FREE CASH FLOW
11
($50)
$78
Annual Free Cash Flow per Ounce of Gold Sold
($US)
Free Cash Flow/oz 2014 Free Cash Flow/oz (excl. Franco-Nevada)
($11M)
$16M
$1,669
$1,411
$1,266
$1,200
$1,250
$1,300
$1,350
$1,400
$1,450
$1,500
$1,550
$1,600
$1,650
$1,700
2012 2013 2014
Annual Free Cash Flow vs. Average Gold Price per Ounce
($US)
Free Cash Flow Gold Price Average/oz (London PM Fix)
Significantly increasing free cash flow since 2012 despite low price gold environment
(2)(2) (2)
Refer to endnote (2) on slide 21
20132012 2014

Generating free cash flow from operations and
building higher cash balances
$73 million of debt repaid in 2014
Debt-free following payment of $4 million
equipment loan in Q1 2015
Inventory of nearly 300,000 ounces in low-grade ore
stockpile represents a valuable asset providing
operating flexibility
STRENGTHENING OUR BALANCE SHEET AND IMPROVING NET CASH
Significantly improving net cash in a declining gold price environment
12Refer to endnote (7) on slide 21
(7)
($75M)
($32M)
$32M
$1,669
$1,411
$1,266
2012 2013 2014
Net Cash (Debt) vs. Average Gold Price
Net Cash (Debt) Gold Price Average/oz (London PM Fix)
($US)

THREE PHASE GROWTH STRATEGY
Phase IMine License
Phase IIExploration
ProductionIncrease production to
400,000-500,000 oz
per year(6)
Timing Near-term Medium-term
Capital Required Capital intensive
Opportunities
Increase throughput
Increase reserves
Minimal capital
Increase production to
range of 250,000 – 350,000
oz per year(6)
New discoveries on mine
license (246km2) and
regional land package
(1,055km2)
Phase IIIAsset Consolidation
Increase production to
500,000+ oz
per year(6)
Long-term
Capital intensive
Joint ventures in Senegal
Asset Consolidation
Regional processing facility
13Refer to endnote (6) on slide 21

PHASE I: LOW COST NEAR-TERM ORGANIC GROWTH
Phase IMine License
Near-term opportunity
Increase throughput
with mill optimization and
heap leaching low-grade
stockpiles
Increase reserves
Minimal capital required
Potential to increase
production to 250,000 –
350,000 oz per year(6)
14
Masato NE Structure
Evaluation
Golouma NW Resource
Drilling
2015 Mine License
Exploration Plan
14Refer to endnote (6) on slide 21
Niakifiri Trend
Evaluation
Mamasato Evaluation
Saboraya & Korololo
Evaluation
Bambaraya Evaluation
Maki Madina
Evaluation
Kouroundi Evaluation
Masato NW Evaluation
Kerekounda Evaluation

15
Phase IIExploration
Medium-term opportunity
New discoveries on mine
license (246km2) and
regional land package
(1,055km2)
Capital intensive
Potential to increase
production to
400,000 – 500,000 oz
per year(6)
PHASE II: MEDIUM-TERM ORGANIC GROWTH
Refer to endnote (6) on slide 21

Phase IIIAsset Consolidation
Long-term opportunity
Joint ventures in Senegal
Asset Consolidation
Regional processing centre
Capital intensive
Potential to increase
production beyond
500,000 oz per year(6)
PHASE III: LONG-TERM ASSET CONSOLIDATION IN SENEGAL
212 koz
250 – 350 koz(6)
400 – 500 koz(6)
500+ koz(6)
2014 Phase I Phase II Phase III
Production Range16Refer to endnote (6) on slide 21

Assumptions
$1,200 gold price
Moderate benefits from fuel and currency
High-grade Gora deposit comes into production
by beginning of Q4 2015
Gora and mill optimization development cost of
approximately $125 per ounce included in all-in
sustaining costs
2015 OUTLOOK
2014 Actual 2015 Guidance(4)
Total material mined (‘000t) 29,321 28,500 - 30,500
Ore mined (‘000t) 6,174 6,500 - 7,500
Grade mined (g/t) 1.54 1.40 - 1.60
Ore milled (‘000t) 3,622 3,600 - 3,800
Head grade (g/t) 2.03 2.00 - 2.20
Gold produced(3) (‘000 oz) 212 200 - 230
Total cash costs(1)
(including royalties)
$/oz sold 710 650 - 700
All-in sustaining costs(1) $/oz sold 865 900 - 975
Mine production costs(net of capitalized deferred stripping)
$ millions 155.3 147 - 155
Capital expenditures $ millions 18.9 49.0 - 58.0
17Refer to endnotes (1),(3) and (4) on slide 21

CATALYSTS FOR FUTURE GROWTH
Catalyst Timing Impact
Gora H2 2015 30K-45K oz
Mill Optimization 2015-2016 5-10% increase in throughput
2015-2017 10-20% increase in gold production
Mine License 2015-2019Extend mine life / add to reserves /
increase production
Regional Exploration OngoingExtend mine life / add to reserves /
increase production
Heap Leach
Internal rate of return hurdle is 20%+
18

211,823
$865
Endeavour Golden Star Semafo Perseus Teranga
2014E Production and AISC(8)
2014E Prod'n 2014E AISC Peer Average 2014E AISC
6.1 Moz
Perseus Endeavour Teranga Golden Star Semafo
2P Reserves and M&I Resources(8)
(at December 2013)
Perseus Endeavour Teranga Golden Star Semafo
$169
$137
Semafo Endeavour Teranga Perseus Golden Star
Market Capitalization and Enterprise Values(8)
(millions of USD)
Market Caps Enterprise Value
$23 / oz
Semafo Endeavour Golden Star Teranga Perseus
Enterprise Value per 2P Reserves and M&I Resources(8)
EV / 2P and M&I Peer Average
TERANGA’S DEBT FREE BALANCE SHEET AND ATTRACTIVE
FREE CASH FLOW NOT YET REFLECTED IN VALUATION
19Refer to endnote (8) on slide 21

EXECUTING AGAINST OUR KEY OBJECTIVES
Growing free cash flow and
increasing profitability
Strengthening our balance
sheet
Investing in high return organic
growth initiatives
20

1. Total cash costs per ounce and all-in sustaining costs per ounce are non-IFRS financial measures and do not have a standard meaning under IFRS. Please refer to the Non-
IFRS Financial Measures section in the Company’s 2014 fourth quarter results available on the Company’s website at www.terangagold.com. All-in sustaining costs include:
total cash costs, administrative expenses (including share based compensation, and excluding corporate depreciation expense and social community costs not related to
current operations), capitalized deferred stripping, capitalized reserve development, and mine site sustaining capital expenditures as defined by the World Gold Council.
Total cash costs per ounce and all-in sustaining costs per ounce are prior to a non-cash inventory write-down (or reversals thereof) to net realizable value.
2. Free cash flow (“FCF”) is defined as operating cash flow less capital expenditures and includes the impact of the Franco-Nevada stream. FCF per ounce and FCF per ounce
(excluding Franco-Nevada) are non-IFRS financial measures. For 2013 and 2014, FCF is before the OJVG transaction costs.
3. 24,375 gold ounces of production are to be sold to Franco Nevada at 20% of the spot gold price.
4. Key assumptions: Gold spot price/ounce - US$1,200, Light fuel oil - US$0.95/litre, Heavy fuel oil - US$0.76/litre, US/Euro exchange rate - $1.20, USD/CAD exchange rate -
$0.85.Other important assumptions include: any political events are not expected to impact operations, including movement of people, supplies and gold shipments; grades
and recoveries will remain consistent with the life-of-mine plan to achieve the forecast gold production; and no unplanned delays in or interruption of scheduled production.
5. Mineral Reserves and Mineral Resources estimates as at December 31, 2013 as per technical reports and Company disclosure. For more information regarding Teranga
Gold’s Mineral Reserves and Resources, please refer to the full National Instrument 43-101 Technical Report released on March 13, 2014 available on the Company’s
website at www.terangagold.com.
6. Over the past several years more than twelve million ounces of measured and indicated resources have been identified within the south eastern Senegal region, including the
Massawa, Golouma, Makabingui and Mako projects, along with the Company’s own Sabodala gold mine. With exploration work completed to date and the prior exploration
success seen in the area Management believes there is a reasonable basis for an exploration target that would substantiate the annual production targets set by the second
and third phases of our vision. However, the potential quantity and grade of an exploration target is conceptual in nature. There has been insufficient exploration to determine
a mineral resource of the size required to achieve the production target we have established and there is no certainty that further exploration work will result in the
determination of mineral resources or that the production target itself will be realized.
7. Net cash (debt) is defined as total borrowings and financial derivative liabilities less cash and cash equivalents, bullion receivable and restricted cash.
8. Market capitalization and enterprise values are as of market close on February 2, 2015; production, AISC, reserves, resources and balance sheet items are sourced from
company websites and Thomson Reuters
In U.S. dollar amounts unless stated otherwiseENDNOTES
21
22
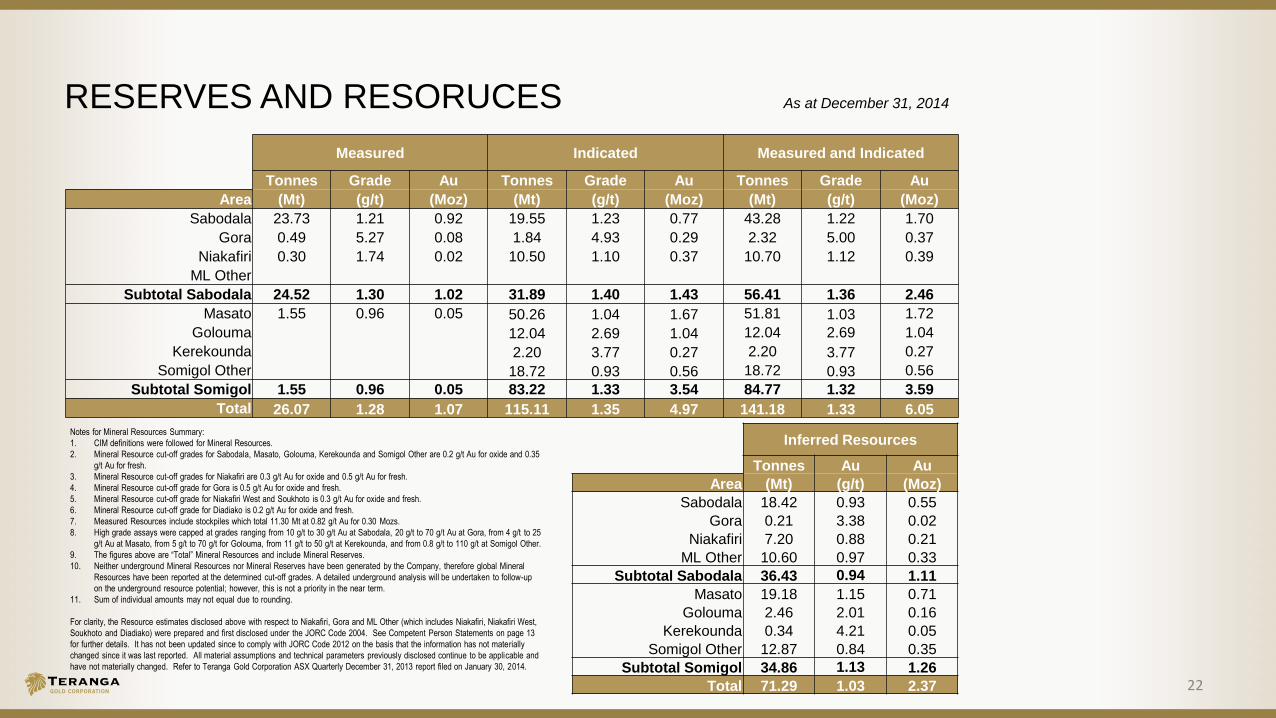
RESERVES AND RESORUCES As at December 31, 2014
Measured Indicated Measured and Indicated
Tonnes Grade Au Tonnes Grade Au Tonnes Grade Au
Area (Mt) (g/t) (Moz) (Mt) (g/t) (Moz) (Mt) (g/t) (Moz)
Sabodala 23.73 1.21 0.92 19.55 1.23 0.77 43.28 1.22 1.70
Gora 0.49 5.27 0.08 1.84 4.93 0.29 2.32 5.00 0.37
Niakafiri 0.30 1.74 0.02 10.50 1.10 0.37 10.70 1.12 0.39
ML Other
Subtotal Sabodala 24.52 1.30 1.02 31.89 1.40 1.43 56.41 1.36 2.46
Masato 1.55 0.96 0.05 50.26 1.04 1.67 51.81 1.03 1.72
Golouma 12.04 2.69 1.04 12.04 2.69 1.04
Kerekounda 2.20 3.77 0.27 2.20 3.77 0.27
Somigol Other 18.72 0.93 0.56 18.72 0.93 0.56
Subtotal Somigol 1.55 0.96 0.05 83.22 1.33 3.54 84.77 1.32 3.59
Total 26.07 1.28 1.07 115.11 1.35 4.97 141.18 1.33 6.05
Inferred Resources
Tonnes Au Au
Area (Mt) (g/t) (Moz)
Sabodala 18.42 0.93 0.55
Gora 0.21 3.38 0.02
Niakafiri 7.20 0.88 0.21
ML Other 10.60 0.97 0.33
Subtotal Sabodala 36.43 0.94 1.11
Masato 19.18 1.15 0.71
Golouma 2.46 2.01 0.16
Kerekounda 0.34 4.21 0.05
Somigol Other 12.87 0.84 0.35
Subtotal Somigol 34.86 1.13 1.26
Total 71.29 1.03 2.37
Notes for Mineral Resources Summary:
1. CIM definitions were followed for Mineral Resources.
2. Mineral Resource cut-off grades for Sabodala, Masato, Golouma, Kerekounda and Somigol Other are 0.2 g/t Au for oxide and 0.35
g/t Au for fresh.
3. Mineral Resource cut-off grades for Niakafiri are 0.3 g/t Au for oxide and 0.5 g/t Au for fresh.
4. Mineral Resource cut-off grade for Gora is 0.5 g/t Au for oxide and fresh.
5. Mineral Resource cut-off grade for Niakafiri West and Soukhoto is 0.3 g/t Au for oxide and fresh.
6. Mineral Resource cut-off grade for Diadiako is 0.2 g/t Au for oxide and fresh.
7. Measured Resources include stockpiles which total 11.30 Mt at 0.82 g/t Au for 0.30 Mozs.
8. High grade assays were capped at grades ranging from 10 g/t to 30 g/t Au at Sabodala, 20 g/t to 70 g/t Au at Gora, from 4 g/t to 25
g/t Au at Masato, from 5 g/t to 70 g/t for Golouma, from 11 g/t to 50 g/t at Kerekounda, and from 0.8 g/t to 110 g/t at Somigol Other.
9. The figures above are “Total” Mineral Resources and include Mineral Reserves.
10. Neither underground Mineral Resources nor Mineral Reserves have been generated by the Company, therefore global Mineral
Resources have been reported at the determined cut-off grades. A detailed underground analysis will be undertaken to follow-up
on the underground resource potential; however, this is not a priority in the near term.
11. Sum of individual amounts may not equal due to rounding.
For clarity, the Resource estimates disclosed above with respect to Niakafiri, Gora and ML Other (which includes Niakafiri, Niakafiri West,
Soukhoto and Diadiako) were prepared and first disclosed under the JORC Code 2004. See Competent Person Statements on page 13
for further details. It has not been updated since to comply with JORC Code 2012 on the basis that the information has not materially
changed since it was last reported. All material assumptions and technical parameters previously disclosed continue to be applicable and
have not materially changed. Refer to Teranga Gold Corporation ASX Quarterly December 31, 2013 report filed on January 30, 2014.
23
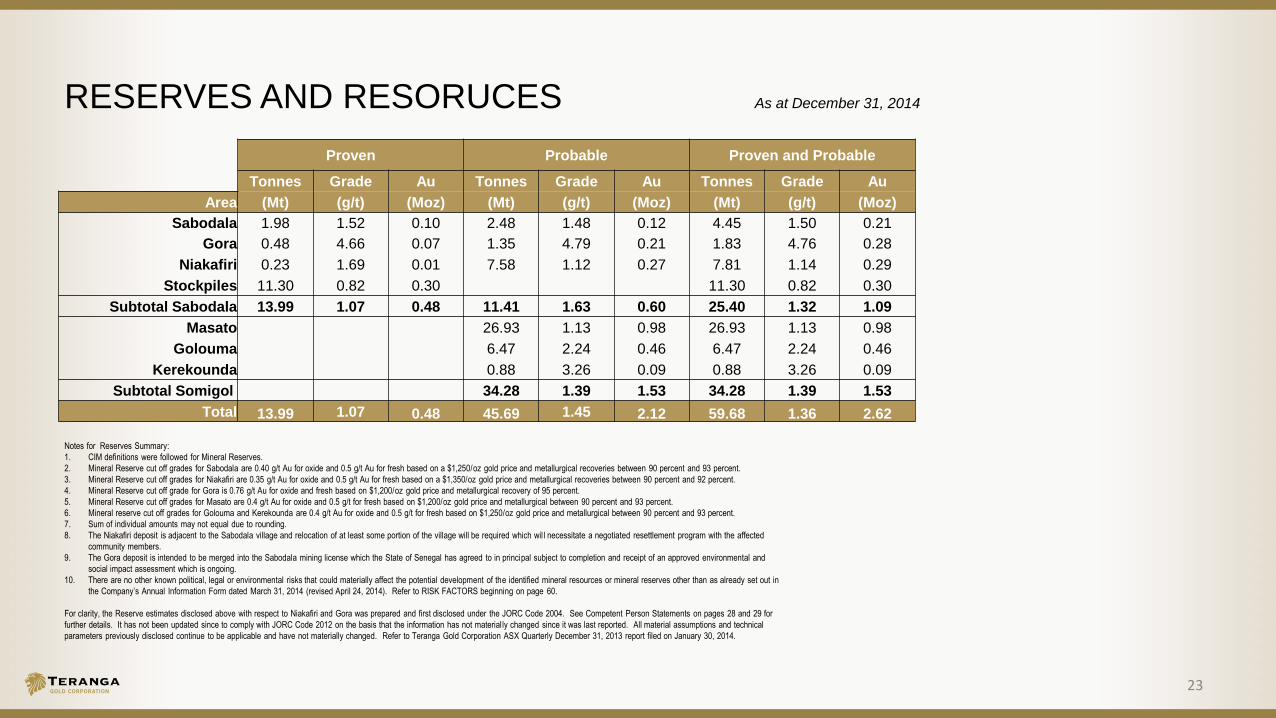
RESERVES AND RESORUCES As at December 31, 2014
Proven Probable Proven and Probable
Tonnes Grade Au Tonnes Grade Au Tonnes Grade Au
Area (Mt) (g/t) (Moz) (Mt) (g/t) (Moz) (Mt) (g/t) (Moz)
Sabodala 1.98 1.52 0.10 2.48 1.48 0.12 4.45 1.50 0.21
Gora 0.48 4.66 0.07 1.35 4.79 0.21 1.83 4.76 0.28
Niakafiri 0.23 1.69 0.01 7.58 1.12 0.27 7.81 1.14 0.29
Stockpiles 11.30 0.82 0.30 11.30 0.82 0.30
Subtotal Sabodala 13.99 1.07 0.48 11.41 1.63 0.60 25.40 1.32 1.09
Masato 26.93 1.13 0.98 26.93 1.13 0.98
Golouma 6.47 2.24 0.46 6.47 2.24 0.46
Kerekounda 0.88 3.26 0.09 0.88 3.26 0.09
Subtotal Somigol 34.28 1.39 1.53 34.28 1.39 1.53
Total 13.99 1.07 0.48 45.69 1.45 2.12 59.68 1.36 2.62
Notes for Reserves Summary:
1. CIM definitions were followed for Mineral Reserves.
2. Mineral Reserve cut off grades for Sabodala are 0.40 g/t Au for oxide and 0.5 g/t Au for fresh based on a $1,250/oz gold price and metallurgical recoveries between 90 percent and 93 percent.
3. Mineral Reserve cut off grades for Niakafiri are 0.35 g/t Au for oxide and 0.5 g/t Au for fresh based on a $1,350/oz gold price and metallurgical recoveries between 90 percent and 92 percent.
4. Mineral Reserve cut off grade for Gora is 0.76 g/t Au for oxide and fresh based on $1,200/oz gold price and metallurgical recovery of 95 percent.
5. Mineral Reserve cut off grades for Masato are 0.4 g/t Au for oxide and 0.5 g/t for fresh based on $1,200/oz gold price and metallurgical between 90 percent and 93 percent.
6. Mineral reserve cut off grades for Golouma and Kerekounda are 0.4 g/t Au for oxide and 0.5 g/t for fresh based on $1,250/oz gold price and metallurgical between 90 percent and 93 percent.
7. Sum of individual amounts may not equal due to rounding.
8. The Niakafiri deposit is adjacent to the Sabodala village and relocation of at least some portion of the village will be required which wil l necessitate a negotiated resettlement program with the affected
community members.
9. The Gora deposit is intended to be merged into the Sabodala mining license which the State of Senegal has agreed to in principal subject to completion and receipt of an approved environmental and
social impact assessment which is ongoing.
10. There are no other known political, legal or environmental risks that could materially affect the potential development of the identified mineral resources or mineral reserves other than as already set out in
the Company’s Annual Information Form dated March 31, 2014 (revised April 24, 2014). Refer to RISK FACTORS beginning on page 60.
For clarity, the Reserve estimates disclosed above with respect to Niakafiri and Gora was prepared and first disclosed under the JORC Code 2004. See Competent Person Statements on pages 28 and 29 for
further details. It has not been updated since to comply with JORC Code 2012 on the basis that the information has not materially changed since it was last reported. All material assumptions and technical
parameters previously disclosed continue to be applicable and have not materially changed. Refer to Teranga Gold Corporation ASX Quarterly December 31, 2013 report filed on January 30, 2014.

COMPETENT AND QUALIFIED PERSONS STATEMENT
The technical information contained in this presentation relating to the mineral reserve estimates for Sabodala, the stockpiles, Masato, Golouma and Kerekounda is based on, and fairly represents,
information compiled by Mr. William Paul Chawrun, P. Eng who is a member of the Professional Engineers of Ontario, which is currently included as a "Recognized Overseas Professional Organization" in
a list promulgated by the ASX from time to time. Mr. Chawrun is a full-time employee of Teranga and is a "qualified person" as defined in NI 43-101 and a "competent person" as defined in the 2012
Edition of the "Australasian Code for Reporting of Exploration Results, Mineral Resources and Ore Reserves". Mr. Chawrun has sufficient experience relevant to the style of mineralization and type of
deposit under consideration and to the activity he is undertaking to qualify as a Competent Person as defined in the 2012 Edition of the "Australasian Code for Reporting of Exploration Results, Mineral
Resources and Ore Reserves". Mr. Chawrun has consented to the inclusion in this document of the matters based on his compiled information in the form and context in which it appears in this
presentation.
The technical information contained in this presentation relating to the mineral reserve estimates for Gora and Niakafiri is based on, and fairly represents, information and supporting documentation
prepared by Julia Martin, P.Eng. who is a member of the Professional Engineers of Ontario and a Member of AusIMM (CP). Ms. Martin is a full time employee with AMC Mining Consultants (Canada)
Ltd., is independent of Teranga, is a “qualified person” as defined in NI 43-101 and a “competent person” as defined in the 2004 Edition of the “Australasian Code for Reporting of Exploration Results,
Mineral Resources and Ore Reserves”. Ms. Martin has sufficient experience relevant to the style of mineralization and type of deposit under consideration and to the activity she is undertaking to qualify as
a Competent Person as defined in the 2004 Edition of the “Australasian Code for Reporting of Exploration Results, Mineral Resources and Ore Reserves”. Ms. Martin is a “Qualified Person” under
National Instrument 43-101 Standards of Disclosure for Mineral Projects. Ms. Martin has reviewed and accepts responsibility for the Mineral Reserve estimates for Gora and Niakafiri disclosed in this
document and has consented to the inclusion of the matters based on her information in the form and context in which it appears in this presentation.
The technical information contained in this presentation relating to mineral resource estimates for Niakafiri, Gora, Niakafiri West, Soukhoto, and Diadiako is based on, and fairly represents, information
compiled by Ms. Patti Nakai-Lajoie. Ms. Patti Nakai-Lajoie, P. Geo., is a Member of the Association of Professional Geoscientists of Ontario, which is currently included as a "Recognized Overseas
Professional Organization" in a list promulgated by the ASX from time to time. Ms. Nakai-Lajoie is a full time employee of Teranga and is not "independent" within the meaning of National Instrument 43-
101. Ms. Nakai-Lajoie has sufficient experience which is relevant to the style of mineralization and type of deposit under consideration and to the activity which she is undertaking to qualify as a Competent
Person as defined in the 2004 Edition of the "Australasian Code for Reporting of Exploration Results, Mineral Resources and Ore Reserves". Ms. Nakai-Lajoie is a "Qualified Person" under National
Instrument 43-101 Standards of Disclosure for Mineral Projects. Ms. Nakai-Lajoie has consented to the inclusion in this document of the matters based on her compiled information in the form and context
in which it appears in this presentation.
24

The technical information contained in this presentation relating to mineral resource estimates for Sabodala, Masato, Golouma, Kerekounda, and Somigol Other are based on, and fairly represents,
information compiled by Ms. Patti Nakai-Lajoie. Ms. Patti Nakai-Lajoie, P. Geo., is a Member of the Association of Professional Geoscientists of Ontario, which is currently included as a "Recognized
Overseas Professional Organization" in a list promulgated by the ASX from time to time. Ms. Nakai-Lajoie is a full time employee of Teranga and is not "independent" within the meaning of National
Instrument 43-101. Ms. Nakai-Lajoie has sufficient experience which is relevant to the style of mineralization and type of deposit under consideration and to the activity which she is undertaking to
qualify as a Competent Person as defined in the 2012 Edition of the "Australasian Code for Reporting of Exploration Results, Mineral Resources and Ore Reserves". Ms. Nakai-Lajoie is a "Qualified
Person" under National Instrument 43-101 Standards of Disclosure for Mineral Projects. Ms. Nakai-Lajoie has consented to the inclusion in this presentation of the matters based on her compiled
information in the form and context in which it appears in this document.
Teranga’s exploration programs are being managed by Mr. Peter Mann, FAusIMM. Mr. Mann is a full time employee of Teranga and is not "independent" within the meaning of National Instrument
43-101. Mr. Mann has sufficient experience which is relevant to the style of mineralization and type of deposit under consideration and to the activity which he is undertaking to qualify as a
Competent Person as defined in the 2012 Edition of the "Australasian Code for Reporting of Exploration Results, Mineral Resources and Ore Reserves". Mr. Mann is a "Qualified Person" under
National Instrument 43-101 Standards of Disclosure for Mineral Projects. The technical information contained in this presentation relating exploration results are based on, and fairly represents,
information compiled by Mr. Mann. Mr. Mann has verified and approved the data disclosed in this presentation, including any sampling, analytical and test data underlying the information. The
reverse circulation samples are prepared at site and assayed in the SGS laboratory located at the site. Analysis for diamond drilling is sent for fire assay analysis at ALS Johannesburg, South
Africa. Mr. Mann has consented to the inclusion in this presentation of the matters based on his compiled information in the form and context in which it appears herein.
Teranga's disclosure of mineral reserve and mineral resource information is governed by NI 43-101 under the guidelines set out in the Canadian Institute of Mining, Metallurgy and Petroleum (the
"CIM") Standards on Mineral Resources and Mineral Reserves, adopted by the CIM Council, as may be amended from time to time by the CIM ("CIM Standards"). CIM definitions of the terms
"mineral reserve", "proven mineral reserve", "probable mineral reserve", "mineral resource", "measured mineral resource", "indicated mineral resource" and "inferred mineral resource", are
substantially similar to the JORC Code corresponding definitions of the terms "ore reserve", "proved ore reserve", "probable ore reserve", "mineral resource", "measured mineral resource", "indicated
mineral resource" and "inferred mineral resource", respectively. Estimates of mineral resources and mineral reserves prepared in accordance with the JORC Code would not be materially different if
prepared in accordance with the CIM definitions applicable under NI 43-101. There can be no assurance that those portions of mineral resources that are not mineral reserves will ultimately be
converted into mineral reserves.
COMPETENT AND QUALIFIED PERSONS STATEMENT
25

121 KING STREET WEST
SUITE 2600
TORONTO, ON M5H 3T9
TELEPHONE: +1.416.594.000
EMAIL: [email protected]
WWW.TERANGAGOLD.COM
TSX:TGZ / ASX:TGZ