10.PREDICTION OFHFFORMATION DURING SUPPRESSION
118
IN: Gann, R.G., Editor, Fire Suppression System Performance of Alternative Agents i.n Aircraft Engine and Dry Bay Laboratory Simulations, Vol. 2, Section 10, NIST SP 890 201-318 pp, 1995 201 10.PREDICTION OFHFFORMATION DURING SUPPRESSION Gregory T. Linteris Building and Fire Research Laboratory Grzegorz W. Gmurczyk Science Applications International Corporation Contents Page 10.PREDICTIONOF HF FORMATION DURINGSUPPRESSION .................. 201 10.1 Introduction ......................................0.0.”0.0.000.203 10,2 Background . . . . . . . . . . . . . . . . ......,...,,,”c.00”0”o “0”0...”””203 10,3 Technical Approach .................................. ,, ...,.,,...205 10.4 Equilibrium Calculations with Halogenated Inhibitors ....................... 206 10.4.1 Results . . . . . . . . . . . . . . ........,.....o,’”0.00”. 0“”.00”000””0”206 10.4.2 Conclusions ...........................4” 0””. .’..””””””s””210 10.5 Premixed Flame Structure Calculations and Burning Velocity Measurements ...................................... ”.” . . ..”” .”210 10.5.1 Introduction .................................................~~~ 10.5.2 Background ..........................”.. “.”0”.o”Qo”..o””.. 10.5.3 Experiment -Nozzle Burner ......................................215 10.5.4 Experiment -Bomb,... ........................................215 10.5.5 Model ..............................””..”. ““” ”.”” ””. .””216 10.5.6 Results ...........................””””.””.”.. .“.”0”.”.0..216 10.5.7 Conclusions ............... + . . . .. O....””” “.” . .. ”. ”””” ”.” . ...239 10.6 Physical/ChemicalModel ..........................................241 10.6.1 Steady-state -Premixed Flames ....................................241 10.6.2 Steady-state-Diffusion Flames ....................................241 10.6.3 Transient State ........................”.”” .. ”. .” ”” ”””” ””. ”...247 10.7 Experiments ....................................................249 10.7,1 Propane Diffusion FlameTests for HF ...............................249 10.7.2 Liquid Heptane Diffusion Tests for HF ..............................249 10.7.3 Premixed Flame Tests for HF .....................................251 / 10.7,4 HF Sampling Technique .........................................251 10.7.5 Transient State Measurements .....................................251 10.8 Results . . . . . . . . . . . . . . . . . ..........”””.””””.”””” “’”.---+’oo””””~~~ 10.8.1 10.8.2 10.8.3 10.8.4 Steady-state -Premixed Flames. ...................................253 Steady-state -Gaseous Diffusion Flames .............................257 Steady-state -Liquid Diffusion Flames ..............................272 Transient-state -Gaseous Diffusion Flames ........................... 274
Transcript of 10.PREDICTION OFHFFORMATION DURING SUPPRESSION
IN: Gann, R.G., Editor, Fire Suppression System Performance of Alternative Agents i.nAircraft Engine and Dry Bay Laboratory Simulations, Vol. 2, Section 10, NIST SP 890201-318 pp, 1995
201
10.PREDICTION OFHFFORMATION DURINGSUPPRESSION
Gregory T. LinterisBuilding and Fire Research Laboratory
Grzegorz W. GmurczykScience Applications International Corporation
ContentsPage
10.PREDICTIONOF HF FORMATION DURING SUPPRESSION..................20110.1 Introduction . . . . . . . . . . . . . . . . . . . . . . . . . . . . . . . . . . . . . .0.0.”0.0.000.20310,2 Background . . . . . . . . . . . . . . . . ......,...,,,”c.00”0”o “0”0...”””20310,3 Technical Approach . . . . . . . . . . . . . . . . . . . . . . . . . . . . . . . . . . ,, ...,.,,...20510.4 Equilibrium Calculations with Halogenated Inhibitors . . . . . . . . . . . . . . . . . . . . . . . 206
10.4.1 Results . . . . . . . . . . . . . . ........,.....o,’”0.00”. 0“”.00”000””0”20610.4.2 Conclusions . . . . . . . . . . . . . . . . . . . . . . . . . ..4” 0””. .’..””””””s””210
10.5 Premixed Flame Structure Calculations and Burning VelocityMeasurements . . . . . . . . . . . . . . . . . . . . . . . . . . . . . . . . . . . . .. ”.” . . ..”” .”210
10.5.1 Introduction . . . . . . . . . . . . . . . . . . . . . . . . . . . . . . . . . . . . . . . . . . . . . . . ..~~~10.5.2 Background . . . . . . . . . . . . . . . . . . . . . . . ...”.. “.”0”.o”Qo”..o””..10.5.3 Experiment -Nozzle Burner . . . . . . . . . . . . . . . . . . . . . . . . . . . . . . . . . . . ...21510.5.4 Experiment -Bomb,... . . . . . . . . . . . . . . . . . . . . . . . . . . . . . . . . . . . . . ...215
10.5.5 Model . . . . . . . . . . . . . . . . . . . . . . . . . . . ...””..”. ““” ”.”” ””. .””21610.5.6 Results . . . . . . . . . . . . . . . . . . . . . . . . ...””””.””.”.. .“.”0”.”.0..21610.5.7 Conclusions . . . . . . . . . . . . . .. + . . . .. O....””” “.” . .. ”. ”””” ”.” . ...239
10.6 Physical/ChemicalModel . . . . . . . . . . . . . . . . . . . . . . . . . . . . . . . . . . . . . . . ...24110.6.1 Steady-state -Premixed Flames . . . . . . . . . . . . . . . . . . . . . . . . . . . . . . . . . ...24110.6.2 Steady-state-Diffusion Flames . . . . . . . . . . . . . . . . . . . . . . . . . . . . . . . . . ...24110.6.3 Transient State . . . . . . . . . . . . . . . . . . . . . ...”.”” .. ”. .” ”” ”””” ””. ”...247
10.7 Experiments . . . . . . . . . . . . . . . . . . . . . . . . . . . . . . . . . . . . . . . . . . . . . . . . . ...24910.7,1 Propane Diffusion FlameTests for HF . . . . . . . . . . . . . . . . . . . . . . . . . . . . ...24910.7.2 Liquid Heptane Diffusion Tests for HF . . . . . . . . . . . . . . . . . . . . . . . . . . . . ..24910.7.3 Premixed Flame Tests for HF . . . . . . . . . . . . . . . . . . . . . . . . . . . . . . . . . . ...251
/10.7,4 HF Sampling Technique . . . . . . . . . . . . . . . . . . . . . . . . . . . . . . . . . . . . . . ...25110.7.5 Transient State Measurements . . . . . . . . . . . . . . . . . . . . . . . . . . . . . . . . . . ...251
10.8 Results . . . . . . . . . . . . . . . . . ..........”””.””””.”””” “’”.---+’oo””””~~~10.8.110.8.210.8.310.8.4
Steady-state -Premixed Flames. . . . . . . . . . . . . . . . . . . . . . . . . . . . . . . . . ...253Steady-state -Gaseous Diffusion Flames . . . . . . . . . . . . . . . . . . . . . . . . . . ...257Steady-state -Liquid Diffusion Flames . . . . . . . . . . . . . . . . . . . . . . . . . . . ...272Transient-state -Gaseous Diffusion Flames . . . . . . . . . . . . . . . . . . . . . . . . . . . 274

202
in Larger Scale Tests .
10.9.1 Comparison with Predictions . . .10.10 Parametric Analysis . . . . . . . . . . . .
10.10 .l Results . . . . . . . . . . . . . . . . . .10.10.2 Conclusions . . . . . . . . . . . . . .
10.11 Predicting HF in Dry-Bay and Engine
10.11.1 Engine Nacelle Fires . . . . . . . .10.11.2 Dry-Bay Fires . . . . . . . . . . . . .
10.12 Summary . . . . . . . . . . . . . . . . . . . .]0.13 Acknowledgments . . . . . . , . . . . . .
Appendix. . . . . . . . . . . . . . . . . . .
1(). PREDICTIONOF HF DURINGSUPPRESSION
. . . . . . . . . .
. . . . . . . . . .
. . . . . . . . . .
. . . . . . . . . .
. . . . . . . . . .
Nacelle Fires. . . . . . . . . .
. . . . . . . . . .
. . . . . . . . . .
. . . . . . . . . .
. . . . . . . . . .
Computer Program Predicting Formation
. . . . . . . . . . . . . . . . . . . . . . . . 274
. . . . . . . . . . . . . . . . . . . . . . . . 283
. . . . . . . . . . . . . . . . . . . . . . . . 285
. . . . . . . . . . . . . . . . . . . . . . . . 285
. . . . . . . . . . . . . . . . . . . . . . . . 288
. . . . . . . . . . . . . . . . . . . . . . . . 292
. . . . . . . . . . . . . . . . . . . . . . . . 292
. . . . . . . . . . . . . . .. . . . . . . . . . 294
.,, ,.. . . . . . . . . . . . . . . . . . . 295
. ...,. . . . . . . . . . . . . . . . . . . 298
. . . . . . . . . . . . . . . . . . . . . . . . 298of f, . . . . . . . . . . . . . . . . . .302

10. PREDICTIONOF HF DURINGSUPPRESSION 203
10.1 Introduction
The acid gases hydrogen fluoride, hydrogen chloride, and hydrogen bromide (HX, where X denotes ahalogen), are thought to be the most damaging and dangerous of the potential decomposition products,
and much study has been devoted to determining the amounts of these chemicals formed during firesuppression by CF3Br and halon alternatives. While CF3Br is known to readily decompose to formHF, HBr, and COF2 in laboratory premixed and diffusion flames and in larger scale fires, the amountswere not considered to be a major threat compared to that of the fire itself. The alternative agentshave been found to produce significantly more acid gas than CF3Br, and consequently, there exists aneed to understand and predict the mechanisms of formation of acid gases in laboratory flames, and
ultimately, suppressed fires.The goal of this project is to develop an ability to predict the quantity of HF formed during
suppression of aircraft fires. In order to understand the formation rates of acid gases in dry bay andengine nacelle fires it is necessary to examine the thermodynamics and chemical kinetics relevant to
the formation of the acid gases as well as the effects of the flow field and mixing on the chemistry.An engine nacelle fire may be similar to a steady turbulent spray diffusion flame, whereas a dry bayfire may resemble a rapidly advancing turbulent premixed flame. Because suppression of the dry bayfires occurs in a time of about 100 ms, it is also necessary to consider transient effects on the acid gasformation. The formation of toxic and corrosive by-products in flames/fires inhibited by halogenatedhydrocarbons is controlled by transport rates of the agent into the flame, chemical kinetic rates, orequilibrium thermodynamics. These factors are affected by the fuel type, local mixture composition,
inhibitor type and concentration, and the characteristics of the flow field such as mixing rate, strainrate, and stabilization mechanism in the case of laboratory burner flames.
The approach taken in the present work is to examine the HF production in the fire, for a rangeof conditions. Specifically, the effects of fuel type, fire type and size, agent chemical composition andapplication rate, and room humidity are considered with respect to their effect on the HF formation,both for steady-state and transient conditions. The quantity of agent required to suppress various types
of fires has been used as a measure of an agent’s utility. In addition, the amount of any unwanteddecomposition by-products formed during fire suppression has been identified as a potentially
important parameter. The rates of HF generation can then be used as a source term in more detailedmodels which include the effects of variable mixing rates of the inhibitor, mixing rates of post-firegases, ventilation rates of the space, and HF condensation to surfaces.
The influence of the key parameters through systematic experiments on laboratory-scale flameshas been studied. Agents were added to the air stream of co-flow diffusion flames under steady-stateand transient conditions. The apparatus used to obtain these data, the results and their interpretationare presented below.
10.2 Background
The halogen acid or hydrogen halide I-IX (where X represents the halogen) is a thermodynamicallystable product in mixtures containing hydrogen and halogen atoms. Formation of acid gases ininhibited hydrocarbon flames has been studied for man y years. Nonetheless, there have been no
attempts to predict the amounts of HF formed in suppressed fires which are applicable to a broadrange of fire types and conditions and which are based on first principles. Since formation of HFcould be an important parameter in selecting an agent to replace CF3Br, it is essential to develop amethod to estimate the amount of HF formed in suppressed fires as compared to the amount formed

204 1(). PREDICTIONOF HF DURINGSUPPRESSION
with CF3Br. Once the magnitude of the HF source (the suppressed fire) is determined, the relativeimportance of that amount of HF, and it’s deposition and dilution rates can be determined for theparticular application.
The previous research can be categorized as either global measurements of HF produced insuppressed fires, or detailed flame structure measurements. Burden et al., (1995) ignited mixtures offuel, air, and CH3Br in flasks, analyzed the products and found copious amounts of H13r. Numerouspremixed low pressure flame studies (Wilson, 1965 ;Kliordi et al., 1973; Safieh et al,, 1982; VanDoo-
ren et al., 1988) used mass spectroscopy to measure the profiles of hydrogen halides and other
products in hydrogen, carbon monoxide, and hydrocarbon flames inhibited by CH3Br, CF3Br, andCF3H. These studies indicated conversion efficiencies of the halogens in the inhibitor into halogenacids on the order of unity.
Acid gas formation in hydrocarbon-air pool fires suppressed by CF3Br has been studied bySheinson et al., ( 1981); Sheinson and Alexander, (1982). His studies, in test volumes of 1.7 and 650m~, stressed the difficulties in probe sampling for acid gases, The latter study described an in situ IRabsorption method for measuring HBr and HF, To overcome these limitations and also providetime-resolved acid gas concentration data (Smith et al., 1993) developed a new HX sampling techniqueand obtained HX and inhibitor concentrations as functions of time for discharge of CF3Br into a 56 m~space. In a series of experiments with a variety of fuels and halogenated inhibitors (Yamashika, 1973)showed that the extinction time for a compartment fire sprayed with inhibitor is dependent upon thedischarge rate and room volume. He then showed (1974) that the amounts of hydrogen halides andcarbonyl halides are also dependent upon the discharge rate. Using a simple model of acid gasformation based on the steady-state rates, he developed a model of transient acid gas formation toexplain his results. In more recent studies (Ferreira, 1992a, 1992b) CF3Br, C3HF7, and CAF1~ wereinjected into an enclosure fire and measured the HF produced using ion-selective electrodes,
Di Nenno et al., (1992) introduced halon alternatives into compartment fires and measured theHF, HCI, and COF2 produced using Fourier transform infrared spectroscopy. These studies againconfirmed the importance of injection rate and fuel consumption rate on the amount of acid gasproduced. “Filipczak, 1993 introduced CF2ClBr and CF3Br into a methane flame and measured the 02,C02, H20, HF, HC1, HBr, and unreacted inhibitor using a mass spectrometer. Hoke and Herud,(1993) are currently developing a fast-response ion-selective electrode for measuring HF and HC1produced in extinguished fires in crew compartments of combat vehicles. Previous research related tounderstanding acid gas formation in inhibited flames can be seen to include both detailed flamestructure measurements and global measurements of HF produced in suppressed fires. The formerprovide the basis for obtaining a good understanding of the underlying chemical kinetics of theformation of acid gases.
The global measurements provide important information on the magnitude of the acid gasesproduced and allow a comparison of the relative amount of acid gases formed by new halon alterna-tives, There has remained a need to develop a fundamental basis for interpreting the data on acid gasformation in fires suppressed by halon alternatives and to understand the chemical kinetic rates of acidgas formation in diffusion flames inhibited by these alternative agents. In particular, there has existeda need to understand the relationship between fuel and inhibitor type, flame characteristics, agenttransport rates, and the concentrations of by-products formed.

10. PREDICTIONOF HF DURINGSUPPRESSION 205
10.3 Technical Approach
The technical approach in the present project has included theoretical, numerical, and experimentalcomponents. The theoretical components have included thermodynamic calculations, numericalcalculations of the flame structure of premixed flames inhibited by fluorocarbons, and development ofa global model for HF formation in premixed and diffusion flames. Experiments have includedpremixed and diffusion flames of liquid or gaseous fuels with steady-state or transient addition of theagent. The need for and contribution of each of these components of the project are outlined below.
Equilibrium calculations are an essential first step for understanding the agent decomposition andHF formation in flames inhibited by fluorinated hydrocarbons. Although kinetic limitations areimportant to the formation of many products of combustion, the thermodynamics provide the drivingforce for reaction, and hence must be examined prior to investigating the kinetics. In order to obtain abroad understanding of the inhibited flames, numerous equilibrium calculations have been performedfor a variety of fuels and agents. Presented in Section 10.4 are some representative results whichillustrate the dominant features of the halogenated agents in hydrocarbon flames.
Although chemical equilibrium calculations are an essential first step towards understanding HFformation, combustion systems often display chemical kinetic limitations to the formation of finalproducts. Consequently, it was important to consider next an inhibited flame in which chemicalkinetic limitations could be considered. Premixed flames were selected for study since the completeflame structure is readily calculated using available techniques, and the computational time is notprohibitive. Once solutions are obtained, a wealth of information is available concerning the speciesreaction and transport in the flame, so that detailed information is available concerning byproductformation, In order to provide a first level of validation of the kinetic mechanisms, burning velocity
measurements were made and compared with the predicted burning velocities from the numericalcalculations. Section 10.5 describes the modeling results for inhibited premixed flames along withcomparison with experimental burning rates for initial model validation. The important implicationsfor HF formation predicted by the modeling results are discussed for both normal and high-pressureflames.
After obtaining the necessary theoretical background from the chemical equilibrium and premixedflame structure calculations, it was possible to develop a simple model of HF production in bothpremixed and diffusion steady-state flames. This model was subsequently extended to transientconditions. Section 10.6 describes the physical and chemical basis of the model, presents theequations which describe the amount of HF formation, and describes phenomenologically the fate ofthe agent as the inhibitor concentration in the air stream increases.
In order to provide an experimental basis for the model and then test its performance, extensivemeasurements of HF formation in laboratory flames have been performed. In these tests, fuel flowrate, fuel type, agent type and concentration and air flow have been varied. Experiments wereperformed for premixed and diffusion flames, and for liquid and gaseous fuels, in both steady-stateand transient conditions. The model for HF formation has been validated using these experiments. Inaddition, the HF formation in a large number of intermediate scale tests at the Naval ResearchLaboratory has been predicted by the model and compared to the actual HF measurements. Theexperimental configurations for all of the apparatuses are described in Section 10.7. The experimentalresults along with interpretation of the results are presented in Section 10.8. In Section 10.9, themodel is used to predict the HF formation in intermediate-scale tests performed at the Naval ResearchLaboratory.
The model for predicting HF formation appears to work well. As a result, it is a useful tool forunderstanding the effects of various parameters on HF formation that would otherwise require much

206 10. PREDICTIONOF HF DURINGSUPPRESSION
money and time to exhaustively explore. As described in Section 10.10, we have performed extensiveparametric analyses to illustrate the effects of fuel type, fire size, inhibitor type and concentration,inhibitor concentration necessary for extinction, fire-out time, and the presence of water vapor in theair. In the final section (10.11 ), we describe the parameters likely to be important in dry-bay andengine nacelle fires, and present the straightforward application of the model for predicting HFformation for a wide range of fire types.
10.4 Equilibrium Calculations with Halogenated Inhibitors
In order to firstthermodynamicproduct species
10.4.1 Results.
understand the basic driving force for reaction of the halogenated inhibitors, extensiveequilibrium calculations were performed. These provided information on the likelyfor a variety of fuel-air mixture ratios, fuel and agent type, and agent concentration.
Calculations have been performed for methane-air flames at various stoichiometriesand concentrations of C2HF5. Although methane and C2HF5 were selected for these figures, this isarbitrary; the features of the analyses are qualitatively the same for any hydrocarbon fuel andfluorinated hydrocarbon (or perfluorocarbon) inhibitor. The results are shown in Figures 1 through 6.
Detailed examination of figures such as these has illustrated the thermodynamic driving forces inhydrocarbon flames inhibited by fluorinated agents, and allowed development of an appropriate modelfor HF formation. Some of the pertinent characteristics of these inhibited flames are described below.
Figures 1 through 3 show the effects of increasing C2HF5 mole fraction on the equilibriumtemperature and species mole fractions at nominal fuel-air equivalence ratios ~ of 0.6, 0.8 and 1.0.Note that in these calculations, the equivalence ratio is calculated based on the oxygen demand of thefuel only, and does not include the oxygen demand of the inhibitor. In Figure 1, the flame is fuel lean
(0 = 0.0. At an inhibitor concentration of zero, the major products are H20 and C02; however, theflame has an excess of oxygen, and the flame temperature is low, about 1700 K. Adding inhibitor hasthe effect of increasing the flame temperature since the HFC’S behave, thermodynamically, much as afuel species. As C2HF~ is added, the temperature increases, and the fluorine in the inhibitor forms HF,diverting some of the hydrogen away from water, so that the water concentration in the flamedecreases. The additional carbon in C2HF5 is converted to C02. At an inhibitor concentration ofabout 5 to 6 Yo, the hydrogen to fluorine ratio in the flame is near unity. At this C2HF5 mole fraction,
the temperature and [COJ reach peak values, and water is absent as a product. Addition of moreC2HF5 leads to COF2 and CO formation because hydrogen and oxygen concentrations, respectively,are insufficient: The temperature decreases above 6 % C2HF5 because of the shortage of bothhydrogen and oxygen, although HF concentration increases, at a slower rate, due to the hydrogen inthe inhibitor molecule itself, For the conditions of this figure, the point of unity fluorine to hydrogenratio, temperature peak and C02 peak occur at the same C2HF5 volume fraction (about 6 910);this isnot always the case. For comparison purposes, it should be noted that a premixed stoichiometric flamein the nozzle burner described in later sections blows off at a C2HF3 mole fraction of about 0.09 formethane flames, and 0.05 for propane. Diffusion flames of propane blow off at a C2HF5 mole fractionof 0.105 in the air stream.
Figures 2 and 3, for values of @of 0.8 and 1.0, show the same trends. Water disappears at thepoint of unity hydrogen to fluorine ratio; and CF20 forms when water is gone. Carbon monoxideforms when there is insufficient oxygen, and the peak temperature occurs at the C2HF5 mole fractionwhere the CO production increases. This last effect implies that CO to C02 conversion has the largesteffect on heat release, or, conversely, that the oxygen demand has more effect on peak temperature

10. PREDICTIONOF HF DURINGSUPPRESSION 207
0.40
0.35
0.30
0.25
co.--G
f’ 0.20
0.15
0.10
0.05
0.00
(D= 0.6
CH4/Air
2000
1600
800
400
0
0 0.02 0.04 0.06 0.08 0.1
C2HF5Mole Fraction
Figure 1. Equilibrium temperature and composition of combustiotiinhibition products in thelean @= 0.6 CH4/Air mixture versus C2HF5 mole fraction.

208 1(). PREDICTIONOF HF DURINGSUPPRESSION
@ = 0.8
0.40
0,35
0.30
0,25
0.15
0.10
0.05
T CH4/Air
0,00
0 0.02 0.04 0.06 0,08 0.1
C2HF5 Mole Fraction
2000
1600
g
1200
800
400
Figure 2. Equilibrium temperature and composition of combustion/inhibition products in thelean @= 0,8 CH4/Air mixture versus C2HF5 mole fraction.

10. PREDICTIONOF HF DURINGSUPPRESSION 209
0.40<
0.35
0.30
0.25
co.—-6
$ 0.20
0.15
0.10
0.05
0.00
A
CHJAir
HF
H,O
\
o 0.02 0.04 0.06 0.08 0.1
C,HF, Mole Fraction
2000
1600
1200
800
400
0
Figure 3. Equilibrium temperature and composition of combustion/inhibition products in thestoichiometric $ = 1.0 CH4/Air mixture versus C2HF5 mole fraction”

210 10. PREDICTIONOF HF DURINGSUPPRESSION
than the hydrogen demand. Carbonyl fluoride COF2 forms when there is insufficient hydrogen forformation of HF. The species CF4 appears when there is insufficient water, and either insufficient
oxygen or carbon for formation of COF2. The CF4 concentration is typically about 20 YOof the COF2concentration.
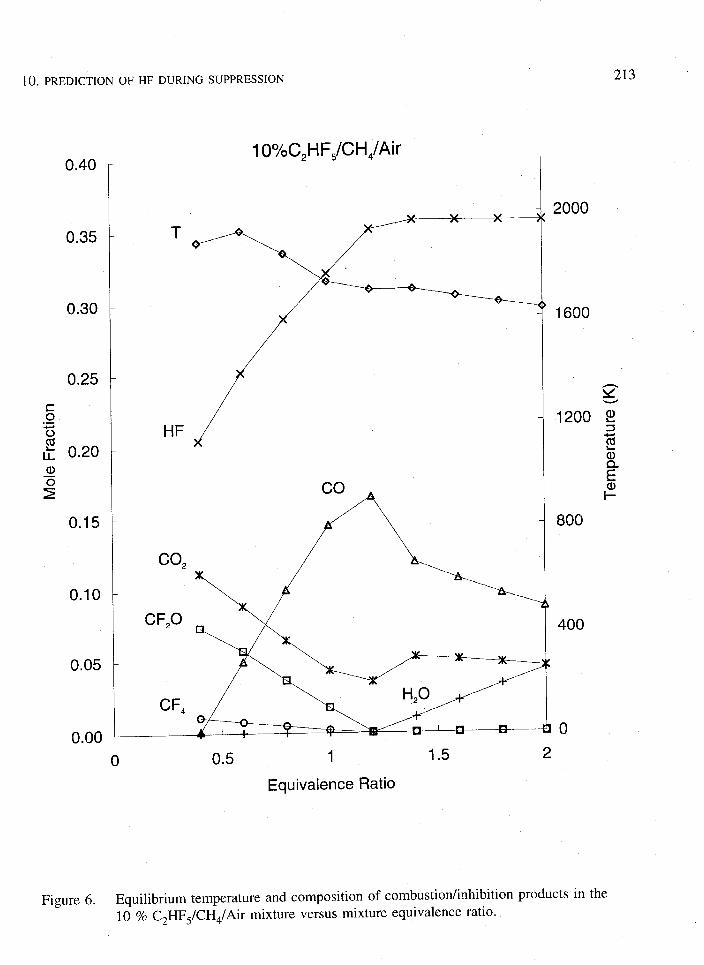
Figures 4, 5, 6 show the influence of a varying equivalence ratio on the equilibrium product molefractions and temperature at a constant inhibitor mole fraction of 0.025, 0.05, and 0.10, respectively.As in ordinary hydrocarbon-air flames, the temperature is decreased for rich flames due to incompleteconversion of CO to C02, and for lean flames due to dilution by excess air. AS described above, thepeak value of the temperature occurs at lower nominal equivalence ratios as the amount of inhibitorincreases (e.g., Figures 1, 2, 3), due to the oxygen requirement of the inhibitor.
As for hydrogen, the primary source is the fuel, so that for richer flames, the formation of waterincreases, while for leaner flames, the formation of COF2 increases. For this agent and fuel, limits to
HF formation only occur at high C2HF5 mole fractions and leaner flames (e.g., Figure 4). The greatlyreduced peak temperature occurs for the lean conditions in Figure 4 due to the hydrogen limits;insufficient hydrogen forces formation of CF20 and CF4 rather than HF and C02, limiting the peaktemperature.
10.4.2 Conclusions. From examination of the results of equilibrium calculations,. the followingcharacteristics have been observed for inhibited hydrocarbon-air flames:
1, Peak temperature occurs near the onset of CO formation.
2. Addition of inhibitor shifts the peak temperature to leaner nominal stoichiometries, since the agentacts as an additional fuel species.
3. For conditions typical of flames, the major product species which contain fluorine are HF and
COF2.
4. Hydrogen fluoride is formed preferentially over water as an endpoint for hydrogen.
5. Carbonyl fluoride and water do not exist at the same conditions, water exists only when [H]/[F] <1, COF2 when [H]/[F] >1.
6. Fuel serves as the primary source of hydrogen, which is necessary for the formation of HF.
10.5 Premixed Flame Structure Calculations and Burning VelocityMeasurements
10.5.1 Introduction. It is important to recall that the above section describes thermodynamicconsiderations only. Generally, reactant mixtures in diffusion flames like to combine at conditionswhich produce the maximum temperature; however, there can be both transport and kinetic limitations.That prevents attainment of chemical equilibrium. For flames with halogens, presence of the halogenmay influence the kinetic rates for consumption of the fuel and inhibitor. Consequently, there may bea competition between the tendency to move to conditions which produce high temperatures, andconditions which produce fast rates of consumption of the reactant’ species. For diffusion flames, the

10. PREDICTIONOF HF DURINGSUPPRESSION 211
0.40
0.35
0.30
0.25
co.-Z
f 0.20~
z
0.15
0.10
0.05
0.00
2.5Y~C,HF,/CH4/Air
T
HF
co,
H20
9 I
o 0.5 1 1.5 2
Equivalence Ratio
2000
1600
1200
800
400
0
Figure 4. Equilibrium temperature and composition of combustionlinhibition products in the2.5910 C2HF5/CHJAir mixture versus mixture equivalence ratio.

212 10. PREDICTIONOF HF DURINGSUPPRESSION
0.40
0,35
0.30
0.25
co.-5
; 0.20
0.15
0.10
0.05
0.00
57X2J-lF,/W14/Air
co,
o 0.5 1 1.5
Equivalence Ratio
Figure 5. Equilibrium temperature and composition of combustion/inhibition5 % C2HF#CH4/Air mixture versus mixture equivalence ratio.
2000
1600
g
800
400
0
2
products in the
I (). PREDICTIONOF HF DURINGSUPPRESSION
0.40
0.35
0.30
0.25
co.—5
f 0.20~
2
0.15
0.10
0.05
0.00
0
10% C2HFJCH4/Air
HF/
co
Aco,
CF,O
CF,
0.5 1 1.5
Equivalence Ratio
Figure 6. Equilibrium temperature and composition of combustiotiinhibition10 % C2HF5/CH4/Air mixture versus mixture equivalence ratio.
213
2000
1600
800
400
0
2
products in the

214 1(). PREDICTIONOF HF DURINGSUPPRESSION
transport rates of species into the reaction zone depend upon the rate at which they are consumedthere. Thus, species which are consumed slowly will build in concentration, which reduces thetransport rate to the reaction zone. That prevents attainment of chemical equilibrium. In order to
consider simultaneously the interplay of ‘thermodynamics and kinetics in a flame (while still avoidingthe added complexity of non-premixed conditions), this section describes numerical calculations of thestructure of premixed flames. These calculations allow consideration of the effect of the inhibitor onthe overall reaction rate (which is affected by both temperature and species concentrations). Inaddition, the premixed flame calculations permit examination of the exact chemical routes of formationof HF, so that additional factors which may increase of decrease HF formation rates may be consid-ered.
In order to begin to understand the chemical kinetic limitations to HF formation, numericalmodeling studies have been performed for premixed flames inhibited by the fluorinated inhibitors.The flame structure (temperature and species concentration profiles through the flame) have beencalculated for premixed methane-air flames in the presence of fluorinated hydrocarbon inhibitors.From these solutions, the chemical reaction rates and the convective and diffusion transport rates ofevery species can be determined at each point in the flame, allowing a comprehensive understandingof HF formation for these laboratory flames. The’ knowledge obtained is then used to provideguidance in interpreting large-scale tests of HF formation under other flame conditions.
As a first test of the performance of the chemical kinetic mechanism, the burning velocities ofmethane-air flames in the presence of the inhibitors have been measured. As will be demonstratedbelow, the agreement is good, providing increased confidence in the capabilities of the model. Twoseparate experiments and the accompanying numerically analyses are presented in this section. Thefirst set of experiments involves a nozzle burner, used to produce nearly adiabatic atmosphericpressure flames. In the second set of experiments (conducted at the Massachusetts Institute ofTechnology), the measurements of burning velocity are extended to higher initial pressure andtemperature through the use of a constant volume combustion device (bomb) - (Hochgreb et al., 1994;VanDerWege et al., 1995). The predicted burning velocity reductions for each device are comparedwith the results of numerical calculations. The calculated flame structure is then used to understandthe HF formation under both atmospheric pressure and at elevated pressures and temperatures (whichmay be representative of suppressed dry-bay fires).
10.5.2 Background. Early studies of the inhibitory effects of halogenated hydrocarbons on flameswere conducted in premixed systems (Burgoyne et al., 1948; Coleman, 1951; Belles et al., 1957;Simmons et al,, 1956; Garner et al., 1957; Rosser et al. 1959; Lask and Wagner, 1962). Thepremixed laminar burning velocity is a fundamental parameter describing the overall reaction velocity,heat release, and heat and mass transport in a flame. In addition, the reduction in the premixed flameburning velocity is useful for understanding the mechanism of chemical inhibition of fires sincediffusion flames often have a stabilization region which is premixed, and good correlation has beenfound between the reduction in burning velocity and the concentration of inhibitors found to extinguishdiffusion flames (Hastie, 1975). Premixed flame burners have flow fields which are relatively easilycharacterized, making interpretation of the inhibitor’s effect on the overall reaction rate straightfor-ward.
The present research extends the investigations of burning velocity reduction to fluorinatedinhibitors in hydrocarbon flames and applies a newly-developed kinetic mechanism to model theexperiments. The burning velocity measurements are examined as a first step in the validation of themechanism, and the numerical results are used to study the mode of inhibition of the fluorinatedagents and the mechanisms of HF formation.

1(). PREDICTIONOF HF DURINGSUPPRESSION 215
10.5.3 Experiment - Nozzle Burner. Numerous techniques exist for measuring burning velocities of
flames, and there are good reviews in the literature (Linnett, 1953; Andrews and Bradley, 1972). Allof the flame and burner geometries employed, however, cause deviations from the desired one-dimens-ional, planar, adiabatic flame. In the present research, a premixed conical Bunsen-type nozzle burneris used for the atmospheric pressure experiments. This method was selected for the flame speedmeasurements because its simplicity allows rapid assessment of the behavior of a number of halonalternatives. The low rate of heat loss to the burner, the low strain rate, and the low curvaturefacilitate comparisons of the experimental burning velocity with the predictions of a one-dimensionaInumerical calculation of the flame structure. Although measurement of a true one-dimensional, planar,
adiabatic burning velocity is difficult, the relative change in the burning velocity can be measuredwith more confidence, Consequently, the burning velocity reduction in the present work is normalizedby the uninhibited burning velocity. For comparison with the results of other researchers, the absoluteburning velocities of the uninhibited flames are also presented.
The burner consisted of a Mache-Hebra nozzle burner (Mache and Hebra, 1954; Van Wonterghemand Van Tlggelen, 1954) 27 cm long, with an inner diameter of 22 mm and wall thickness of 1.5 mm.A contraction at the top to a nozzle diameter of 1.02 (+/- 0.005 cm) occurs over a length of 3 cm.The nozzle contour is designed to produce straight-sided schlieren and visible images which are veryclosely parallel. The burner is placed in a square acrylic chimney 10 cm wide and 86 cm tall withprovision for co-flowing air or nitrogen gas (for the present data, the co-flow velocity is zero). Gas
flows are measured with digitally-controlled mass flow controllers (Sierra Model 8601) with a claimedrepeatability of 0.2 % and accuracy of 1 %, which have been calibrated with bubble and dry
(American Meter Co. DTM-200A) flow meters so that their accuracy is 1 %. The fuel gas is methane(Matheson UHP). House compressed air (filtered and dried) is used after it has been additionallycleaned by passing it through an 0.01 mm filter, a carbon filter, and a desiccant bed to remove smallaerosols, organic vapors, and water vapor. The product gas temperature of the uninhibited flames ismeasured with Pt/Pt 6 Yo Rh - Pt/Pt 30 VoRh thermocouples which are coated with Yttrium oxide toreduce catalytic reaction on the thermocouple surface. Measurements with two bead diameters (344and 139 pm) allow correction for radiation losses.
For the present data, the visible flame height is maintained at a constant value of 1.3 cm to
provide similar velocities of heat loss to the burner, while the desired equivalence ratio and inhibitorconcentration are preserved. An optical system provides simultaneously the visible and schlierenimages of the flame. A 512 by 512 pixel CCD array captures the image which is then digitized by aframe-grabber board in an Intel 486-based computer. The flame area is determined (assuming axialsymmetry) from the digitized schlieren image using custom-written image processing software. Theaverage mass burning velocity for the flame is determined using the total area method.
10.5.4 Experiment - Bomb. For the elevated pressure experiments, a constant volume combustiondevice is used which is amenable to flame speed measurements at elevated and reduced pressures.The experimental apparatus consists of a spherical container 15.24 cm in diameter with one inlet portthrough which the combustible mixture is introduced. Ignition is provided by
at the center of the bomb. A pressure transducer monitors the pressure of theconsumed. The surface of the bomb was coated with vacuum grease to avoid
two extended electrodesdevice as the fuel iscorrosion by the
1Certain trade names and company products are mentioned in the text or identified in an illustration inorder to specify adequately the experimental procedure and equipment used, In no case does suchidentification imply recommendation or endorsement by the National Institute of Standards andTechnology, nor does it imply that the products are necessarily the best available for the purpose.

216 10. PREDICTIONOF HF DURINGSUPPRESSION
products of combustion. The bomb was initially evacuated, and precalculated partial pressures ofinhibitor, fuel and air were added. Care was taken to remove the acid combustion products beforeevacuating the bomb for the next experiment. A more detailed description of the apparatus is given
by Metghalchi and Keck (1980).After introduction of the combustible mixture in the bomb, the flame is ignited at the center and
calibrated pressure trace is obtained. Given the initial conditions, it is possible to relate the pressure
signal to the extent of reaction. By solving the energy and mass conservation equations, the flamespeed is determined as a function of the temperature and pressure of the adiabatically compressed,unburned mixture ahead of the flame. Allowances are made for property variation in the burned andunburned gases due to temperature change and heat transfer to the wall.
a
10.5.5 Model, The structure of the inhibited premixed methane-air flame is calculated using currentlyavailable techniques (Kee et al., 1980; Kee et al., 1983; Kee et al., 1988). The equations of mass,species, and energy conservation are solved numerically for the initial gas compositions of the
experiments. The solution assumes isobaric, adiabatic, steady, planar, one-dimensional, laminar flowand neglects radiation and the Dufour effect (concentration gradient-induced heat transfer) but includesthermal diffusion. The calculations employ a chemical kinetic mechanism recently developed at NIST(Burgess et al., 1994; Burgess et al,, 1995) for fluorine inhibition of hydrocarbon flames, which isbased on earlier work (Burgess et al., 1993; Westmoreland et al., 1994; Nyden et al., 1994). The83-species mechanism uses a hydrocarbon sub-mechanism and adds Cl (200 reactions) and CT (400reactions) fluorochemistry. The hydrocarbon sub-mechanism has been updated to use GRI-Mech (31species, 177 reactions (Frenklach et al., 1994) which more closely predicts our experimental uninhibit-ed burning velocities. The fluorinated-species thermochemistry in the references (Burgess et al., 1994;
Burgess et al., 1995) is from the literature when available and is otherwise estimated using empiricalmethods (such as group additivity) and through application of ab initio molecular orbital calculations.Fluorinated species reaction rates from the literature were used when available and these wereextended to wider temperature and pressure ranges using standard methods based on classic statisticalmechanics and quantum mechanics. Where no rate data were available, rate constants were estimatedby analogy with hydrocarbon reactions. Although all of the reactions are not necessary to describe thepresent flames adequately, the comprehensive full mechanism is used for these initial calculations.Reduction of the mechanism will be performed later after more experimental validation. It should beemphasized that the mechanism adopted for the present calculations should be considered only as astarting point. Numerous changes to both the rates and the reactions incorporated may be made once avariety of experimental and theoretical data are available for testing the mechanism.
10.5.6 Results, In the nozzle burner flames, the radiation-corrected temperature of the uninhibitedflames is measured at 4 mm above the flame tip to be 2054, 2075, and 2050 (+/- 70 K) for $ = 0.95,1.0, and 1.05 respectively, while the adiabatic flame temperature is calculated to be 2191, 2229, and2234 K. In these experiments, the measured final temperatures at a point slightly downstream fromthe reaction zone are about 150 K lower than the calculated adiabatic flame temperatures. Heat lossesto the burner, although important near the rim, are not expected to be large compared to the heatrelease integrated over the entire flame. The quartz tube of the burner was not observed to increaseappreciably in temperature during the experiments. The observed heat loss may be due to non-one-di-mensional effects, radiation, or chemical non-equilibrium in the post-combustion gases. Nonetheless,since the temperature difference is not too great, it seemed most appropriate to model the flame asfreely-propagating rather than burner-stabilized (where heat losses, for example in a flat flame burner,are greater).
1(). PREDICTIONOF HF DURINGSUPPRESSION 217
The average burning velocity is determined using the total area method described above, in whichthe flow rate of reactants is divided by the measured schlieren image area. Figure 7 presents the
measured mass burning velocity (expressed as the equivalent flame velocity for flame propagation intoreactants at 298 K) as a function of equivalence ratio for the uninhibited methane-air flame, together
with the results of Rosser et al., (1959) and Vagelopoulos et al., (1994). The present data are about
7 % higher than the results of Rosser et al. (1959) for $<1.0 and up to 30 % higher for@ >1.0. Inthe recent experiments of Vagelopoulos et al., 1994, the measured burning velocities of premixedplanar counterflow flames are extrapolated to zero stretch. For values of $ from 0.8 to 1.2 the presentdata are 3 to 7 % higher than their results. This discrepancy may result from curvature and stretch inthe present flame which occurs in the conical Bunsen type flame. Figure 7 also shows the burningvelocity as a function of stoichiometry calculated using the present mechanism. The agreementbetween the experiment and model is very good for the number of grid points used in the calculation;however, using three hundred or more grid points gives burning velocities slightly lower, so that theexperimental results would be about 7 % too high for values of $ from 0.8 to 1.2. Nonetheless, thisagreement is considered to be good, and is expected since GRI-Mech is being developed using existingexperimental methane-air burning velocities and the present experimental results are close to those ofother researchers.
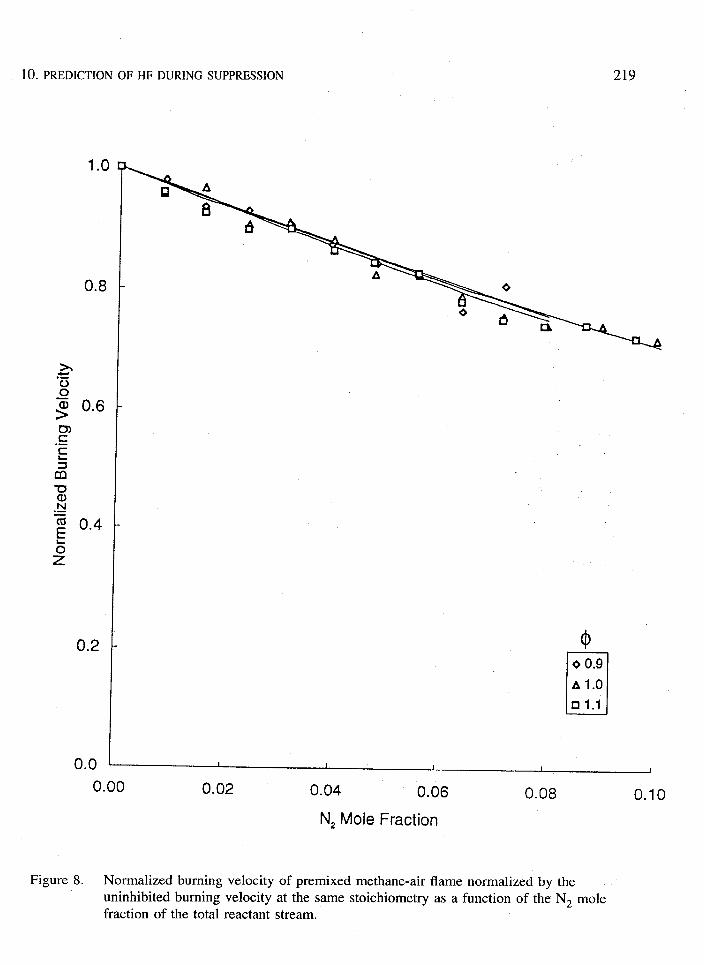
The results for the flames inhibited by N2, CF4, CH2F2, and CF3H are presented in Figures 8-11respectively. The figures show the burning velocity of the inhibited flame (normalized by the burningvelocity of the uninhibited flame) for values of $ of 0.9, 1.0, and 1,1 (here, the equivalence ratio iscalculated based on the oxygen demand of the fuel only). The mole fraction of the inhibitor in Figure8, as well as in all other figures, refers to the entire reactant mixture: fuel + oxidizer + inhibitor. As abaseline case, Figure 8 shows the results for a flame inhibited by N2. The excellent agreement inFigure 8 is again a consequence of the performance of GRI-Mech. Most of the scatter in the plots ofthe experimental burning velocity results from flame fluctuations: the camera framing rate is 30 Hzand flame area is obtained from a single image; signal averaging would reduce this scatter.
In Figures 9- 11, the numerical results are presented in two ways: the solid lines presentsolutions which allow full chemistry, while the dotted lines present solutions in which the inhibitor isconstrained to be inert so that only the thermal and transport properties of the flame are modified bythe inhibitor. Experimental and numerical results are presented for inhibitor mole fractions up to 0.08when possible. Although measurements of the burning velocity reduction of even higher inhibitormole fractions is desirable, flames could not be stabilized much beyond 8 $+0for most of the inhibitors.For the lean stoichiometry and the inhibitors CF4 and CF3H, flames could not be stabilized forinhibitor mole fractions above about 4 Yo. Figure 9 shows the results for CF4. The lines are nearlycoincident for the inert calculations at @= 1.0 and 1.1, and the reacting calculation at @= 0.9 and 1.0.The experiments show slightly more inhibition for richer flames; whereas the model shows moreinhibition for the leaner flame. The calculation which assumes CF4 to be inert shows slightly lessinhibition than the solution which allows decomposition, but again, the difference is small. Thecalculated burning velocity is in excellent agreement with the numerical solution which allows reactionof CF4. Clearly, decomposition of CF4 in the flame is kinetically limited. Tetrafluoromethaneinfluences the burning velocity mainly through its role as an inert species which lowers the flametemperature.
Figure 10 presents the results for CH2F2. Again, rich flames show more inhibition than the leanflames but the effect is large for CH2F2. The fuel effect of adding CH2F2 to lean flames increases theadiabatic flame temperature above the uninhibited case for low CH2F2 mole fractions, promoting ahigher burning velocity. In competition with this effect is the slower kinetics caused by presence ofthe fluorine compounds as discussed below. Note that although the adiabatic flame temperature ishigher for lean flames with up to 5 % CH2F2, the burning velocity is still reduced relative to the

218
45
40
35
30
15
10
5
0
10. PREDICTIONOF HF DURINGSUPPRESSION
A Experiment
x Vagelopoulos et al.
+ Rosser et al.
— Model
1 I ! ! 1 1 1
0.7 0.8 0.9 1.0 , 1.1 1.2 1.3 1.4
Figure 7. Burning velocity determined using the total area method from the schlieren image ofthe premixed methane-air flame in the nozzle burner as a function of fuel-airequivalence ratio.
10. PREDICTIONOF HF DURINGSUPPRESSION 219
1.0
0a
0.8A
o
h.=~~ 0.6
P.-C
zmaN
~ 0.4
zz
0.2 - @
n
00.9A1.o
❑ 1.1
0.0 1 1 1 f 1
0.00 0.02 0.04 0.06 0.08 0.10
NzMole Fraction
Figure 8. Normalized burning velocity of premixed methane-air flame normalized by theuninhibited burning velocity at the same stoichiometry as a function of the N2 mole
fraction of the total reactant stream.
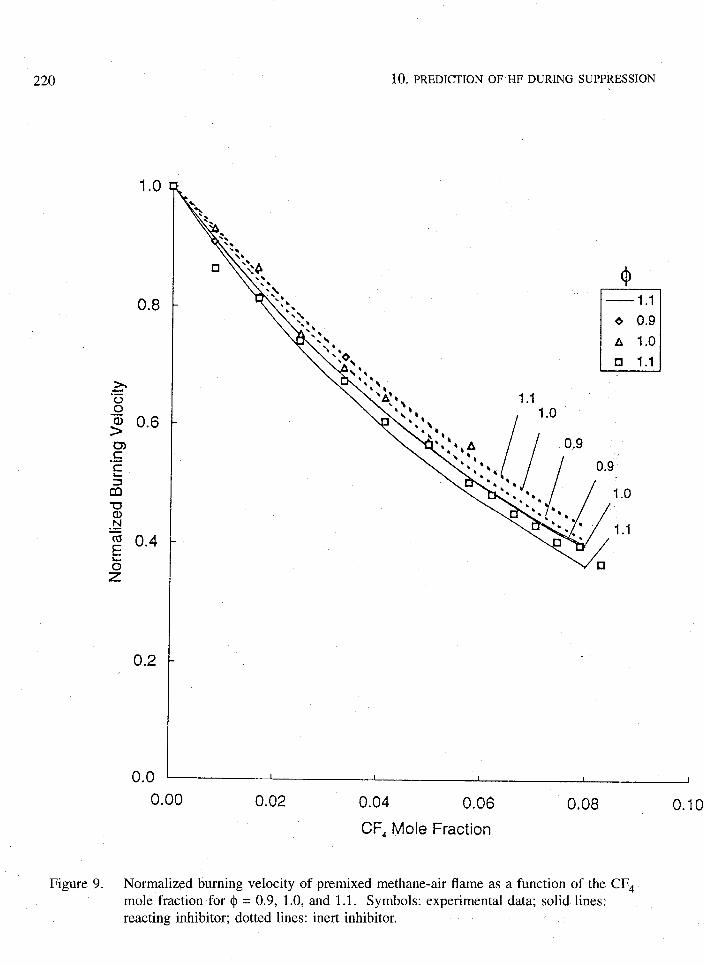
220 10. PREDICTIONOF HF DURINGSUPPRESSION
1,0
0.8
0.2
0.0
—1.1
e !3.9
A 1.0
❑ 1.1
0.9
0.00 0.02 0.04 0.06 0.08
CF, Mole Fraction
Figure 9. Normalized burning velocity of premixed methane-air flame as a function of the CF4mole fraction for $ = 0.9, 1.0, and 1.1. Symbols: experimental data; solid lines:reacting inhibitor; dotted lines: inert inhibitor.
0.10

10. PREDICTIONOF HF DURINGSUPPRESSION
1,0
0.8
-0a)N
~ 0.4
zz
0.2
0.O
221
@
740.9A1.o
❑ 1.1
0.00 0.02 0.04 0.06 0.08
CH2F, Mole Fraction
Figure 10. Normalized burning velocity of premixed methane-air flame as a function of theCH2F2 mole fraction for $ = 0.9, 1.0, and 1.1. Symbols: exp. data; solid lines:
0.10
reacting inhibitor; dotted: inert inhibitor.

222 1(). PREDICTIONOF HF DURINGSUPPRESSION
uninhibited flame. The calculated burning velocities are very close to the measured values for CH2F2mole fractions up to 5 70; as the inhibitor mole fractions reach 8 70, the calculations over-predict theburning velocity reductions by up to 17 %.
The results for CF3H are shown in Figure 11. The mechanism is showing the proper qualitativefeatures of the inhibition including the dependence on stoichiometry and the reduced inhibitory effectat higher inhibitor mole fractions; however, the calculation is showing up to 20 YO more reduction inburning velocity than is observed in the experiments. Figure 12 summarizes the calculated burning
velocity for inhibition by CH4 and CF4, CH2F2, and CF3H at $ = 0.9 and 1.1; a fit to experimental
results for CF3Br (Rosser et al., 1994)are included for comparison. All calculations predict that the
rate of reduction in the burning velocity with addition of inhibitor becomes less at higher inhibitorconcentrations, and predict a strong effect of $ on the inhibition effect. The fluoromethanes are muchless effective than CF3Br at reducing the burning velocity of methane-air flames at these equivalenceratios. Interestingly, all of the fluoromethanes are less efficient at reducing the burning velocity of therich methane-air flames than methane itself. For the slightly fuel lean flames, the fuel effect(increasing burning velocity of lean flames with addition of the inhibitor) is larger for methane thanfor the fluoromethanes, yet upon entering the fuel rich regime, the effect of methane as an inhibitoragain is greater than the fluoromethanes.
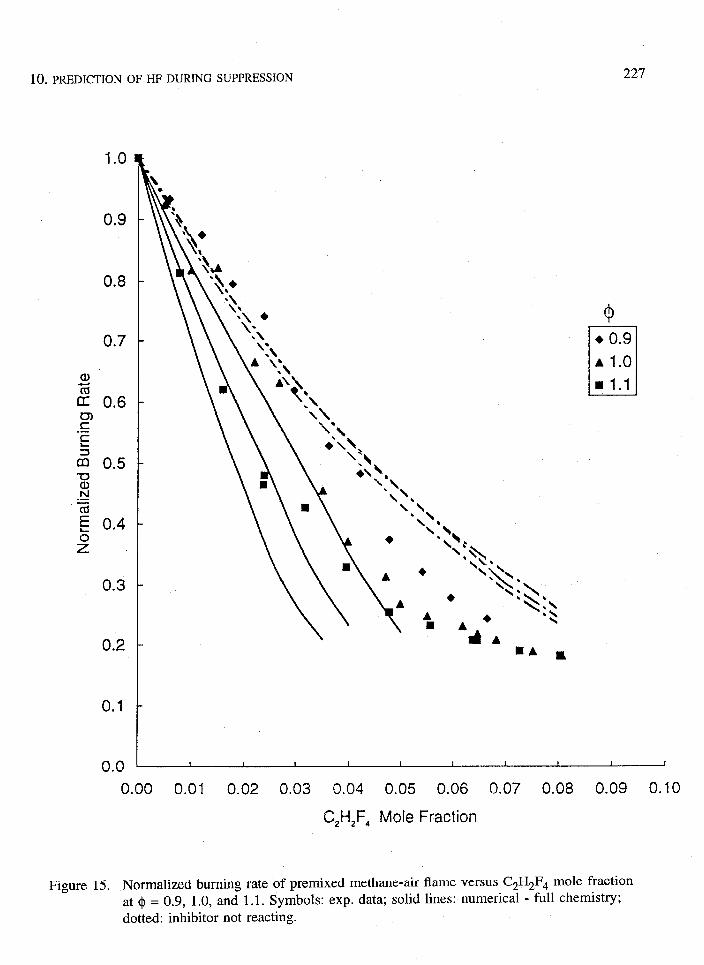
Figures 13- 15 present the burning velocity reduction caused by addition of the inhibitors C’2Ffj,
C2HI?5, and C2H2F4. As the figures show, the greatest reduction in burning velocity was obtainedwith the perfluorinated agent CLFfj, followed by C2HF5 and C2H2F4. For the agent C’2FG,the burningrate calculated by assuming the agent to be inert under-predicts the burning velocity reduction byabout 25 70, while the calculation which allows full reaction over-predicts by about 14 9Z0.As shownin Figures 14 and 15, the results for C2HF5 and C2H2F4 are similar. An important feature of theinhibition is its dependence on the equivalence ratio, with larger burning velocity reductions occurringin the richer flames. This dependence on the equivalence ratio becomes greater as the hydrogencontent of the inhibitor increases. This feature is not captured by the inert calculations; in fact, theypredict the opposite: a small decrease in inhibitor effectiveness as @increases from 0.9 to 1.1. Anadditional observation, clearly illustrated in Figures 14 and 15, is that all of the inhibitors showreduced effectiveness as the inhibitor concentration increases. This has been observed for one-carbonfluorinated agents, where the mechanism for inhibitor consumption shifts from radical attack at lowconcentration, to thermal decomposition at high inhibitor concentration (Linteris, 1994). The resultsfor the three-carbon fluorinated agents are presented in Figures 16 and 17. These agents, C3F8 andC3HFT, are about as effective, on a volume basis, as the two-carbon inhibitors, and show the samelarge dependence on the equivalence ratio and on the inhibitor mole fraction. However, in the case ofC3HFT, the inhibition effect is strongest in the lean flame, whereas in all other cases the rich flamesare inhibited most. The reasons for this are presently unclear but are of great interest.
As described above, the combustion bomb allows burning velocity measurements to be conductedfor higher initial temperature and pressure. For the present experiments, the range of unburned gaspressures is 203 to 709 kPa (2 -7 bar), and the temperatures, 330 to 500 K. Figure 18 shows a curvefit to the burning rate data collected in the bomb as a function of temperature and pressure. To allowcomparison, the bomb results were extrapolated to the conditions of the nozzle burner described above.In the presence of the inhibitor CF3H, the reduction in burning velocity as a function of CF3H molefraction is shown in Figure 19, As the figure indicates, the two experiments yield approximately thesame burning rate reduction,
The measured burning rate as a function of unburned gas temperature (which is related to theunburned gas pressure) is shown in Figure 20. Experimental curves are shown for O, 1, 2, and 5 ‘-ZO
inhibitor at equivalence ratios near unity. The figure also shows the results of the numericalcalculations of the burning rate using the kinetic mechanism described above. Although the burning

10. PREDICTIONOF HF DURINGSUPPRESSION 223
1.C
0.8
0.2
0.0
0.00
k .A ,..,
A.
r%00.9●✛✌
o ●*,\ uAI.()A \:.
6 ●:* ❑ 1.1\:b
,’$‘>:t,
8+\\ AQ ‘S::t
❑ .:$
\
A\;\,
● \ ‘b‘u9. 8,
❑ A1.1‘. b,
●.,*‘.
\
A .,’..< ,,❑ “.
‘.:1 “
IJAA \
o
A
DA❑
0.9
1.0
1.1
I 1 1 1
0.02 0.04 0.06 0.08
J
0.10
CF,H Mole Fraction
Figure 11. Normalized burning velocity of premixed methane-air flame as a function of theCF3H mole fraction for @= 0.9, 1.0, and 1.1. Symbols: exp. data; solid lines:reacting inhibitor; dotted lines: inert inhibitor.

224 10. PREDICTIONOF HF DURINGSUPPRESSION
45
40
35
30
Q-E0
25
20
15
CH4.-.-*
)- ,. (0.9)
L .
\
‘ ‘ ‘k”. “88
-- .. .‘s
h ....●
b‘* K*..,
\..
. .
\
b●
%. s. ‘% ,. . ‘b
‘. . , ‘*.* ,.. ‘, . .. \*
*\
\ -8
\/
-.2F3Br ‘ ‘*,, , ‘~,
1.2) * ●
.6’1 ..,r, . . CF4
\ . .~r D.tr3Dl
).8)
bs.
CH4
(1.1)
CF,
(0.9)
/\ CH,F2
CF3H(1.1)
o I I 1 1(1.1)
I I
o 0.02 0.04 0.06 0.08 0.1
Inhibitor Mole Fraction
Figure 12. Calculated burning velocity of lean (dotted lines) and rich (solidflames with addition of the agents CH4, CH2F2, CF3H, CF4, andinhibitors.
lines) methane-airCF3Br as flame

10. PREDICTIONOF HF DURINGSUPPRESSION 225
1.0
0.9
0.8
0.7
a)
i? o,6mc.-Cs
m 0.5uaN
=
g 0.4
s
0.3
0.2
0.1
0.0
●
✎ ✎
✘✎
8s. .**
I*. .
.*. .
. **●
n“● 0.9
AI.()
■ 1.1
0.00 0.01 0.02 0.03 0.04 0.05 0.06 0.07 0,08 0,09 0.10
C,F~ Mole Fraction
Figure 13. Normalized burning rate of premixed methane-air flame versus CZF6 mole fraction at@= 0.9, 1.0, and 1.1. Symbols: exp. data; solid lines: numerical - full chemistry;
dotted: inhibitor not reacting.

226
1.0
0.9
0.8
0.7
cl)-CdE 0.6
s’.-C
: 0.5a)N.——a
E 0.42
0.3
0.2
0.1
0.0
10. PREDICTIONOF HF DURING
.
SUPPRESSION
❑ 0.9
AI.()
91.1
I 1 I 1 1 1 ! f I I
0.00 0.01 0.02 0.03 0.04 0.05 0.06 0.07 0.08 0.09 0.10
C,HF~ Mole Fraction
Figure 14. Normalized burning rate of premixed methane-air flame versus C2HF5 mole fractionat $ = 0.9, 1.0, and 1.1. Symbols: exp. data; solid lines: numerical - full chemistry;dotted: inhibitor not reacting.
10. PREDICTIONOF HF DURINGSUPPRESSION
1.0
0.9
0.8
0.7
a)
~ o.6u)c.—c
z 0.5-tJN.—
73g ().4
2.
0.3
0.2
0.1
0.0
.
227
D+ 0.9Al. ()
❑ l.1
0.00 0.01 0.02 0.03 0.04 0.05 0.06 0.07 0.08 0.09 0.10
C2H2F4 Mole Fraction
Figure 15. Normalized burning rate of premixed methane-air flame versus C2H2F4 mole fractionat $ = 0.9, 1.0, and 1.1. Symbols: exp. data; solid lines: numerical - full chemistry;dotted: inhibitor not reacting.

228 1(). PREDICTIONOF HF DURINGSUPPRESSION
.-1 .C
0.9
0.8
0.7
0.6
0.5
0.4
0.3
0.2
0.1
0.0
0
300
❑
A
o
0
0
N
A El
A
o0
m❑
Figure 16.
I I 1 I 1 ! 1 I 1 I
0.00 0.01 0.02 0.03 0.04 0.05 0.06 0.07 0.08 0.09 0.10
C,HF, Mole Fraction
Normalized burning rate normalized by the uninhibited burning velocity at the samestoichiometry for the methane-air flame at fuel-air equivalence ratios of 0.9, 1.0, and1.1 versus C3HF7 mole fraction.

10. PREDICTIONOF HF DURINGSUPPRESSION
1,0
0.9
0.8
0.7
0.3
0.2
0.1
0.0
■
A
‘A
229
--J● 0,9
AI.()
❑ l.1
0.00 0.01 0.02 0.03 0.04 0.05 0.06 0.07 0.08 0.09 0.10
CaFBMole Fraction
Figure 17. Normalized burning rate normalized by the uninhibited burning velocity at the samestoichiometry for the methane-air flame at fuel-air equivalence ratios of 0.9, 1.0, and1.1 versus C3F8 mole fraction.
230 10. PREDICTIONOF HFDURING SUPPRESSION
rate reduction is somewhat greater for the calculated flames as compared to the experiments, the modelis able to reproduce many of the features of the flames. Both show a linear increase in the burningvelocity with increased initial temperature and pressure, and similar behavior at all inhibitor concentra-tions.
While burning velocity comparisons are, by no means, a complete validation of the mechanism,they are an important first step. If the burning rate is wrong, the global reaction rate and flamethickness are probably wrong, and the predicted concentration profiles of the important species will beincorrect. Predicting the burning velocity is different from predicting the production of a species such
as HF which has only a secondary effect on the heat release rate. Nonetheless, the reasonableagreement in the burning velocity results is reason to have more confidence in the predictive ability ofthe model, and to begin to use it to investigate HF formation in the present flames. Figure 21 showsthe calculated species concentration profiles for methane-air flames with CF4, CF3H, and CH2F2 at amole fraction in the unburned gases of 4 Yo. The temperature and the mole fractions of CH4, agent,and HF are given as a function of position.
As the profiles for the agent mole fraction show, the agents CF3H and CH2F2 behave similarly,whereas, CF4 does not decompose appreciably in the 3 mm domain of the figure. The methaneconsumption is slightly slower in the inhibited flames, with CH2F2 slowing the consumption slightlymore than CF4, but not as much as CF3H. On the other hand, the temperature rise is greatest for theCH2F2-inhibited flame and least for the CF4-inhibited flame. Clearly, the exothermicity of thereactions of fluorine increase the final temperature for an equivalent reduction in burning rate ascompared to an agent which is nearly inert (CF4). While CF4 is predicted to form some HF, only asmall fraction of that possible (about 15 9ZO)forms within 3 mm. An important observation is thatwhile the inhibitors CF3H and CH2F2 require slightly higher temperatures to start to decompose thanmethane (i. e., inhibitor decomposition occurs later), their consumption is complete at about the samepoint as for methane. Likewise, HF formation is nearly complete near end of the fuel consumption.
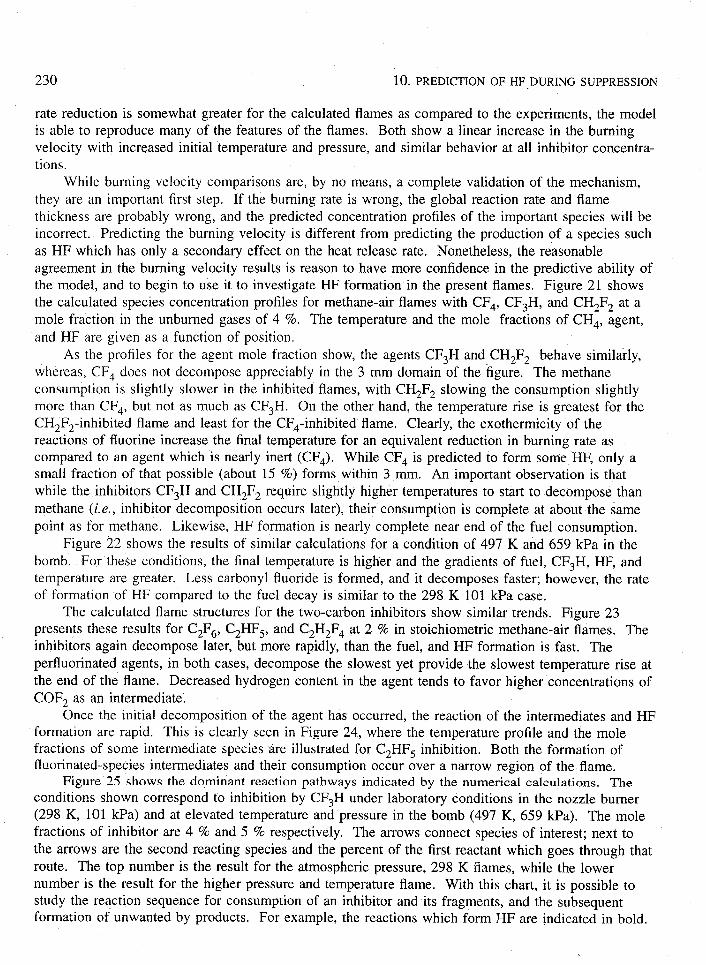
Figure 22 shows the results of similar calculations for a condition of 497 K and 659 kPa in thebomb. For these conditions, the final temperature is higher and the gradients of fuel, CF3H, HF, andtemperature are greater. Less carbonyl fluoride is formed, and it decomposes faster; however, the rateof formation of HF compared to the fuel decay is similar to the 298 K 101 kPa case.
The calculated flame structures for the two-carbon inhibitors show similar trends. Figure 23presents these results for C2F6, C2HF5, and C2H2F4 at 2 % in stoichiometric methane-air flames. Theinhibitors again decompose later, but more rapidly, than the fuel, and HF formation is fast. Theperfluorinated agents, in both cases, decompose the slowest yet provide the slowest temperature rise atthe end of the flame. Decreased hydrogen content in the agent tends to favor higher concentrations ofCOF2 as an intermediate.
Once the initial decomposition of the agent has occurred, the reaction of the intermediates and HFformation are rapid. This is clearly seen in Figure 24, where the temperature profile and the molefractions of some intermediate species are illustrated for C2HF5 inhibition. Both the formation offluorinated-species intermediates and their consumption occur over a narrow region of the flame.
Figure 25 shows the dominant reaction pathways indicated by the numerical calculations. Theconditions shown correspond to inhibition by CF3H under laboratory conditions in the nozzle burner(298 K, 101 kpa) and at elevated temperature and pressure in the bomb (497 K, 659 kPa). The molefractions of inhibitor are 4 % and 5 % respectively. The arrows connect species of interest; next tothe arrows are the second reacting species and the percent of the first reactant which goes through thatroute. The top number is the result for the atmospheric pressure, 298 K flames, while the lowernumber is the result for the higher pressure and temperature flame. With this chart, it is possible tostudy the reaction sequence for consumption of an inhibitor and its fragments, and the subsequentformation of unwanted by products. For example, the reactions which form HF are indicated in bold.

10. PREDICTIONOF HF DURINGSUPPRESSION 231
Figure 18. Curve fit to experimental burning rate velocity in combustion bomb (pressure in.103 Pa)

232 10. PREDICTIONOF HF DURINGSUPPRESSION
$!o
1.0
0.9
0.8
0.7
0.6
0.5
0.4
0.3
I I
o.
A f•1.
0
*❑ E
A~
oAA ❑ 0
Au
r—– 1 1
0 L&T 0.9❑ L&T 1.0A L&Tlol
0 Experiment 0.8
❑ Experiment 1.0A Experiment 1.2
A
A ‘0A
I I I I I
o 1 2 3 4 5 6
Vol% CF3H
I
Figure 19. Normalized burning velocity of bomb experiments as a function of CF3H molefraction extrapolated to the conditions of the nozzle burner.

10. PREDICTIONOF HF DURINGSUPPRESSION
233
Q’&
m=
0.6
r
/
0.5
0.4
0.3
0.2
a, -..“/-’--./”--””’”-’--”--’-
A-
r.
0.. . . . . . . . . . 0 0% $=1.00
——— Q 1’XO$=1,01----- A 2% &l=l.02
I ! I o 5% $=1.i315o I I I I 1 I I300
I I I I I350
1 I I I I400
I 1 I 1450 500 550
Figure 20. Experiments
near
Tu [K]FIGURE#10 VanDerWeg~usMochgrebLln leris
combustion &Flame
versus calculated Iaminar flame speeds at a nominal equivalence ratio.0(o, , 2 and 5 % CF3H in CH4-Air; p. = 92.1 kPa).

234 ](). PREDICTIONOF HF DURINGSUPPRESSION
0.15
0.12
0.09
0.06
0.03
0.00 ‘
1- CF,
2- CH,F2 T
3- CHF,
L HF + COF, 3. . . . --
----
/// /,,--”-HF/// I ,
CH, 12
~i
3 ,“2
. . ----,---------,,, ,,
/ ,’/!
I,//
II!1
Agent
-0.10 0.00
Poisition (cm)
2000
1500
0.10 0.20
1000
500
0
Figure 21. Calculated species mole fraction profiles for stoichiometric premixed methane-airflames with 4 % CF4, CH2F2 and CHF3.
](). PREDICTIONOF HF DURINGSUPPRESS1ON 235
0.20
0.15
co.—zf 0.10
0.05
0.00
!/ HF + COF2
/
,,.. .-.-.::: ;,,===..-. . . . . ---- ---- ---- ---,, ...‘!,, “-’-” HF!’,’,1,, ,,‘,!,!, ~
.- .. CH,/Air/CHF,
PO=IO1 kPa —
PO=659kPa ‘---
--” ..” I ‘i...L 1
-0.10
2000
1500
500
0
0.00
Poisition (cm)
0.10 0.20
Figure 22. Calculated species mole fraction profiles for stoichiometric premixed methane-airflames with 4 % CHF3 at 298 K, 101 kpa, and 5 % CHF3 at 497 K and 659 kpa

236 10. PREDICTIONOF HF DURINGSUPPRESSION
0.15
0.12
0.09
0.06
0.03
1- C,F,
2- C2HF,
3- C,H,F,
T
-0.10 0.00 0.10
Poisition (cm)
0.20
2000
1500
500
0
Figure 23. Calculated species mole fraction profiles for stoichiometric pr’emixed methane-air
flames with 2 % C2F6, C2HF5 and C2H2F4.

1(). PREDICTIONOF HF DURINGSUPPRESSION 237
0.00015
0.00012
0.00009
0.00006
0.00003
0
2%C,HFJCH,/Air
-0.10
2000
1500
g
500
0.00
POisition (cm)
0.10 0.20
Figure 24. Calculated species mole fraction profiles of selected fluorinated intermediate speciesfor stoichiometric premixed methane-air flames with 2 % C2HF5.

238 I (). Prediction OF HF DURINGSUPPRESSION
Table 1. Reactions responsible for formation of HF in premixed stoichiometric methane-airflames of 2 % CHF2-CF3 and 4 % CF3H at atmospheric conditions, and 5 % CHF3 at659 kPa and 497 K in the bomb
Reaction Fractionof HF Formation
AGENT: CHF2-CF3, 2 %, $ = 1,0, PO= 101 kPa
CF2+HeCF+HF 0.16H20+F++OH+HF 0$10CF:O+HWCO+HF 0.10CHF2+HHCHF+HF 0.06CF3+H++CF2+HF 0.06CF2:O+HeCF:O+HF 0.06CHF2-CF3++CF2:CF2+HF 0.06CHF+HUCH+HF 0.04H2+F+-)H+HF 0.03CH4+F+CH3+HF 0.03CH2:CHFWC2H2+HF 0.03CF:O+OHeC02+HF 0.02CF:O+CH3++CH2CO+HF 0.02CHF2+OHeCHF:O+HF 0.02CF3+OH++CF2:O+HF 0.02CHF+H20++CH20+HF 0.02CH3+CHF2eCH2:CHF+HF 0.02CH3+CF&CH2:CF2+HF 0.02CF+H#C+HF 0.02CF+OHWCO+HF 0.02CHF:O+M++CO+HF+M 0.01
AGENT CHF3,4 %, $ = 1,0,PO=101kPa
CF2+H++CF+HF 0.16H20+FeOH+HF 0.13CF3+H++CF2+HF 0.13CF2:O+H++CF:O+HF 0.08CF:O+H++CO+HF 0.08CHF3+MHCF2+HF+M 0.05CH3+CF3eCH2:CF2+HF 0.05CF3+OHeCF2:O+HF 0,04H2+F++H+HF 0.03CH4+F#CH3+HF 0.03CF+HWC+HF 0.02CF+OH+CO+HF 0.02CH2:CHF++C2H2+HF 0.02CF:O+OHi+C02+HF 0.02CH2:CF26C2HF+HF 0.01CF:O+CH&CH2CO+HF 0.01CHF:O+MeCO+HF+M 0.01

10, PREDICTIONOF HF DURINGSUPPRESSION 239
Table. 1. Continued ~
AGENT CHF3,5 %, $ = 1.06,PO=659 kPa
CF2+He+CF+HFCHF:O+MHCO+HF+MH20+F++OH+HFCF3+t-teCF2+HFCHF3+M+-+CF2+HF+MCF2:O+H++CF:O+HFCH3+CF3++CH2:CF2+HFCF:O+HeCO+HFCH4+F++CH3+HFCF3+OHeCF2:O+HFH2+F+-)H+HFCH2:CHF++C2H2+HFCH2:CF2++C2HF+HFCHF+H++CH+HFCF:O+OH+-+C02+HF
0.170.110.100.100.090.070.060.050.040.040.040,030.020.020.01
As can be seen in the figure, the higher pressure and temperature conditions decrease radical reactionsof the inhibitor and its fragments and increase thermal decomposition reactions.
Table 1 lists the reactions which contribute 1 % or more to the formation of HF in flamesinhibited by CF3H, CH2F2, and C2HF5.
Clearly, the reactions which form HF are intimately related to the entire hydrocarbon oxidationmechanism. From these figures, it appears that once decomposition of the inhibitor molecule has been
initiated, nearly every reaction of the intermediates forms HF or COF2. This is expected since reactionof the inhibitor mostly involves removing fluorine from the carbon backbone, reducing fluorine to HFand oxidizing carbon to C02. It is important to note, however, that even for the one-carbon inhibitors,about a 20 % of the inhibitor rapidly pyrolyses to form larger (i. e., two-carbon) fluorinated species,which are then decomposed in the flame.
10.5.7 Conclusions. The reduction in burning velocity has been determined experimentally andnumerically for the inhibitors CF3H, CH2F2, CF4, CzFfj, C2HF5, and C2H2F4 in near-stoichiometricpremixed methane-air flames at initial inhibitor mole fractions of O to 8 %, 298 K and 101 kPa. Evenat this early stage of development, the NIST fluorine-inhibition mechanism predicts the burningvelocity reduction quite well for these flames, and is a useful tool for understanding HF formation.Constant volume bomb experiments have extended the burning velocity measurements to a range ofpressures of 2 to 7 bar and 330 to 500 K.
The following specific conclusions can be drawn concerning HF formation in these premixedflames:
1. Burning velocities are reduced in the inhibited flames by an amount greater than attributable tothermal dilution effects.
2, Of the six inhibitors for which calculations were performed, only CFA shows kinetic limitations toHF formation for premixed methane-air flames.

240 10. PREDICTIONOF HF DURINGSUPPRESSION
CF3H PHI = 3.0
/b-FM +OH
+H “CF3H = 0.!34
.,,>;:~
+H
/\
44 17+0
91 5
\
CH2:CF289 5
CHF:O +OH
+ M39 42 37 9
60
C02
“,/’y
Figure 25. Dominant reaction pathways for decomposition of CF~H inmethane-air flame to which 470 inhibitor has been added.
a stoichiometric premixed

1(). PREDICTIONOF HF DURINGSUPPRESSION 241
3. The inhibitors (except CFJ are consumed in these flames as fast or faster than the fuel (methane)
itself.
4. All of the fluorinated intermediates react rapidly and achieve only low concentrations exceptCOF2 which can persist in the product gases. Since COF2 rapidly hydrolyses in the presence of
water, its fate in the post-suppression gases will depend upon the availability of additional waterfrom other sources besides the steady-state flame products.
5. HF is formed early in the flame, and persists at high concentrations as a final product. Theamount of HF depends on the amount of hydrogen present (from the fuel and agent) and fluorine(from the agent).
6. Since the characteristic times for fuel consumption and HF formation are similar and fast,equilibrium conditions will be reached for all agents (except CFJ in typical premixed flames.
7. Stable flames could not be obtained at fluorine loadings at or above the inhibitor concentrationwhere the fluorine to hydrogen ratio in the flames is unity.
8, The agents appear to inhibit the flames primarily by reducing the hydrogen atom concentrationwell below the level which can be attributed to the temperature reduction of the flame by theagent.
10.6 Physical/Chemical Model
10.6.1 Steady-state - Premixed Flames. Although the premixed flame numerical modeling of theprevious section can be used as the physical/chemical model to describe HF formation for the one- andtwo-carbon inhibitors, it is desirable to obtain simplifications to predict HF formation in these flames.Steady-state premixed flames are the simplest case to consider. Here, the reactants (fuel, air, andagent) are assumed to be premixed prior to interaction with the flame. This flame type most closelydescribes a flame ball expanding into a premixed combustible region as may occur in a dry-bay firethreat. In these cases, the mass flux of both fuel and agent into the reaction zone are well specified.As described in the section above describing the equilibrium calculations, the most abundant productsof agent decomposition are CO, C02, HF, and COF2. The model adopted in the present work assumesthat the fluorinated agents decompose to the most thermodynamically favorable products and that finiterate kinetics are not important for HF formation. The validity of these assumptions are based on theextensive numerical modeling of premixed flames as described above (Linteris and Truett, 1995a,1995b; Linteris, 1995a, 1995b). As will be shown below, predictions of HF formation in premixedflames based on thermodynamic equilibrium are in good agreement with measurements of HF in theseflames. Hence, the model predictions for premixed flames consist essentially of the results ofequilibrium calculations based on the fuel and agent species present in the flame.
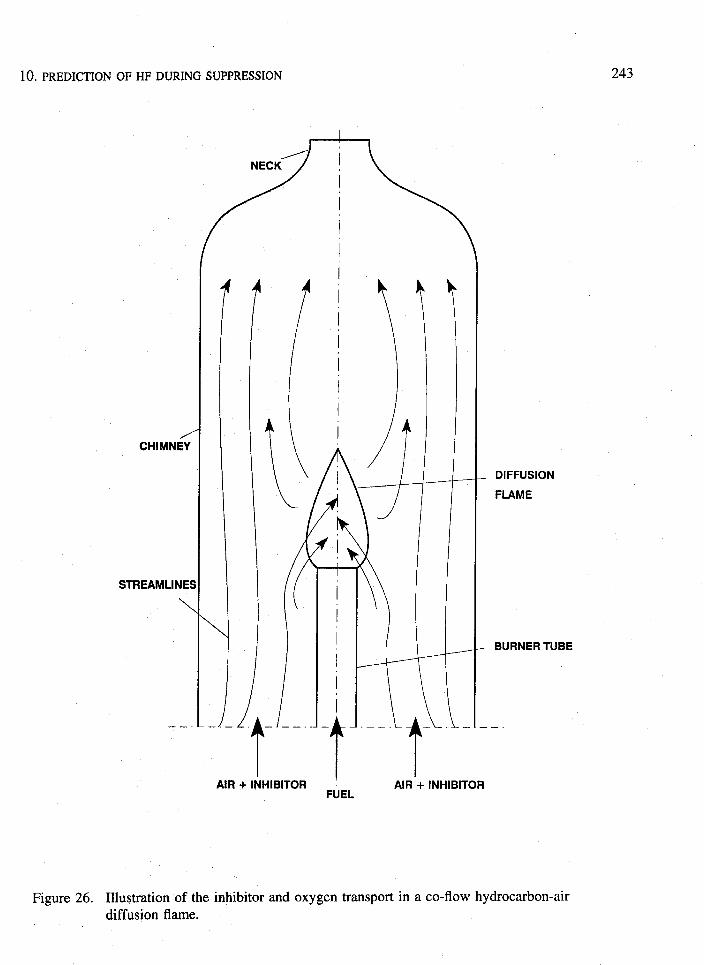
10.6.2 Steady-state - Diffusion Flames. A calculation of the equilibrium concentration of HF andCOF2 in the products of a diffusion flame is not as straightforward as in a premixed flame since theamount of agent in the reactant zone is not known a priori. Consider the case of a co-flow diffusionflame in a chimney (as in Figure 26). Fuel is supplied by the center jet, and air diffuses inward,towards the high-temperature reaction zone where it is consumed. Addition of agent to the air stream

242 1(). PREDICTIONOF HF DURINGSUPPRESSION
at a concentration less than the extinction concentration causes some of the agent to be consumed bythe flame. Not all of the agent in the co-axial region is consumed, however; the amount consumeddepends upon the relative flow rates of fuel and’ air. For example, if the outer chimney is very large,then only a small fraction of the agent in the coflowing region is consumed. Likewise, for a fire in alarger space, only inhibitor which is consumed in the flame will form HF. Thus it is necessary toestimate the flux of inhibitor into the reaction zone, since only this agent will decompose to form HF.
A model for acid gas formation has been developed based on a simple Burke-Schumann model(1928) of a co-flowing jet diffusion flame with fuel in the center and air co-axial. In the Burke-Schumann analysis, the fuel is assumed to be consumed at a reaction sheet, where fuel and oxidizercome together in stoichiometric proportions and the temperature reaches its highest value (which canbe approximated by the adiabatic flame temperature of a stoichiornetric premixed flame). The heightof the flame is determined by the jet diameter and the rate at which the oxidizer can diffuse to thecenter-line of the fuel jet. The present flames differ in that the air stream contains inhibitor in additionto oxidizer.
In the present analysis, the inhibitor is assumed to be consumed in the reaction zone as a reactive
species. This assumption is based on premixed flame measurements and modeling (Linteris et al.,
1994). For both brominated and fluorinated carbon compounds, complete consumption of the inhibitoris typical. In many cases, the inhibitor is consumed faster than the fuel itself. Extensive thermody-namic equilibrium calculations of the composition of fuel-air mixtures in the presence of halogenatedinhibitors also indicate complete exothermic conversion of the “inhibitors to HF, C02, COF2, and water.
The agent can be thought of as an additional fuel species, having its own oxygen demand, yetcoming from the air side of the flame, It must diffuse to the hot reaction zone which serves as a sinkfor the inhibitor. Thus fuel, oxygen and inhibitor are consumed in the reaction zone in stoichiometricproportions, with the stoichiometry determined from a balanced chemical reaction to the most stableproducts.
Transport rates of inhibitor and oxygen are based on their relative rates of diffusion (Linteris andGmurczyk, 1995) incorporating molecular weight effects. An implicit assumption in the presentanalysis is that the characteristic height for reaction of the fuel with oxygen is the same as thecharacteristic height for decomposition and reaction of the inhibitor, For a wide variety” of flames andconditions, the consumption of the inhibitor occurs more rapidly with hydrogen and oxygen atomsthan through thermal decomposition (Linteris and Truett, 1995a; Linteris, 1995a, 1995b). Given theinhibitors’ preference for reactions with radicals and the high concentration of these species near theflame sheet, this assumption is reasonable.
Presently, it is also assumed that there is always sufficient air for complete combustion of theinhibitor and fuel. Hence, the estimate of HF formation is an upper limit since fuel rich flames willextinguish more easily and consequently produce less HF.
The global reaction representing a combustion process in a hydrocarbon/air/water environment inthe presence of a halocarbon, leading to formation of combustion/inhibition products can be formulatedas follows:
rxC~Hb + flCCH~~C$ + pH20 + y02 + VN2 .
6C02 + AH20 + vHF + qHCl + eCOF2 + <COC12 + VN2 (1)
10. PREDICTIONOF HF DURINGSUPPRESSION 243
I
CHIMNE<
STREAMLINE!
\
. .
\
I
../
I
I\\I
AIR+ INHIBITOR AIR + INHIBITOR
DIFFUSION
FLAME
BURNER TUBE
—
Figure 26. Illustration of the inhibitor and oxygen transport in a co-flow hydrocarbon-airdiffusion flame.

244. 10. PREDICTIONOF HF DURINGSUPPRESSION
where the greek symbols are the stoichiometric coefficients. In this reaction, chlorine is the secondhalogen, however, bromine or iodine can be used alternatively.
The fluxes of the inhibitor and water vapor to the reaction zone relative to the flux of oxygen are
assumed to be proportional to the ratio of the diffusion coefficients and the concentrations, and areexpressed as follows:
& = [i] ‘iY [q] x Do
2
(2)
~ _ [ HZO ] D~,o(3)
Y- [0,1 x Do2
The molecular weight corrections for the diffusion rate of oxygen, inhibitor, and water vapor innitrogen are:
DOJDN2= $(W02+ ‘A#(wo,x ‘N)
Di /DN2 = /((wi + ‘N~l(wi x ‘N)
‘H2dDN2 = /((wH2C) + ‘N)(WH2C) x ‘N)
(4)
(5)
(6)
where: Doz, DNZ, D~zo, Di are the diffusion coefficients and W02, WNZ, WHZO, Wi are the molecularweights of oxygen, nitrogen, water vapor, and inhibitor.
For a given fuel and inhibitor, all of the subscripts (a-f) are known, so that there are sevenunknown coefficients on the right side of Equation 1 and five on the left, or twelve unknowns. Thereare six species balance reactions (for C, O, H, N, F, and Cl) and two mass flux equations (Equations 2and 3). The mass input of fuel is known, as is the ratio of oxygen to nitrogen in the air. The finalcondition is obtained from a consideration of the equilibrium results described above. TWO distinctcases exist: 1 - more hydrogen than halogen in the reaction zone, and 2- less hydrogen than halogen
in the reaction zone.Case 1 occurs for low inhibitor loadings. Hydrogen in the product gases first goes to form HF
until all of the halogen has been consumed, and any remaining hydrogen forms H20. The concentra-tion of COF2 is assumed to be zero for this case, providing the needed final relation.
In the second case, there is more halogen than hydrogen. In this case, no water forms since all ofthe hydrogen has been tied up as HF, and the excess halogen forms COF2. The solutions for thesetwo cases are described below.

1(). PREDICTIONOF HF DURINGSUPPRESSION 245
For the case of high halogen loading, or less hydrogen than halogen, the solution of the aboveequations yields the following relations describing both the flUXof agent, water vapor, and oxygen intothe flame (P, k, and p) and the amounts of product species. The fluxes of the reactants are given by:
where:
o!(4a + b)
~+e+f–4c-dp?’
IJ = PP*
(7)
(8)
(9)
PH20 ‘H20
P* = —x— (10)
P r
The fluxes of the products are expressed as follows:
/j=2y-txa-f3c+p (11)
9= 5+a(~-a) +$d+f+2p-2c -e)
< = #-6+a(a-~)+~(2c+e+.f-2p-41
E ~[6-2p- cx(a+$+&+f+21J- ~-zc)l‘2
(12)
(13)
(14)
9~=- 6+2p+a(a +~)+--(2c+d+ e-2p-j) (15)
Note that all of the terms in the product coefficients contain u (either directly or through ~), so
that the amount of each product species depends upon the fuel flow rate (a).

246 10. PREDICTIONOF HF DURINGSUPPRESSION
For the condition of low halogen loading, or less hydrogen than halogen, the solution is givenbelow:
p=4 Ct(4CZ+ b)
+e+f–4c–dz
Y=J_pr
.-
P = PP*
where:
PH20 rH2QP* = —x—
P r
The fluxes of the products are expressed as follows:
1 =2[(3(~-c)-aa]+ppr
(16)
(17)
(18)
(19)
(20)
(21)
(22)
(23)
Thus, depending on the relative halogen/hydrogen ratio different pathways of formation ofinhibition products are possible. When water vapor is absent in the system, the same system ofequations is valid, but the terms represented by p are equal to zero.
Basic features of the model are illustrated in Figure 27 for a steady-state propane-air cup burnerdiffusion flame with C3F8 in the air stream. In this figure, the fluxes of hydrogen and fluorine atomsinto the reaction zone are depicted as a function of the C3F8 mole fraction in the air stream. At zeroinhibitor mole fraction, all of the hydrogen input to the flame is converted to H20, As the inhibitor isadded and fluorine becomes present in the reaction zone, hydrogen fluoride is formed preferentiallyover water (it is more stable). When all of the hydrogen has been consumed as HF, there is no waterin the final products; any additional fluorine reaching the reaction zone shows Up primarily as COF2.

10. PREDICTIONOF HF DURINGSUPPRESSION 247
The ratio of the halogen to hydrogen concentration in the reaction zone is a useful parameter, andis obtained from the equations above as follows:
[ Halogens ] . Me + f)[ Hydrogen ] ab+~d+2p
(24)
The crossover point for the two curves in Figure 27 corresponds to a value of unity for thisparameter, and represents the switch from the first to the second solution above. This point corre-sponds to a critical value of the inhibitor flux into the reaction zone ~Cr which is equal to:
P=ab + Zp
cr e+ f-d(25)
As illustrated in Figure 27, the HF production cannot be greater than the hydrogen or fluorineflux to the reaction zone; also, the sum of HF and COF2 (the only significant other final species forfluorine) cannot be greater than the fluorine flux. For C3F8 in a propane-air flame, all of the hydrogencomes from the fuel, so that at zero inhibitor concentration there is a non-zero hydrogen flux to thereaction zone and additional inhibitor in the air stream does not increase the hydrogen flux to thereaction zone (for other inhibitors, such as C2HF5, increasing amounts of inhibitor slightly increase thehydrogen flux to the reaction zone).
Conversely, all of the fluorine comes from the inhibitor, so it increases nearly linearly with theinhibitor mole fraction Xi. Since COF2 readily hydrolyses in water to form fluoride ion F-, measure-
ments of fluoride typically include that from both HF and C0F2. In principle, the product gases frominhibited flames near extinction could contain fluorine from both HF and C0F2. Interestingly,however, the experimental results for a number of fuels and agents (Bajpai, 1974) indicate thatmeasured fluorine levels are rarely above the limit imposed by the hydrogen flux shown in Figure 27.These reduced fluoride levels may be due to kinetic limitations on the rate of inhibitor consumptionand HF formation (Linteris, 1995).
For the present analyses, however, the predicted acid gas formation in inhibited flames is basedon equilibrium thermodynamics assuming that HF (not COF2) k the source. provision is also made inthe model for inclusion of an empirical parameter, based on the experimental results, which describesthe observed deviation from the equilibrium prediction in diffusion flames for which experiments havebeen performed.
Based on the assumptions made in the stoichiometric model, a set of algebraic equations has beenderived and a computer program has been developed to solve the set. The program uses as input: theatomic composition of a fuel and inhibitor, and the initial concentrations of the inhibitor, fuel, air, andthe water vapor in the air and fuel stream. From these the estimated mole fractions of all reactants
and products in the reaction zone are calculated. The program is particularly useful for parametric
studies of the influence of each parameter on the predicted HF generation rate.
10.6.3 Transient State. The steady-state results are used to obtain results for transiently suppressedflames, In the present analyses, the inhibitor concentration in the air stream is assumed to increaselinearly in time up to the extinction concentration for the particular flame (although any known profileof concentration versus time may be used). At each value of the inhibitor concentration, the

248
0.10
0.08
0.02
0.00
10. PREDICTIONOF HF DURINGSUPPRESSION
F flux\ #
Extinction
mole fraction
0.00 0.02 0,04 0.06 0.08 0.10Inhibitor Mole Fraction
Figure 27. Stoichiometric model prediction of hydrogen and fluorine flux to the reaction zone ofa propane-air diffusion flame. The fate of the hydrogen and fluorine are indicated ateach inhibitor concentration.

]0. PREDICTIONOF HF DURINGSUPPRESSION 249
production rate of HF is determined from the steady-state equilibrium model described above,providing a plot of the HF generation rate as a function of time. Integration of this curve provides thetotal HF formed during suppression of the flame. The inhibitor concentration as a function of time isprovided as input, as is the concentration of inhibitor necessary to extinguish the flame.
10.7 Experiments
Laboratory experiments for HF formation were performed using several burner types, which sharedsome components, Three diffusion flame experiments were constructed: a propane-fueled cup burner,a propane-fueled jet burner, and a heptane-fueled cup burner. These three were used in steady-state,and the propane cup burner was also used for transient experiments. Premixed flames were used bothfor numerical model validation (the experiment for which is described above) and for HF measure-ments in steady-state. The following sections describe these experiments.
10.7.1 Propane Diffusion Flame Tests for HF. Two burner types are used for the gaseous diffusion
flame experiments. The first is modelled after the cup burner described by Booth et al., (1973) andBajpai (1974). The experimental arrangement is shown in Figure 28, The burner consists of a 28 mmdiameter pyrex cup positioned concentrically in a 120 mm diameter 450 mm tall chimney at about 150mm from the base. In these experiments with propane, the cup burner was modified for use with agaseous fuel. The cup is filled with 1 mm diameter glass beads and covered with a stainless steelscreen. The second burner consisted of a 25 cm long pyrex tube with a 0.50 mm diameter openingpositioned concentrically and at the same height as the cup burner, with the same chimney. The coldflow Reynolds number based on the exit velocity in the tube is 1050. This second burner, referred tohere as the jet burner, is designed to provide turbulent mixing of the inhibitor in the air stream withthe fuel. Although a higher jet Reynolds number would have been desirable to achieve turbulentmixing, the flame is very close to blow-off at flows with a Reynolds number of 2000, and very littleinhibitor can be added before blow-off occurs. Consequently, at these flows, it is difficult to study theeffects of air stream inhibitor concentration on HF formation.
The air used is shop compressed air, filtered and dried as described below. The fuel gas ispropane (Matheson, CP grade) at flow rate of 0.114 l/rein at 21 “C. Gas flows are measured withrotameters (Matheson 1050 series) which are calibrated with bubble and dry (American Meter Co.DTM-200A and DTM-325) flow meters. Inhibitor gases are of different purities from varioussuppliers.
Before measuring HF in the product gases, the concentration of inhibitor in the air streamnecessary to extinguish the flame is determined. The inhibitor is then added to the co-flowing air
stream at a concentration of either 50 % or 90 % of the extinguishing concentration, and the productgases are sampled for acid gas. In one series of experiments with the cup burner, the inhibitor isadded to the gaseous propane stream at 70 Yo of the concentration which would extinguish the flame.
10.7.2 Liquid Heptane Diffusion Tests for HF. The cup burner apparatus was also used in its moreusual configuration with a liquid fuel. For the purposes of this research, it is necessary to know thefuel consumption rate. To accomplish this, the overflow fuel feed system (Figure 29) was developed.In this system, a syringe pump (Harvard Apparatus Model 975) delivers the fuel at a known volumet-ric flow rate to the flame and the overflow tube, The flow is set to be greater than the expected fuelconsumption rate of the flame, and the height of the fuel overflow tube is adjusted to provide theproper height of fuel in the cup. An electronic laboratory balance (Mettler PE360) connected to a

250 10. PREDICTIONOF HF DURINGSUPPRESSION
To Vacuum
,,/
Filter
Sample Botde
Cup Burner
ColdTrep
Bubble FlowMetar
Figure 28. Experimental apparatus for co-flow diffusion flame studies of acid gas formation ininhibited propane-air diffusion flames.

1(). PREDICTIONOF HF DURINGSUPPRESSION 251
computer data acquisition system, measures the mass of liquid emerging from the overflow tube. By
subtracting the measured overllow rate from the supplied flow rate, the fuel consumption rate of the
burner is determined, The fuel in the cup burner is adjusted to a height 1 mm below the cup rim, andthis level is maintained through manual periodic adjustments during the experiment.
Heptane was used as the fuel for the liquid cup burner tests. The air cleaning and gas supplysystems were identical to those described above for the premixed flame burning rate measurements.The air flow was 20.7 I/m, and the agents tested were CHF3, C2F6, C2HF5, C3F8, C3HF7, at flowcorresponding to 50 % and 90 ?io of the extinction concentration.
10.7.3 Premixed Flame Tests for HF. For the premixed flame tests of HF formation the samenozzle burner as in the burning velocity measurements is used. The burner consisted of a Mache-He-
bra (1941) nozzle burner 27 cm long, with an inner diameter of 22 mm and wall thickness of 1.5 mm.A contraction at the top to a nozzle diameter of 1.02 (+/- 0.005 cm) occurs over a length of 3 cm.The burner tube is located concentrically in a 40 cm tall quartz chimney with an inner diameter of 7.6cm, with contraction at the top to a 3 cm diameter. The burner produces conical flames with a heightof 1.3 cm and base of 1.0 cm diameter. Air flows in the annular region at 25 l/m, while the reactantgas stream to the burner is about 2 to 5 I/m, depending upon the agent concentration and equivalenceratio. The flame height is maintained constant while the flows of oxidizer, fuel, and agent are variedto produce the desired agent concentration and equivalence ratio. The sampling of the product gases isdone at the contraction in the top of the chimney as described below.. The gas handling system for thepremixed burner is also described below. Methane (Matheson UHP) and propane are used as the
fuels, and CHF3, C2F6, C2HF5, C3F8, C3HF7, and CF4 are used as the agents.
10.7.4 HF Sampling Technique. A wet chemistry technique is used to measure the HF concentra-tions in the exhaust gases from the co-flow diffusion flames and the premixed flames. A quartz probe(6 mm O. D., 4 mm I.D., 20 cm long) is centered in the neck and extracts a measured fraction of theproduct gases (approximately 0.5 to 5.5 %). A vacuum pump draws the gases through polyethylenesample lines to one 250 ml polyethylene impinger and one 25 ml impinger filled with water whichtrap the acid gases. The second impinger was found to collect less than one percent of the total HF,but was retained for most of the experiments nonetheless. Desiccant-packed tubes or a cold finger dry
the sample gas upstream of a calibrated rotameter. The steady-state experiments had sample gas flowrates of about 200 ml/m. To increase the quantity of HF collected in the short, transient exp@iments,
the sample flow was increased to about 1.2 l/m. The sample flow is established for a total collectiontime of one to four minutes. The quartz probe and sample lines were washed with water which wasreturned to the impinger. The sample was tested for F- using ion-selective electrodes (Orion model96-09). It should be noted that since C0F2 is known to hydrolyze rapidly in the Presence of water>this technique for acid gas measurement includes F- from both HF and COF2. TO reduce the effectsof sampling losses reported by other investigators, a quartz probe and polyethylene sample lines wereused, the distance from the chimney top to the bubbler was kept small (- 10 cm) and the sample lineswere washed with the bubbler fluid immediately after the sample was collected.
10.7.5 Transient State Measurements, The experimental arrangement for the transient experimentsis identical to the steady-state propane-air diffusion flame experiments described above. In the theseexperiments, the agent is added to the air flow at a concentration increasing linearly in time up to avalue 25 ?ZOabove the cup burner extinction concentration. The concentration ramp, implemented
through computer control of the mass flow controllers, allowed effective ramp times from 5 seconds toany number of minutes. The amount of HF formed is lower than in the steady-state experiments dueto the short time for interaction prior to flame extinguishment. To insure that a sufficient amount of
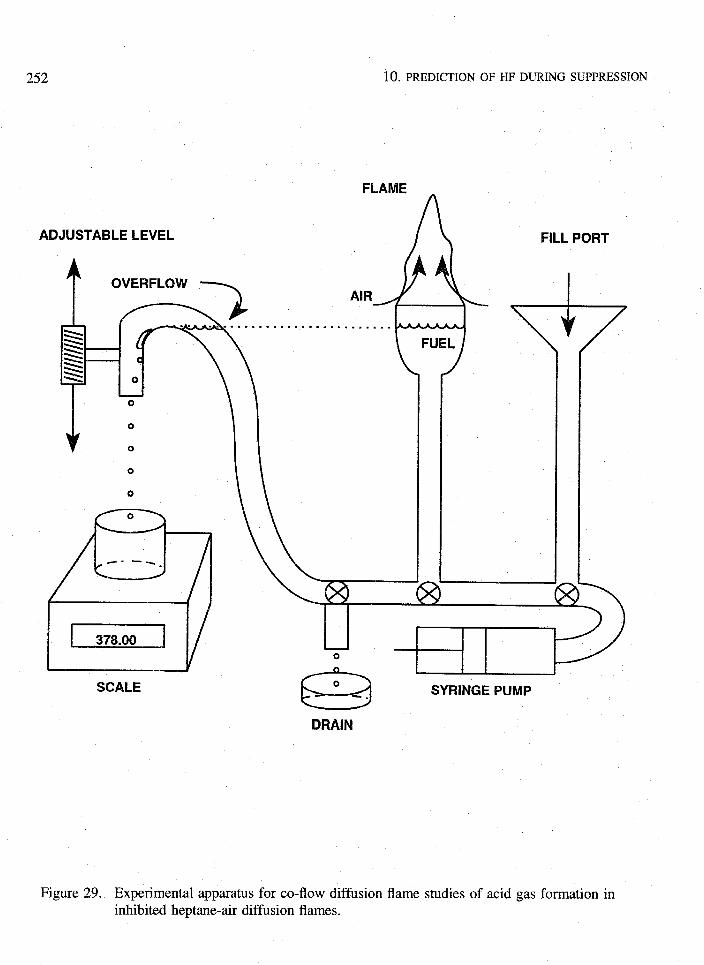
252 10. PREDICTIONOF HF DURINGSUPPRESSION
ADJUSTABLE LEVEL
FLAME
A
OVERFLOWAIR
&
. . . . . . . . . . . . . . . . . . . .
~ FUEL:
if
o
0
0
0
0
SCALE
\J
FILL PORT
=+-7
#&eo
SYRINGE PUMP-.
DRAIN
Figure 29. Experimental apparatus for co-flow diffusion flame studies of acid gas formation ininhibited heptane-air diffusion flames.

1(). PREDICTIONOF HF DURINGSUPPRESSION 253
HF is collected, a higher sample gas flow is used (about 7 % of the total flow), and a second bubblerensures that no HF is untrapped. In the experimental procedure, the gas sample flow is started, theinhibitor is ramped up in concentration to 125 $’ZOof the flame extinguishment concentration and theflame extinguished. The sample flow continues 30 seconds after extinguishment and is stopped. Thesample probe consequently extracts a measured fraction of the total product gas flow, from which thetotai HF formed is determined.
10.8 Results
10.8.1 Steady-state - Premixed Flames.flames are presented in Figures 30 and 31.
The amounts of HF measured in steady-state premixedFigure 30 shows the results for the inhibitors CF., CHF~,
C2F6, and CHZF2 in premixed methane-air flames, and Figure 3 ~ shows the results for the sP~cies “C2HF5, C3F8 and C3HF7 for propane-air flames. In these figures, the experimental results are
indicated by the points, while the solid lines show the predicted HF mole fractions based on the resultsof equilibrium calculations. The quantities of HF produced per mole of fuel are plotted versus agent
mole fraction in the reactant stream. An increase in the inhibitor mole fraction produces a linearincrease in the HF generation, and there is a linear dependence on the number of fluorine atoms in theinhibitor molecule. The flames with propane show higher HF production rates per mole of fuel thando the methane-air flames, since combustion of one mole of propane requires 24 moles of air,compared to about 10 moles for methane. Since the inhibitor mole fraction is based on the sum of airand inhibitor, the resulting molar flow of inhibitor per mole of fuel is greater in the propane flames ascompared to the methane flames.
For the present flames, the hydrogen to fluorine ratio is always greater than one, so that fluorinein the inhibitor molecule essential y appears only as HF in the product gases. As described above inthe discussion of premixed flame modeling, the inhibitor molecule is consumed rapidly and completelyin these flames to form HF. Thus, for these flames, the predicted HF molar flow in the product gasescan be predicted solely from the inhibitor molar flow rate in the reactant stream and the number offluorine atoms in the inhibitor. As the figures show, the assumption of complete inhibitor reaction toHF provides a predicted HF generation rate in good agreement with the results of experiments for allof these agents except CF4. It is interesting to note that we were not able to produce stable flames atinhibitor loadings near or above the point of unity hydrogen to fluorine concentration in the reactantstream for any agent.
Figure 32 shows the dependence of the quantity of FIF generated from C2F6 in the premixedmethane/air flame versus equivalence ratio of the mixture. Over this narrow range of equivalence
ratio, the predicted HF is in good agreement with the measured values.AS Figure 30 shows, the amount of I-IF formed in CF4-inhibited premixed methane-air flames iS
less than half that predicted by equilibrium thermodynamics, and decreases as the inhibitor loadingincreases. In order to investigate this further, experiments were performed with premixed methane-airflames in which the oxygen mole fraction was changed to vary the peak final temperature of theflame.
Figure 33 shows the fractional conversion of CF4 to HF (and COF2) as a function of thecalculated final flame temperature. As indicated, a change of final temperature of only a few hundred
K produces a change in the fractional conversion of CF4 from about 15 to 70 %. ConsequentlY~ thistype of behavior was investigated numerically in premixed methane-air flames for the other inhibitors,but a strong temperature dependence for the rate of inhibitor decomposition was not observed. The

254
3
2.5
2
1.5
1
0.5
0
1(). PREDICTIONOF HF DURINGSUPPRESSION
Premixed CHJAir
Predicted —CF,H
%
C,F, R
/
o 0.01 0.02 0.03 0.04 0.05 0.06 0.07 0.08
inhibitor Mole Fraction
Figure 30. Measured and predictedCF2H2.
methane-air flameS with CzF(j! CF4, CHF3,
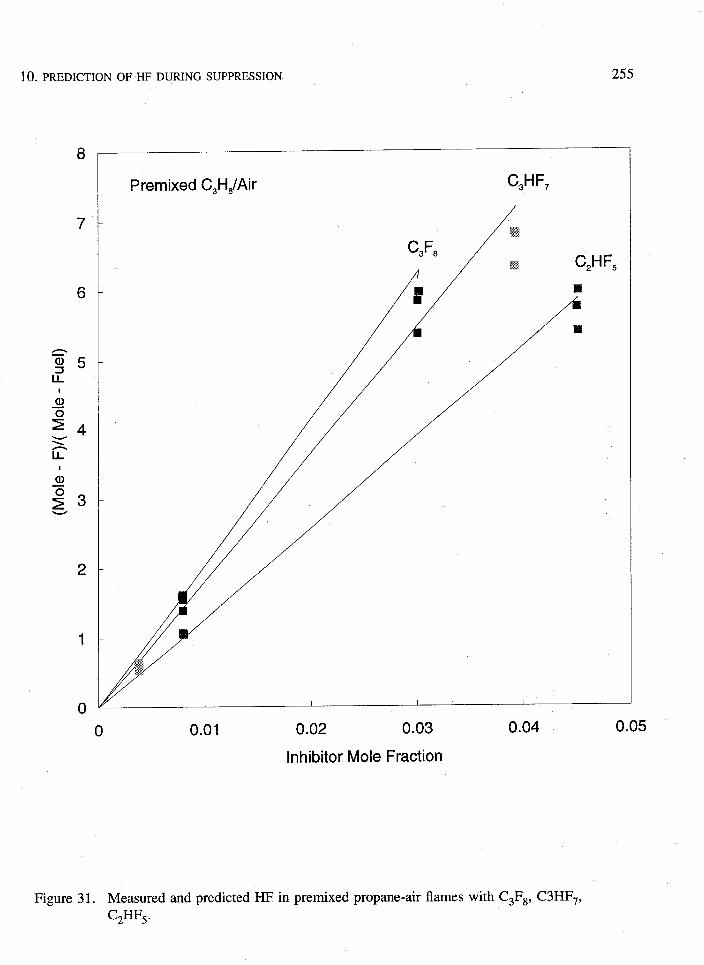
10.
8
7
6
1
1
a)
g3
2
1
0
0
OF HF DURINGSUPPRESSION
Premixed C, HJAir C3HF,
0.01 0.02 0.03 0.04 0.05
Inhibitor Mole Fraction
Figure 31. Measured and predicted HF in premixed propane-air flames with C3F8, C3HF7,C2HF5.

256
co.—u)
$>c
s-i3s0.-5(SJ
k
1.00
0,90
0.80
0.70
0,60
0.50
0.40
0.30
0.20
0.10
0.00
10. PREDICTIONOF HF DURINGSUPPRESSION
CF, in a Premixed CH,/Air Flame
2,000 2,100 2,200 2,300 2,400
Calculated Adiabatic Flame Temperature (K)
Figure 32. Fractional conversion of fluorine in CF4 to HF in a premixedfunction of the calculated adiabatic flame temperature.
methane-air flame as a

10. PREDICTIONOF HF DURINGSUPPRESSION 257
possibility of the effect of temperature should be kept in mind when extending the results of this studyto other conditions.
It has been shown that for all of the hydrofluorocarbons tested in premixed flames, includingCHZF2, CF3H, CZHF5, and C3HF7, the agent completely decomposed and formed species whichappeared as fluoride ion in the bubbler (i. e., either HF or COF2). This indicates that kinetic limitationsare not important for these agents in these flames, and that the assumption of chemical equilibriumprovides estimates of HF formation that are consistent with the experimental results. This behavior is
also observed for the perfluorinated agents CZFGand C3F8. It is important to note that all of these
flames had fluorine to hydrogen ratios in the flame greater than unity. Indeed, it was not possible, ineither the nozzle burner (which has narrow stability limits) or in a premixed, water-cooled, flat-flameIvlcKenna burner (which has wide stability limits), to stabilize any premixed flame at hydrogen tofluorine ratios of one or less. Thus it appears that at agent loadings were premixed flames burn, thereis nearly complete destruction of the agent and subsequent formation of HF or COF2.
10.8.2 Steady-state - Gaseous Diffusion Flames, In the propane-air diffusion flames, the acid gasesproduced are measured at inhibitor concentrations of 50 % and 90 % of the concentration of inhibitorfound to extinguish the flame when the inhibitor is added to the co-flowing air stream in the cup
burner and jet burners. Table 2 lists the extinction concentrations for each agent for inhibitor added to
the air stream of both burners. As the table indicates, the jet burner flame typically requires about50 % less inhibitor in the air stream to extinguish the flame than the cup burner, even for identicalfuel and air flows, although there are notable exceptions: CF3Br, which requires about one fifth asmuch inhibitor in the jet burner than in the cup burner, and c2H2F4 and the CH2F2/c2H2F4 mixturewhich had nearly the same extinction concentrations. In addition to providing the necessary extinctionconditions for specification of inhibitor flows at 50 ‘%0and 90 % of extinction, these results alsodemonstrate the sensitivity of the extinction conditions to the burner geometry.
The HF production in steady-state propane air diffusion flames was measured for the agents C2F6,
c3F8, C4F ~~, C4F8, C2HF5, C3HF7, C2H2F4, c2HclF4, C~H2F6, cF2H2/C2ElF5, CI-IF2C1, CF3Br, andCFJ; the results are presented in Figures 34 to 46, respectively, The symbols represent the experi-mental data, while the lines marked F and H represent estimates of the fluxes of fluorine and hydrogeninto the reaction zone based on the stoichiometric model described above.
Figure 39, for example, shows the measured and estimated HF production rates in a propane-airdiffusion flame for C2F6 in the cup and jet burners. The curve labeled F’ in Figure 39 is the
maximum fluoride atom molar flux into the reaction sheet of the diffusion flame calculated using thestoichiometric model described above. The curve labeled F in Figure 39 is the fluoride molar flux
when the diffusion rate of the inhibitor relative to oxygen is not modified to account for preferentialdiffusion of oxygen. These unprimed curves are expected to more closely describe near turbulentmixing as occurs in the jet burner.
Qualitatively, the curves F and F’ are seen to increase with increasing inhibitor concentration inair, and the molar flux of inhibitor into the reaction zone is lower when a lower rate of diffusion isused for the inhibitor. The curves labeled H and W (coincident for C2F6) show the estimatedhydrogen atom flux into the reaction zone as a function of inhibitor concentration in the air stream.Since this inhibitor does not contain hydrogen, all of the hydrogen is from the propane, and increasinginhibitor in the air stream does not increase the hydrogen flux into the flame. One would expect thatthe HF production rate would not be greater than the estimated flux of F or H into the reaction zone.For this inhibitor, the flame appears to be hydrogen limited above about S YO c’#6 in the air stream;
however, when there is not enough hydrogen, the most stable product is COF2, which is known torapidly hydrolyze in the presence of water, and would also appear as F- in the bubbler. Consequently,

258 10. PREDICTIONOF HF DURINGSUPPRESSION
0.18
0.16
0.14
0,.12
0.06
0.04
0.02
0.00
Premixed C, F$CH4/Air mI
1 I !
0.8 0.9 1.0 1.1 1.2
Equivalence Ratio
Figure 33. Measured and calculated HF production from C2F6 in a premixed methane-air flame
for$=O.9, l. O, and 1.1.
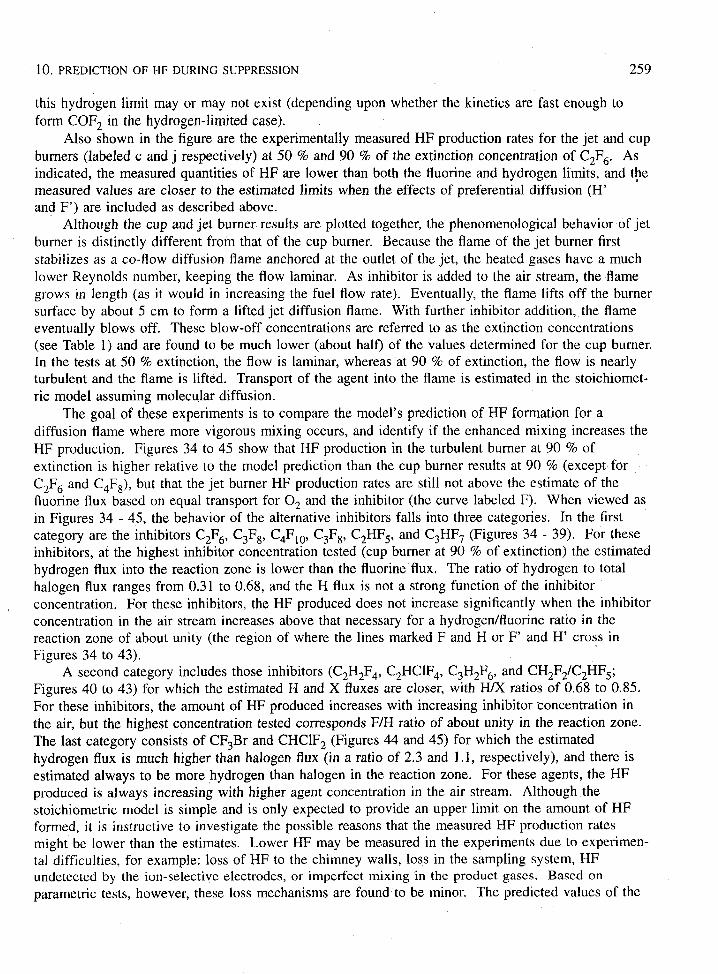
10. PREDICTIONOF HF DURINGSUPPRESSION 259
this hydrogen limit may or may not exist (depending upon whether the kinetics are fast enough toform COF2 in the hydrogen-limited case).
Also shown in the figure are the experimentally measured HF production rates for the jet and cupburners (Iabeled c and j respectively) at 50 % and 90 % of the extinction concentration of CZF6. ASindicated, the measured quantities of HF are lower than both the fluorine and hydrogen limits, and t~emeasured values are closer to the estimated limits when the effects of preferential diffusion (H’and F’) are included as described above.
Although the cup and jet burner results are plotted together, the phenomenological behavior of jet
burner is distinctly different from that of the cup burner. Because the flame of the jet burner firststabilizes as a co-flow diffusion flame anchored at the outlet of the jet, the heated gases have a muchlower Reynolds number, keeping the flow laminar. As inhibitor is added to the air stream, the flamegrows in length (as it would in increasing the fuel flow rate). Eventually, the flame lifts off the burnersurface by about 5 cm to form a lifted jet diffusion flame. With further inhibitor addition, the flameeventually blows off. These blow-off concentrations are referred to as the extinction concentrations(see Table 1) and are found to be much lower (about half,) of the values determined for the cup burner.In the tests at 50 % extinction, the flow is laminar, whereas at 90 % of extinction, the flow is nearlyturbulent and the flame is lifted. Transport of the agent into the flame is estimated in the stoichiomet-ric model assuming molecular diffusion.
The goal of these experiments is to compare the model’s prediction of HF formation for a
diffusion flame where more vigorous mixing occurs, and identify if the enhanced mixing increases theHF production. Figures 34 to 45 show that HF production in the turbulent burner at 90 % ofextinction is higher relative to the model prediction than the cup burner results at 90 970(except for
C2F6 and CdF8), but that the jet burner HF production rates are still not above the estimate of thefluorine flux based on equal transport for Oz and the inhibitor (the curve labeled F). When viewed asin Figures 34 -45, the behavior of the alternative inhibitors falls into three categories. In the firstcategory are the inhibitors CLF& C3F8, C4F10, C3F8, C2HF5, and C3HF7 (Figures 34- 39). For theseinhibitors, at the highest inhibitor concentration tested (cup burner at 90 Yoof extinction) the estimatedhydrogen flux into the reaction zone is lower than the fluorine flux. The ratio of hydrogen to totalhalogen flux ranges from 0.31 to 0.68, and the H flux is not a strong function of the inhibitorconcentration. For these inhibitors, the HF produced does not increase significantly when the inhibitorconcentration in the air stream increases above that necessary for a hydrogen/fluorine ratio in thereaction zone of about unity (the region of where the lines marked F and H or F’ and H’ cross inFigures 34 to 43).
A second category includes those inhibitors (C2H2F4, C2HC1F4, C3H2F6, and CH2F2/c2HF5;Figures 40 to 43) for which the estimated H and X fluxes are closer, with H/X ratios of 0.68 to 0.85.Fo~ these inhibitors, the amount of HF produced increases with increasing inhibitor concentration inthe air, but the highest concentration tested corresponds F/H ratio of about unity in the reaction zone.The last category consists of CF3Br and CHC1F2 (Figures 44 and 45) for which the estimated
hydrogen flux is much higher than halogen flux (in a ratio of 2.3 and 1.1, respectively), and there isestimated always to be more ,hydrogen than halogen in the reaction zone. For these agents, the HFproduced is always increasing with higher agent concentration in the air stream. Although thestoichiometric model is simple and is only expected to provide an upper limit on the amount of HFformed, it is instructive to investigate the possible reasons that the measured HF production ratesmight be lower than the estimates. Lower HF may be measured in the experiments due to experimen-tal difficulties, for example: loss of HF to the chimney walls, loss in the sampling system, HFundetected by the ion-selective electrodes, or imperfect mixing in the product gases. Based onparametric tests, however, these loss mechanisms are found to be minor. The predicted values of the
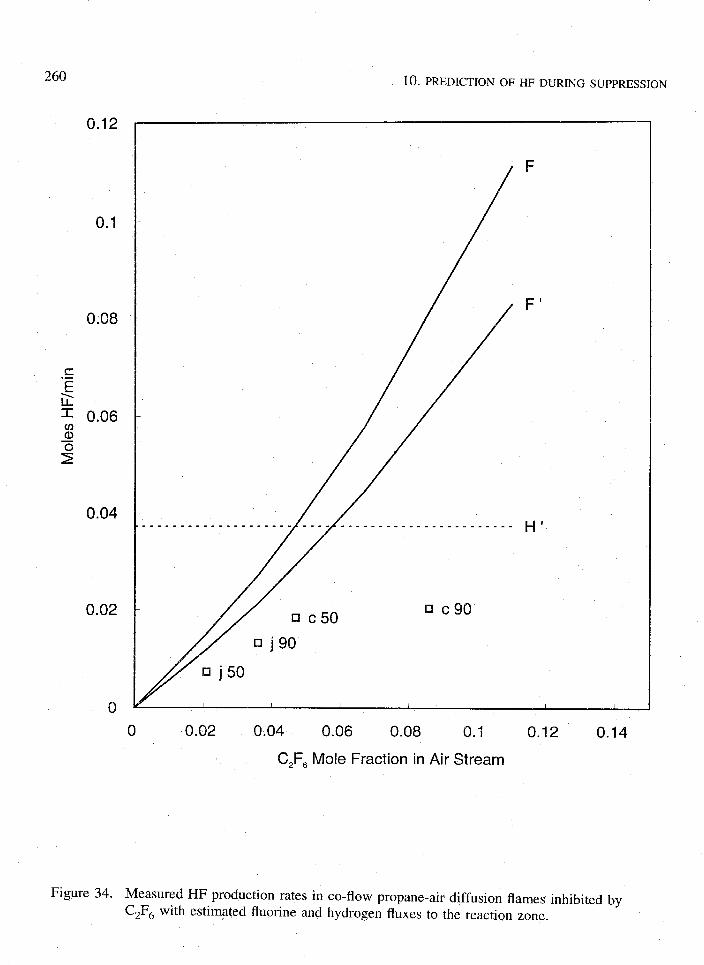
260 I (). PREDICTIONOF HF DURINGSUPPRESSION
0.12
0.1
0:08
0.06
0.04
0.02
0
F
F’
~,
1 I 1 I I 1 1
0 0.02 0.04 0.06 0.08 0.1 0.12 0.14
C2F6Mole Fraction in Air Stream
Figure 34. Measured HF production rates in co-flow propane-air diffusion flames inhibited byC2F6 with estimated fluorine and hydrogen fluxes to the reaction zone.
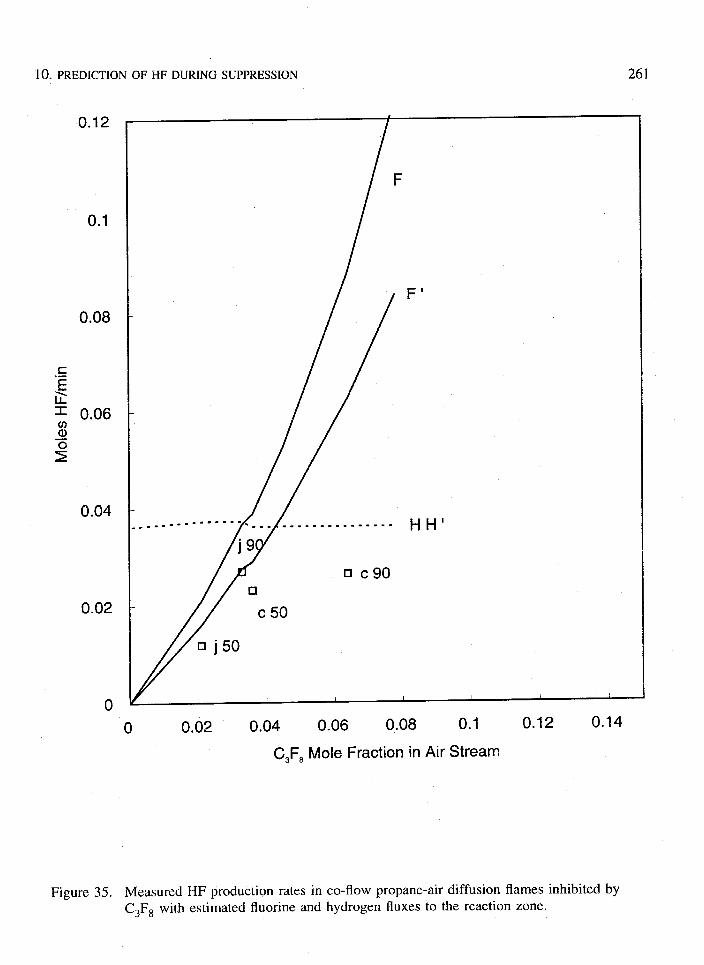
10. PREDICTIONOF HF DURINGSUPPRESSION 261
0.12
0.1
0.08
0.04
0.02
0
0
Figure 35.
/
. . ..- . . . . . . . . .
1 I
F’
HH’
❑ cgo
0.02 0.04 0.06 0.08 0.1 0.12 0.14
C,F, Mole Fraction in Air Stream
Measured HF production rates in co-flow propane-air diffusion flames inhibited byC3F8 with estimated fluorine and hydrogen fluxes to the reaction zone.

262
0.12
0.1
0.08
0,06
0.04
0.02
0
0
Figure 36.
1(). PREDICTIONOF HF DURINGSUPPRESSION
0.02 0.04 0.06 0.08
C,FIOMole Fraction
0.1 0.12 0.14
Measured HF production rates in co-flow propane-air diffusion flames inhibited byC4F10 with estimated fluorine and hydrogen fluxes to the reaction zone.
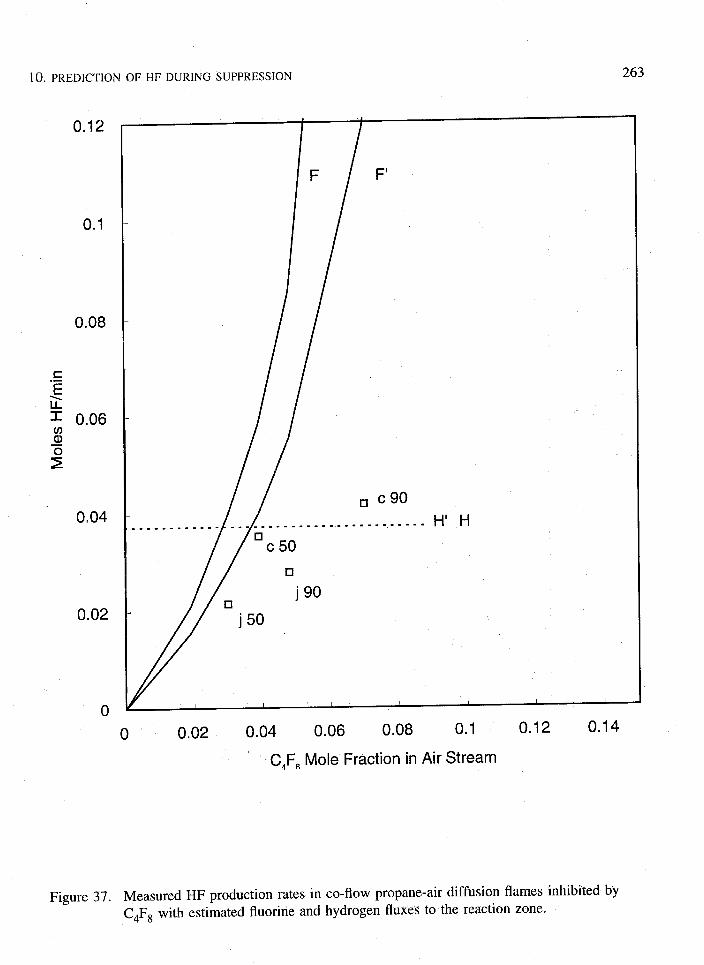
1~. PREDICTIONOF HF DURINGSUPPRESSION 263
0.12
0.1
0.08
0.06
0.04
0.02
0
Figure 37
p
I
F
o 0.02 0.04 0.06 0.08 0.1 0.12 0.14
C,F, Mole Fraction in Air Stream
Measured HF production rates in co-flow propane-air diffusion flames inhibited byC4F8 with estimated fluorine and hydrogen fluxes to the reaction zone.

264
0.12
0.1
0.08
0.06
0.04
0.02
0
10. PREDICTIONOF HF DURINGSUPPRESSION
~,
H
H
1
0 0.02 0,04 0.06 0.08 0.1 0.12 0.14
C2HF5Mole Fraction in Air Stream
Figure 38. Measured HF production rates in co-flow propane-air diffusion flames inhibited byCZHF5 with estimated fluorine and hydrogen fluxes to the reaction zone.

PREDICTIONOF HF DURINGSUPPRESSION 265
0.12
0.1
0.08
0.06
0.04
0.02
0
F
F,
H
H,
0 0.02 0.04 0.06 0.08 0.1
C,HF, Mole Fraction in Air Stream
0.12 0.14
Figure 39. Measured HF production rates in co-flow propane-air diffusion flames inhibited byC3HF7 with estimated fluorine and hydrogen fluxes tO the reaction zone.
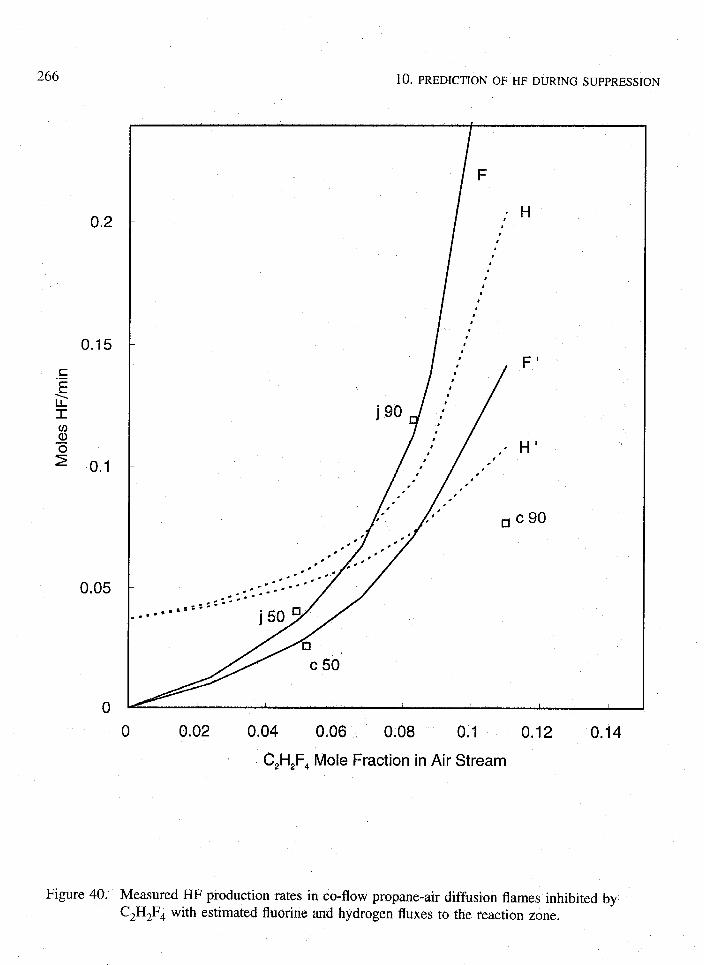
1(). PREDICTIONOF HF DURINGSUPPRESSION
0.2
0.15
0.1
0.05
0
0 0,02 0.04 0.06 0.08 0.1
C2H2F4Mole Fraction in Air Stream
0.12 0.14
Figure 40.
IF
;H,
/:
I‘
,
,
,
,
/
,#,,#
.,’
.’4“
.’*. .#...”.”..-. .. . ..Z::..:-. . ...-”
Measured HF production rates in co-flow propane-air diffusion flames inhibited by
C2H2F4 with estimated fluorine and hydrogen fluxes to the reaction zone.

10. PREDICTIONOF HF DURINGSUPPRESSION 267
0.12
0.1
0.08
s.-Ez~ 0.06;
s
0.04
0.02
0
Figure 41.
0
F
. . .~.
. . . . . .-: ---: :.~z:::. . . ..-
0.02 0.04 0.06 0.08 0.1 0.12 0.14
C2HCIF4 Mole Fraction in Air Stream
Measured HF production rates in co-flow propane-air diffusion flames inhibited by
C2HC1F4 with estimated fluorine and hydrogen fluxes to the reaction zone.
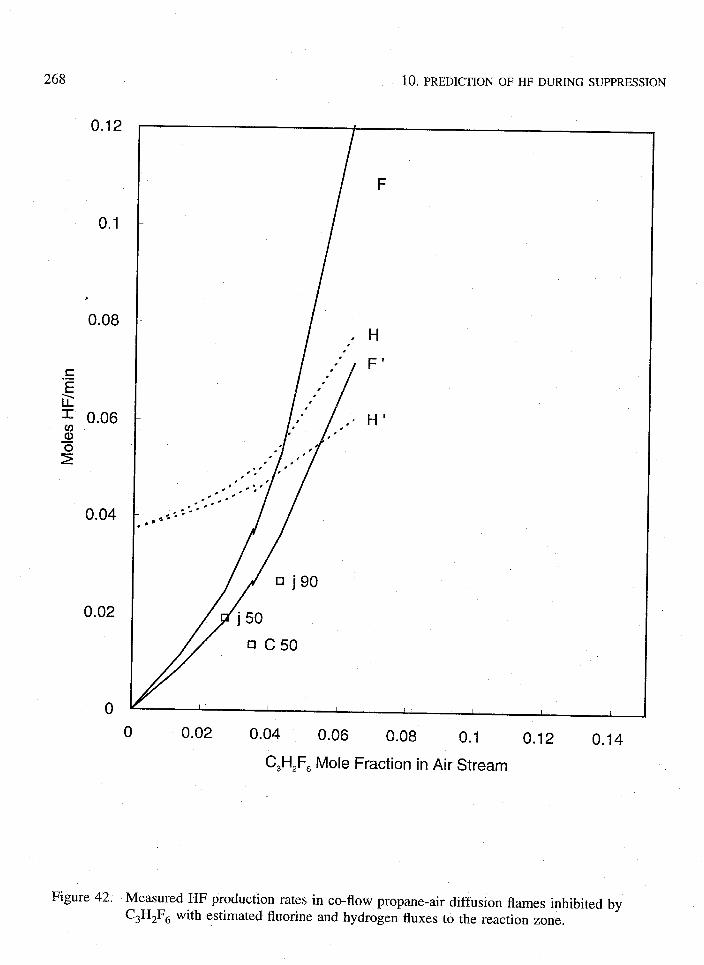
268
0.12
0.1
.
0.08
0.06
0.04
0.02
0
Figure 42.
1(). PREDICTIONOF HF DURINGSUPPRESSION
/
o 0.02 0.04 0.06
C3H2F6Mole
F
H
H,
t 1 1 t
0.08 0.1 0,12 0.14
Fraction in Air Stream
Measured HF production rates in co-flow propane-air diffusion flames inhibited byC3H2F6 with estimated fluorine and hydrogen fluxes to the reaction zone.

10. PREDICTIONOF HF DURINGSUPPRESSION 269
,.,,
0.2
0.15
0.1
0.05
0
0 0.02 0.04 0.06 0.08 0.1 0.12 0.14
CF2H,-C2HF, Mole Fraction in Air Stream
Measured HF production rates in co-flow propane-air diffusion flames inhibited byCF2H2-C2HF5 with estimated fluorine and hydrogen fluxes to the reaction ZOne.
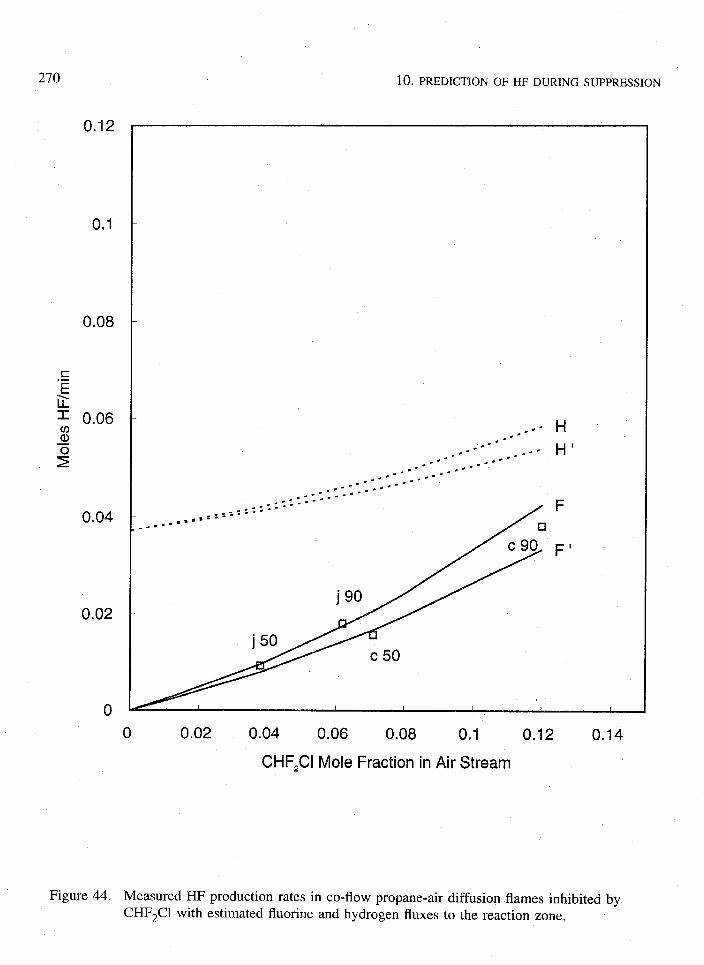
270 1(). PREDICTIONOF HF DURINGSUPPRESSION
0.12
0.1
0.08
0.06
0.04
0.02
0
Figure 44.
. . H..0--.. . .,. . ..” H’-.. ..-.,.. -, ..”-... . . . . . .. .. ---- -. .
. . #------: ”...: ::-: :.,= ::=: :. . . . . . . .
j 90
j 50
1
0 0.02 0.04 0.06 0.08 0.1 0.12 0,14
CHF,CI Mole Fraction in Air Stream
Measured HF production rates in co-flow propane-air diffusion flames inhibited byCHF#21 with estimated fluorine and hydrogen fluxes to the reaction zone.

10. PREDICTIONOF HF DURINGSUPPRESSION 271
0.04
0.035
0.03
0.025
c.-E$
0.02&i
2
0.015
0.01
0.005
“o
. . . . . . . . . . . . ---- ------- - . . ----- ------- ------- . . . . . H’
o 0.01 0.02 0.03
CF,Br Mole Fraction in Air Stream
0.04 0.05
Figure 45. Measured HFproduction rates inco-flow propane-air diffusion flames inhibited byCF3Br with estimated fluorine and hydrogen fluxes to the reaction zone.

272 1(). PREDICTIONOF HF DURINGSUPPRESSION
Table 2. Extinction conditions for halon alternatives added to the air stream of co-flowpropane-air cup burner and jet burner flames
Extinction Concentration in Air (mole percent)Inhibitor
jet CUD
C3F8CAF1~CqF8C2HF~
C3HFYC2H2F4
C2HC1F4C3H2F6CH2Fz/CzHF5CF3BrCH-C1F9
3.83.83.25,16.24,2
9.54.24,0
15.50.86,7
9.47.55.07.6
10,27.6
11,1
8,67.2
15.24.3
13,8
HF production do not include chemical kinetic limitations; this is believed to the likely source of thediscrepancy,
The experimental results are typically within 30 % of the prediction for the hydrogenatedfluorocarbons, which is good considering the simplicity of the model, Perfluorinated agents produceHF at rates significantly less, up to 50 %, than predicted based on equilibrium thermodynamics. Theseagents are believed to react more slowly in the flame. A detailed understanding of the apparentchemical kinetic limitations to HF formation for the perfluorinated agents at all concentrations as wellas for hydrofluorocarbons at high fluorine loading should be possible using a recently developedchemical kinetic mechanism for fluorine inhibition of hydrocarbon flames (Burgess et al., 1994)together with a diffusion flame model. For the present analyses, however, the predicted acid gasformation in inhibited flames is based on equilibrium thermodynamics assuming that HF (not COF2) is
the source.The measured HF for CF31 is shown in Figure 46. For CF3Br, the experimental results are about
30 % lower than the prediction, although both are significantly lower than for the HFCS, On the otherhand, CF31 makes about twice as much HF as is predicted by the model (which was not developed forCF31), or about three times as much HF as CF3Br in these diffusion flames. The reasons for this isbelieved to be due to the relative weakness of the C-I bond in CF31. It is likely that CF31 enters thehot region near or above the flame and undergoes thermal decomposition much more easily than theother agents tested, so that the net amount of HF formed is higher (and higher than predicted from themodel which assumes no additional decomposition in the region above the flame),
10.8.3 Steady-state - Liquid Diffusion Flames. For the liquid-fueled cup burner experiments theconsumption rate of the fuel is found to be a strong function of the inhibition concentration. Figure47 shows the measured burning rate (g/s) for heptane as a function of the C2HF5 mole fraction in theair stream. The measured HF formation rates for liquid cup burner flames of heptane are shown inFigures 48 to 51 for C2HF5, C3HF7, C2HZF4, and C3F8. As in Figures 34 to 46, the solid lines

10. PREDICTIONOF HF DURINGSUPPRESSION
0.04
0.03
0.02
0.01
0
. . . . . . . . . . . . . . . . . . . . . . . . . . -——- -— -- —-—— . ----- . . H
o0
0 (-)
0 0.01 0.02 0.03 0.04 0,05
CFJ Mole Fraction in Air Stream
Figure 46. Measured HF production rates in co-flow propane-air diffusion flames inhibited byCF31 with estimated fluorine and hydrogen fluxes to the reaction zone.

274 10. PREDICTIONOF HF DURINGSUPPRESSION
indicate the predicted flux of F and H into the flame. The measured HF production rate for these
steady-state flames is within 1690 of the lower of the F or H flux for all of the inhibitors exceptC2HF5. For this agent, the measured HF production rate is about 30 % higher than the estimatedhydrogen flux, and is well predicted by the fluorine flux. The reasons for this discrepancy are unclear,
but may be related to details of the reaction mechanism for this particular agent and fuel, It isimportant to emphasize that the “hydrogen limit” is really a kinetic argument, As illustrated in Figure27, when there is not enough hydrogen to form HF as an equilibrium product, the thermodynamically-favored product is COF2. This species also appears in the bubbler as fluoride ion, and is thusindistinguishable from HF. Thus, when the hydrogen to fluorine ratio drops below unity, the argumentis that the kinetics slow down such that the stages of inhibitor consumption which form either COF2or HF are impeded. Given the premixed modeling results described above, as well as the experimentalresults for inhibitor addition to premixed flames, this interpretation seems appropriate.
Nonetheless, it is remarkable that the rather simple stoichiometric model is still able, to predict theHF formation within 30 % for this liquid pool flame when the agent is present at 90 % of theextinction value and the heat feedback and kinetics are affected to such an extent that the burning rateis reduced by about a factor of 2.5. This lends support for the basic assumptions in the model that theproducts are controlled primarily by the quantities of hydrogen and fluorine in the flame, and thatthese are controlled primarily by the fuel type and consumption rate and the inhibitor type and molefraction in the air stream. The final assumption of equal characteristic flame height for both fuel andinhibitor consumption also appears to be good.
10.8.4 Transient-state - Gaseous Diffusion Flames. As described above, HF formation in thepropane-air cup burner flames was also measured when the inhibitor was added in a transient fashion,rather than in steady-state, and the flames were extinguished, The concentration of inhibitor variedlinearly from zero to 125 % of the extinction concentration, and the injection rate of inhibitor wasvaried to produce flame-extinguishment times of 5 to 18 seconds. Experiments were conducted for theagents C2HF5, C3HF7, C3F8.
The results are shown in Figures 52-54 respectively, where the total mass of F- produced duringthe extinction event is plotted as a function of the extinction time. Also indicated in the figures arethe predicted HF formed using the stoichiometric model assuming equilibrium products (solid lines),and using the model in which the steady-state HF production rates are determined from empiricallydetermined deviations from full equilibrium based on the steady-state results. As the figures show, in
either case, the model is able to predict the results within the experimental scatter. The uncertainty inFigures 52 to 54 is essentially shown by the experimental variation for similar conditions. Most ofthis is variation is believed to occur from differences in the mixing of product gases with co-flowingair in the chimney prior to sampling. While the degree of mixing varies from run to run, themagnitude of the fluctuations are difficult to specify due to the turbulent nature. The relatively shortexperiment times (only a factor of three of four greater than the mixing times) accentuates theproblem. Unfortunately, signal averaging (which would be achieved through longer experimentaltimes) is not possible as in the steady-state experiments.
10.9 HF Production in Larger Scale Tests
The stoichiometric model developed above from consideration of laboratory flames allows anestimation of the HF generation based on the fuel consumption rate and transport of the agent in theflame. However, the quantities of acid gases formed in a large-scale suppressed fire will depend upon

0,025
0.02
0.015
0,01
0
R125,Heptane
—.. —— .. ......
.......... ....................................... ............... .
o I I I I I I I I
o 0.01 0.02 0.03 0,04 0.05 0.06 0.07 0.08 0,09
concentration of inhibitorN4ul
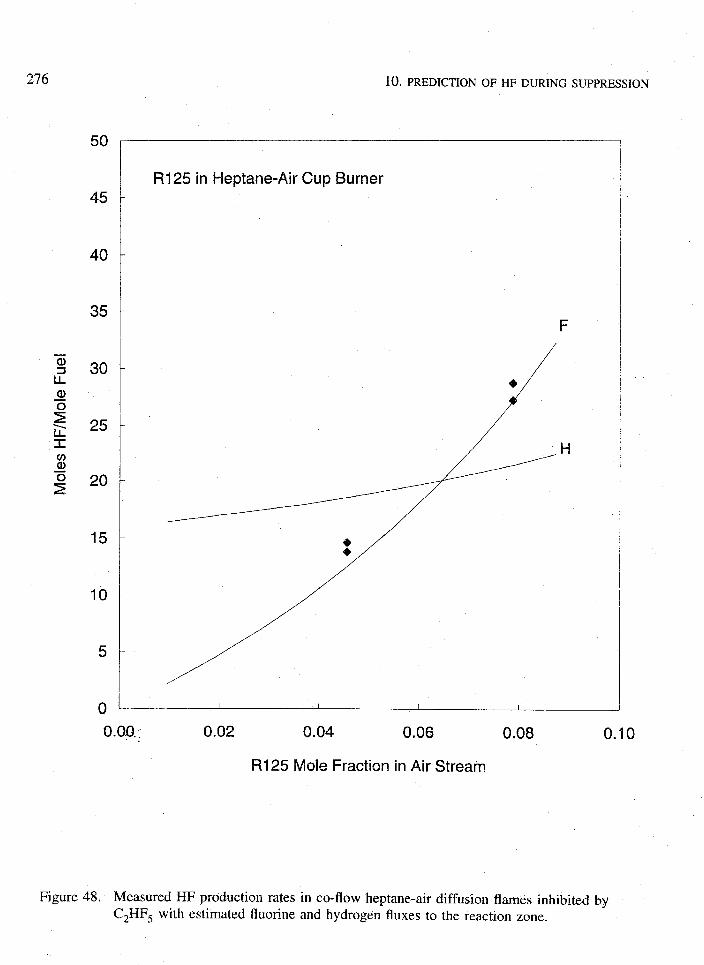
10. PREDICTIONOF HF DURINGSUPPRESSION
50
45
40
35
30
25
20
15
10
5
0
Figure 48.
R125 in Heptane-Air Cup Burner
F
I I I I
0.02 0.04 0.06
RI 25 Mole Fraction in Air Stream
0.08 0.10
Measured HF production rates in co-flow heptane-air diffusion flames inhibited byC2HF5 with estimated fluorine and hydrogen fluxes to the reaction zone.
,,....

]0. PREDICTIONOF HF DURING
03a)5z
50
45
40
35
30
25
20
15
10
5
0
SUPPRESSION
R227 in Heptane-Air Cup Burner
F
H
t●
I I I
0.00
277
0.02 0.04 0.06 0.08 0.10
R227 Mole Fraction in Air Stream
Measured HF production rates in co-flow heptane-air diffusion flames inhibited byC3HF7 with estimated fluorine and hydrogen fluxes to the reaction zone.
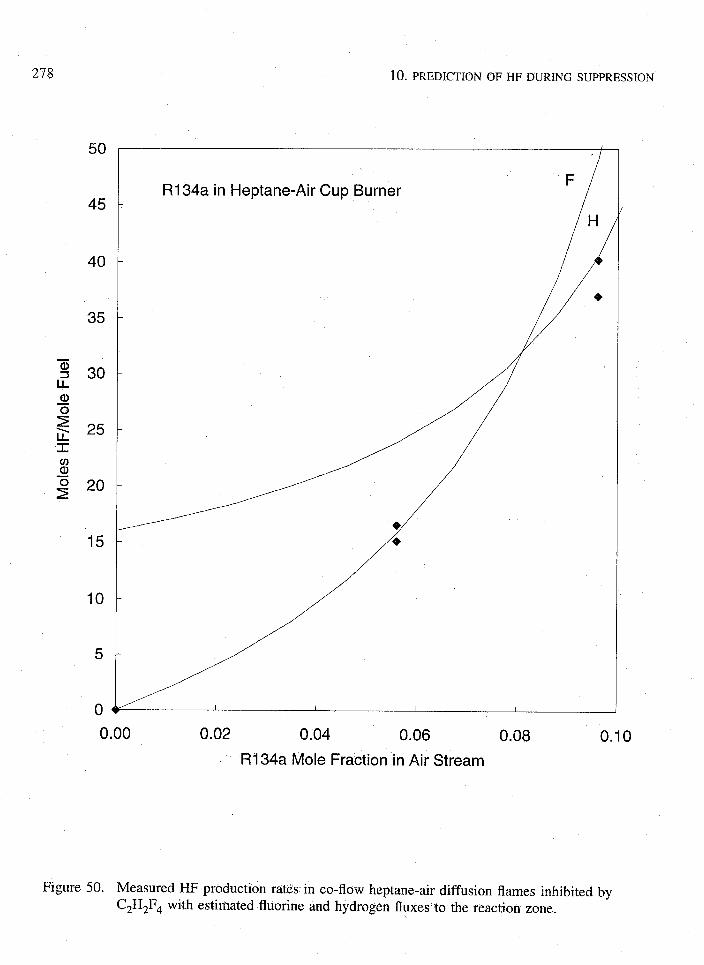
278
50
45
40
35
$ 30
15
10
5
0
Figure 50.
10. PREDICTIONOF HF DURINGSUPPRESSION
I
0.00 0.02 0.04 0.06
RI 34a Mole Fraction in Air Stream
0.08 0.10
Measured HF production rates in co-flow heptane-air diffusion flames inhibited byC2H2F4 with estimated fluorine and hydrogen fluxes to the reaction zone.

OF HF DURINGSUPPRESSION
50
45
40
35
30
25
20
15
10
5
0
—
R218 in Heptane-Air Cup Burner
F
H
I I I I
0.00 0.02 0.04 0.06 0.08 0.10
R218 Mole Fraction in Air Stream
Figure 51. Measured HF production rates in co-flow heptane-air diffusion flames inhibited byC3F8 with estimated fluorine and hydrogen fluxes to the reaction zone.

280 1(). PREDICTIONOF HF DURINGSUPPRESSION
150
100
-5g
u-
cd51-
50
C,HFJC3HJAir
/
f% , “,/,,,,
0
0 5 10 15 20
Extinction Time (s)
Figure 52. Total fluoride produced (points) during suppression of a cup burner propane-airdiffusion flame for various extinction times, together with model predictions (solidline: calculations; dotted line: steady-state results).
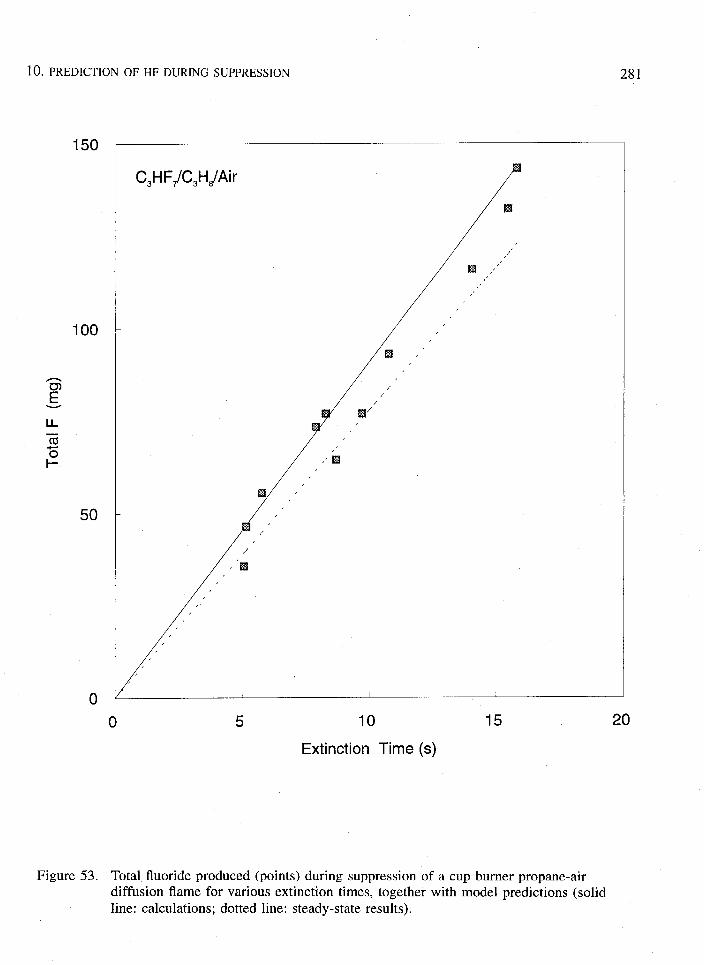
] 0. PREDICTIONOF HF DURINGSUPPRESSION
50
0 5 10
Extinction Time (s)
15
Figure 53. Total fluoride produced (points) during suppression of a cup burner propane-airdiffusion flame for various extinction times, together with model predictions (solidline: calculations; dotted line: steady-state results).
20

282 10. PREDICTIONOF HF DURINGSUPPRESSION
150
100
-5g
50-
0/,
/ H/
//
//
//
/I I
0 5 10 15 20
Extinction Time (s)
Figure 54. Total fluoride produced (points) during suppression of a cup burner propane-airdiffusion flame for various extinction times, together with model predictions (solidline: calculations; dotted line: steady-state results).

10.
the
PREDICTIONOF HF DURINGSUPPRESSION 283
properties of the fire itself, characteristics of the agent delivery system, and fate of the acid gases
after their formation. The fire is essentially the source term for acid gas formation, since high -temperatures are required for rapid agent decomposition. The amount of HF formed will dependupon the fire size, fuel type, and flame type (premixed or diffusion), In addition, ease of extinguish-ment of the fire will be crucial, since for a given inhibitor, different fire types will extinguish atdifferent concentrations for the same inhibitor. An additional feature of larger scale fires is thepresence of hot surfaces. These could provide a high enough local temperature to cause thermaldecomposition of the inhibitor molecule, and possibly result in HF formation, Given the apparent lackof decomposition of the inhibitor in the hot post-combustion region above the laboratory diffusionflames, this is not believe to be a major source for HF formation.
Flame extinguishment ease will be affected by the stabilization mechanisms, the flow field, andsources of re-ignition. The characteristics of the agent delivery system which will affect the quantityof HF formed include the agent type and the concentration at which it extinguishes the flame. Therate of introduction of the agent is important, as are the mixing rates in the protected volume and thedelivery rate to the stabilization region of the flame. Finally, after formation of HF by the fire, thedispersion of the acid gas throughout the protected space and on surfaces will affect its peak andaverage concentrations.
The space volume as compared to the fire size, the ventilation rate, and the presence of surfacesfor acid gas condensation will influence the HF concentrations, which will vary both spatially andtemporally. The rate of air mixing in the protected space may have a large effect on the finalmeasured HF concentrations. Both the characteristics of the agent delivery to the fire and the fate ofthe HF after fire suppression - while greatly affecting the quantities of HF formed, may vary widelyfor different applications. Because this potentially wide variation, they are difficult to specify.Nonetheless, it is of great interest to attempt to predict HF formation in larger-scale tests using thepresent model.
10.9.1 Comparison with Predictions. Extensive intermediate-scale tests of HF production by CF3Brand halon alternatives have been reported by Sheinson et al., (1994). In order to further test thepresent model, we have attempted to predict the HF formed in their experiments. The experimentsconsisted of 0,23 and 1,1 m2 heptane pool fires extinguished by CF3Br, CHF3, C2HF5, and C4F10.The agents were injected at varying rates and to different final inhibitor concentrations in the 56 m3protected space. The reported HF concentrations represent the peak measured values at a single fixedlocation. The results of their experiments (for the 0,23 m2 pools) are shown in Figure 55, whichprovides the measured HF mole fraction (in ppmv) as a function of the tire out time for the fouragents. Although the experimental data represent different agent injection rates and final designconcentrations of inhibitor, we have included all of the data in a single plot.
The large scatter in the experimental results probably occurs from the effects of these additionalparameters. Of these three parameters, injection rate, design concentration, fire-out time, we believethe latter to be most important in determining the HF production and have made it the independentparameter. The results of the stoichiometric model predictions based on achievement of full equilibri-um are given by the solid line, Each of the four lines in the figure refers to the predicted HF for one
of the agents CF3Br, CHF3, C2HF5, and C4F10; the symbol at the end of the line serves to identify theline with the proper data. In these calculations, the model predicts the total mass of HF produced. Inorder to allow a comparison, it is necessary to assume a spatial distribution of HF. Although therewill be gradients of HF concentration in the room, uniform distribution has been assumed. As thefigure shows, the predicted HF concentration agrees well with the experimental results. Having
gained confidence in the ability of the model to predict some experimental results, we now proceed toinvestigate the effect of several parameters on HF production in suppressed fires.

10. PREDICTIONOF HF DURINGSUPPRESSION
30000
10000
–X– C4F1 O
A CHF3
o 1301
%%C3HF7
$%
I
/
25 30 35 40 45“ime (s)
o
0 5 10 15 20Fire Out’
Figure 55. Experimental data of Sheinson et al. for intermediate-scale tests of HF production inheptane pool fires, with the model predictions for cF3Br, CF3H, C2HF5, and C4F10.
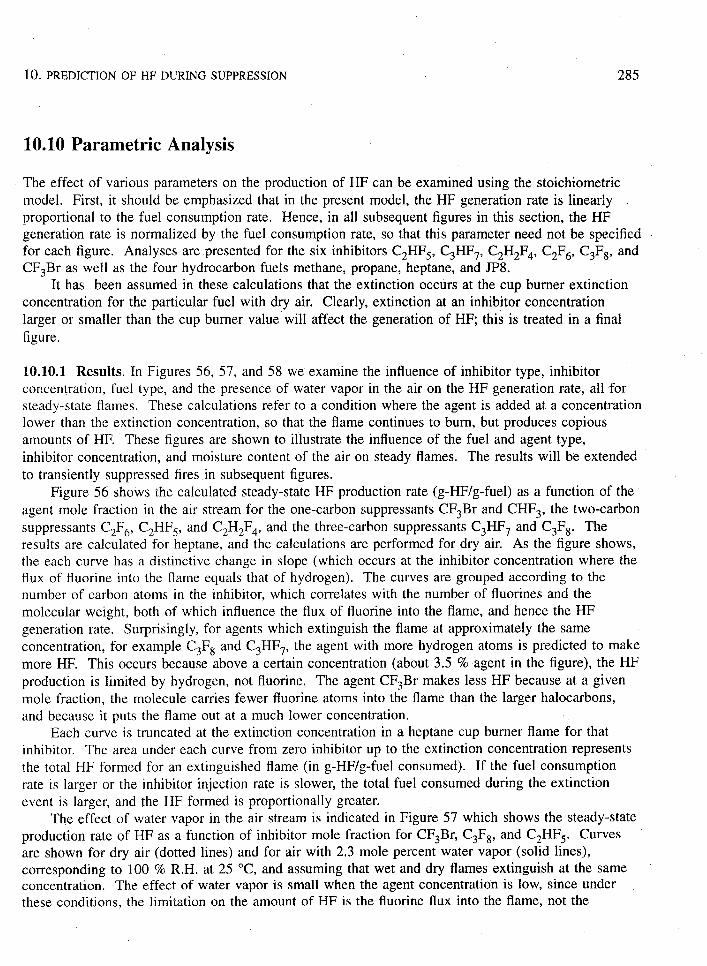
10. PREDICTIONOF HF DURINGSUPPRESSION 285
10.10 Parametric Analysis
The effect of various parameters on the production of HF can be examined using the stoichiometricmodel, First, it should be. emphasized that in the present model, the HF generation rate is linearlyproportional to the fuel consumption rate, Hence, in all subsequent figures in this section, the HFgeneration rate is normalized by the fuel consumption rate, so that this parameter need not be specifiedfor each figure. Analyses are presented for the six inhibitors CZHF5, C3HF7, C2H2F4, CZF6, C3F8, andCF3Br as well as the four hydrocarbon fuels methane, propane, heptane, and JF’8.
It has been assumed in these calculations that the extinction occurs at the cup burner extinctionconcentration for the particular fuel with dry air, Clearly, extinction at an inhibitor concentrationlarger or smaller than the cup burner value will affect the generation of HF; this is treated in a final
figure,
10.10.1 Results. In Figures 56, 57, and 58 we examine the influence of inhibitor type, inhibitorconcentration, fuel type, and the presence of water vapor in the air on the HF generation rate, all forsteady-state flames. These calculations refer to a condition where the agent is added at a concentrationlower than the extinction concentration, so that the flame continues to burn, but produces copiousamounts of HF. These figures are shown to illustrate the influence of the fuel and agent type,inhibitor concentration, and moisture content of the air on steady flames. The results will be extended
to transiently suppressed fires in subsequent figures.Figure 56 shows the calculated steady-state HF production rate (g-HF/g-fuel) as a function of the
agent mole fraction in the air stream for the one-carbon suppressants CF3Br and CHF3, the two-carbonsuppressants C2F6, C2HF5, and CZHZF4, and the three-carbon suppressants C3HF7 and C3F8. Theresults are calculated for heptane, and the calculations are performed for dry air. As the figure shows,the each curve has a distinctive change in slope (which occurs at the inhibitor concentration where theflux of fluorine into the flame equals that of hydrogen). The curves are grouped according to thenumber of carbon atoms in the inhibitor, which correlates with the number of fluorines and themolecular weight, both of which influence the flux of fluorine into the flame, and hence the HFgeneration rate. Surprisingly, for agents which extinguish the flame at approximately the same
concentration, for example C3F8 and C3HF7, the agent with more hydrogen atoms is predicted to makemore HF. This occurs because above a certain concentration (about 3,5 ?to agent in the figure), the HFproduction is limited by hydrogen, not fluorine. The agent CF3Br makes less HF because at a given
mole fraction, the molecule carries fewer fluorine atoms into the flame than the larger halocarbons,and because it puts the flame out at a much lower concentration,
Each curve is truncated at the extinction concentration in a heptane cup burner flame for thatinhibitor. The area under each curve from zero inhibitor up to the extinction concentration represents
the total HF formed for an extinguished flame (in g-HF/g-fuel consumed). If the fuel consumptionrate is larger or the inhibitor injection rate is slower, the total fuel consumed during the extinctionevent is larger, and the HF formed is proportionally greater.
The effect of water vapor in the air stream is indicated in Figure 57 which shows the steady-stateproduction rate of HF as a function of inhibitor mole fraction for CF3Br, C3F8, and C2HF5. Curvesare shown for dry air (dotted lines) and for air with 2,3 mole percent water vapor (solid lines),corresponding to 10070 R.H. at 25 “C, and assuming that wet and dry flames extinguish at the sameconcentration. The effect of water vapor is small when the agent concentration is low, since underthese conditions, the limitation on the amount of HF is the fluorine flux into the flame, not the
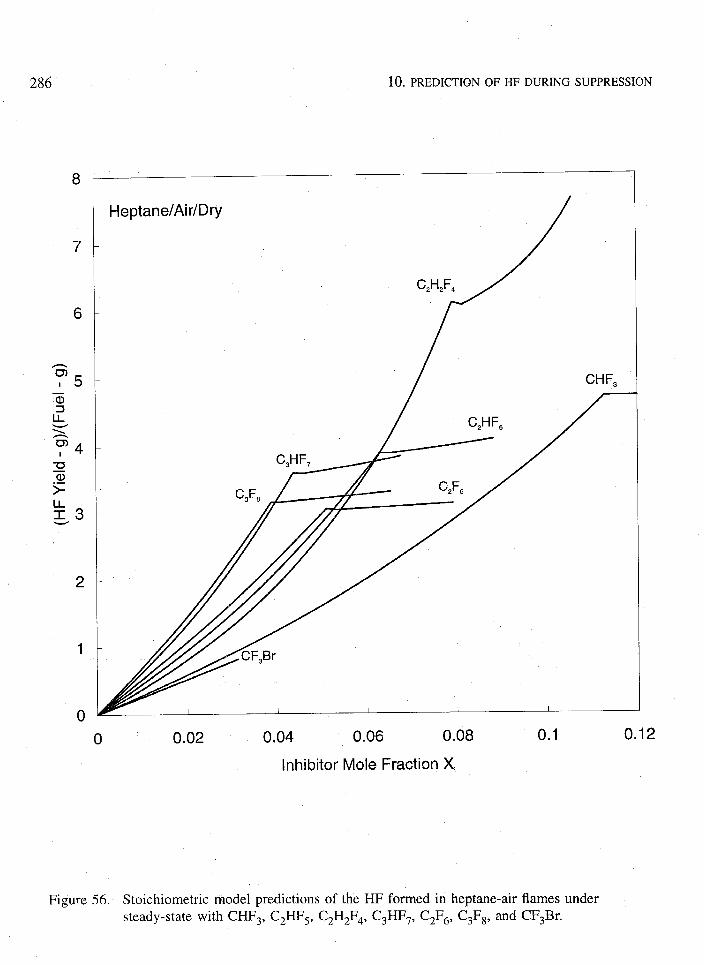
286
8
7
6
IL13
Heptane/Air/Dry
2
1
0
0.02
//
CHF,
r
Figure 56.
0.04 0.06 0.08
Inhibitor Mole Fracticm Xi
0.1 0.12
Stoichiometric model predictions of the HF formed in heptane-air flames understeady-state with cliIF3, C2HF5, C2H2F4, C3HF7, C2F& C3FS, and CF3Br.
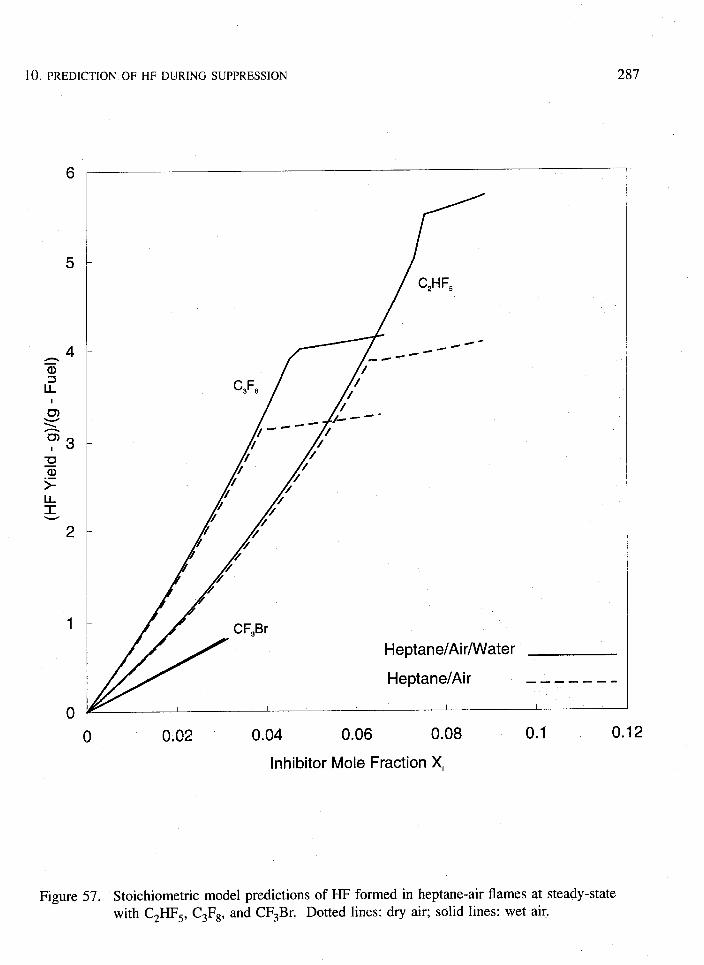
PREDICTIONOF HF DURINGSUPPRESSION10,
6
0
C,F,
Heptane/Air/VVa
Heptane/Air
0.02 0.04
Inhibitor Mole
ter
—-—- -—.
0.06 0.08
Fraction Xi
I
0.1 0.12
57. Stoichiometric model predictions of HF formed in heptane-air flames at steady-statewith C2HF5, C3F8, and CF3Br. Dotted lines: dry air; solid lines: wet air.

288 10, PREDICTIONOF HF DURINGSUPPRESSION
hydrogen flux. At high inhibitor loading, however, there becomes more fluorine than hydrogen in theflame, and any additional hydrogen from water vapor can increase the production rate of HF.
Figure 58 illustrates the effect of fuel type on the steady-state HF production in flames inhibitedby C2HF5 by showing curves for JP8, heptane (C7H16), propane (C3H8), and methane (CH4). The
different fuels have a different carbon to hydrogen ratio, which affects the HF production rate, sincethe fuel is the major source of hydrogen in the flame, and hydrogen is necessary for the efficientproduction of HF (the kinetic rates get much slower in hydrogen-starved flames as described above).The amount of HF formed is lowest for JP8, followed by heptane, propane and methane. Note thatthe amount of HF formed in transient flames is represented by the area under the curves in Figure 59,so that the differences in HF formation between the fuel types can be quite large.
As discussed above in the description of the model for HF formation, transiently suppressed firesproduce HF according to the area under the steady-state generation curve as in Figure 56. For a giveninhibitor, fuel type, water vapor concentration, and extinction condition, the area under the curve willbe a constant,
Two additional factors can affect the total quantity of HF formed: 1) the fuel consumption rate,and 2) the time for the fire to be extinguished. The first of these is obvious since the HF productionrate is normalized by the fuel consumption rate. Fuel consumption is the driving force for transport ofinhibitor and air to the reaction zone, so that increased fuel consumption increases HF productionproportionally. The effect of the inhibitor injection rate (or alternatively, the fire out time, since theyare strongly related) is to change the fuel consumption. That is, if the flame is extinguished slowly,
more HF is produced because during the longer time, more fuel is consumed.Figure 59 indicates the total HF produced during extinguishment of a heptane air flame by CF3Br,
CHF3, C3F8, C3HF7, C2HF5, and C2H2F4 in dry air. As the figure shows, the quantity of HF produced
in linearly proportional to the extinction time.Finally, the effect of extinguishment at lower inhibitor concentrations is described. In the above
figures, the extinction condition of the fire was assumed to be equal to the cup burner extinction valuefor the agent and fuel. If the flame is more easily extinguished, less acid gas will be produced duringextinction. This is because if a flame extinguishes more easily, the curves in Figures 56 will beintegrated up to a lower concentration, and the area under the curve (which represents the total HFproduced) will be proportionally less. This is illustrated in Figure 60 which shows the quantity of HFproduced by heptane-air flames with dry air extinguished by CHF3, CF3Br, C2HF5, C3HF7, and C3F8
as a function of the flame’s extinction concentration for a constant fire out time (10 s). As the figureillustrates, flames which extinguish at lower concentrations of inhibitor produce less HF, in anapproximately linear fashion.
It should be emphasized that the analyses demonstrated above examine the effects of severalparameters on the HF source, the fire, under the assumption of thermodynamic equilibrium. As shownpreviously in Figures 34-38 for propane flames, there can be significantly less HF formed thanpredicted by chemical equilibrium, although for heptane, the agreement is excellent. Consequently, thepredictions described here are upper limit estimates probably with about 30 % of actual results.
10.10.2 Conclusions. The following conclusions can be drawn based on the diffusion flame experi-ments, modeling, and parametric analysis:
1. The stoichiometric model, based on relatively simple but fundamental assumptions, is a usefultool for understanding HF formation in suppressed fires. The predictions of the model providegood estimates of the upper limit for formation of HF, and are valid for both steady-state andtransient modes of inhibition.

10. PREDICTIONOF HF DURINGSUPPRESSION
8
7
6
Il..
‘3
2
1
0
Hydrocarbon/Air/Dry
CH4
C3H,
I I I I I
o 0.02 0.04 0.06
C,HF, Mole Fraction Xi
0.08 0.1
Figure 58. Stoichiometric model predictions of HF formed in heptane-air flames at steady-statewith C2HF5 added to air stream with various fuels (CH4, C3H8, C7H16, and JP8).
0.12

290 10. PREDICTIONOF HF DURINGSUPPRESSION
50
45
40
35
30
25
20
15
10
5
0
Figure 59.
Heptane/Air/Dry
CF,Br
2 4 6 8 10 12 14
Extinction Tim’e (s)
Total HF predicted during extinguishment of heptane-air flames for CHF3, C2HF5,C3HF7, C3F8, CF3Br versus extinction time.

10. PREDICTIONOF HF DURINGSUPPRESSION
1
1
40
35
30
25
20
15
10
5
0
0
C,H2F4Heptane/Air/Dry
/
40.02 0.04 0.06
Extinction Inhibitor Mole Fraction Xi
0.08 0.1
Figure 60. Total HF predicted during extinguishment of heptane-air flames for CHF3, C2HF5,CZHZF4, C3HF7, C3F8, CF3Br versus extinction concentration.
0.12

10. PREDICTIONOF HF DURINGSUPPRESSION292
2.
3.
4.
5.
The predictive model indicates that HF formation increases approximately linearly with fire sizeand extinguishing time and decreases approximately linearly with extinction concentration of theinhibitor.
The formation of HF is affected somewhat by the hydrogen to carbon ratio of the fuel, hydrogento fluorine ratio in the agent, and the water vapor content of the air.
While predictions of HF produced in suppressed flames and intermediate scale fires are within
about 25 Yoof the experimental results (which have large scatter), the estimated quantities of HFformation based on chemical equilibrium can overestimate the steady-state HF production by upto a factor of two for some agents.
Based on the analyses above, it should be possible to predict the HF formation by any arbitraryfluorocarbon which has a chemical structu~e similar (but not identical) to those agents analyzedabove.
10.11 Predicting HI? in Dry-Bay and Engine Nacelle Fires
Dry-bay and engine nacelle fires are expected to be distinctly different from each other, and as aresult, the estimation of HF formation in each will require application of different methods. In theengine ~acelle fire threat, the most likely scenario is expected to be a broken fuel or hydraulic linespraying into the nacelle region, with an attached, stabilized spray diffusion flame. Conversely, thedry-bay fire threat will most like occur from an incendiary device rupturing the fuel tank, creating alarge rapidly advancing turbulent flame progressing into the basically premixed dry-bay region.Because the model for HF formation developed above is based on first principles, it is possible toapply it to the cases of engine nacelle and dry-bay fires. For each fire type, the important parameterscontrolling HF formation will be discussed, and specific methods for estimating the amount of HFproduced during suppression will be presented.
10.11.1 Engine Nacelle Fires. A likely scenario for a engine nacelle fire is that of a spray diffusionflame of a liquid fuel. The time for fire suppression in this case is assumed to be seconds. In manyrespects, the flame will resemble a laboratory diffusion flame of a hydrocarbon fuel. Typically, theburning rate of a diffusion flame is controlled by the rate of transport of oxidizer to the reaction zone.In a similar way, the production of HF is also controlled by the rate of transport of inhibitor to thereaction zone. Although equilibrium calculations described in Section 10.4 above indicate that
complete decomposition of the inhibitors to HF, C-OFZ, and C02 is favored, it is necessary to estimatethe flux of the inhibitor to the reaction zone to determine the amount of reactants available. Inaddition, kinetic limitations to HF formation must be considered since complete and rapid destructionof the inhibitors is not assured at the high inhibitor concentrations typical of the extinction concentra-tions for diffusion flames, and in addition, slower rates of destruction reduce the transport rate to thereaction zone.
In the model for HF production described in Section 10.6 above, the inhibitor is assumed to beconsumed in the reaction zone as a reactive species. The agent can be thought of as an additional fuelspecies, having its own oxygen demand, yet coming from the air side of the flame. It must betransported to the hot reaction zone which serves as a sink for the inhibitor. Thus fuel, oxygen andinhibitor are consumed in the reaction zone in stoichiometric proportions, with the stoichiometry
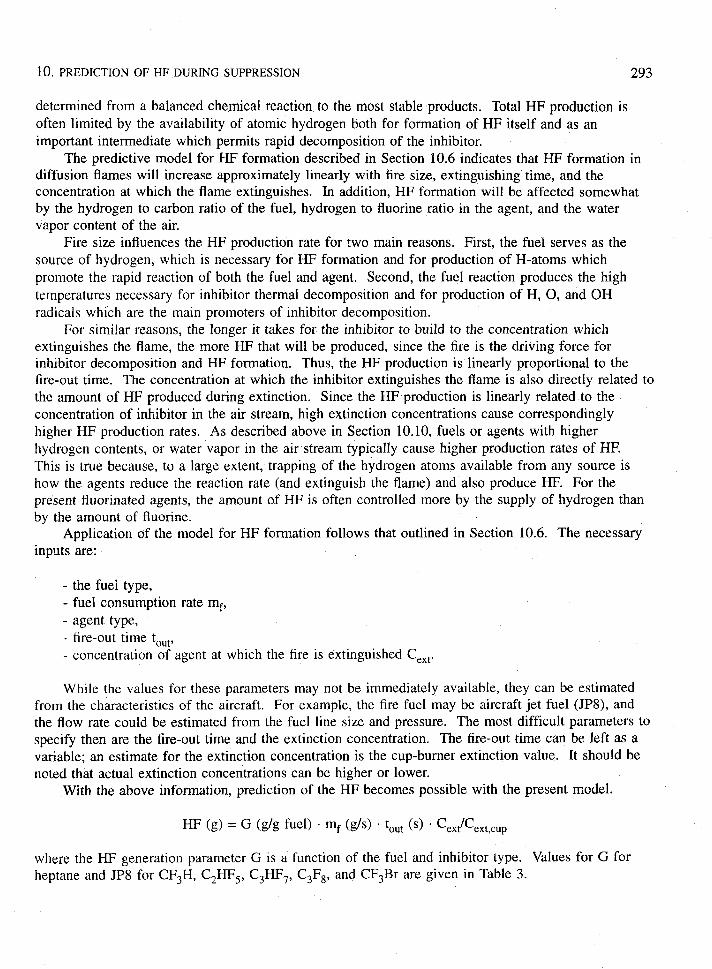
It). PREDICTIONOF HF DURINGSUPPRESSION 293
determined from a balanced chemical reaction to the most stable products. Total HF production is
often limited by the availability of atomic hydrogen both for formation of HF itself and as animportant intermediate which permits rapid decomposition of the inhibitor.
The predictive model for HF formation described in Section 10.6 indicates that HF formation indiffusion flames will increase approximately linearly with fire size, extinguishing time, and theconcentration at which the flame extinguishes. In addition, HF formation will be affected somewhatby the hydrogen to carbon ratio of the fuel, hydrogen to fluorine ratio in the agent, and the watervapor content of the air.
Fire size influences the HF production rate for two main reasons. First, the fuel serves as thesource of hydrogen, which is necessary for HF formation and for production of H-atoms whichpromote the rapid reaction of both the fuel and agent. Second, the fuel reaction produces the high
temperatures necessary for inhibitor thermal decomposition and for production of H, O, and OHradicals which are the main promoters of inhibitor decomposition.
For similar reasons, the longer it takes for the inhibitor to build to the concentration whichextinguishes the flame, the more HF that will be produced, since the fire is the driving force forinhibitor decomposition and HF formation. Thus, the HF production is linearly proportional to thefire-out time. The concentration at which the inhibitor extinguishes the flame is also directly related tothe amount of HF produced during extinction. Since the HF production is linearly related to theconcentration of inhibitor in the air stream, high extinction concentrations cause correspondinglyhigher HF production rates. As described above in Section 10.10, fuels or agents with higher
hydrogen contents, or water vapor in the air stream typically cause higher production rates of HF.This is true because, to a large extent, trapping of the hydrogen atoms available from any source ishow the agents reduce the reaction rate (and extinguish the flame) and also produce HF. For thepresent fluorinated agents, the amount of HF is often controlled more by the supply of hydrogen thanby the amount of fluorine.
Application of the model for HF formation follows that outlined in Section 10.6. The necessaryinputs are:
- the fuel type,- fuel consumption rate mf,- agent type,- fire-out time tout,- concentration of agent at which the fire is extinguished CeX[.
While the values for these parameters may not be immediately available, they can be estimatedfrom the characteristics of the aircraft. For example, the fire fuel may be aircraft jet fuel (JP8), andthe flow rate could be estimated from the fuel line size and pressure. The most difficult parameters to
specify then are the fire-out time and the extinction concentration. The fire-out time can be left as a
variable; an estimate for the extinction concentration is the cup-burner extinction value. It should benoted that actual extinction concentrations can be higher or lower.
With the above information, prediction of the HF becomes possible with the present model,
HF (g) = G (g/g fuel) “ mf (g/s) “ tout (s) “ Ce#&t,c.p
where the HF generation parameter G is a function of the fuel and inhibitor type,heptane and JP8 for CF3H, C2HFj, C3HF7, C3F8, and CF3Br are given in Table 3.
Values for G for

294 10. PREDICTIONOF HF DURINGSUPPRESSION
Table 3, The generation parameter G for heptane and JP8
Heptane JP8Inhibitor
Dry Wet Dry Wet
CHF3 2.3 2.3 2.2 2.2
C2HF~ 2.5 2.8 1.7 1.7C3HFT 2.4 2.8 1.6 1.7
C3F8 2.2 2.5 1.5 1.6
CF3Br 0.4 0.4 0.1 0.1
10.11.2 Dry-Bay Fires. The dry-bay fire threat is harder to specify, but is envisioned to be a veryrapidly expanding fireball driven by an incendiary device. These fires can be described as a rich,
premixed turbulent flame, rapidly accelerating. As such, the conditions for HF formation are those of
a premixed flame as described above in Sections 10.5 and 10.6.1. In these cases, the mass flux ofboth fuel and agent into the reaction zone are well specified.
As described in the section above describing the equilibrium calculations, the most abundantproducts of agent decomposition are CO, C02, HF, and COF2. The model adopted in the presentwork assumes that the fluorinated agents decompose to the most thermodynamically favorable productsand that finite rate kinetics are not important for HF formation. The validity of these assumptions are
based on the extensive numerical modeling of premixed flames as described above. Complete
conversion of the inhibitor to HF in premixed flames has been demonstrated above for conditionswhere the inhibitor is present at concentrations such that the atomic hydrogen to fluorine ratio is lessthan unity. As described in Section 10.5 above, complete conversion to HF may also be expected forhigher temperature and pressure flames since the mechanism for agent decomposition becomes moredependent upon thermal decomposition under these conditions. In addition, there will be residualwater vapor present in the dry-bay from the combustion which occurred prior to agent injection; thiswater vapor will hydrolyse COF2 (which is the favored product in the absence of sufficient hydrogen)to produce HF.
The time for extinction of dry-bay fires is expected to be much shorter (tens of milliseconds) ascompared to engine nacelle fires. Consequently, it is necessary to discuss the influence of these shorttimes on the HF formation. Premixed flames have propagation rates on the order of 1 n-ds and flamethicknesses of about a millimeter. This corresponds to a characteristic time on the order of 1 ms.However, the reaction zone in a premixed flame is typically about a tenth of the flame thickness, sothat the characteristic chemical time is less than a millisecond. Since the chemical time is muchshorter than the extinction time, the effects of the transient extinction do not influence the chemicalconsiderations; results which describe steady-state flame are also applicable to transient suppression.
Essentially, all of the agent which is encountered by the expanding flame is expected to beconverted to HF. To estimate the amount of HF formed, it is only necessary to specify:
- the volume of the space, V- the agent type and number of fluorines/molecule, ntZ- the design mole fraction of agent in the space, Xi- the fraction of the space over which the flame interacts with the
inhibitor/air mixture prior to extinguishment, ~.
10. PREDICTIONOF HF DURINGSUPPRESSION 295
HF (g) = 19. V . Xi , nF . ~ / (22.4 oT/273 . 101/P)
where P is the pressure (kPa) and T is the temperature (K).Note that in these fire threats, the time is so short and the process so rapid that the volume of the
space becomes more important than the time of the process or the fuel consumption rate. If the timeis long, then the HF formation should be treated as in the engine nacelle case described above.
10.12 Summary
Comprehensive chemical equilibrium calculations for hydrocarbon-air flames with halogenatedinhibitors have been performed. These calculations, followed by detailed flame structure calculationsfor premixed flames have provided a theoretical basis for development of a simple model for HFformation.
Extensive tests for HF production have been performed in laboratory flames. In these carefullydesigned and executed experiments, the HF formation rates in steady-state premixed and diffusionflames have been determined. The experiments encompass both gaseous and Iiquid fuels, includingmethane, propane, and heptane. Transient experiments for HF formation have been performed forpropane-air diffusion flames. These data provide an experimental basis for comparing the agents and
for testing the stoichiometric model which was developed. In addition the model was tested againstintermediate-scale tests of HF production conducted at the Naval Research Laboratory.
Dry-bay fires most likely resemble a rapidly accelerating turbulent premixed flame. For theseflames, numerical calculations of the flame structure indicate that there will be complete conversion ofthe fluorine in the agent in the protected space to HF. Premixed experiments at elevated pressures andthe accompanying modeling also indicate complete conversion of the inhibitor to HF.
Engine nacelle fires are expected to resemble turbulent diffusion flames. For these flames, thestoichiometric model which has been developed is able to predict HF formation in transientlysuppressed flames within about 3070 of the experimental results for all the data against which it hasbeen tested,
The formation rate of HF in diffusion flames is strongly influenced by the mass flux of inhibitorinto the flame sheet. For diffusion flames with the inhibitor added to the air stream, there appear to bekinetic limitations to the rate of HF formation for most but not all of the agents tested which increaseas the inhibitor concentration in the air stream increases. Many of the agents (for example C2H2F4,
C2HC1F4, C3H2F6, CH2F2/C2HF5, CF3Br and CHC1F2) produced HF at rates within about 25 % of thatgiven by equilibrium thermodynamics in the diffusion flames tested. Most of the perfluorinated agentstested (C2F6, C3F8, and C4F1~) and the agents C4F8, C2HF5 and C3HF7 produced O to 35 70 less thanthe equilibrium values except when the estimated fluorine to hydrogen flux into the flame goes aboveunity when they show no further increase with increasing inhibitor concentration in the air stream.
The stoichiometric model, based on relatively simple but fundamental assumptions, is a usefultool for understanding HF formation in suppressed fires. The predictions of the model provide goodestimates of the upper limit for formation of HF, and are valid for both steady-state and transientmodes of inhibition.
The following conclusions can be drawn concerning HF formation in suppressed fires - fordiffusion flames:
1. HF formation increases linearly with fire size (i.e., fuel consumption rate) for any given fuel andsuppressant.

296 10. PREDICTIONOF HF DURINGSUPPRESSION
2.
3.
4.
5.
6.
7.
8.
Assuming a constant agent injection rate, the HF formation increases approximately linearly withthe time it takes for the fire to extinguish, for any given fuel and suppressant
For a given agent and fuel, the HF produced decreases approximately linearly with the concentra-tion at which the flame is extinguished. That is, flames that are extinguished at lower inhibitorconcentrations produce correspondingly less HF.
The hydrogen to carbon ratio of the fuel can influence the amount of HF produced by up to afactor of two for a given agent, with the higher hydrogen fuels making more HF.
The agents C2HF5, C3HFY, and C3F8 will make about four times as much I-W as will cF3Br forheptane flames for the same fire-out time. If the fire goes out faster (which will probably occurwith CF3Br since a lower concentration is required to extinguish the flame and that can probablybe attained faster), the amount of HF will be proportionally less.
Large differences in the amount of HF produced by the agents C2HF5, C3HF7, are C3F8 are notexpected.
The hydrogen to fluorine content of the agent influences the HF formation, with higher hydrogencontent agents making more HF.
Water vapor in the air will increase the HF formation slightly,
and for premixed flames:
1, Complete conversion of the fluorine in the inhibitor to HF is expected.
2. The amount of HF produced depends upon: a) the volume of air consumed by the fire beforeextinction; b) the concentration of agent in that volume.
The predictions of the stoichiometric model are summarized in Figure 61, This figure presentsthe mass of HF formed (g) per gram of fuel consumed, and shows the cup burner extinction value forheptane. The effect of the fuel type is shown, as well as the effects of the agent type and presence ofwater vapor in the air. The prediction assumes a 10 second extinction time and cup burner extinctionconcentrations. For shorter extinction times or lower extinction concentrations, the amount of HF isreduced proportionally.
While predictions of HF produced in suppressed flames and intermediate scale fires are withinabout 25 % of the experimental results (which have large scatter), the estimated quantities of HFformation based on chemical equilibrium can overestimate the steady-state HF production by up to afactor of two for some agents, An examination of the chemical kinetics of suppressed diffusion flamescan lead to an understanding of the relevant phenomena, and may indicate approaches for reduction ofthe HF production by halon alternatives.

1(). PREDICTIONOF HF DURINGSUPPRESSION 297
I
I
#4
rI
3,5
1-3
2.5H
‘+’-’T1
“n I FiJ
I I I
+4 WetI DryWet
R125R227
R218C7H16 DV Fuel
R311OR23
Agent R1301
Figure 61. Predicted HF production (g) per gram of fuel consumed during the suppression.Effects of fuel and inhibitor type and wet and dry air are shown. The first rowshows the cup burner extinction concentration (divided by 10) for heptane.

298 10. PREDICTIONOF HF DURINGSUPPRESSION
10.13 Acknowledgments
This research was supported by the U.S. Naval Air Systems Command; U.S. Army Aviation andTroop Command; Federal Aviation Administration Technical Center; and the U.S. ‘Air Force. Theauthor especially appreciates the support and technical direction of Mr. J. Michael Bennett at theWright Patterson AFB Flight Dynamics Laboratory, Survivability Enhancement Branch. The authorsare grateful to Drs. D. Burgess, W, Tsang, P. Westmoreland, and M. Zachariah for helpful conversa-tions and for making their mechanism and publications available prior to publication; to Drs. J.Vandooren and P. Van Tiggelen for helpful suggestions concerning the experimental techniques; andto Dr. J, Hodges for help with the image processing; and to Dr. K. Smyth for helpful conversationsthroughout the project. It is a pleasure to acknowledge the collaboration with L. Truett in making themeasurements, and the assistance of Mr. Arnold Liu and Miss Cynthia Yu in writing the dataacquisition and image processing software, performing the numerical calculations, and reducing thedata. The authors are grateful to M, King, R. Harris, Y.E. Hsin, C. Womeldorf, and A. Liu for carefulperformance of the experiments. Helpful conversations with Dr. R. Sheinson at the Naval Research
Laboratory concerning the intermediate-scale experiments are gratefully acknowledged.
10.14 References
Andrews, G.E. and Bradley, D. Combust. Flame 18, 133-153 (1972).Bajpai, S.N. J. Fire and Flammability, 1974, 5, 255.Belles, F.E. and O’Neal, C. Jr., Sixth Symposium (Int’1) on Combustion, The Combustion Institute,
Pittsburgh, PA, 1957, 806.
Biordi, J.C., Lazzara, C,P., and Papp, J.F. XIVth Symposium (Int ‘1)on Combustion, TheCombustion Institute, Pittsburgh, PA, 1973, 367.
Biordi, J.C.; Lazzara, C. P.; Papp, J,F, X/Vth Symposium (Int ‘1)on Combustion, The CombustionInstitute, Pittsburgh, PA, 1973, 367-381.
Biordi, J. C., Lazzara, C. P., and Papp, J.F. XVth Symposium (Int ‘1)on Combustion, The Combus-tion Institute, Pittsburgh, PA, 1974, 917.
Biordi, J.C., Lazzara, C. P., and Papp, J.F. 1976, ./. Phys. Chem. 80, 1042-1048.Biordi, J,C., Lazzara, C.P., and Papp, J.F. 1977, J. Phys. Chem. 81, 1139-1145.Biordi, J. C., Lazzara, C. P., and Papp, J.F. 1978, J Phys. Chem. 82, 125.Booth, K.; Melina, B .J.; Hirst, R. 1973, Imperial Chemical Industries Limited, Mend Division,
Cheshire UK, 31 August.
Burden, M. C.; Burgoyne, J.A.; Weinberg, F.J. Vth Symposium (Int ‘1) on Combustion, ReinholdPublishing Corp., New York, NY, 1955, 647-651.
Burgess, D., Jr., Tsang, W., Westmoreland, P.R., Zachariah, M.R. Third international Conferenceon Chemical Kinetics, July 12-16, 1992, Gaithersburg, MD, 1993, p. 119.
Burgess, D. R. F,; Jr., Zachariah, M. R.; Tsang, W.; and Westmoreland, P.R. Thermochemical andChemical Kinetic Data for Fluorinated Hydrocarbons in Flames, National Institute of Standards andTechnology, Gaithersburg MD, 1994, NIST Technical Note, submitted.
Burgess, D.R.F., Jr., Zachariah, M.R., Tsang, W., and Westmoreland, P.R. Thermochemical andChemical Kinetic Data for Fluorinated Hydrocarbons in Flames, NationalTechnology, Gaithersburg MD, 1994, NIST Technical Note, submitted.
Institute of Standards and

10. PREDICTIONOF HF DURINGSUPPRESSION 299
Burgess, D. R.F., Jr., Zachariah, M. R., Tsang, W., and Westmoreland, P.R. Thermochemical and
Chemical Kinetic Data for Fluorinated Hydrocarbons, to appear as a special issue of F2-ogress in
Energy and Combustion Science, 1995.Burgoyne, J.H. and Williams-Lier, G., Proceedings of the Royal Society, A193, 525, (1948).Burgoyne et al., 1948; Coleman, 1951; Belles et al., 1957.Burke, S.P.; Schumann, T.E.W. 1928, lnd. Eng. Chem. a4 20, 998.Coleman, E. H., Fuel, 30, 114, (1951).Di Nenno, P.J.; Forssell, E.W.; Peatross, M. J.; Wong, J.T.; Maynard, M. Halon Alternatives
Technical Working Conference, New Mexico Engineering Research Institute, Albuquerque, NM,May 11-13, 1992.
Ferreira, M. J.; Hanauska, C, P.; Pike, M.T. Halon Alternatives Technical Working Conference,
New Mexico Engineering Research Institute, Albuquerque, NM, May 11-13, 1992.Ferreira, M,J,; Hanauska, C. P.; Pike, M.T. Halon Alternatives Technical Working Conference,
New Mexico Engineering Research Institute, Albuquerque, NM, May 11-13, 1992.Filipczak, I?.A. Ha[on Alternatives Technical Working Conference, New Mexico Engineering
Research Institute, Albuquerque, NM, May 11-13, 1993, 149-159.Filipczak, R.A. Halon Options Technical Working Conference, New Mexico Engineering
Research Institute, Albuquerque, NM, May 3-5, 1994, 165-176.Frenklach, M., Wang, H,, Bowman, C.T., Hanson, R. K., Smith, G.P., Golden, D. Gardiner, W.
Lissianski, V., Poster 3-26, Twenty-fl&z Symposium (Int ‘1) on Combustion, The Combustion Institute,Pittsburgh, PA, 1994.
Gann, R. G., Ed., Halogenated Fire Suppressants; ACS Symposium Series No. 16, The AmericanChemical Society, Washington, DC, 1975.
Garner, F.H., Long, R., Graham, A.J., and Badakhshan, A., Sixth Symposium (Int ‘1) on Combus-tion, The Combustion Institute, Pittsburgh, PA, 1957, 802.
Gross handler, W.L.; Gann, R. G.; Pitts, W.M.; Eds. Evaluation of Alternative In-Flight FireSuppressants for Full-Scale Testing in Simulated Aircrafi Engine Nacelles and Dry Bays, NationalInstitute of Standards and Technology, Gaithersburg, MD, 1994; NIST SP 861.
Hastie, J.W., High Temperature Vapors: Science and Technology, New York, NY, 1975,Academic Press, 332.
Hochgreb, S,, Hsin, Y.E., and Linteris, G.T., Luminar Flame Speeds of CF3H-Propane-Air
Mixtures at Elevated Pressures, NIST Annual Conference on Fire Research, Oct. 17-20, 1994,
Gaithersburg, MD.VanDerWege, B., Bush, M.T., Hochgreb, S., and Linteris, G.T., “Inhibition of CH4 Laminar
Flame Speeds by CF3H and C2F6 in a Combustion Bomb, ” to be submitted to Combustion Scienceand Technology, July, 1995.
Kee, R.J., Miller, J.A. and Jefferson, T.H. CHEMKIN: a General-Purpose, Transportable, FortranChemical Kinetics Code Package, Sandia National .Laboratories Report, 1980, SAND80-8003.Kee, R.J., Warnatz, J., Miller, J.A. A Fortran Computer Code Package for the Evaluation ofGas-Phase Viscosities, Conductivities, and Difjlusion Coefficients, Sandia National Laboratories Report,1983, SAND83-8209.
Kee, R.J., Grcar, J.F., Smooke, M.D. and Miller, J.A. A Fortran Program for Modeling SteadyLuminar One-dimensional Premixed Flames, Sandia National Laboratories Report, 1991,SAND85-8240.
Kee, R. J., Warnatz, J,, Miller, J.A. A Fortran Computer Code Package for the Evaluation ofGas-Phase Viscosities, Conductivities, and Diflusion Coe#icients, Sandia National Laboratories Report,1983, SAND83-8209.

300 10. PREDICTIONOF HF DURINGSUPPRESSION
Lask, G,, Wagner, H. G., Thirteenth Symposium (Int ‘1) on Combustion, Williams and Wdkins Co.,Baltimore, 1962, 432.
Linnett, J.W. Fourth Symposium (Int ‘1) on Combustion, Williams & Wilkins, Baltimore, 1953,p. 20.
Linteris, G. T.; King, M. D.; Liu, A.; Womeldorf, C.; Hsin, Y.E. Halon Options Technical Working
Conference, New Mexico Engineering Flesearch Institute, Albuquerque, NM, May 3-5, 1994, 177-190.Linteris, G.T.; Gmurczyk, G.W. Parametric Study of Hydrogen Fluoride Formation in Suppressed
Fires, Halon Options Technical Working Conference, Albuquerque, NM, 1995.Linteris, G. T., and Truett, L. F., Inhibition of Premixed Methane-Air Flames by Fluoromethanes,
accepted for publication in Combustion and Flame, June, 1995a.Linteris, G.T. and Truett, L., Inhibition of Premixed Methane-Air Flames by Halon .Alternatives,
Proc, of International Conj on Fire Research and Engineering; Sept. 10-15, 1995b; Orlando, FL.Linteris, G. T., Effect of inhibitor concentration on the inhibition mechanism of fluoromethanes in
premixed methane-air flames, to appear in “Halon Replacements: Technology and Science,” American
Chemical Society Symposium Series (A.W. Miziolek, and W. Tsang, Eds.), Washington, DC, 1995a.Linteris, G.T., Acid gas production in inhibited propane-air diffusion flames, to appear in Halon
Replacements: Technology and Science, American Chemical Socie~ Symposium Series
(A.W. Miziolek, and W. Tsang, Eds.), Washington, DC, 1995b.Linteris, G. T., Numerically predicted flame structure and burning rates of premixed CO-Ar-02-H2
flames inhibited by CF3H, submitted to Combustion and Flame, Feb. 1995b.Mache, H. and Hebra, A. Sitzungsber. Osterreich. Akad. Wiss., Abt. lIa, 150, 157 (1941).Metghalchi, M. and Keck, J. C., Combust. Flame 38, 143 (1980).Moore, T.A,; Dierdorf, D. S.; Hanauska, C. Halon Options Technical Working Conference, New
Mexico Engineering Research Institute, Albuquerque, NM, May 3-5, 191.Nyden, M.R., Linteris, G. T., Burgess, D. R.F., Jr,, Westmoreland, P.R., Tsang, W., and Zachariah,
M,R., in Evaluation of Alternative In-Flight and Dry Bays, (W.L. Grosshandler, R.G. Gann, and W.M.Pitts, Eds.), National Institute of Standards and Technology, Gaithersburg MD, 1994, NIST SP 861,p. 467.
Pitts, W.M.; Nyden, M. R.; Gann, R. G.; Mallard, W.G.; Tsang, W. Construction of an ExploratoWList of Chemicals to Initiate the Search for Halon Alternatives; National Institute of Standards andTechnology, Gaithersburg MD, 1990; NIST SP 1279.
Rosser, W. A., Wise, H., and Miller, J., Seventh Symposium (Int ‘1) on Combustion, ButterworthsScientific Publications, Butterworths, London, 1959, 175,
Safieh, H. Y.; Vandooren, J.; Van Tiggelen, P.J. XIXth Symposium (International) on Combustion,The Combustion Institute, 1982, Pittsburgh, PA, 117-127.
Sheinson, R. S.; Musick, J.K.; Carhart, H.W. 1981, Journal of Fire and Flammability, 12, 229.
Sheinson, R.S; Alexander, J.1, Fall Meeting, Eastern States Section Meeting/The CombustionInstitute, 1982, Pittsburgh, PA, Paper 62.
Sheinson, R. S., Penner-Hahn, J.E., and Indritz, D. 1989, Fire Safety Journal 15, 437.Sheinson, R. S.; Eaton, H. G.; Black, B.; Brown, R.; Burchell, H.; Smith, W.D. Halon Options
Technical Working Conference, New Mexico Engineering Research Institute, Albuquerque, NM,May 3-5, 1994, 43-53.
Simmons, R.F. and Wolfhard, H. G., Transactions of the Faraday Socie@, 52, 53 (1956).Simmons et al., 1956; Garner et al,, 1957; Rosser et al. 1959; Lask and Wagner, 1962.Smith, W.D.; Sheinson, R. S.; Eaton, H. G.; Brown, R.; Salmon, G.; Burchell, H.; St. Aubin, H,J,
Six~h international Fire Conference, Interflam ’93, Interscience Communications Limited, 1993,757-764.
](). PREDICTIONOF HF DURINGSUPPRESSION 301
Thorpe, R. K., Gmurczyk, G.W.: Technical Support Services and Assistance to the HalonCompatibility Project. “ Science Applications International Corporation, Report for the Nationalinstitute of Standards and Technology, Contract No. 52SBNB4C8144, 1995.
Yamashika, S. 1973, Report of Fire Research Institute of Japan, 36, 7.
Yamashika, S.; Hosokai, R.; Morikawa, T. 1974, Report of Fire Research Inst. of Japan, 38, 1.Vagelopoulos, C.M., Egolfopoulos, F.N., and Law, C.K, Twenty-&h Symposium (Int’1) on
Combustion, The Combustion Institute, Pittsburgh, 1994, p. 1341.VanDerWege, B., Bush, M. T., Hochgreb, S., and Linteris, G.T., Inhibition of CH4 Laminar Flame
Speeds by CF3H and C2F6 in a Combustion Bomb, to be submitted to Combustion Science andTechnology, July, 1995.
Vandooren, J. F.; da Cruz, N.; P. Van Tiggelen XXIlnd Symposium (Interrzational) on Combustion,The Combustion Institute, Pittsburgh, PA, 1988, 1587-1595.
Van Wonterghem, J. and Van Tiggelen, A. Bull. Sot. Chim. Belg. 63, 235-260 (1954). VanWonterghem and Van Tiggelen, 1954.
Westbrook, C.K. Combust. Sci. and Tech. 1983, 34, 201.
Westmoreland, P.R., Burgess, D.F.R. Jr., Tsang, W., and Zachariah, M,R. XXVth Symposium
(Int’1) on Combustion, The Combustion Institute, Pittsburgh, PA, 1994.Wilson, W.E., Jr. Xth Symposium (International) on Combustion, The Combustion Institute,
Pittsburgh, PA, 1965, 47-54.World Meteorological Organization, 1989, Scientific Assessment of Stratospheric Ozone: 1989, ”
Report No. 20, Allernalive Fluorocarbon Environmental Acceptability Study (AFEAS).Zallen, D. M., 1992, Halon Replacement Study, SBIR Report No. ZIA-92-001 to Aeronautical
Systems Division, Wright-Patterson AFB, Zallen international Associates.

302 10. PREDICTIONOF HF DURINGSUPPRESSION
Appendix A. The Computer Program Predicting Formation of HF
c The Computer Program:c Composition of Combustion/Inhibition Productsc For the Reaction of Hydrocarbon/Air/Water/Halocarbonc with Species Diffusion and Convection Transport - 4/1 2/95~**** ***** ***** ***** *********************************************
cc Greg W. Gmurczykc SAIC C/O NISTc Building and Fire Research Laboratoryc Gaithersburg, MD 20899c phone: (301) 975-6888c ~ e-mail: gmurczyk @tiber.nist.govc**** ***** ***** ***** *********************************************
ccccccccccc
ccccccccccccccccccccc
List of Variables:
al - alfa (fuel moles)be - beta (halocarbon moles)beer - beta criticalga - gamma (oxygen moles)ni - nie (nitrogen moles)et - eta (hf moles)ph - phi (hcl moles)ep - epsylon (cof2 moles)dz - dzeta (COC12moles)de - delta (c02 moles)la - lambda (product h20 moles)
mu - miu (substrate h20 moles)q*i - inlet species volume flow (slpm)q* - outlet species volume flow (slpm)d*i - inlet species densities (kg/m3)d* - outlet species densities (kg/m3)m*i - inlet species mass flow (g/s)m* - outlet species mass flow (g/s)X*i - inlet species mole fractions (I/l)X* . outlet species mole fractions (1/1)Y*i - inlet species mass fractions (kg/kg)Y* - outlet species mass fractions (kg/kg)w* - species molecular mass (kg/kmole)*r - species consumed/generated in flame (slpm)*u - species unreacted in flame (slpm)roi - ro (inhibitor/oxygen( fuel) diff.coeff.rat.)row - ro (water/oxygen(fuel) diff.coeff.rat.)ron - ro (nitrogen/oxygen( fuel) diff.coeff.rat.)ros - ro (star)

I (). PREDICTIONOF HF DURINGSUPPRESSION 303
c ri - r (inhibitor/oxygen( fuel) flow rat.)c rw - r (water/oxygen(fuel) flow rat.)
c rn - r (nitrogen/oxygen( fuel) flow rat.)c a,b,c,d,e,f - a,b & c,d,e,f (fuel & inhibitor composition)c vm = 24.415 (l/mole)c si = 0.0 (standard case)c hl = 0.0 (low h2: la=O.0), 1.0 (high h2: ep=O.0, dz=O.0)c**** ***** ***** ***** *********************************************
cprogram coeffimplicit double precision (a-h,j-z)
ccommon /atom/ a,b,c,d,e,fcommon /coef/ al, be, becr,ga,de,ep,dz, ph,et,la,mucommon
&commoncommoncommoncommoncommon
&common
&commoncommoncommon
&common
&common
&common
&common
&common
&common
&common
&common
&commoncommon
c
Iwl wo2,wn2,wair,wc, wh,wf,wcl,wco2, wh20,whf,whcl,wcof2, wcoc12,wfu,win, wmi,wm
/rat/ ri,rw,roi,row,ros,hl,siIdifl do2n2,dfun2,dinn2,dh20n2/therm/ vm,lm3,p,t,ru,cmIqil qini,qh20i,qfui,qo2i,qn2i,qairi,qti,dqJdiJ dini,dfui,do2i,dn2i,dco2i,dh2oi,dhfi,dhcli,dcof2i,
dcocli,denmi,dmi/mi/ mini, mfui,mo2i,mn2i, mco2i,mh20i,mhfi, mhcli,mcof2i,
mcocli,mti/Xi/ Xini,Xh20i,Xfui,Xo2i,Xn2i/M/ Yini,Yh20i,Yfui, Yo2i,Yn2i/qr/ qinr,qfur,qo2r,qn2r,qco2r,qh2or,qhfr,qhclr,qcoflr,
qcoclr,qr/dr/ dinr,dfur,do2r,dn2r,dco2r,dh2or,dhfr,dhclr,dcof2r,
dcoclr,denmr,dmr/mr/ minr,mfur,mo2r, mn2r,mco2r,mh20r, mhfr,mhclr,mcof2r,
mcoclr,mtr/Xr/ Xinr,Xfur,Xo2r,Xn2r,Xco2r,Xh2or,Xhfr,Xhclr,Xcoflr,
Xcoclr/Yr/ Yinr,Yfur,Yo2r,Yn2r,Yco2r,Yh2or,Yhfr,Yhclr,Ycoflr,
YcoclrIql qin,qfu,qo2,qn2,qco2,qh20,qhf,qhcl,qcof2,qcoc12,qt
M/ din,dfu,do2,dn2, dco2,dh20,dhf,dhcl,dco f2,dcoc12,denm,dm
/m/ min,mfu,mo2,mn2, mco2,mh20,mhf,mhcl, mcof2,mcoc12,mt,mhffu
/n/ nin,nfu,no2,nn2, nco2,nh20,nhf,nhcl,ncof2,ncoc12,nt,nti,dn
/X/ Xin,Xfu,Xo2,Xn2,Xco2,Xh20,Xhf,Xhcl,Xcof2,Xcoc12/Y1 Yin, Yfu,Yo2,Yn2,Yco2, Yh20,Yhf,Yhc1,Yco f2,Ycoc12
open(unit= 1, file=’ i’, form=’ formatted’, status= ’old’ )

304 10. PREDICTIONOF HF DURINGSUPPRESSION
open(unit=2, file=’ o’, form= ’formatted’, status=’ unknown’)***************************************************************************
* input data* fuel andinhibitor composition* inlet species volume flows, flame configuration* inlet pressure and temperature**************************************************************************
read( 1,*) a,b,c,d,e,fread( 1,*) qinit,qh20i,qfui, qairi,si
G
qini=O,OdO5000 qini=qini+0.02dO* qinit
*
******inlet Pressure and*
ru=8313.OdOp=l .0d5t=298,0d0dmi=p/(ru*t)
*
temperature***************************************
******~~nversion fa~tOrS****************************************************
vm=24.415d0lm3=l.Od-3if(si) 1250,15,17
15al=l.OdOgoto 19
17ga=l.OdO*******s ecies molecular weights********************************************
P*
19w02=32.OdOwn2=28.0d0wair=29.0d0wc=12.OdOwh=l.OdOwf=19.OdOwcl=35.5d0wco2=44.OdOwh20=18.OdOwhf=20.OdOwhcl=36.5d0wcof2=66.OdOwcoc12=99.OdO
cwfu=a*wc+b* wh

10. PREDICTIONOF HF DURINGSUPPRESSION 305
win=c*wc+d*wh+e* wf+Fwcl*
***** *~pecie~ diffusion coefficient corrections* ****************************
do2n2=dsqrt((wo2+wn2)/(wo2*wn2))dfun2=dsqrt((wfu+wn2)/(wfu*wn2))if(win) 1250,1,2
1 dinn2=0.OdOgo to 3
2 dinn2=dsqrt((win+wn2)/(win*wn2))3 dh20n2=dsqrt((wh20+wn2)/(wh20*wn2))
*******inlet ~pe~ie~ mole fra~tions**** *************************************
*
qti=qini+qh20i+qfui+qairiqo2i=0.21dO*qairiqn2i=0.79dO*qairiXini=qini/qtiXh20i=qh20i/qtiXfui=qfui/qtiXairi=qairi/qtiXo2i=qo2i/qtiXn2i=qn2ilqti
*
******inlet species*
nti=qti/vmnini=qinihm
mole flows* ********************************************
nh20i=qh20i/vmnfui=qfuihmnairi=qairi/vmno2i=qo2i/vmnn2i=qn2ilvm
*******inlet species densities* **********************************************
wmi=Xini*win+Xh2 oi*wh20+Xfui*wfu+Xo2 i*wo2+Xn2i*wn2
denmi=dmi* wmidini=dmi*windfui=dmi*wfudh20i=dmi*wh20do2i=dmi*wo2dn2i=dmi*wn2dairi=dmi*wair
*******inlet species mass flow~***** *****************************************
mti=qti*denmi*lm3* 1.0d3/60.OdO

306 10, PREDICTIONOF HF DURINGSUPPRESSION
mini=qini*dini* lm3* 1.0d3/60.OdOmfui=qfui*dfui* lm3* 1.0d3/60.OdOmh20i=qh20i*dh20 i*lm3* 1.0d3/60.OdOmo2i=qo2i*do2i* lm3* 1.0d3/60.OdOmn2i=qn2i*dn2i* lm3* 1,0d3/60,0d0mairi=qairi*dairi *lm3 * 1.0d3/60.OdO
*******inlet ~pe~ie~ ma~~ fra~tion~****** ***********************************
*
Yini=Xini*winlwmiYfui=Xfui* wfulwmiYh20i=Xh20i*wh20/wmiYo2i=Xo2i* wo2/wmiYn2i=Xn2i*wn2/wmi
Yairi=Xairi* wair/wmi****** ***** ***** ***** ***** ************************************************** main computations**************************************************************************
* a) no inhibitor in the system**************************************************************************
if(si) 1250,4,5**************************************************************************** 1. standard case: with/without water, fuel inside, 02/n2 outside**************************************************************************
4rw=qh20ilqo2irow=dh20n2/do2n2if(qini) 1250,6,9
6callnoinsgoto 1300
*
5rw=qh20i/qfuirow=dh20n2/dfun2if(qini) 1250,7,9
7 call noinigoto’ 1350
***************************************************************************
* b) inhibitor in the system**************************************************************************
9if(si) 1250,50,650***************************************************************************
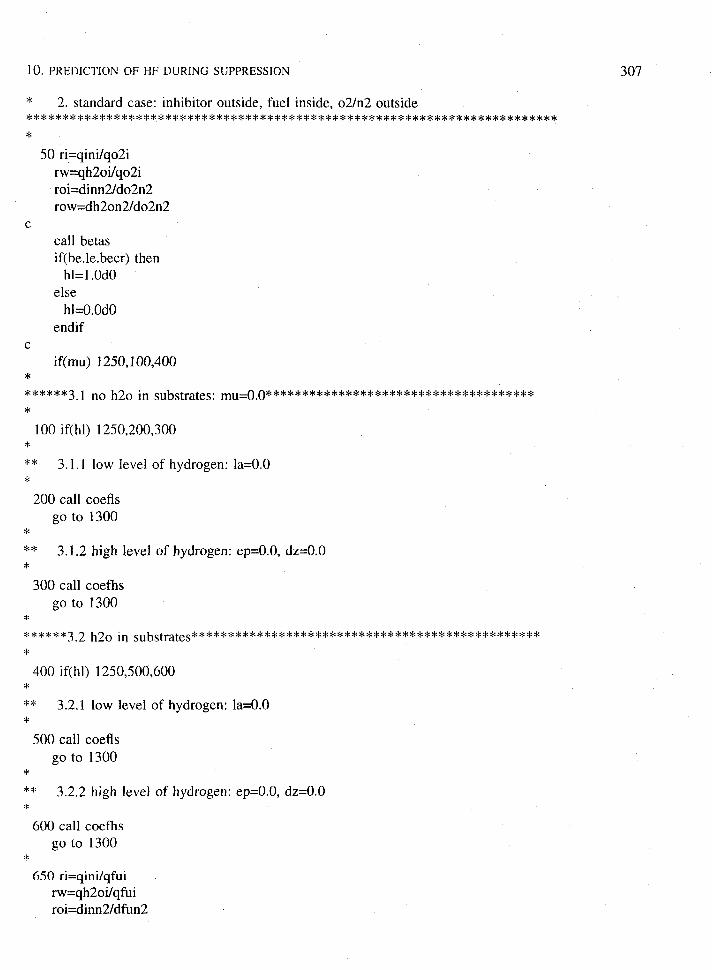
](). PREDICTIONOF HF DURING SUPPRESSION 307
* 2. standard case: inhibitor outside, fuel inside, 02/n2 outside***** ***** ***** ***** ***** *************************************************
50ri=qini/qo2irw=qh20i/qo2iroi=dinn2/do2n2row=dh20n2/do2n2
ccall betasif(be.le.beer) then
hl=l.OdOelse
hl=O.OdOendif
cif(mu) 1250,100,400
*******3 1 no h20 in substrates: ~u=O,O~*********~**~************************
100if(hl) 1250,200,300*** 3.1.1 lowlevel of hydrogen: la=O.O*
200callcoeflsgoto 1300
*** 3.1.2 high level of hydrogen: ep=O.0, dz=O.O*
300callcoefhsgoto 1300
*******3 2 h20 in ~ubstrates*************************************************
400if(hl) 1250,500,600*** 3.2.1 lowlevel of hydrogen: la=O.O*
500ca11coeflsgoto 1300
*
** 3.2.2 high level ofhydrogen: ep=O.O, dz=0.0*
600callcoefhsgoto 1300
*
650ri=qini/qfuirw=qh20i/qfuiroi=dinn2/dfun2

10. PREDICTIONOF HF DURINGSUPPRESSION308
c
c
*
row=dh20n2/dfun2
call betaiif(be.le.beer) then
hl=l .OdOelse
hl=O.OdOendif
if(nm) 1250,700,1000
******4 1 no h20 in substrates: ~u=O+O********* *****************************
700 if(hl) 1250,800,900*** 4.1.1 low level of hydrogen: la=O.O*
800 call coefligo to 1350
*** 4.1.2 high level of hydrogen: ep=O.0, dz=O.O*
900 call coefhigo to 1350
*******4 2 h20 in sub~trates*** **********************************************
1000 if(hl) 1250,1100,1200*** 4.2.1 low level of hydrogen: la=O.O*
1100 call coefli
go to 1350*** 4.2.2 high level of hydrogen: ep=O.0, dz=O.O*
1200 call coefhigo to 1350
c1250 write(*,*) ‘ ‘
write(2, *) ‘ ‘write(*, *) ‘ 1250 negative value ‘write(2,*) ‘ 1250 negative value ‘go to 1600
*******************%******************************************************** flowsofspeciesconsumed/generated inflame* flows of species unreacted

10. PREDICTIONOF HF DURINGSUPPRESSION 309
c
c
c
c
c
c
c
* outlet volume and mass flows, mole and mass fractions***** ***** ***** ***** ***** *************************************************
1300 qfur=qfuiqinr=qfur*be/alqo2r=qfur*ga/alqn2r=qfur*3.762dO*gaJalqco2r=qfur*de/alqh20r=qfur*(la-mu)/alqhfr=qfur*et/alqhclr=qfur*ph/alqcof2r=qfur*ep/alqcoclr=qfur*dz/al
qfuu=O.OdOqinu=qini-qinrqo2u=qo2i-qo2rqn2u=qn2i-qn2rqh20u=qh20i-qh20rqco2u=0.OdOqhfu=O.OdOqhclu=O,OdOqcof2u=0.OdOqcoclu=O.OdO
qin=qinuqfu=O.OdOqo2=qo2i-qo2rqn2=qn2iqh20=qh20i+qh20rqco2=qco2rqhf=qhfrqhcl=qhclr
qcof2=qcof2rqcoc12=qcoclr
call molef
call massf
call molefl
goto 1550
1350 q02r=qo2iqinr=qo2r*be/gaqfur=qo2r*al/gaqn2r=qn2i
310
qco2r=qo2r*de/gaqh20r=qo2r*(la-mu)/gaqhfr=qo2r*et/gaqhclr=qo2r*ph/gaqcof2r=qo2r*ep/gaqcoclr=qo2r*dzlga
cqinu=qini-qinrqfuu=qfui-qfurqo2u=0.OdOqn2u=0,0d0qh20u=qh20i-qh20rqco2u=0.OdOqhfu=O.OdOqhclu=O.OdOqcof2u=0.OdOqcoclu=O.OdO
cqin=qinuqfu=qfuuqo2=0.OdOqn2=qn2iqh20=qh20i+qh20rqco2=qco2rqhf=qhfrqhcl=qhclrqcof2=qcof2rqcoc12=qcoclr
ccall molef
ccall massf
ccall molefl
*
10. PREDICTION OF HF DURING SUPPRESSION
*************************************************************************** output data**************************************************************************
1550 write(*,*)’fu 02 in h20s C02 h20p hf hcl&cof2 coc12(coeff)’write(*,1500) al,ga,be,mu,de,la, et,ph,ep,dzwrite(2,*) ‘ fu 02 in h20s C02 h20p hf hc
&l cof2 coc12(coeff)’write(2,1500) al,ga,be,mu,de,la, et,ph,ep,dzwrite(*, *) ‘ qin qfu qo2 qn2 qco2 qh20 qhf qhcl ~
&qcof2qcoc12 (slpm)’write(*,1500) qin,qfu,qo2,qn2,qco2,qh20,qhf,qhcl,qcof2,qcoc12

1(). PREDICTION OF HF DURING SUPPRESSION 311
write(2,*) ‘ qin qfu qo2 qn2 qco2 qh20 qhf qhcl& qcof2 qcoc12 (slpm)’write(2,1 500) qin,qfu,qo2,qn2,qco2,qh20,qhf,qhcl,qcof2,qcoc12write(*,*) ‘ min mfu mo2 mn2 mco2 mh20 mhf mhcl
& mcof2 mcoc12 (g/s)’write(*, 1500) min,mfu,mo2,mn2, mco2,mh20,mhf,mhcl, mcof2,mcoc12write(2,*) ‘ min mfu mo2 mn2 mco2 mh20 mhf mhclwrite(2, 1500) min,mfu,mo2,mn2, mco2,mh20,mhf,mhcl, mcof2,mcoc12write(*,*) ‘ Xin Xfu X02 Xn2 XC02 Xh20 Xhf Xhcl
& xcof2 XCOC12’write(*, 1500) Xin,Xfu,Xo2,Xn2, Xco2,Xh20,Xhf,Xhcl, Xcof2,Xcoc12write(2, *) ‘ Xin Xfu X02 Xn2 XC02 Xh20 Xhf Xhcl
& xcof2 XCOC12’write(2, 1500) Xin,Xfu,Xo2,Xn2, Xco2,Xh20,Xhf,Xhcl,Xcof2,Xcoc12write(*,*) ‘ Yin Yfu Y02 Yn2 Yc02 Yh20 Yhf Yhcl
& Ycof2 YCOC12’write(*, 1500) Yln,Yfu,Yo2,Yn2, Yco2,Yh20,Yhf,Yhcl, Ycof2,Ycoc12write(2,*) ‘ Yln Yfu Y02 Yn2 Yc02 Yh20 Yhf Yhcl
& Ycof2 YCOC12’write(2, 1500) Yh,Yfu,Yo2,Yn2, Yco2,Yh20,Yhf,Yhcl, Ycof2,Ycoc12write(*, *) ‘ nin nfu no2 nn2 nco2 nh20 nhf nhcl
& ncof2 ncoc12 (mole/min)’write(*, 1500) nin,nfu,no2,nn2, nco2,nh20,nhf,nhcl, ncof2,ncoc12write(2,*) ‘ nin nfu no2 nn2 nco2 nh20 nhf nhcl
& ncof2 ncoc12(mole/min)’write(2, 1500) nin,nfu,no2,nn2, nco2,nh20,nhf,nhcl, ncof2,ncoc12
write(*, *) ‘ nt deltan qt dekaq mhffu ‘write(*, 1590) nt,dn,qt,dq,mhffuwrite(2,*) ‘ nt deltan qt deltaq mhffu ‘write(2, 1590) nt,dn,qt,dq,mhffu
cif(qini.lt.qinit) go .to 5000
c1400 format(6f7.4)1500 format(10f12.5)1590 format(5f8.4)
c1600 stop
end****** ***** ***** ***** ***** ************************************************** subroutines***** ***** ***** ***** ***** *************************************************
***** ***** ***** ***** ***** *************************************************
* a) standard case, no inhibitor - with/without water combustion products***** ***** ***** ***** ***** *************************************************

312
c
*
10. PREDICTION OF HF DURING SUPPRESSION
subroutine noinsimplicit double precision (a-h,j-z)common /atom/ a,b,c,d,e,f
common /coef/ al, be, becr,ga,de,ep,dz, ph,et,la,mucommon /rat/ ri,rw,roi,row,ros, hl,si
ga=al*(a+O.25dO*b)de=al*alal=rw*row*(a+O .25dO*b)la2=0.5dO*al*bla=lal+la2mu=rw*row*al*(a+O .25dO*b)
be=O,OdObecr=O.OdOet=O.OdOph=O.OdOep=O.OdOdz=O.OdOreturnend
**************************************************************************
* b) no inhibitor- with/withoutwater combustion products**************************************************************************
subroutine noiniimplicit double precision (a-h,j-z)common /atom/ a,b,c,d,e,fcommon /coef/ al, be, becr,ga,de,ep,dz, ph,et,la,mucommon /rat/ ri,rw,roi,row,ros, hl,si
cal=ga/(a+0.25dO*b)de=ga/(l.0dO+b/(4.0dO* a))mu=al*rw*rowbe=O.OdObecr=O.OdOet=O.OdOph=O.OdO
ep=O,OdOdz=O.OdOreturnend
**************************************************************************** a) standard case, hydrogen/halocarbon limit - with/without water*******************************+******************************************
subroutine betas

1(). PREDICTION OF HF DURING SUPPRESSION 313
implicit double precision (a-h,j-z)common /atom/ a,b,c,d,e,fcommon /coef/ al, be, becr,ga,de,ep,dz, ph,et,la,mucommon /rat/ ri,rw,roi,row,ros, hl,si
cbe 1=al*(4.0dO*a+b)be2=4.0dO/(roi*ri)be3=e+f-4.OdO*c-d
be=bel/(be2+be3)ros=(row*rw)/(roi *ri)mu=be*rosga=be/(ri*roi)be4=al*b+2.0dO*muif(e+f-d) 10,20,10
10 be5=e+f-dgo to 30
20 be5=e+f-d+0.01d030 becr=be4/be5
returnend
*
***** ***** ***** ***** ***** *************************************************
* b) hydrogen/halocarbon limit - with/without water**************************************************************************
subroutine betaiimplicit double precision (a-h,j-z)common /atorn/a,b,c,d,e,fcommon /coef/ al, be, becr,ga,de,ep,dz, ph,et,la,mu
common/ratlri,rw,roi,row,ros,hl,sic
bel=4.OdO*gabe2=4.OdO*c+d-e-fbe3=4.0dO*(a+b/4 .0dO)/(ri*roi)be=bel/(be2+be3)ros=(row*rw)/(roi*ri)mu=be*rosal= be/(ri*roi)be4=al*b+2.0dO*muif(e+f-d) 10,20,10
10 be5=e+f-dgo to 30
20 be5=e+f-d+0.01d030becr=be4/be5
returnend
**************************************************************************** inhibitor in - with/without water combustiordinhibition products
314 10. PREDICTIONOF HF DURING
* a) low hydrogen level**************************************************************************
subroutine coeflsimplicit double precision (a-h,j-z)common /atom/ a,b,c,d,e,fcommon /coef/ al, be, becr,ga,de,ep,dz, ph,et,la,mu
cla=O.OdOde=2.OdO*ga-al*a-be*c+muif(f. gt.O.OdO) then
ph 1=al*(O.5dO*b-a)
ph2=0.5dO*be*(d+f+2.OdO*mu-2.OdO*c-e)ph=de+phl+ph2dzl=al*(a-O.5dO*b)dz2=0.5dO*be*(2.OdO*c+e+f-2.OclO*mu-d)dz=0.5dO*(-de+dzl+dz2)
elseph=O.OdOdz=O.OdO
endifetl=al*(a+O.5dO*b)et2=0.5dO*becr*(2.OdO*c+d+e-2.OdO*mu-f)et3=-de+2.OdO* mu+etl+et2et=etep=et3-etreturnend
**************************************************************************** inhibitor in - with/without watercombustion/inhibition products* b) low hydrogen level**************************************************************************
subroutine coefliimplicit double precision (a-h,j-z)common /atom/ a,b,c,d,e,fcommon /coef/ al, be, becr,ga,de,ep,dz, ph,et,la,mu
cla=O.OdOde=2.OdO*ga-al*a-be*c+rnuif(f.gt.O.OdO) then
phl=al*(O.5dO*b-a)ph2=0.5dO*be*(d+f+2.OdO*mu-2.OdO*c-e)ph=de+phl+ph2dzl=al*(a-O.5dO*b)dz2=0.5dO*be*(2.OdO*c+e+f-2,0dO*mu-d)dz=0.5dO*(-de+dzl+dz2)
SUPPRESSION

1(). PREDICTION OF HF DURING SUPPRESSION 315
elseph=O.OdOdz=O.OdO
endifetl=al*(a+0,5dO*b)et2=0.5dO*becr* (2. 0dO*c+d+e-2.0dO* mu-f)et3=-de+2.0dO*mu+et 1+et2et=etep=et3-etreturnend
**************************************************************************** inhibitorin - with/without watercombustion/inhibition products* c) standard case, high hydrogen level*************************************************************************
*
subroutine coefhsimplicit double precision (a-h,j-z)common /atom/ a,b,c,d,e,fcommon /coef/ al, be, becr,ga,de,ep,dz, ph,et,la,mu
cep=O.OdOdz=O.OdOde=al*a+be*cph=be*fet=be*ela=2.0dO*ga-2.0dO*de+mureturnend
**************************************************************************** inhibitor in - with/without water combustion/inhibition products* d) high hydrogen level**************************************************************************
subroutine coefhiimplicit double precision (a-h,j-z)common /atom/ a,b,c,d,e,fcommon /coef/ al, be, becr,ga,de,ep,dz, ph,et,la,mu
cep=O.OdOdz=O.OdOde=al*a+be*cph=be*fet=be*ela=2.OdO*ga-2.OdO*de+mureturn

316 10. PREDICTIONOF HF DURINGSUPPRESSION
end**************************************************************************** outlet species mole flows**************************************************************************
subroutine moleflimplicit double precision (a-h,j-z)common/qilqini,qh20i,qfui,qo2i,qn2i,qairi,qti,dq
common/q/qin,qfu,qo2,qn2,qco2,qh2o,qhf,qhcl,qcof2,
& qcoc12,qt
common MXin,Xfu,Xo2,Xn2,Xco2,Xh2o,Xhf,Xhcl,Xcof2,Xcocl2common /therm/ vm,lm3,p,t,ru,cmcommon /n/ nin,nfu,no2,nn2, nco2,nh20,nhf,nhcl, ncof2,
& ncoc12,nt,nti,dnc
qt=qin+qfu+qh2o+qo2+qn2+qco2+qhf+qhcl+qcof2+qcocl2nt=qt/vmdn=nt-ntinin=qinlvmnfu=qfu/vmno2=qo2/vmnn2=qn2/vmnco2=qco2/vmnh20=qh20/vmnhf=qhflvmnhcl=qhcl/vmncof2=qcof2/vmncoc12=qcoc12/vmreturnend
**************************************************************************** outlet species mole fractions**************************************************************************
subroutine molefimplicit double precision (a-h,j-z)common /qiJqini,qh20i,qfui,qo2i,qn2i,qairi,qti,dqcommon /q/qin,qfu,qo2,qn2,qco2,qh20,qhf,qhcl,qcof2,
& qcoc12,qtcommon/NXin,Xfu,Xo2,Xn2,Xco2,Xh2o,Xhf,Xhcl,Xcof2,Xcocl2
cqt=qin+qfu+qh2o+qo2+qn2+qco2+qhf+qhcl+qcof2+qcocl2dq=qt-qtiXin=qinlqtXfu=qfulqtxo2=qo2/qt

1(). PREDICTION OF HF DURING SUPPRESSION 317
Xn2=qn2/qt
xco2=qco2/qtXh20=qh20/qtXhf=qhf/qtXhcl=qhcl/qtxcof2=qcof2/qtxcoc12=qcoc12/qtreturnend
**************************************************************************** outlet species mass fractions and flows**************************************************************************
subroutine massfimplicit double precision (a-h,j-z)common/therm/ vm,lm3,p,t,m,cmcommon/mi/mini,mfui,mo2i,mn2i,mco2i,ti2oi,tifi,ficli,mcofli,
& mcocli,mticommon/w/wo2,wn2,wair,wc,wh,wf,wcl,wco2,wh20,
& whf,whcl,wcof2,wcoc12,wfu,win,wmi,wm
common/WXin,Xfu,Xo2,Xn2,Xco2,Xh2o,Xhf,Xhcl,Xcof2,Xcocl2commonlY/Yin,Yfu,Yo2,Yn2,Yco2,Yh2o,Yhf,Yhcl,Ycof2,Ycocl2common /q/qin,qfu,qo2, qn2,qco2,qh20,qh f,qhcI,qcof2,
& qcoc12,qtcommon Id/ din,dfu,do2,dn2, dco2,dh20,dhf,dhcl, dcof2,
& dcoc12,denm,dmcommon /m/ min,mfu,mo2,mn2, mco2,mh20,mhf,mhcl, mcof2,
& mcoc12,mt,mhffuc
wm=Xin* win+ Xfu*wfu+Xo2* wo2+Xn2* wn2+Xco2*wco2+Xh20 *wh20+
& Xhf*whf+Xhcl*whcl+Xcof2 *wcof2+Xcoc12*wcoc12Yin=Xin*win/wmYfu=Xfu* wfu/wmYo2=Xo2*wo21wmYn2=Xn2*wn21wmYco2=Xco2*wco21wmYh20=Xh20*wh20/wmYhf=Xhf*whf/wmYhcl=Xhcl* whcl/wmYcof2=Xcof2*wco f21wmYcoc12=Xcoc12*wcoc12/wm
cqt=qin+qfu+qh2o+qo2+qn2+qco2+qhf+qhcl+qcof2+qcocl2mt=mtidm=mt/(qt*wm)min=qin*win*dmmfu=qfu* wfu*dm

$PJ-
318 1(). PREDICTION OF HF DURING SUPPRESSION
mo2=qo2*wo2*dmmn2=qn2*wn2*dmmco2=qco2* wco2*dmmh20=qh20*wh20*dmmhf=qhf* wh~dmmhcl=qhcl*whcl*dmmcof2=qcof2*wcof2 *dmmcoc12=qcoc12*wcoc12 *dm
cif(mfui.le.O.OdO) then
mhffu=O.OdOelse
mhffu=mhf/mfuiendif
creturnend