Prediction of shape distortions during forming and welding ...
15
ORIGINAL ARTICLE Prediction of shape distortions during forming and welding of a double-curved strip geometry in alloy 718 Lluís Pérez Caro 1,2 & Eva-Lis Odenberger 1,2 & Mikael Schill 3 & Joachim Steffenburg-Nordenström 4 & Fredrik Niklasson 4 & Mats Oldenburg 2 Received: 19 October 2019 /Accepted: 18 February 2020 /Published online: 18 March 2020 # Abstract The finite element method (FEM) has considerably contributed to the development of advanced manufacturing methods for metal structures. The prediction of the final shape of a component is of great interest to the manufacturing industry. The level of demand may increase due to multistage processes. Therefore, including all steps of the manufacturing chain in the simulations is a key to being successful. This has been done for a long time in the stamping industry, which involves sequences of forming, trimming, and springback. However, more complex manufacturing procedures that include assembling of formed parts with forgings and castings via welding have been modelled with simplifications, resulting in a reduced prediction accuracy. In the present study, a double-curved part manufactured from alloy 718 is formed at 20 °C and laser-welded using the bead-on-plate procedure. The coupling of different manufacturing analyses, including cold forming, trimming, result mapping, welding, cooling, and springback, is achieved using LS-DYNA. Additionally, the effect of adding a damage and failure model in the forming simulation is studied. The results of the forming analysis are used as inputs for the material model *MAT_CWM in the welding simulation. The anisotropic thermomechanical properties of alloy 718 are determined at temperatures up to 1000 °C. Encouraging agreement is found between the model predictions and the results of forming and welding tests. The findings underscore the importance of including the material history and accurate process conditions along the manufacturing chain to both the prediction accuracy of shape distortions, and to the potential of the industry. Keywords Forming . Welding . Alloy 718 . Shape distortions . Anisotropy . High temperature measurements 1 Introduction Virtual computer-aided engineering (CAE) tools have an in- creasing significance in the design and development of light- weight solutions in all kinds of industries. The ability to com- bine advanced materials and material states that constitute future lightweight components and designs will largely depend on the ability to model advanced material behaviour and virtu- ally evaluate special fabrication procedures to develop new manufacturing strategies. As illustrated in Fig. 1, the manufac- ture of static load-carrying aero-engine structures constitutes such an example, in which sheet metals are combined with * Lluís Pérez Caro [email protected] Eva-Lis Odenberger [email protected] Mikael Schill [email protected] Joachim Steffenburg-Nordenström [email protected] Fredrik Niklasson [email protected] Mats Oldenburg [email protected] 1 Division of Materials and Production, RISE IVF AB, Vällaregatan 30, SE-293 38 Olofström, Sweden 2 Division of Mechanics of Solid Materials, Luleå University of Technology, SE-971 87 Luleå, Sweden 3 DYNAmore Nordic AB, Brigadgatan 5, SE-587 58 Linköping, Sweden 4 GKN Aerospace Engine Systems Sweden, SE-461 38 Trollhättan, Sweden The International Journal of Advanced Manufacturing Technology (2020) 107:2967–2981 https://doi.org/10.1007/s00170-020-05118-y The Author(s) 2020, corrected publication 2020
Transcript of Prediction of shape distortions during forming and welding ...
ORIGINAL ARTICLE
Prediction of shape distortions during formingand welding of a double-curved strip geometry in alloy 718
Lluís Pérez Caro1,2& Eva-Lis Odenberger1,2 & Mikael Schill3 & Joachim Steffenburg-Nordenström4
&
Fredrik Niklasson4& Mats Oldenburg2
Received: 19 October 2019 /Accepted: 18 February 2020 /Published online: 18 March 2020#
AbstractThe finite element method (FEM) has considerably contributed to the development of advanced manufacturing methods formetal structures. The prediction of the final shape of a component is of great interest to the manufacturing industry. The level ofdemandmay increase due tomultistage processes. Therefore, including all steps of the manufacturing chain in the simulations is akey to being successful. This has been done for a long time in the stamping industry, which involves sequences of forming,trimming, and springback. However, more complex manufacturing procedures that include assembling of formed parts withforgings and castings via welding have been modelled with simplifications, resulting in a reduced prediction accuracy. In thepresent study, a double-curved part manufactured from alloy 718 is formed at 20 °C and laser-welded using the bead-on-plateprocedure. The coupling of different manufacturing analyses, including cold forming, trimming, result mapping, welding,cooling, and springback, is achieved using LS-DYNA. Additionally, the effect of adding a damage and failure model in theforming simulation is studied. The results of the forming analysis are used as inputs for the material model *MAT_CWM in thewelding simulation. The anisotropic thermomechanical properties of alloy 718 are determined at temperatures up to 1000 °C.Encouraging agreement is found between the model predictions and the results of forming and welding tests. The findingsunderscore the importance of including the material history and accurate process conditions along the manufacturing chain toboth the prediction accuracy of shape distortions, and to the potential of the industry.
Keywords Forming .Welding . Alloy 718 . Shape distortions . Anisotropy . High temperature measurements
1 Introduction
Virtual computer-aided engineering (CAE) tools have an in-creasing significance in the design and development of light-weight solutions in all kinds of industries. The ability to com-bine advanced materials and material states that constitute
future lightweight components and designs will largely dependon the ability to model advanced material behaviour and virtu-ally evaluate special fabrication procedures to develop newmanufacturing strategies. As illustrated in Fig. 1, the manufac-ture of static load-carrying aero-engine structures constitutessuch an example, in which sheet metals are combined with
* Lluís Pérez [email protected]
Eva-Lis [email protected]
Mikael [email protected]
Joachim Steffenburg-Nordenströ[email protected]
Fredrik [email protected]
Mats [email protected]
1 Division of Materials and Production, RISE IVFAB, Vällaregatan30, SE-293 38 Olofström, Sweden
2 Division of Mechanics of Solid Materials, Luleå University ofTechnology, SE-971 87 Luleå, Sweden
3 DYNAmore Nordic AB, Brigadgatan 5, SE-58758 Linköping, Sweden
4 GKN Aerospace Engine Systems Sweden, SE-46138 Trollhättan, Sweden
The International Journal of Advanced Manufacturing Technology (2020) 107:2967–2981https://doi.org/10.1007/s00170-020-05118-y
The Author(s) 2020, corrected publication 2020

forgings and castings via welding and subsequent heat treat-ments. The double-curved component is of special interest be-cause of the complexity in the manufacture and prediction ofshape distortions during the fabrication of each sub-assembly,which requires a combination of forming and welding.
Individual manufacturing procedures, such as cold formingand assembly via welding and heat treatment, have been stud-ied numerically to design suitable forming techniques orwelding sequences with the purpose of minimizing shape dis-tortions. Odenberger et al. [1] studied the compensation ofdeep-drawing prototype tools for springback in alloy 718sheets, leading to a significant reduction of lead time, whilemaintaining high accuracy of the predicted shape deviations.By considering the anisotropic plastic properties of alloy 718and including models for damage and failure, as Pérez Caroet al. [2] investigated, new suitable forming procedures havebeen developed. Additionally, thermomechanical finite ele-ment analyses (FEA) in studies on welding and heat treat-ments have greatly contributed to manufacturing processesin various industries. As outlined by Lindgren [3], the furtherdevelopment of the welding models has contributed to a betterrepresentation of the engineering applications in the past de-cades. For example, Lundbäck and Runnemalm [4] studiedthe effect of the electron-beam welding procedure on theshape distortions and residual stresses in alloy 718. Theirmodel was able to accurately predict the amount of residualstresses as well as the distribution of the shape deviations overthe parts. Fisk and Lundbäck [5] modelled repair welding andheat treatment in alloy 718. The predicted welding tempera-tures and residual stresses were in good agreement with theexperimental measurements. The effect of the welding fixtureon the experimental and predicted distortions during weldingwas addressed by Ma et al. [6].
Many studies have been conducted on the prediction ofshape distortions considering different combinations of theforming, welding, and heat treatment steps in a manufacturingprocess chain. Thomas et al. [7] predicted the springback andfinal shape of two different aluminium alloys in a manufactur-ing chain of forming and spot welding processes. Govik et al.[8] examined the springback behaviour of an assembly madeof DP600 in a manufacturing process consisting of formingand spot welding. Additionally, Berglund et al. [9] and Tersinget al. [10] studied the welding and heat treatment steps in an
industrial process involving martensitic stainless steel and Ti-6Al-4V components for the aero-engine industry, respectively.Schill and Odenberger [11] also investigated the possibility ofcombining different process simulations in the manufacturingchain of an aerospace component made of alloy 718. Themajor objective of this study was to develop methods forperforming coupled simulations using different FE codes rath-er than to evaluate the prediction accuracy.
Steffenburg-Nordenström and Larsson [12] considered amanufacturing chain including forming, welding, and heattreatment of a V-shaped leading edge of a vane manufacturedfrom alloy 718. They concluded that the history of the materialafter forming had a considerable effect on the amount of re-sidual stresses in the subsequent steps of the manufacturingprocess chain. Huang et al. [13] reported similar results inQ235 steel, concluding that the initial distortions fromforming can largely influence the buckling distortion duringwelding. Papadakis et al. [14] studied the influence of prelim-inary manufacturing processes, i.e. forming, trimming, andwelding, on the crash behaviour of automotive body assem-blies made of bake hardening and dual phase steels. The pre-dicted results from each step in the manufacturing chain, suchas residual stresses, strains, and element thicknesses, weretransferred into the next stage. They concluded that the pre-dicted energy absorption of the assembly decreased whenconsidering the history of the material from the preliminarysteps in the manufacturing chain. Bauer et al. [15] investigateda forming and welding process chain of a DC04 tube. Thetransfer of the material and mechanical properties betweenprocesses ensured an accurate prediction of shape distortions,weld bed size, and residual stresses.
Nevertheless, considerable resources are still spent on com-pensating the final structure for shape distortions that occurduring the welding and heat treatment procedures. These com-pensations are based on measurements performed after eachmanufacturing process step and are used to design suitablefixturing to accomplish welding of the different sub-assemblies that constitute the engine structure, see Fig. 1c.However, the influence from the prior manufacturing processsteps to the subsequent shape distortions in the next procedureshould not be neglected. To increase the prediction accuracyand to compensate the forming tooling virtually, the weldingsequence and fixturing are of utmost importance.
Fig. 1 a GP7000 turbine exhaust case (TEC) engine containing thestudied component. b The TEC is a static load-carrying aero-enginestructure consisting of 13 different sub-assemblies. c Detailed view of
one of the sub-assemblies, indicating the location of the double-curvedcomponent. d Strip geometry (courtesy of GKN Aerospace Sweden)
2968 Int J Adv Manuf Technol (2020) 107:2967–2981

In this study, a strip geometry extracted from a double-curved component manufactured from alloy 718 is analysed.The dimensions of the strip geometry are shown in Fig. 2. Aforming and trimming procedure at 20 °C is followed by laserwelding of the strip geometry clamped onto a fixture, resultmapping, cooling, and springback upon clamping release. TheFE analyses are performed using LS-DYNA. This FE meth-odology involves different types of solvers and makes it pos-sible to include the results from the forming analysis in thewelding analysis by mapping the results from the forming tothe welding element mesh, thereby providing a start state forwelding that includes the thinning, effective plastic strains,residual stresses, history variables, and obtained geometry af-ter forming. The material model *MAT_CWM is used for thewelding simulation through the welding graphical user inter-face (GUI) provided in LS-PrePost v4.5. This work aims toinvestigate the potential and applicability of the describedmethod to the industry, where the use of limited number oftests and available FE models is sufficient to predict the finalshape of the component with high accuracy.
The thermomechanical elastic and anisotropic plastic prop-erties of alloy 718 at temperatures up to 1000 °C are deter-mined and included. The forming analysis is modelled andsimulated at 20 °C using the three-dimensional (3D)-scannedforming tool geometry and the anisotropic Barlat et al. [16]Yld2000-2D material model. Forming and welding tests areperformed to produce a strip geometry in alloy 718 and pro-vide experimental data, which are used to compare the numer-ical predictions with the accumulative shape distortions andtemperatures during welding.
2 Experimental work
2.1 Material
The precipitation-hardenable nickel-based superalloy alloy718 (UNS N07718) is studied in this work. The specific batch
of alloy 718 is delivered in form of 2.6 mm thick sheets, andin the solution-annealed condition according to the SAEAMS5596 specification. Table 1 presents the chemical com-position of the alloy, as defined in the material certificate.
2.2 Material characterization tests
Uniaxial tension tests were performed in accordance with theSS-EN ISO 6892-1:2009 and SS-EN ISO 6892-2:2011 stan-dards at temperatures between 20 and 1000 °C. The specimenswere laser cut in the longitudinal (L), diagonal (D), and trans-verse (T) directions with respect to the rolling direction. Theedges of the specimens were gently grinded to minimize theheat effect from the laser cutting procedure. The tests wereconducted at two consecutive strain rates i.e. 0.0014 s−1 follow-ed by 0.004 s−1 up to a technical strain of 0.2% and untilfracture, respectively. Figure 3 shows the hardening curves. Astochastic pattern was applied on the surface of each specimen,and the deformations were continuously measured using thedigital image correlation (DIC) system ARAMIS™. The framerates were 12 and 4 Hz. The facet size/step of 19 × 15 pixelsdefined the spatial resolution of the DIC images, and it wasequivalent to an element size of 1 mm. Each specimen washeated up to the target temperature with help of an inductioncoil. The temperature at the centre of the surface of the elevatedtemperature specimens was constantly measured and loggedusing an infrared sensor calibrated at each target temperatureagainst a type K thermocouple with an accuracy of ± 1%.
Tests to determine the Young’s modulus (E) were per-formed in the L direction up to 700 °C via the impulse exci-tation technique (IET), where a vibration was induced in thespecimen by a mechanical impulse, and the damping of eachresonant frequency of the material was analysed [17]. TheYoung’s modulus at each target temperature was predictedusing simple linear regression, as presented in Fig. 4.Additionally, a silicon–rubber bulge test [18] was performedto determine the yield stress of the material for the balancedbiaxial stress state.
2.3 Validation tests
Forming and welding validation tests were performed to cor-relate the numerical predictions with the measured values.Emphasis was placed on the shape distortions after formingand welding, together with temperature measurements duringwelding.
2.3.1 Sheet metal forming and trimming
The stretch-forming procedure was designed to introduceplastic straining in the blank in order to reduce the amountof springback. The forming tests were performed using aFjällman hydraulic press with a pressing capacity of
Fig. 2 Dimensions of the strip geometry. All measurements are expressedin millimetres
Int J Adv Manuf Technol (2020) 107:2967–2981 2969

7000 kN. Preceding the forming test, the measurement of thebinder force was carried out using four calibrated load cellsplaced on the binder, at a forming velocity of 25 mm/s, up to avalue of 2534 kN. The draw-in of the two formed parts wasmeasured using a digital Vernier calliper and compared withthe predicted values from the forming simulations. The mea-sured draw-in was determined in the x and y directions, c.f.Figure 7, by measuring the distance from the tool edge to theblank as the blank was placed onto the binder and, in the sameway, at the closed stage of the forming tool at the end of theforming procedure. The drawbeads were modelled as physicaldrawbeads to capture the effect of the binder closure to thedraw-in. The strip geometry was extracted from the double-curved component via laser cutting. Four reference points,located at the outer edges of the formed part, were producedat the end of the forming procedure to ensure the correctplacement of the strip geometry during laser cutting.
Themeasured springback after forming was determined via3D scanning using the Zeiss T-SCAN CS equipment, follow-ed by a comparison of each part with the computer-aideddesign (CAD) nominal geometry. The reference points corre-spond to the same positions as the nodal constraints applied inthe springback analysis, see Fig. 5.
2.3.2 Laser welding
In the final step of the manufacturing chain, the strip geometrywas placed in a welding fixture consisting of an insulationmaterial that can resist high temperatures and loadings. Thecomponent was then clamped onto the fixture using 10 M8bolts (12.9) tightened to 40 Nm each. The contact between thebolts and the strip geometry was thermally insulated using
washers with a thickness of 4 mm and made of the samematerial as the welding fixture. The part was then laser-welded using the bead-on-plate procedure with help of anIPG Photonics laser source, which was performed directlyon the part without any filling material. A specific shieldinggas was used to protect the heat-affected zone and the moltenpool from contact with the atmosphere. The welding testswere performed by GKN Aerospace Engine SystemsSweden in Trollhättan. In the welding process, the materialwas heated above the melting temperature and fused togetherduring cooling. The temperatures during welding were mea-sured at five different positions along the welding path andlogged using type K thermocouples, as shown in Fig. 6. Thetemperature histories for the five positions are presented inFig. 15. The springback after welding was measured usingthe same procedure employed after forming.
3 Numerical procedure
The manufacturing process chain involves several steps, suchas sheet-metal forming, trimming, mapping of the results fromthe forming to the welding shell-element mesh, springback,welding, cooling, and final springback.
3.1 Sheet metal forming and trimming
The single-action forming process to manufacture a double-curved component in alloy 718 combines both stretch-forming and deep-drawing techniques in which no materialthat has passed through the drawbeads enters the actual com-ponent geometry. Such material is trimmed off after forming.
Fig. 3 Hardening curves for alloy718 at 20 °C in the L, D, and Tdirections. The flow curves atelevated temperatures are onlyreferenced to the L direction
Table 1 Chemical composition of the alloy 718 studied (wt%)
Ni Fe Cr Nb Mo Ti Al Co Mn Si Cu
53.86 18.47 17.78 5.05 2.88 1.05 0.48 0.15 0.07 0.07 0.03
V W C P B Ta Zr S Nb + Ta Ti + Al Ni + Co
0.03 0.02 0.019 0.008 0.004 < 0.01 < 0.01 < 0.0003 5.06 1.53 54.01
2970 Int J Adv Manuf Technol (2020) 107:2967–2981

The tool setup was modelled in Dynaform v5.9.3 andanalysed using the explicit solver in LS-DYNA R10.0.0[19]. Figure 7 illustrates the FE model, which consisted of apunch, a die comprising an inner and outer tool parts that actas one complete tool part, a binder, and a blank. The binderincluded physical drawbeads in order to control the flow of theblank. The whole model contained 137,807 shell elements and136,116 nodes. The total computational time was 7 h using 16cores. The tool parts were built using initial graphics exchangespecification (IGS) surfaces, and the drawbead heights anddraw depth were adjusted in the model according to the resultsobtained from 3D scanning of the physical forming tool sincethe drawbead heights were modified during testing to avoidopen fracture in one of the drawbeads.
The Barlat et al. [16] Yld2000-2D anisotropic yield criteri-on was used to model the forming procedure. The yield sur-face is described with eight anisotropic parameters, whichwere obtained through uniaxial tensile and bulge tests at20 °C. The obtained yield stresses and Lankford coefficientsin Table 2 were inputted into the material model. The corre-sponding yield function f can be described as follows:
f ¼ s1 − s2jm þ 2s2 þ s1j jm þ 2s1 þ s2j jm− 2σm¼ 0
��� ð1Þ
where σ is the effective stress, si are the principal deviatoricstresses, and m is a parameter that describes the shape of theyield surface. Following the recommendations from Barlatand Lian [20] for materials with a face-centred cubic crystalstructure (FCC), the parameter m is set as 8. To make an evenmore precise calibration of the shape edginess of the yieldsurface, additional tests to produce complementary referencepoints in the stress space are possible to conduct. However, theassumption of the yield surface exponent m equal to 8 foranisotropic materials has been proven valid in forming of sev-eral types of materials such as aluminium, nickel-base super-alloys, and titanium [1, 21, 22]. Also, it is desirable for theindustry to reach accurate modelling predictions while in-creasing the efficiency in the calibration of material modelsby using a minimal number of material tests.
Equation 1 can be linearly transformed using X =C ∙ s intothe following equation:
f ¼ C′0s1−C′0s2j jm þ 2C′0s2 þ C′0s1j jm þ 2C′0s1 þ C′0s2j jm−2σm¼ 0
ð2Þwhere the matrices C′ and C ′ ′ represent the linear transforma-tions, which can be expressed by the anisotropic parameterslisted in Table 2. The calibrated yield surface, initial yieldstresses, and Lankford coefficients in the L, D, and T direc-tions for alloy 718 at 20 °C are shown in Fig. 8.
The blank was modelled using 38,416 quadrilateral shellelements and 38,809 nodes. Each element was 4 mm in sizeand fully integrated (type 16) with seven through-thicknessintegration points. The h-adaptive method was used to auto-matically refine the mesh in areas with pronounced curvatureand, therefore, increase the accuracy of the forming simulationwhile reducing computational time. Three maximum levels of
Fig. 4 Experimental Young’smoduli for alloy 718 up to 700 °C
Fig. 5 Reference points and nodal constraints used in the springbackmeasurements
Int J Adv Manuf Technol (2020) 107:2967–2981 2971

refinement yielded elements to a minimum size of 1 mm inareas where needed, i.e. the drawbeads and regions withmarked draw radius. All tool surfaces were modelled as rigid.The die moved in the negative z-direction at a velocity of1000 mm/s during tool closure, i.e. when the drawbeads areformed, whereas the velocity was increased to 2000 mm/sduring the stretch-forming stage. The contact model betweenthe blank and the tools followed the Coulomb’s friction law.Figure 14 a and b illustrates the simulated draw-in at the finalstage of the forming procedure. The effect of adding the gen-eralised incremental stress-state dependent damage model(GISSMO) proposed by Pérez Caro et al. [2] for the simulateddraw-in was also studied, as shown in Fig. 14 c and d. TheGISSMO model assures that the effects of material failure,such as local thinning and strain localization, are capturedduring the forming procedure. The GISSMO model was cal-ibrated including regularization for the mesh refinement dur-ing the FE analysis [2]. Based on the difference between thepredicted and measured draw-ins for the two considered casesin Table 4, the friction coefficient was assumed 0.275, similarto previous results byWiklund and Larsson [23] using pin-on-disc tests. The procedure followed to estimate the value of the
friction coefficient has been previously applied in formingprocedures in titanium [22] and nickel-base superalloys [1].
After forming, a strip geometry was cut out using a 3Dlaser cutting procedure. The heat effect from the laser wasattenuated after mildly grinding the outer edges of the testspecimens. The trimming simulation was set up inDynaform v5.9.3 with mesh refinement along the trimmingedges. Figure 9 shows the formed blank with the trim line usedto trim the blank and create the surfaces for remeshing beforethe welding analysis. The predicted and measured shape de-viations after forming and trimming are illustrated in the re-sults section, see Figs. 17a and 18.
3.2 Mapping of results from forming to weldingelement mesh
The mapping from the shell element mesh used in the forminganalysis to the structured shell element mesh used in thewelding analysis was performed using the mapping function-ality in LS-PrePost v4.5. Figure 10 depicts the differentmeshes used. The forming mesh of the strip geometrycontained 6,331 elements and 7,321 nodes. The density of
Fig. 6 Welding test setup.Illustration of the formed andwelded alloy 718 strip geometryattached in the welding fixture.The thermocouples are used tomeasure and log the temperaturesat five different positions: T1 toT5. The arrow indicates thedirection of the welding laserbeam
Fig. 7 FE tool setup with adetailed view of the mesh of theblank
2972 Int J Adv Manuf Technol (2020) 107:2967–2981

the mesh for the welding analysis was increased along thewelding path, with a minimum size of 1 mm for the shellelements. The welding mesh then consisted of 16,539 ele-ments and 16,475 nodes. The element type and number ofintegration points were preserved, and the initial stresses, shellthicknesses, and effective plastic strains were mapped to thenewmesh, which included the nodal positions that correspondto the five thermocouples used to measure temperatures dur-ing welding, as shown in Fig. 6.
After mapping, the springback analysis was performedusing the implicit method in LS-DYNA along with the nodalconstraints in Fig. 5.
3.3 Welding
In the welding process, the material was heated above themelting temperature (1260–1336 °C) [24] and fused togetherduring cooling. This was modelled using a coupled implicitthermal and mechanical solver in combination with a stag-gered approach, where the two solvers exchange results,allowing the two physical fields to affect each other. The totalcomputational time was 50 min using 16 cores. As presentedby Schill et al. [25], the setup for the welding analysis wasconstructed using the GUI for welding simulation available inLS-PrePost v4.5. The welding procedure was modelled usingthermal and mechanical boundary conditions in accordancewith the performed welding tests.
The mechanical model included the part with the weldingmesh obtained after mapping. The welding fixture wasmodelled as rigid, and nodal constraints were used in the z-direction to simulate the clamping of the formed alloy 718component, as shown in Figs. 6 and 11. The clamping forceapplied to each M8 12.9 bolt on the fixture prior to weldingwas assumed to be 29 kN applying a momentum of 40 Nm[26]. The applied force in the welding test is way above thesummarized axial force of the restricted nodes, see Fig. 11,which reached a maximum value of 859 N during the FEanalysis. Both the thermal and mechanical contacts betweenthe part and the fixture were included in the analysis. In the FEanalyses, the welding laser beammoved toward the positive y-direction and followed the welding path.
The nonlinear implicit solver was used with a fixedtimestep determined by the element length and weldspeed. The timestep was advanced once per two elements
Table 2 Experimental input data for alloy 718 at 20 °C. The initial yieldstresses (σ in MPa) and Lankford coefficients (R) in the L, D, and Tdirections are based on the E-moduli from the IET tests. The eightanisotropic parameters (αi) for the Barlat material model are also included
σL σD σT σbiaxial RL RD RT Rbiaxial502.43 489.87 480.56 538.00 0.761 0.912 0.960 1.0000
α1 α2 α3 α4 α5 α6 α7 α8
0.8693 1.1190 0.8083 0.9929 0.9859 0.8372 1.0010 1.1580
Fig. 9 Formed blank with the trim line (in red) used to trim the blank andobtain the strip geometry for remeshing before the welding analysis
Int J Adv Manuf Technol (2020) 107:2967–2981 2973
Fig. 8 a Calibrated yield surface for alloy 718 at 20 °C for various shear stress values (0 and 0.5), with experimental reference points from uniaxial andbiaxial tests. b Predicted and experimental initial yield stresses (σ) and Lankford coefficients (R) for the L, D, and T directions

in the welding GUI. The thermo-elastoplastic materialmodel *MAT_CWM was used for the welding simula-tions in LS-DYNA. Based on the isotropic von Misesyield criterion with linear hardening available in LS-DYNA for welding simulations, the material has severalwelding capabilities, e.g. ghost and annealing functional-ities. For ghost elements, the material has negligible ther-mal and mechanical properties until it is activated at aspecified user-defined temperature. This is convenientfor distinguishing between the three different materialstates: (i) solid—the material is always solid or a weldpass that has been previously activated; (ii) liquid—thematerial is in a ghost state but will be activated duringthe current weld pass; and (iii) ghost—the material that isnot activated during the current weld pass but can beactivated in a subsequent pass. In this study, no ghostmaterial state was used, owing to the lack of filling ma-terial during the welding process. The annealing function-ality is intended to simulate a limiting temperature range,i.e. 927–982 °C, where the material behaves as an idealelastic-plastic but with no evolution of plastic strains.
Thus, both the back stresses and effective plastic strainsare set as zero. *MAT_CWM also includes a temperature-dependent thermal expansion coefficient.
The thermal weld part was modelled using thick thermalshell elements with a convection-to-air boundary condition,and a constant heat transfer coefficient of 20 W/m2K for theshielding gas. The thick thermal shell element allows for aquadratic variation of the temperature along the thickness ofthe shell. The insulation material for both the welding fixtureand washers was considered to have a thermal conductivity of0.71 W/mK. Each washer was assumed a heat transfer coeffi-cient of 177.5W/m2K. The thermal contact between the blankand the welding fixture was utilized by modelling the fixtureusing thick thermal shell elements with the convection appliedon the lower surface to represent the fixture thickness, asshown in Fig. 11. Hence, the heat transfer coefficient of thewelding fixture was assumed to 28.4 W/m2K. Thetemperature-dependent data used as the input to the*MAT_CWM, as illustrated in Fig. 12, were obtained fromthe simulation software JMatPro®-V9 for the specific chem-ical composition of alloy 718, c.f. Table 1. Varying
Fig. 11 FE setup of the weldinganalysis with the mechanicalnodal constraints in the z-direction (in red) and the weldingpath (in yellow). The uppersurface of the welding fixture incontact with the strip geometry isincluded, c.f. Figure 6. Theopening in the centre of the fixtureensures that the shielding gascovers the entire length of thewelding path. The direction of thewelding laser beam is indicatedby an arrow
Fig. 10 Forming (left) andwelding (right) meshes used in theFE analyses
2974 Int J Adv Manuf Technol (2020) 107:2967–2981
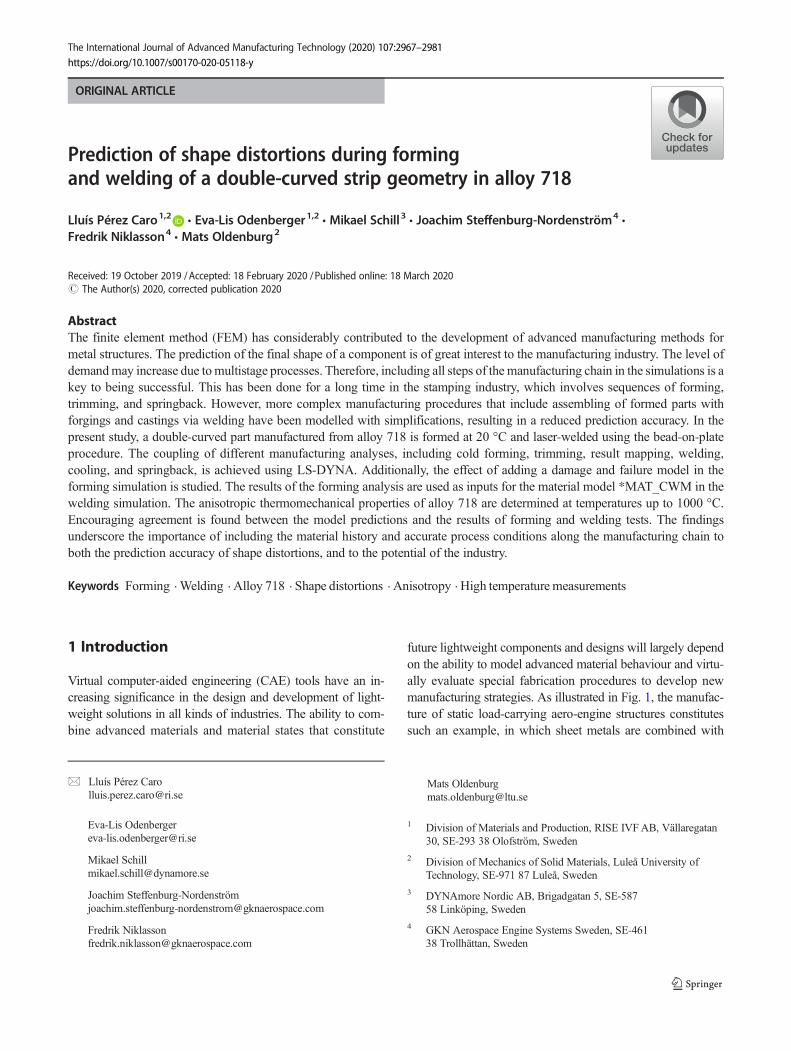
temperature dependency of the Young’s modulus can be foundin literature for alloy 718 [27, 28]; hence, the authors apply theIET values up to 700 °C and the JMatPro®-V9 predictedvalues at higher temperatures in which the chemical compo-sition of the specific batch of alloy was considered. The ten-dency of the change of the Young’s modulus with temperatureis similar to Fukuhara and Sanpei [27]. The Goldak et al. [29]double-ellipsoid model was used for modelling the heatsource, in which a volumetric heat load is applied to a volume
with an elliptic shape, as shown in Fig. 13. Based on theexperiments, the parameters of the Goldak double ellipsoidpresented in Table 3 were chosen to accurately mimic the laserweld heat source [5]. The weld speed in the analysis was13.3 mm/s under an applied weld power of 2.5 kW, assumingan efficiency factor that accurately predicts the measured tem-perature history of the five thermocouples at different dis-tances from the weld groove. The thermal solution was im-plicit, with the same fixed timestep as the mechanical solution.
4 Results and discussion
The effective plastic strains from each hardening curve foralloy 718 shown in Fig. 3 correspond to the small area ofthe specimen with the highest strain levels before failure.
0.0E+00
5.0E-06
1.0E-05
1.5E-05
2.0E-05
2.5E-05
3.0E-05
0 300 600 900 1200 1500
The
rmal
exp
ansi
on c
oeff
icie
nt
[K−1
]
Temperature [°C]
0
100
200
300
400
500
600
700
800
0 300 600 900 1200 1500
Spec
ific
hea
t [J
/kgK
]
Temperature [°C]
0
0.1
0.2
0.3
0.4
0.5
0.6
0 300 600 900 1200 1500
Poi
sson
's r
atio
Temperature [°C]
0
5
10
15
20
25
30
35
0 300 600 900 1200 1500
The
rmal
con
duct
ivit
y [W
/mK
]
Temperature [°C]
0
50000
100000
150000
200000
250000
0 300 600 900 1200 1500
You
ng's
mod
ulus
[M
Pa]
Temperature [°C]
IET tests
JMatPro
(a)
(c)
(b)
(d)
(e)
Fig. 12 Thermomechanicalproperties of alloy 718 in thewelding FE analysis. a Thermalexpansion coefficient. b Specificheat. c Poisson’s ratio. d Thermalconductivity obtained fromJMatPro®-V9. e The E-moduli attemperatures exceeding 700 °C.The experimental E-moduli fromthe IET tests from 20 to 700 °Care shown in Fig. 4
Heat flux [W/mm3]Z
Y
X
Fig. 13 Goldak double-ellipsoid heat source [25]. The parameters ar, af,b, and c are presented in Table 3
Table 3 Parameters applied for the Goldak double-ellipsoid heat sourcemodel
Q (W) ar (mm) af (mm) b (mm) c (mm)
2500 5.80 2.30 2.50 2.84
Int J Adv Manuf Technol (2020) 107:2967–2981 2975

The E-moduli measured and predicted via the IET presentedin Fig. 4 were used as a reference for determining the initialyield stresses at each temperature. In order to obtain suitableinput data for the FE simulations, the hardening curves weresmoothed using a user-defined code in MATLAB R2014b.
Figure 14 shows the simulated draw-in at the final stage of theforming procedure, both without and considering the GISSMOmodel. The predicted and measured draw-ins from the formingtests are presented in Table 4. The use of the GISSMO yieldedmarginally lower predicted draw-ins in all directions except forY2, where the predicted draw-in was 30.43% higher than that inthe case without the GISSMO model. This corresponds to thesame drawbead region where microcracks and open fractures aredetected in the forming tests at 20 °C. The predicted draw-insconsidering the GISSMO model were closest to the measuredvalues for both parts in all testing directions, except for X2 in part1, see Table 4. Hence, only the formed GISSMO geometry wasconsidered in the subsequent stages in themanufacturing processchain.
Figure 15 presents a comparison between the measured andsimulated temperatures at the five thermocouples during thewelding tests. The predicted temperatures correlated well withthe measured values close to the weld source, i.e. T1, T2, andT5. Small deviations were observed further from the weldsource, i.e. T3 and T4. However, the resulting temperaturescorrelated well after some time.
The predicted effective plastic strains for all the steps of themanufacturing chain are presented in Fig. 16. The maximumstrain levels in the formed part with the GISSMO model were
2.63% higher than those without it, as shown in Fig. 16a. Asstated previously in this section, the results regarding the stripgeometry are based on the forming simulation coupled withthe GISSMO model. Previous work by Pérez et al. [2] showsthe use of the GISSMO model in a forming simulation of adouble-curved component when the presence of microcracksin some of the drawbeads could not be predicted using aforming limit diagram (FLD). Themapping of the results fromthe forming mesh in Fig. 16b to the welding mesh in Fig. 16cshows a marginal increase of 0.40% in the overall strain levelsin the part. The welding, cooling, and subsequent springbackincreased the global effective plastic strains in the strip geom-etry by up to 3.28%, as shown in Fig. 16d.
Figure 17a shows the predicted shape deviation afterforming, trimming, and mapping. The corresponding re-sults after welding, cooling, and springback are depicted
Fig. 14 Predicted draw-in at thefinal stage of the formingprocedure (a, b) without and (c, d)including the GISSMO model.All measurements are expressedin millimetres
Table 4 Predicted andmeasured draw-ins in the directions X1 (left), X2(right), Y1 (up), and Y2 (down) on the formed sheet. All measurementsare expressed in millimetres
Draw-in directions
X1 X2 Y1 Y2
Predicted Forming 9.20 − 9.02 16.97 − 10.06Forming + GISSMO 9.18 − 8.82 16.80 − 13.12
Measured Part 1 8.43 − 9.37 16.74 − 12.48Part 2 8.29 − 8.51 16.52 − 12.02
2976 Int J Adv Manuf Technol (2020) 107:2967–2981

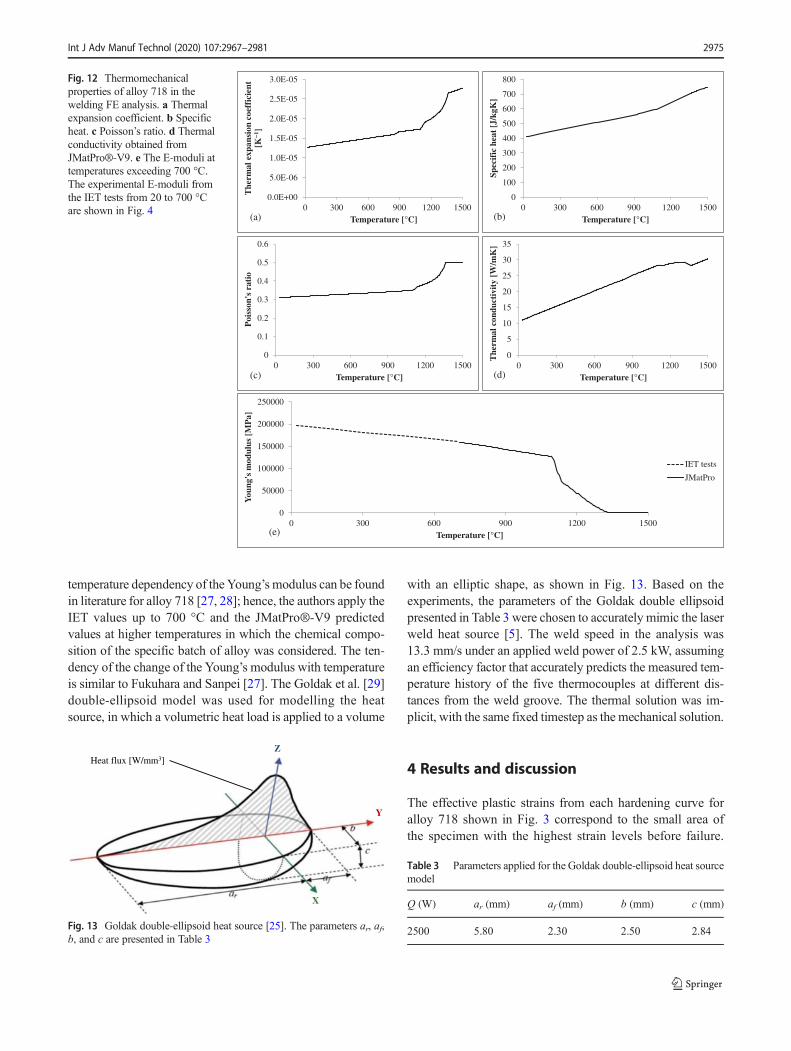
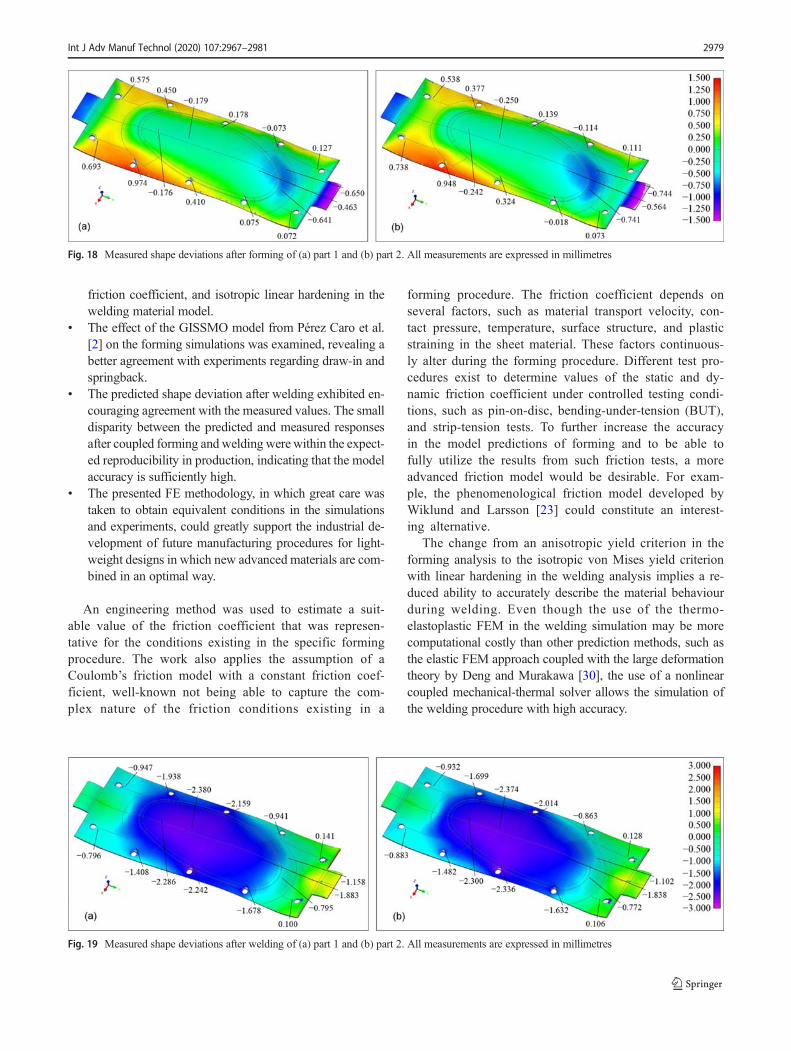
in Fig. 17b. For comparison purposes, the measuredshape deviations after experimental forming and weldingtests for the two parts are presented in Figs. 18 and 19,respectively. It is clear that the welding procedure,clamped with industry-like boundary conditions, intro-duces additional shape distortions in the parts. The ma-jor shape distortions originate from the effect of theheat source, melting the material as it progressivelymoves along the strip geometry, and altering the stressstate in the part. Naturally, the fixturing will affect theamount of shape distortions obtained during welding. Inthis work, the purpose was not to identify an optimalfixturing design or welding strategy. Instead, the aimwas to investigate if the shape distortions obtained fromthe welding experiments could accurately be predictedusing FE analyses.
The distribution and magnitude of the experimentalshape deviations of the two strip geometries were con-formable with only minor deviance between the formedparts. In addition, the deviation in the measured draw-inafter the forming of the two parts presented in Table 4 canbe considered as small. The results of the forming
simulation in Fig. 17a show the same tendencies of thedistribution and magnitude as the experimental shape de-viations of the two strip geometries depicted in Fig. 18.The closest agreement was observed at both the centreand right areas of the strip geometries, with a maximumdeviation of < 0.5 mm. The slight difference between thesimulated and experimental shape deviations afterforming may be within the expected reproducibility inthe industrial fabrication procedure. The protruding ear-shaped geometries at the short ends of the parts exhibitedlarger deviations. However, these extensions were onlyused as the start and stop positions for the welding laserbeam and were removed after the welding procedure.
As illustrated in Fig. 19, the subsequent welding pro-cedure in the manufacturing chain introduces greatershape distortions in the parts. The predicted springbackafter welding in Fig. 17b captures the overall tendencyof both the distribution and amount of shape distortions,especially in the central area of the strip geometries. Inthis case, the maximum difference between the simulatedand experimental shape deviations after welding was <1 mm. The protruding areas exhibited larger deviations,
0
50
100
150
200
250
300
0 1200 2400 3600
Tem
pera
ture
[°C
]
Time [s]
T1_measured
T1_predicted
0
50
100
150
200
250
300
0 1200 2400 3600
Tem
pera
ture
[°C
]
Time [s]
T2_measured
T2_predicted
0
50
100
150
200
250
300
0 1200 2400 3600
Tem
pera
ture
[°C
]
Time [s]
T3_measured
T3_predicted
0
50
100
150
200
250
300
0 1200 2400 3600
Tem
pera
ture
[°C
]
Time [s]
T4_measured
T4_predicted
0
50
100
150
200
250
300
0 1200 2400 3600
Tem
pera
ture
[°C
]
Time [s]
T5_measured
T5_predicted
(a) (b)
(c) (d)
(e)
Fig. 15 Measured and predictedtemperature histories duringwelding at the followingpositions. a T1. b T2. c T3. d T4.e T5
Int J Adv Manuf Technol (2020) 107:2967–2981 2977

similar to those after the forming process. The discrepan-cy between simulations and measurements in the finalgeometry of a welded component was analysed byHuang et al. [13] in terms of the residual stresses presentin the material from the rolling process. However, no re-sidual stresses were assumed to be present in the materialstudied in this work prior forming. The stress state of thematerial after forming was used as initial stage in thewelding simulation. The effect of phase transformationon the welding distortions in alloy 718 was not consideredin this work.
5 Conclusions
In the present study, the history from the sheet-metal formingprocedure was used as the input for the subsequent welding ofa double-curved strip geometry in alloy 718. The major find-ings are listed as follows:
& Both the tendencies and magnitudes of the shape distor-tions of the forming and welding processes were wellcaptured despite the simplicity in the calibration of theanisotropic yield criterion, estimation of the Coulomb’s
Fig. 17 Predicted shape deviations (a) after forming and (b) after welding. All measurements are expressed in millimetres
Fig. 16 a Comparison of theeffective plastic strains on theformed blank without (left) andincluding (right) the GISSMOdamage model. The strain fieldsat the other stages of themanufacturing chain, i.e. b afterforming and trimming, c aftermapping and springback, and dafter welding, cooling, and finalspringback, are based on theresults for the formed part withthe GISSMO model
2978 Int J Adv Manuf Technol (2020) 107:2967–2981
friction coefficient, and isotropic linear hardening in thewelding material model.
& The effect of the GISSMO model from Pérez Caro et al.[2] on the forming simulations was examined, revealing abetter agreement with experiments regarding draw-in andspringback.
& The predicted shape deviation after welding exhibited en-couraging agreement with the measured values. The smalldisparity between the predicted and measured responsesafter coupled forming and welding were within the expect-ed reproducibility in production, indicating that the modelaccuracy is sufficiently high.
& The presented FE methodology, in which great care wastaken to obtain equivalent conditions in the simulationsand experiments, could greatly support the industrial de-velopment of future manufacturing procedures for light-weight designs in which new advanced materials are com-bined in an optimal way.
An engineering method was used to estimate a suit-able value of the friction coefficient that was represen-tative for the conditions existing in the specific formingprocedure. The work also applies the assumption of aCoulomb’s friction model with a constant friction coef-ficient, well-known not being able to capture the com-plex nature of the friction conditions existing in a
forming procedure. The friction coefficient depends onseveral factors, such as material transport velocity, con-tact pressure, temperature, surface structure, and plasticstraining in the sheet material. These factors continuous-ly alter during the forming procedure. Different test pro-cedures exist to determine values of the static and dy-namic friction coefficient under controlled testing condi-tions, such as pin-on-disc, bending-under-tension (BUT),and strip-tension tests. To further increase the accuracyin the model predictions of forming and to be able tofully utilize the results from such friction tests, a moreadvanced friction model would be desirable. For exam-ple, the phenomenological friction model developed byWiklund and Larsson [23] could constitute an interest-ing alternative.
The change from an anisotropic yield criterion in theforming analysis to the isotropic von Mises yield criterionwith linear hardening in the welding analysis implies a re-duced ability to accurately describe the material behaviourduring welding. Even though the use of the thermo-elastoplastic FEM in the welding simulation may be morecomputational costly than other prediction methods, such asthe elastic FEM approach coupled with the large deformationtheory by Deng and Murakawa [30], the use of a nonlinearcoupled mechanical-thermal solver allows the simulation ofthe welding procedure with high accuracy.
Fig. 19 Measured shape deviations after welding of (a) part 1 and (b) part 2. All measurements are expressed in millimetres
Fig. 18 Measured shape deviations after forming of (a) part 1 and (b) part 2. All measurements are expressed in millimetres
Int J Adv Manuf Technol (2020) 107:2967–2981 2979

Acknowledgements Open access funding provided by Lulea Universityof Technology. The support from GKN Aerospace Sweden AB, ITEFabriks AB, VINNOVA - Swedish Governmental Agency forInnovation Systems NFFP6 program for SME, Swedish Armed Forces,and Swedish Defence Materiel Administration is gratefully appreciated(grant no. 2013-01173).
Funding information This study was funded by VINNOVA – SwedishGovernmental Agency for Innovation SystemsNFFP6 program for SME,Swedish Armed Forces, and Swedish Defence Materiel Administration(grant number 2013-01173).
Compliance with ethical standards
Conflict of interest The authors declare that they have no conflict ofinterest.
Open Access This article is licensed under a Creative CommonsAttribution 4.0 International License, which permits use, sharing, adap-tation, distribution and reproduction in any medium or format, as long asyou give appropriate credit to the original author(s) and the source, pro-vide a link to the Creative Commons licence, and indicate if changes weremade. The images or other third party material in this article are includedin the article's Creative Commons licence, unless indicated otherwise in acredit line to the material. If material is not included in the article'sCreative Commons licence and your intended use is not permitted bystatutory regulation or exceeds the permitted use, you will need to obtainpermission directly from the copyright holder. To view a copy of thislicence, visit http://creativecommons.org/licenses/by/4.0/.
References
1. Odenberger EL, Jansson M, Thilderkvist P, Gustavsson H,Oldenburg M (2008) A short lead time methodology for design,compensation and manufacturing of deep drawing tools for Inconel718. Olofström, Sweden. Proceedings of the IDDRG 2008 confer-ence: best in class stamping. 1-12
2. Pérez Caro L, Schill M, Haller K, Odenberger EL, Oldenburg M(2019) Damage and fracture during sheet-metal forming of alloy718. Int J Mater Form 12:1–14. https://doi.org/10.1007/s12289-018-01461-4
3. Lindgren LE (2001) Finite element modeling and simulation ofwelding. Part 1-3. J Therm Stress 24:141–192. https://doi.org/10.1080/01495730150500442
4. Lundbäck A, Runnemalm H (2005) Validation of three-dimensional finite element model for electron beam welding ofInconel 718. Sci Technol Weld Join 10:717–724. https://doi.org/10.1179/174329305X48347
5. Fisk M, Lundbäck A (2012) Simulation and validation of repairwelding and heat treatment of an alloy 718 plate. Finite ElemAnal Des 58:66–73. https://doi.org/10.1016/j.finel.2012.04.002
6. Ma N, Huang H, Murakawa H (2015) Effect of jig constraint posi-tion and pitch on welding deformation. J Mater Process Technol221:154–162. https://doi.org/10.1016/j.jmatprotec.2015.02.022
7. Thomas D, Galbraith C, Bull M, Finn M (2002) Prediction ofspringback and final shape in stamped automotive assemblies:comparison of finite element predictions and experiments. Paris,France. Proceedings of the International body engineering confer-ence and exhibition and automotive and transportation technologycongress. https://doi.org/10.4271/2002-01-2063
8. Govik A, Nilsson L, Moshfegh R (2012) Finite element simulationof the manufacturing process chain of a sheet metal assembly. J
Mater Process Technol 212:1453–1462. https://doi.org/10.1016/j.jmatprotec.2012.02.012
9. Berglund D, Alberg H, Runnemalm H (2003) Simulation ofwelding and stress relief heat treatment of an aero engine compo-nent. Finite Elem Anal Des 39:865–881. https://doi.org/10.1016/S0168-874X(02)00136-1
10. Tersing H, Lorentzon J, Francois A, Lundbäck A, Babu B, BarbozaJ, Bäcker V, Lindgren LE (2012) Simulation of manufacturingchain of a titanium aerospace component with experimental valida-tion. Finite Elem Anal Des 51:10–21. https://doi.org/10.1016/j.finel.2011.10.002
11. Schill M, Odenberger EL (2014) Simulation of residual deforma-tion from a forming and welding process using LS-DYNA®.Detroit, USA. Proceedings of the 13th International LS-DYNAusers conference
12. Steffenburg-Nordenström J, Larsson M (2014) Simulation of theinfluence of forming on residual stresses and deformations afterwelding and heat treatment in alloy 718. Barcelona, Spain.Proceedings of the 11th World congress on computational mechan-ics / 5th European conference on computational mechanics / 6th
European conference on computational fluid dynamics. 1657-166613. Huang H, Yin X, Feng Z, Ma N (2019) Finite element analysis and
in-situ measurement of out-of-plane distortion in thin plate TIGwelding. Materials 12:141–158. https://doi.org/10.3390/ma12010141
14. Papadakis L, Schober A, Zaeh MF (2013) Numerical investigationof the influence of preliminary manufacturing processes on thecrash behaviour of automotive body assemblies. Int J Adv ManufTechnol 65:867–880. https://doi.org/10.1007/s00170-012-4224-y
15. Bauer A, Manurung YHP, Sprungk J, Graf M, Awiszus B,Prajadhiana K (2019) Investigation on forming-welding processchain for DC04 tube manufacturing using experiment and FEMsimulation. Int J Adv Manuf Technol 102:2399–2408. https://doi.org/10.1007/s00170-019-03320-1
16. Barlat F, Brem JC, Yoon JW, Chung K, Dick RE, Lege DJ et al(2003) Plane stress yield function for aluminium alloy sheets – part1: theory. Int J Plast 19:1297–1319. https://doi.org/10.1016/S0749-6419(02)00019-0
17. IMCE (2017) RFDA professional. https://www.imce.eu/products/rfda-professional. Accessed 20 March 2019
18. Sigvant M, Mattiasson K, Vegter H, Thilderkvist P (2009) A vis-cous pressure bulge test for the determination of a plastic hardeningcurve and equibiaxial material data. Int J Mater Form 2:235–242.https://doi.org/10.1007/s12289-009-0407-y
19. Hallquist JO (2006) LS-DYNA theory manual. LivermoreSoftware Technology Corporation. https://www.dynasupport.com/manuals/additional/ls-dyna-theory-manual-2005-beta. Accessed 3October 2019
20. Barlat F, Lian J (1989) Plasticity behaviour and strechability ofsheet metals. Part I: a yield function of orthotropic sheets underplane stress condition. Int J Plast 5:51–56. https://doi.org/10.1016/0749-6419(89)90019-3
21. Jansson M, Nilsson L, Simonsson K (2005) On constitutive model-ling of aluminum for tube hydroforming applications. Int JPlasticity 21:1041–1058. https://doi.org/10.1016/j.ijplas.2004.06.005
22. Odenberger EL, Schill M, Oldenburg M (2013) Thermo-mechanical sheet metal forming of aero engine components in Ti-6Al-4V – part 2: constitutive modelling and validation. Int J MaterForm 6:403–416. https://doi.org/10.1007/s12289-012-1094-7
23. Wiklund D, Larsson M (2018) Phenomenological friction model indeep drawing of aluminum sheet metals. Waterloo, Canada.Proceedings of the 37th International deep-drawing research groupconference – IDDRG 2018. IOP Conf Ser Mater Sci 418:1–8.https://doi.org/10.1088/1757-899X/418/1/012097
2980 Int J Adv Manuf Technol (2020) 107:2967–2981

24. Special Metals Corporation (2007) High performance alloys litera-ture – INCONEL® alloy 718. Special Metals Corporation SMC-045. https://www.specialmetals.com/tech-center. Accessed 12October 2019
25. Schill M, Jernberg A, Klöppel T (2016) Recent developments forwelding simulations in LS-DYNA® and LS-PrePost®. Detroit,USA. Proceedings of the 14th International LS-DYNA usersconference
26. Colly Components AB (1995) Handbok om skruvförband. ISBN91-630-3882-X
27. Fukuhara M, Sanpei A (1993) Elastic moduli and internal frictionsof Inconel 718 and Ti-6Al-4Vas a function of temperature. J MaterSci Lett 12:1122–1124. https://doi.org/10.1007/BF00420541
28. Aba-Perea PE, Pirling T, Withers PJ, Kelleher J, Kabra S, Preuss M(2016) Determination of the high temperature elastic properties and
diffraction elastic constants of Ni-base superalloys. Mater Des 89:856–863. https://doi.org/10.1016/j.matdes.2015.09.152
29. Goldak J, Chakravarti A, Bibby M (1984) A new finite-elementmodel for welding heat sources. Metall Trans B 15:299–305.https://doi.org/10.1007/BF02667333
30. Deng D, Murakawa H (2008) FEM prediction of buckling distor-tion induced by welding in thin plate panel structures. ComputMater Sci 43:591–607. https://doi.org/10.1016/j.commatsci.2008.01.003
Publisher’s note Springer Nature remains neutral with regard to jurisdic-tional claims in published maps and institutional affiliations.
Int J Adv Manuf Technol (2020) 107:2967–2981 2981