100 Annual Trends in Greenhouse Gas Emissions in
19
Greenhouse Gas Emissions Inventory for the State of Georgia Summary Report of 1990 – 2008 baseline and detail on the 2008 inventory, developed using the U.S. EPA State Inventory Tool Update from the November 2008 “Summary Report of 1990 – 2005 baselines and detail on the 2005 inventory” Georgia Dept. of Natural Resources Environmental Protection Division Air Protection Branch January 2012 - 50 100 150 200 250 1990 1991 1992 1993 1994 1995 1996 1997 1998 1999 2000 2001 2002 2003 2004 2005 2006 2007 2008 MMTCO2e (tons/year) Annual Trends in Greenhouse Gas Emissions in Georgia (1990 - 2008) Gross Emissions Net Emissions
Transcript of 100 Annual Trends in Greenhouse Gas Emissions in

Greenhouse Gas Emissions Inventory for the State of Georgia
Summary Report of 1990 – 2008 baseline and detail on the
2008 inventory, developed using the U.S. EPA State Inventory Tool
Update from the November 2008 “Summary Report of 1990 – 2005 baselines and detail on the 2005 inventory”
Georgia Dept. of Natural Resources
Environmental Protection Division
Air Protection Branch
January 2012
-
50
100
150
200
250
1990
1991
1992
1993
1994
1995
1996
1997
1998
1999
2000
2001
2002
2003
2004
2005
2006
2007
2008
MM
TCO
2e
(to
ns/
year
)
Annual Trends in Greenhouse Gas Emissions in Georgia (1990 - 2008)
Gross Emissions Net Emissions

2
Report on Georgia’s Greenhouse Gas Emissions Inventory
Introduction
This report summarizes the results of a Greenhouse Gas (GHG) emissions inventory for the state of Georgia
over the period 1990 to 2008, developed using the US EPA‟s State Inventory Tool (SIT) version released on
January 6, 2011 with updated modules and data for CO2 from Fossil Fuel Combustion (CO2FFC), Stationary
Combustion, and Mobile Combustion, which were released on August 24, 2011. This report updates a
November 2008 report titled “Greenhouse Gas Emissions Inventory for the State of Georgia: Summary
Report of 1990 – 2005 baselines and detail on the 2005 inventory”. That inventory was developed in
response to a unanimous recommendation by the Governor‟s Energy Policy Council that the Georgia
Environmental Protection Division (GA EPD) provide an updated GHG inventory every three years. Since
the Nov 2008 report, U.S. federal programs, legislation, and policy directions have been in rapid flux,
underscoring the need for Georgia to understand and document our sources and sinks of greenhouse gases.
In response to federal requirements, as of January 2, 2011 the State of Georgia through the GA EPD will
operate its own GHG permitting program, covering only large new and modified sources of greenhouse
gases. To aid in outreach, GA EPD provided three 1-day workshops on November 9, 10, and 19, 2010
addressing the US EPA greenhouse gas related rules and the State‟s activities. The materials that were
presented at the workshops and other GHG permitting related materials are available at:
http://www.georgiaair.org/airpermit/html/sspp/greenhousegas_permit.htm. In addition, as of October 2009,
large facilities that the release 25,000 metric tons or more of GHGs per year and suppliers of certain fossil
fuels and industrial gases were required to report GHG emissions to the US EPA. The EPA released the
2010 data on January 11, 2012. More information and results are available at
http://epa.gov/climatechange/emissions/ghgdata/ .
The updated GHG emissions inventory for the State of Georgia presented here quantifies emissions of the 6
major GHGs or categories (described below) from the major categories of GHG emission sources defined by
the US EPA. These sources include fossil fuel combustion (i.e. coal, gasoline and diesel fuels, and natural
gas), agriculture, forestry, waste management, and industrial processes. This report presents annual
greenhouse gas emission trends in Georgia from 1990 to 2008 and detailed information on 2008 emissions.

3
Method
The GA GHG inventory was prepared using the U.S. Environmental Protection Agency‟s (EPA) State
Inventory Tool (SIT)1 with the state-specific defaults provided with the tool. Emissions of carbon dioxide
(CO2), methane (CH4), nitrous oxide (N2O), hydroflurocarbons (HFCs), perflurocarbons (PFCs), and sulfur
hexafluoride (SF6) are calculated. This set of 6 gases (gas categories) is standard in GHG analysis,
inventory development, and emission reduction programs. Results are presented in units of carbon dioxide
equivalents (CO2E), often in million metric tons (MMT), for each gas for comparative purposes following
the guidance of the Intergovernmental Panel on Climate Change2, a widely accepted procedure for
greenhouse gas comparative analysis. Selected results for emissions in Georgia during the years 1990 - 2008
and a more detailed description of the 2008 inventory are presented here. More information on the SIT is
provided in Appendix A.
Results
Results are presented for annual trends in overall GHG emissions between the years 1990 and 2008 and in
more detail for the year 2008, which corresponds with the most recent detailed inventories for other types of
emissions submitted under the Consolidated Emissions Reporting Rule (CERR)3. Results are presented in
the following order:
1. Annual Trends
A. Annual Trends by Sector
B. Annual Trends by Gas
C. Annual Trends by Gas per Sector
2. Detailed Emissions for the Year 2008
Annual Trends
Gross GHG emissions in Georgia are estimated to have increased by 25% between 1990 and 2008, with a
minimum of 144.2 MMTCO2e tons/year emissions in 1991 and a maximum of 201.4 MMTCO2e in 2007
(Figure 1). Net emissions, which includes reduction in carbon emission by sequestration from forests and
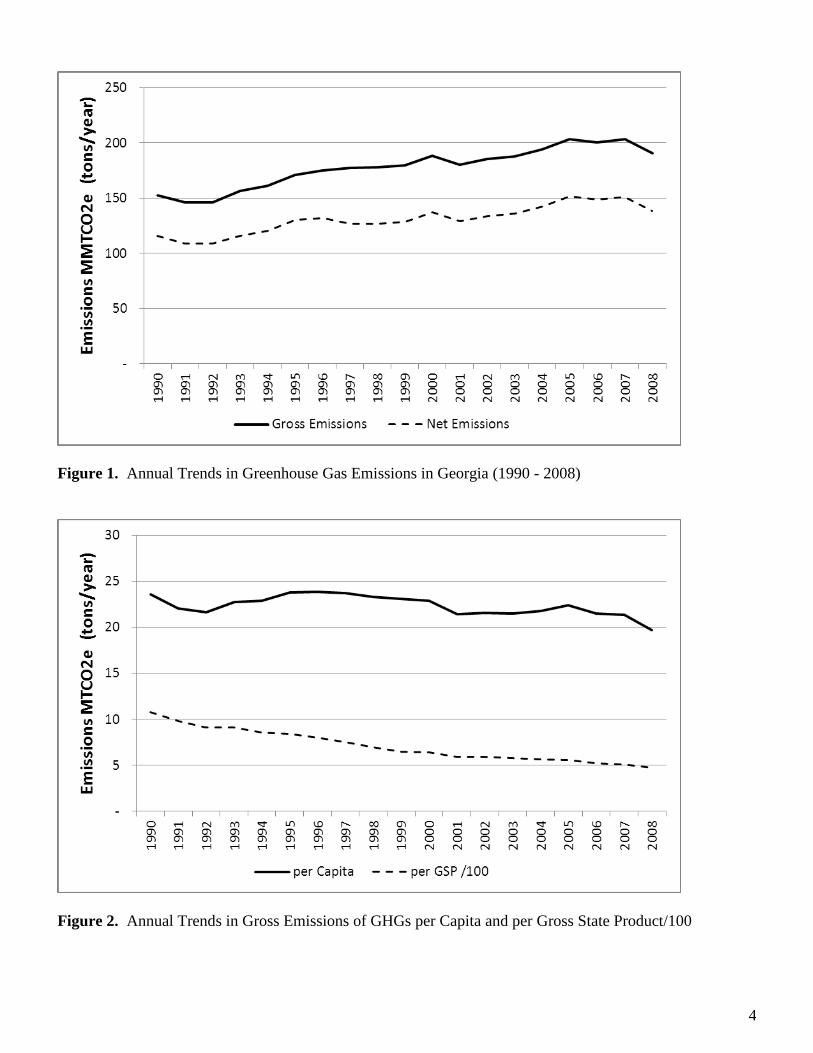
urban trees (discussed later), increased at a slower rate of 20%. Gross emissions trends differ when
evaluated with respect to changes in population or gross state product (GSP), measures referred to as
„emissions intensity‟. Over the same period, emissions intensity decreased by 16.5% per capita and by 56%
per annual GSP (Figure 2). These results indicate that while overall emissions increased in the state from
1990 to 2008, they did not increase as rapidly as population or GSP for the same total time period. The
reduction in emissions after 2007 is believed to be a result of the national recession.
1 Information available at http://www.epa.gov/climatechange/wycd/stateandlocalgov/analyticaltools.html . The version applied was
publicly released on January 6, 2011 and the module updates were provided on August 24, 2011. 2 The Intergovernmental Panel on Climate Change (IPCC) assigned each GHG a GWP based on properties such as solar radiative
forcing and average atmospheric lifetime and is often reported as an equivalent mass of CO2 (GWP = 1) integrated over a 100-year
period. SIT GWPs are largely based on the IPCC Technical Summary of Working Group I, Climate Change 2001: The Scientific
Basis. http://www.grida.no/climate/ipcc_tar/wg1/247.htm. 3 CERR Final Rule. Published in the Federal Register on June 10, 2002 (FR Volume 67, Number 111, pp 39602 - 39616). The
CERR requires State agencies under the Clean Air Act to submit emissions inventories for SOx, VOC, NOx, CO, Pb, and PM10 for
the year 2002 and every 3 years afterward, with delayed reporting requirements for PM2.5 and NH3.
4
Figure 1. Annual Trends in Greenhouse Gas Emissions in Georgia (1990 - 2008)
Figure 2. Annual Trends in Gross Emissions of GHGs per Capita and per Gross State Product/100

5
A. Annual Trends by Sector
The overall sectors and their gases inventoried, as defined by the SIT, are shown in Table 1. These sectors
are further broken down as shown in the Appendix. As with other U.S. states, the large majority of
Georgia‟s GHG emissions are caused by energy production and use (Figure 3a), which includes CO2
emissions from electricity production (coal combustion) and from combustion for transportation (e.g. cars
and trucks). These emissions are offset by sequestration of carbon (carbon removed from the atmosphere,
indicated by negative emissions values) due to tree and other vegetative growth (Figures 3a and 3b) as
reflected in the Land Use, Coverage, and Forestry sector (LUCF).
An increase in sequestration in Georgia through the 1990s was caused by extensive re-forestation and other
tree planting activities in the late 1980s (which has a delayed impact on sequestration)4. Other sectors
slightly contributing to the inventory include Agriculture (e.g. soil management, enteric fermentation, and
manure management), Industrial Processes (e.g. electric power transmission and distribution systems, cement
manufacture, ammonia and urea production), non-CO2 Energy production emissions, and Waste (e.g.
municipal solid combustion and wastewater). Note that emissions from the Energy sector are 98-99% due to
CO2 emissions from fossil fuel combustion and 1-2% from CH4 and N2O emissions from mobile and
stationary combustion sources. Emissions estimates for the sectors Natural Gas and Oil Systems and Coal
Mining are zero for Georgia.
Category Sector Gases Industries/activities included
Energy CO2 from Fossil
Fuel Combustion
CO2 transportation, electric utilities, residential,
commercial, industrial, international bunker fuels
Stationary
Combustion
CH4, N2O residential, commercial, industrial, electric utilities
Natural Gas and Oil CO2, CH4 transmission, distribution, flaring
Coal Mining CH4 surface, underground, abandoned
Mobile Combustion CH4, N2O on-road, non-road, aviation, marine, locomotive
Industrial
Processes
Industrial Processes CH4, N2O,
HFC, PFC,
SF6
cement production, lime manufacture, electric
power transmission and distribution
Agriculture Agriculture CH4, N2O manure management, residue burning
LUCF Land Use Change
and Forestry
CO2, CH4,
N2O
soil liming, fertilization, forest fires (nonCO2),
urban trees, forest management (sources and sinks)
Waste Municipal Solid
Waste
CO2, CH4,
N2O
landfill and waste combustion
Wastewater CH4, N2O municipal and industrial (pulp and paper, food
production)
Table 1. Sectors and their associated emissions inventoried using the US EPA SIT.
4 Georgia Forestry Commission, Nathan McClure, personal communication with Michelle Bergin, GA EPD, March 2008.

6
(a)
(b)
Figure 3. (a) Sector Specific Annual Trends in GHG Emissions from 1990 to 2008 and (b) excluding the
Energy sector.
B. Annual Trends by Gas
Viewing the inventory by gas shows that of the six greenhouse gases inventoried, the large majority of
emissions and growth is from CO2, followed by contributions N2O, CH4, and then combined emissions of
HFC, PFC, and SF6 (Figure 4). Emissions of N2O and CH4 are shown to be relatively steady, while
emissions in the HFC, PFC, and SF6 category is steadily increasing, and has increased by 410% from 1990 to
2008. This category represents a number of compounds with extremely long atmospheric lifetimes.
The large majority of emissions and growth in CO2 is from fossil fuel combustion from coal use in the
electric utility sector and petroleum use in the transportation sector (increasing by 36% and 28% from 1990
to 2008, respectively) (Figures 5a and 5b). The remainder of CO2 emitted during fossil fuel combustion is
estimated to be from the industrial sector, followed by residential and then commercial activities (mostly
from natural gas combustion).

7
(a)
(b)
Figure 4. Annual Trends in Emissions of (a) CO2, CH4, N2O, and HFC, PFC, and SF6, and (b) excluding
CO2.
(a)

8
(b)
Figure 5. Annual Trends in CO2 emissions from fossil fuel combustion by (a) sector and (b) fuel.
C. Annual Trends by Gas per Sector
A further look at emissions by source sector reveals the differences in sector contributions of individual
greenhouse gases (Figure 6). First, as previously stated, we see that the emissions of CO2 are much higher
than of CH4, N2O, HFC, PFC, and SF6.
CO2 emissions are overwhelmingly dominated by fossil fuel combustion (Figure 6a), which has been
generally increasing since 1992 until after 2007, and peaked at186.4 annual MMTCO2e in 2005. Methane
and N2O emissions combined peaked in 1996 at 17.6 and have been slightly decreasing since then. These
gases contribute about 6 to 9% of annual total greenhouse gas emissions over the period inventoried. The
HFC, PFC, and SF6 category, responsible for approximately 2% of the total inventory in recent years
(peaking at 4.1 MMTCO2e in 2008), is emitted entirely from industrial processes and has been steadily
increasing (Figure 6b).
N2O emission sources are mainly split between agricultural and combustion processes, including soil
management, mobile combustion, manure management, and stationary combustion, and followed by
wastewater treatment (Figure 6c). These emissions are estimated to have increased between 1993 and 1996
and then to have begun to gradually decrease, mostly due to changes in mobile combustion and agricultural
soil management practices.
Methane emissions are emitted at a similar, slightly lower level as N20, and are largely emitted from waste
processes, including from landfills (the main component under „waste‟) and enteric fermentation, which is
part of the digestive process of ruminant animals such as cows. Municipal wastewater treatment and
agricultural processes, including and manure management, are also contributors, with lower emissions from
mobile and stationary source combustion sources (Figure 6d). These emissions are estimated to have been
fairly steady over the period inventoried.
It should be noted that other anthropogenic gases, such as nitrogen trifluoride (NF3), may be required for
inclusion in greenhouse gas emissions inventories in the future.

9
(a)
Note: LULC values are negative and were not included (this is Gross CO2 emissions)
(b)
(c)
Note: Emissions from Industrial Processes and Forest Fires are not estimated.

10
(d)
Note: Emissions from Forest Fires, Coal Mining, Oil and Gas , and Rice Cultivation are estimated as zero.
Figure 6. (a) CO2 , (b) CH4, (c) N2O, and (d) HFC, PFC, and SF6 emissions by source sector.
Detailed Emissions for the Year 2008
Gross emissions during the year 2008 were 191 MMTCO2e, with source patterns typical of other recent
years. The majority of emitted Global Warming Potential (GWP), approximately 92%, was due to CO2
emissions from activities related to energy production and use (Figure 7 a,b).
Figure 7. Gross GHG Emissions in Georgia in 2008 by (a) sector and (b) gas.
(a) (b)

11
Viewing the inventory in more detail, it can be seen that the large majority of GHG emissions from energy
use and production (92% of total emissions, 7a.) were contributed by CO2 emissions from fossil fuel
combustion (99%, Figure 8a), largely resulting from the electric power production (48%) and transportation
(36%) sectors (Figure 8b).
Figure 8. GHG Emissions in Georgia in 2008 from (a) energy production and use and from (b) CO2 from
fossil fuel combustion.
Of the three fossil fuels calculated, combustion of coal (47%) and petroleum (40%) resulted in the largest
emissions of CO2, with natural gas combustion contributing the remaining 13% (Figure 9a). Coal was
mostly used for electric power generation (96%) (Figure 9b) and petroleum was mostly used was for
transportation (90%) (Figure 9c). Natural gas emissions are more evenly split from use by the industrial
(35%) and residential (28%) sectors, with smaller contributions from the electric power (23%) and
commercial (12%) sectors (Figure 9d).
(a)
(a) (b)
(b)

12
Figure 9. Georgia 2005 CO2 contributions from fossil fuel combustion by (a) fuel type and by sector for
each fuel type, including (b) coal, (c) petroleum, and (d) natural gas. Sectors contributing 0% or less are not
shown.
For questions, comments, or suggestions, please contact:
Chuck Mueller
Senior Policy Advisor
Air Protection Branch
Environmental Protection Division
(404) 363-7047
Michelle Bergin, PhD
Environmental Engineer
Air Protection Branch
Environmental Protection Division
(404) 362-4569
(d) (c)

Appendix p. 1
Appendix
The EPA’s State Inventory Tool (SIT)
The SIT is a set of Microsoft Excel based workbooks and is composed of 10 „modules‟, each
addressing a different sector and/or gas type. Six greenhouse gases/categories are accounted for by
this system, including carbon dioxide (CO2), methane (CH4), nitrous oxide (N2O), hydrofluorocarbons
(HFC), perfluorocarbons (PFC), and sulfur hexafluoride (SF6), and are reported in units of million
metric tons of carbon dioxide equivalent (MMTCO2e) based on the gas‟ Global Warming Potential
(GWP). The Intergovernmental Panel on Climate Change (IPCC) assigned each GHG a GWP based
on properties such as solar radiative forcing and average atmospheric lifetime, and is often reported as
an equivalent mass of CO2 integrated over a 100-year period.5 Contribution of these gases to the
inventory may differ if normalized over different periods (e.g. 200 years, 500 years.)
The SIT modules are as follows:
Module Name Gases Examples
1 CO2 from Fossil Fuel
Combustion
CO2 transportation, electric utilities, residential,
commercial, industrial, international bunker fuels
2 Stationary
Combustion
CH4, N2O residential, commercial, industrial, electric utilities
3 Natural Gas and Oil CO2, CH4 transmission, distribution, flaring
4 Coal Mining CH4 surface, underground, abandoned
5 Mobile Combustion CH4, N2O on-road, non-road, aviation, marine, locomotive
6 Industrial Processes CH4, N2O,
HFC, PFC, SF6
cement production, lime manufacture, electric power
transmission and distribution
7 Agriculture CH4, N2O manure management, residue burning
8 Land Use Change and
Forestry
CO2, CH4, N2O soil liming, fertilization, forest fires (nonCO2), urban
trees, forest management (sources and sinks)
9 Municipal Solid
Waste
CO2, CH4, N2O landfill and waste combustion
10 Wastewater CH4, N2O municipal and industrial (pulp and paper, food
production)
These sectors are further categorized as:
Energy CO2 from Fossil Fuel Combustion, Stationary Combustion, Mobile
Combustion, Coal Mining, and Natural Gas and Oil Systems
Industrial Processes Industrial Processes
Agriculture
Enteric Fermentation, Manure Management, Rice Cultivation,
Agricultural Soil Management, Burning of Agricultural Crop Waste
LUCF LUCF
Waste Municipal Solid Waste and Wastewater
The following tables contain a summary of these modules for the state of Georgia through 2008.
5 SIT GWPs are largely based on the IPCC Technical Summary of Working Group I, Climate Change 2001: The Scientific
Basis. http://www.grida.no/climate/ipcc_tar/wg1/247.htm .

Appendix p. 2
Appendix to Greenhouse Gas Emissions Inventory for the State of Georgia - Update
December 2012
The follow ing tables are from the summery sheets of each module of the US EPA State Inventory Tool calculated for the state of Georgia.
Module names
1 CO2 from Fossil Fuel Combustion (e.g. energy production, transportation)
2 Stationary Combustion (CH4 and N2O emissions)
3 Natural Gas and Oil (e.g. transmission, distribution, f laring)
4 Coal Mining
5 Mobile Combustion (CH4 and N2O emissions)
6 Industrial Processes (e.g. cement production, lime manufacture)
7 Agriculture (CH4 and N2O, e.g. manure management, residue burning)
8 Land Use Change and Forestry (sources and sinks)
9 Municipal Solid Waste (landfill and combustion)
10 Wastew ater
1 CO2 from Fossil Fuel Combustion (e.g. energy production, transportation)
MMTCO2E 1990 1991 1992 1993 1994 1995 1996 1997 1998 1999 2000 2001 2002 2003 2004 2005 2006 2007 2008
Residential 5.7775 6.1273 6.8323 7.3028 6.6979 7.1741 7.8243 7.1997 6.7101 6.3241 8.6473 7.3375 7.599 7.8537 7.7123 7.5239 6.6256 6.6808 7.151
Coal 0.0104 0.0034 0.0162 0.0092 0.0101 0.018 0.0009 0.0044 0.0029 0.0048 0.0023 0.003 0.0015 0 0.0016 0.0091 0 0.0005 0.0031
Petroleum 0.8533 0.862 0.9368 0.9976 0.9314 0.9202 0.9338 0.9637 0.8604 0.9422 1.0438 0.756 0.7121 0.7653 0.8125 0.6804 0.6091 0.6025 0.6647
Natural Gas 4.9137 5.2619 5.8793 6.296 5.7564 6.2359 6.8897 6.2317 5.8469 5.3772 7.6012 6.5785 6.8854 7.0884 6.8982 6.8344 6.0166 6.0779 6.4833
Other 0 0 0 0 0 0 0 0 0 0 0 0 0 0 0 0 0 0 0
Commercial 3.8548 3.6106 3.9495 4.0138 3.9019 4.1179 4.1312 4.0537 3.6571 3.2583 4.1229 3.7578 3.35 3.3958 3.7694 3.5954 3.1943 3.2225 3.3513
Coal 0.0417 0.0153 0.0737 0.042 0.0572 0.1205 0.0063 0.0353 0.0233 0.035 0.0183 0.0239 0.0109 0 0.0147 0.1045 0 0.0042 0.0278
Petroleum 1.1192 0.8171 0.9495 0.8403 0.8938 0.9229 0.7969 0.901 0.6167 0.8508 0.9314 0.9569 0.6957 0.6526 0.7527 0.5883 0.5672 0.5789 0.5256
Natural Gas 2.6939 2.7782 2.9263 3.1315 2.9509 3.0745 3.328 3.1174 3.0171 2.3724 3.1732 2.7771 2.6435 2.7431 3.002 2.9026 2.6271 2.6393 2.7979
Other 0 0 0 0 0 0 0 0 0 0 0 0 0 0 0 0 0 0 0
Industrial 19.182 19.466 19.845 19.389 20.132 20.989 21.266 20.861 19.453 19.33 20.196 19.638 19.747 20.499 20.843 20.734 19.084 17.679 16.533
Coal 5.2029 4.894 4.1595 3.9933 4.4944 4.5538 4.6298 4.7731 4.6089 4.5924 4.7417 4.7664 4.4027 4.236 4.2287 4.0469 3.7904 3.6183 3.3877
Petroleum 5.3386 5.6497 6.5122 6.4602 6.3484 6.6564 6.988 6.7727 6.1102 6.5889 6.7445 7.5309 7.7676 7.7943 8.0986 8.3905 6.8741 6.0424 5.2168
Natural Gas 8.6403 8.9222 9.1737 8.9354 9.2888 9.7792 9.6485 9.3149 8.734 8.1486 8.7094 7.3408 7.5767 8.4692 8.5153 8.2964 8.4193 8.0179 7.9288
Other 0 0 0 0 0 0 0 0 0 0 0 0 0 0 0 0 0 0 0
Transportation 48.663 47.438 47.931 53.283 53.835 56.405 59.753 57.44 59.467 61.457 61.527 61.418 61.582 63.079 66.407 69.255 68.349 67.072 62.161
Coal 0 0 0 0 0 0 0 0 0 0 0 0 0 0 0 0 0 0 0
Petroleum 48.263 47.034 47.524 52.895 53.447 55.98 59.282 56.989 59.035 60.953 61.198 60.983 61.119 62.647 66.028 68.892 67.963 66.734 61.778
Natural Gas 0.3997 0.4046 0.4075 0.3881 0.3879 0.4251 0.4709 0.4515 0.4325 0.5043 0.329 0.4348 0.4625 0.4319 0.3797 0.3637 0.3856 0.338 0.3834
Other 0 0 0 0 0 0 0 0 0 0 0 0 0 0 0 0 0 0 0
Electric Power 61.444 55.085 52.876 57.329 59.769 63.911 63.673 68.2 68.664 69.955 73.783 68.582 73.316 73.369 75.41 83.139 83.872 89.363 83.62
Coal 61.191 54.947 52.695 56.94 59.539 63.089 63.079 67.052 66.132 67.543 70.811 66.403 70.017 71.291 72.754 78.924 78.527 82.567 78.261
Petroleum 0.1481 0.0927 0.1182 0.2251 0.1566 0.2176 0.2804 0.2355 0.7183 0.6427 0.7091 0.3059 0.2337 0.3257 0.1486 0.2101 0.085 0.0844 0.0742
Natural Gas 0.1049 0.0455 0.0631 0.1641 0.073 0.604 0.3136 0.9125 1.8138 1.769 2.2635 1.8727 3.065 1.7515 2.5075 4.0054 5.2601 6.7108 5.2846
Other 0 0 0 0 0 0 0 0 0 0 0 0 0 0 0 0 0 0 0
International Bunker Fuels 0 0.0002 0.0002 0.0002 0.0005 0.0005 0.0002 0.0007 0.0007 0 0 0 0 0.002 0.0001 0.0063 0.0085 0.0055 0.0018
Petroleum 0 0.0002 0.0002 0.0002 0.0005 0.0005 0.0002 0.0007 0.0007 0 0 0 0 0.002 0.0001 0.0063 0.0085 0.0055 0.0018
TOTAL 138.92 131.73 131.43 141.32 144.33 152.6 156.65 157.75 157.95 160.32 168.28 160.73 165.59 168.2 174.14 184.25 181.12 184.02 172.82
Coal 66.446 59.86 56.944 60.984 64.101 67.782 67.716 71.864 70.767 72.175 75.573 71.196 74.432 75.527 76.999 83.084 82.317 86.19 81.68
Petroleum 55.723 54.455 56.041 61.418 61.777 64.697 68.281 65.862 67.34 69.977 70.627 70.533 70.528 72.185 75.84 78.761 76.099 74.042 68.259
Natural Gas 16.752 17.412 18.45 18.915 18.457 20.119 20.651 20.028 19.844 18.172 22.076 19.004 20.633 20.484 21.303 22.403 22.709 23.784 22.878
Other 0 0 0 0 0 0 0 0 0 0 0 0 0 0 0 0 0 0 0

Appendix p. 3
2 Stationary Combustion (CH4 and N2O emissions)
MMTCO2E 1990 1991 1992 1993 1994 1995 1996 1997 1998 1999 2000 2001 2002 2003 2004 2005 2006 2007 2008
Residential 0.0963 0.1005 0.1075 0.1472 0.1392 0.1409 0.1458 0.1196 0.107 0.1111 0.1238 0.0857 0.0871 0.0913 0.093 0.068 0.0607 0.0652 0.069
N2O 0.018 0.0188 0.0201 0.0269 0.0254 0.0256 0.0267 0.0223 0.02 0.0207 0.0233 0.0164 0.0166 0.0174 0.0178 0.0133 0.012 0.0127 0.0135
CH4 0.0783 0.0817 0.0873 0.1203 0.1139 0.1152 0.1192 0.0973 0.087 0.0903 0.1004 0.0693 0.0705 0.0739 0.0752 0.0546 0.0488 0.0525 0.0555
Commercial 0.0216 0.0204 0.0224 0.0295 0.0287 0.0298 0.0295 0.0293 0.0253 0.0259 0.0292 0.0236 0.0221 0.0225 0.0236 0.0185 0.0165 0.017 0.0178
N2O 0.006 0.0052 0.006 0.0069 0.0069 0.0073 0.0067 0.0069 0.0057 0.0062 0.0069 0.006 0.0052 0.0052 0.0056 0.0048 0.004 0.0042 0.0043
CH4 0.0157 0.0152 0.0164 0.0226 0.0219 0.0224 0.0228 0.0224 0.0196 0.0197 0.0223 0.0177 0.0169 0.0173 0.0179 0.0137 0.0124 0.0128 0.0134
Industrial 0.3755 0.3744 0.3713 0.3759 0.3802 0.3995 0.3972 0.4236 0.3999 0.4033 0.3907 0.3486 0.4994 0.3629 0.3888 0.3704 0.372 0.3592 0.2967
N2O 0.252 0.2512 0.2492 0.2523 0.2552 0.2681 0.2666 0.284 0.2682 0.2709 0.2624 0.2348 0.3348 0.2441 0.2616 0.2494 0.2498 0.2411 0.1991
CH4 0.1235 0.1231 0.1221 0.1236 0.125 0.1314 0.1306 0.1396 0.1317 0.1324 0.1283 0.1137 0.1646 0.1188 0.1272 0.121 0.1221 0.1181 0.0976
Electric Power 0.3201 0.2873 0.2761 0.2981 0.31 0.3285 0.3284 0.3518 0.3528 0.3599 0.3778 0.3529 0.3727 0.3786 0.3864 0.4205 0.4191 0.4417 0.4177
N2O 0.3061 0.2748 0.2641 0.285 0.2964 0.3139 0.3139 0.3355 0.3364 0.3433 0.3602 0.3368 0.3554 0.3614 0.3687 0.4008 0.3992 0.4203 0.3978
CH4 0.014 0.0125 0.012 0.0131 0.0135 0.0146 0.0145 0.0163 0.0164 0.0166 0.0176 0.0161 0.0173 0.0172 0.0176 0.0197 0.0199 0.0214 0.0199
TOTAL 0.8135 0.7825 0.7773 0.8506 0.8581 0.8986 0.901 0.9244 0.885 0.9002 0.9215 0.8108 0.9814 0.8553 0.8918 0.8774 0.8682 0.8831 0.8011
3 Natural Gas and Oil (e.g. transmission, distribution, flaring)
Emissions (MMTCO2 Eq.) 1990 1991 1992 1993 1994 1995 1996 1997 1998 1999 2000 2001 2002 2003 2004 2005 2006 2007 2008
Natural Gas 0 0 0 0 0 0 0 0 0 0 0 0 0 0 0 0 0 0 0
Oil 0 0 0 0 0 0 0 0 0 0 0 0 0 0 0 0 0 0 0
4 Coal Mining
Emissions (MTCO2E) 1990 1991* 1992* 1993 1994 1995 1996 1997 1998 1999 2000 2001 2002 2003 2004 2005 2006 2007 2008
Coal Mining 0 0 0 0 0 0 0 0 0 0 0 0 0 0 0 0 0 0 0
Abandoned Coal Mines 0 0 0 0 0 0 0 0 0 0 0 0 0 0 0 0 0 0 0
Vented 0 0 0 0 0 0 0 0 0 0 0 0 0 0 0 0 0 0 0
Sealed 0 0 0 0 0 0 0 0 0 0 0 0 0 0 0 0 0 0 0
Flooded 0 0 0 0 0 0 0 0 0 0 0 0 0 0 0 0 0 0 0
5 Mobile Combustion (CH4 and N2O emissions)
CH4 Emissions from Mobile Sources (MTCO2E)
Fuel Type/Vehicle Type 1990 1991 1992 1993 1994 1995 1996 1997 1998 1999 2000 2001 2002 2003 2004 2005 2006 2007 2008
Gasoline Highway 224454 225290 230884 223564 224489 217193 210772 203425 195661 180146 174714 170287 146025 133439 124847 114933 101910 92009 82199
Passenger Cars 137775 130189 130648 124611 125314 120768 116807 112136 108607 102487 99331 93262 84801 77005 72775 66744 59460 53347 47073
Light-Duty Trucks 72037 79453 85252 84832 84703 82076 80175 78600 75359 66695 65352 68850 53467 49152 45107 41752 39933 36213 32745
Heavy-Duty Vehicles 13780 14751 14027 13158 13455 13290 12754 11680 10697 9920.3 8983.5 7243.3 6860.6 6403.5 6045.2 5514.5 1412.4 1260.8 1138
Motorcycles 862.7 896.89 957.08 963.36 1016.4 1059.1 1036.8 1008.9 997.73 1042.8 1046.3 930.76 896.35 878.38 919.21 923.18 1103.8 1188.5 1242.9
Diesel Highway 774.2 812.97 839.78 873.49 958.04 1019 1059.8 1142.5 1180 1230.5 1304.5 1296.7 1303.2 1301.9 1371.8 1353.9 1486.6 1500.9 1483.1
Passenger Cars 7.6106 6.9919 7.1033 6.8309 6.7603 6.4224 6.2824 6.3075 6.0796 5.8244 5.794 5.3162 5.3118 5.2889 5.4526 5.4669 5.0159 4.9062 4.6794
Light-Duty Trucks 17.167 19.231 21.926 23.239 24.599 25.507 27.026 29.178 30.096 31.331 33.551 33.997 34.242 35.261 36.073 36.809 42.094 53.399 52.617
Heavy-Duty Vehicles 749.42 786.74 810.75 843.42 926.68 987.11 1026.5 1107 1143.9 1193.3 1265.2 1257.4 1263.6 1261.4 1330.2 1311.6 1439.5 1442.6 1425.8
Non-Highway 14360 11767 13007 12127 12071 13505 14141 13294 13354 13634 12833 14044 14530 14083 16393 17289 19921 16002 16473
Boats 1648.3 1651.4 3546.1 2686.7 2048.9 1666.8 1545.7 1485.1 1299.6 1125 1129.8 1005.2 2163.4 2522.9 4149.4 4624 7762.4 5478.3 6530.6
Locomotives 1306.7 987.71 1022.3 919.84 1142.6 1237.5 1442.2 1880.2 1397.4 1379.4 1284 1326.5 2134.4 1890.4 1988.8 2013.5 2166 1432.7 1275.9
Farm Equipment 2855.3 1884.1 1739 2188.6 2022.8 3309.1 3549.5 3211.9 3888.1 3517.4 3616.7 4622.6 3876.4 2764.3 2564.7 2574 2992.7 2620 2447.6
Construction Equipment 1562.7 1314.8 1395.9 1399.4 1532.1 1681.2 2203.4 1858 2063.4 2294.4 2263 2768.9 2465.9 2565.8 2565.7 2830.3 2880.1 3018.5 3264
Aircraft 5468.1 4458.3 3895.6 4543.6 4899.3 5225.2 5028.5 4488.8 4347.1 4457.7 3667.9 2857.1 2423 2898.8 3415.9 3592.1 2655.9 2559.3 2085.5
Other* 1519 1471 1408.4 388.87 425.1 384.78 371.34 369.64 358.52 859.93 871.33 1463.4 1466.7 1440.8 1708.4 1655 1464.3 893.59 869.13
Alternative Fuel Vehicles 265.6 280.32 297.61 375.31 394.5 521.09 684.04 929.81 1039.3 1122.8 1306.1 1713.6 1978.5 2308 2666.7 2353 2413 2923.5 3465.1
Light Duty Vehicles 86.255 92.096 98.626 106.81 105.89 183.62 254.2 433.05 479.85 528.87 574.22 611.48 722.84 800.43 825.47 706.23 722.88 839.46 924.32
Heavy Duty Vehicles 99.394 98.72 97.382 129.42 142.38 189.81 273.73 326.78 376.07 397.11 524.77 853.47 983.11 1226.1 1434.2 1291.9 1344.9 1685.4 2077.3
Buses 79.949 89.499 101.6 139.07 146.23 147.66 156.11 169.98 183.4 196.8 207.08 248.64 272.51 281.47 407.08 354.9 345.23 398.64 463.54
Total 239854 238150 245029 236940 237912 232238 226657 218791 211234 196133 190157 187341 163836 151132 145278 135929 125731 112436 103620
* "Other" includes snow mobiles, small gasoline pow ered utility equipment, heavy-duty gasoline pow ered utility equipment, and heavy-duty diesel pow ered utility equipment.

Appendix p. 4
N2O Emissions from Mobile Sources (MTCO2E)
Fuel Type/Vehicle Type 1990 1991 1992 1993 1994 1995 1996 1997 1998 1999 2000 2001 2002 2003 2004 2005 2006 2007 2008
Gasoline Highway 2E+06 2E+06 3E+06 3E+06 3E+06 3E+06 3E+06 3E+06 3E+06 3E+06 3E+06 3E+06 3E+06 2E+06 2E+06 2E+06 2E+06 1E+06 1E+06
Passenger Cars 1E+06 1E+06 1E+06 1E+06 2E+06 2E+06 2E+06 2E+06 2E+06 2E+06 2E+06 1E+06 1E+06 1E+06 1E+06 1E+06 947243 820415 689917
Light-Duty Trucks 741738 898755 1E+06 1E+06 1E+06 1E+06 1E+06 1E+06 1E+06 1E+06 1E+06 1E+06 1E+06 1E+06 932511 837452 772219 663181 558288
Heavy-Duty Vehicles 35264 42455 44353 45006 49123 51236 56176 62868 69424 69952 70417 62492 64906 66476 64576 56701 15603 14493 13679
Motorcycles 1237.1 1286.1 1372.4 1381.4 1457.5 1518.7 1498 1470.9 1465.5 1528.1 1540.1 1375 1328.3 1305.1 1368.8 1377.2 1649 1777.2 1860.2
Diesel Highway 11059 11605 12004 12479 13666 14515 15093 16263 16789 17497 18545 18432 18524 18515 19496 19255 21140 21439 21180
Passenger Cars 246.94 226.87 230.48 221.64 219.35 208.39 203.85 204.66 197.27 188.99 188 172.49 172.35 171.61 176.92 177.39 162.75 159.19 151.83
Light-Duty Trucks 394.37 441.8 503.72 533.88 565.11 585.97 620.87 670.31 691.4 719.78 770.77 781.01 786.65 810.06 828.72 845.63 967.04 1226.7 1208.8
Heavy-Duty Vehicles 10417 10936 11270 11724 12881 13721 14269 15388 15900 16588 17586 17478 17565 17533 18491 18232 20010 20053 19819
Non-Highway 114701 93072 94791 95284 100495 108987 108790 99343 98774 102297 93066 90167 86368 89979 101637 107179 112313 93959 97998
Boats 8463.4 8479.3 18208 13795 10520 8558.3 7936.7 7625.2 6673.1 5776.2 5800.8 5161.2 11108 12954 21305 23742 39857 28129 33532
Locomotives 6172.6 4665.7 4829.1 4345.1 5397.4 5845.8 6812.7 8881.9 6601.2 6516 6065.3 6266 10082 8929.7 9394.7 9511.4 10232 6767.6 6027
Farm Equipment 7493.2 4944.6 4563.6 5743.6 5308.5 8684.2 9315 8429.2 10204 9230.9 9491.4 12131 10173 7254.5 6730.5 6755 7853.9 6875.7 6423.4
Construction Equipment 10252 8626.4 9158.2 9181.3 10052 11030 14456 12190 13538 15053 14847 18166 16179 16834 16833 18569 18896 19804 21415
Aircraft 72354 56705 48792 59668 66428 72344 67833 59792 59406 60079 51145 38841 29204 34555 36165 37743 25868 26520 24899
Other* 9965.7 9651.3 9240.3 2551.3 2789 2524.5 2436.3 2425.2 2352.2 5641.9 5716.6 9601.2 9622.6 9453 11209 10858 9606.9 5862.7 5702.2
Alternative Fuel Vehicles 3718 3543.1 3367.3 4256.5 4097.3 4048.5 4373.3 4850.8 5051.3 4733.6 5362.1 6452.3 7442.8 8332.8 8548.9 7047.3 6739.2 7642.3 8586.7
Light Duty Vehicles 863.61 857.8 859.12 913.3 859.81 953.26 1106 1329.1 1388.3 1371.2 1615.4 1748.9 2086.1 2386.8 2454.7 2158.7 2201.1 2598.2 2908
Heavy Duty Vehicles 2744.2 2560.2 2365.8 3148.9 3034.6 2886.6 3041.2 3290.2 3417.3 3097.9 3474.6 4376.8 4998.6 5576.2 5559.3 4422.3 4084.5 4520.3 5069.6
Buses 110.18 125.08 142.31 194.25 202.88 208.72 226.19 231.48 245.75 264.47 272.1 326.71 358.08 369.85 534.9 466.34 453.63 523.81 609.09
Total 2E+06 2E+06 3E+06 3E+06 3E+06 3E+06 3E+06 3E+06 3E+06 3E+06 3E+06 3E+06 3E+06 2E+06 2E+06 2E+06 2E+06 2E+06 1E+06
* "Other" includes snow mobiles, small gasoline pow ered utility equipment, heavy-duty gasoline pow ered utility equipment, and heavy-duty diesel pow ered utility equipment.
6 Industrial Processes (e.g. cement production, lime manufacture)
MTCO2e 1990 1991 1992 1993 1994 1995 1996 1997 1998 1999 2000 2001 2002 2003 2004 2005 2006 2007 2008
Carbon Dioxide Emissions 1E+06 975260 1E+06 1E+06 2E+06 2E+06 1E+06 2E+06 2E+06 2E+06 2E+06 2E+06 2E+06 2E+06 2E+06 2E+06 2E+06 2E+06 2E+06
Cement Manufacture 489554 434195 444282 811651 825355 840353 418883 421986 448360 462840 507518 494558 456290 417504 417316 386993 424712 402620 624772
Lime Manufacture 0 0 0 84887 76383 86407 78683 0 0 0 0 0 0 0 0 0 0 0 0
Limestone and Dolomite Use 0 0 0 0 27877 56958 76550 105530 132305 75680 57395 48237 46642 31952 38225 43770 60733 75488 48719
Soda Ash 70681 68436 69516 69700 70314 73786 73310 75179 76811 76213 77346 78199 79607 78300 79037 79167 79195 77918 75765
Ammonia & Urea 477180 472629 492164 475388 521968 525853 584290 596832 610942 600442 546089 427383 577722 463666 513884 509254 556141 526874 487767
Iron & Steel Production 0 0 0 0 0 0 0 1E+06 1E+06 1E+06 1E+06 1E+06 1E+06 1E+06 1E+06 1E+06 1E+06 1E+06 923684
Nitrous Oxide Emissions 0 0 0 0 0 0 0 0 0 0 0 0 0 0 0 0 0 0 0
Nitric Acid Production 0 0 0 0 0 0 0 0 0 0 0 0 0 0 0 0 0 0 0
Adipic Acid Production 0 0 0 0 0 0 0 0 0 0 0 0 0 0 0 0 0 0 0
HFC, PFC, and SF6 Emissions 798216 770106 813294 916247 1E+06 1E+06 2E+06 2E+06 2E+06 2E+06 3E+06 3E+06 3E+06 3E+06 3E+06 4E+06 4E+06 4E+06 4E+06
ODS Substitutes 8634.2 16807 45948 147915 339545 792464 1E+06 1E+06 2E+06 2E+06 2E+06 2E+06 3E+06 3E+06 3E+06 3E+06 3E+06 3E+06 4E+06
Semiconductor Manufacturing 0 0 0 0 0 0 0 0 0 0 0 0 0 0 0 0 0 0 0
Magnesium Production 0 0 0 0 0 0 0 0 0 0 0 0 0 0 0 0 0 0 0
Electric Pow er Transmission and
Distribution Systems 789582 753299 767347 768331 711335 683036 639290 583296 517503 530445 523436 522822 516609 494245 508251 504432 485454 463754 473061
HCFC-22 Production 0 0 0 0 0 0 0 0 0 0 0 0 0 0 0 0 0 0 0
Aluminum Production 0 0 0 0 0 0 0 0 0 0 0 0 0 0 0 0 0 0 0
Total Emissions 2E+06 2E+06 2E+06 2E+06 3E+06 3E+06 3E+06 4E+06 5E+06 5E+06 5E+06 5E+06 5E+06 6E+06 6E+06 6E+06 6E+06 6E+06 6E+06

Appendix p. 5
7 Agriculture (CH4 and N2O, e.g. manure management, residue burning)
Note: Totals below do not account for emissions from the follow ing animals, fertilizers, crops, or harvested areas:
Enteric Fermentation:
Manure Management and Ag Soils-
Animal:
Ag Soils-Plant-Residues, Legumes,
Histosols: Red Clover, White Clover, Birdsfoot Trefoil, Arrow leaf Clover, Crimson Clover,
Ag Soils-Plant-Fertilizers: Organic: Dried Blood, Compost, Other Sew age Sludge, Tankage
Rice Cultivation:
Ag Residue Burning:
The "National Adjustment Factor" is applied to reconcile differences betw een the methodologies for estimating nitrous oxide emissions from agricultural soils of the National Inventory of Greenhouse
Gas Emissions and the State Inventory Tool. The method used in the SIT underestimates indirect emissions from fertilizers and overestimates indirect emissions from livestock and all direct sources of
agricultural soils emissions relative to the National Inventory. Other sources w ill not be affected.
Emissions (MMTCO2 Eq.) 1990 1991 1992 1993 1994 1995 1996 1997 1998 1999 2000 2001 2002 2003 2004 2005 2006 2007 2008
Enteric Fermentation 1.8895 1.9229 1.9669 1.9920 2.0380 2.0668 2.0232 1.9624 1.8449 1.8277 1.8325 1.7839 1.7570 1.8423 1.8260 1.8054 1.7778 1.7704 1.7042
Manure Management 1.3299 1.3497 1.3710 1.4341 1.4543 1.4557 1.5047 1.5269 1.6156 1.6016 1.5657 1.5886 1.6154 1.5497 1.5838 1.5961 1.5923 1.6427 1.6308
Ag Soils 2.4274 2.6735 2.6981 2.4945 3.1659 3.8126 3.8889 3.7235 3.5121 3.3384 3.2697 3.2592 3.2763 3.4947 3.5478 3.4349 3.4158 3.4403 3.1246
Rice Cultivation 0.0000 0.0000 0.0000 0.0000 0.0000 0.0000 0.0000 0.0000 0.0000 0.0000 0.0000 0.0000 0.0000 0.0000 0.0000 0.0000 0.0000 0.0000 0.0000
Agricultural Residue Burning 0.0061 0.0084 0.0092 0.0055 0.0085 0.0050 0.0065 0.0059 0.0040 0.0040 0.0038 0.0044 0.0038 0.0053 0.0054 0.0047 0.0037 0.0063 0.0080
TOTAL 5.6529 5.9545 6.0452 5.9261 6.6667 7.3401 7.4234 7.2187 6.9766 6.7718 6.6716 6.6361 6.6526 6.8919 6.9630 6.8410 6.7896 6.8598 6.4675
Emissions by Gas (MMTCH4 or MMTN2O)
1990 1991 1992 1993 1994 1995 1996 1997 1998 1999 2000 2001 2002 2003 2004 2005 2006 2007 2008
Methane 0.1212 0.1236 0.1261 0.1289 0.1313 0.1309 0.1294 0.1272 0.1245 0.1236 0.1223 0.1206 0.1193 0.1212 0.1209 0.1198 0.1173 0.1182 0.1140
Enteric Fermentation 0.0900 0.0916 0.0937 0.0949 0.0970 0.0984 0.0963 0.0934 0.0879 0.0870 0.0873 0.0849 0.0837 0.0877 0.0870 0.0860 0.0847 0.0843 0.0812
Manure Management 0.0311 0.0318 0.0322 0.0338 0.0340 0.0323 0.0329 0.0336 0.0365 0.0364 0.0349 0.0355 0.0355 0.0333 0.0338 0.0337 0.0325 0.0337 0.0326
Rice Cultivation 0.0000 0.0000 0.0000 0.0000 0.0000 0.0000 0.0000 0.0000 0.0000 0.0000 0.0000 0.0000 0.0000 0.0000 0.0000 0.0000 0.0000 0.0000 0.0000
Agricultural Residue Burning 0.0002 0.0002 0.0003 0.0002 0.0003 0.0002 0.0002 0.0002 0.0001 0.0001 0.0001 0.0001 0.0001 0.0002 0.0002 0.0001 0.0001 0.0002 0.0002
Nitrous Oxide 0.0100 0.0108 0.0110 0.0104 0.0126 0.0148 0.0152 0.0147 0.0141 0.0135 0.0132 0.0132 0.0134 0.0140 0.0143 0.0140 0.0140 0.0141 0.0131
Manure Management 0.0022 0.0022 0.0022 0.0023 0.0024 0.0025 0.0026 0.0027 0.0027 0.0027 0.0027 0.0027 0.0028 0.0027 0.0028 0.0029 0.0029 0.0030 0.0031
Ag Soils 0.0078 0.0086 0.0087 0.0080 0.0102 0.0123 0.0125 0.0120 0.0113 0.0108 0.0105 0.0105 0.0106 0.0113 0.0114 0.0111 0.0110 0.0111 0.0101
Agricultural Residue Burning 7E-06 1E-05 1E-05 6E-06 1E-05 6E-06 7E-06 7E-06 4E-06 4E-06 4E-06 5E-06 4E-06 6E-06 6E-06 5E-06 4E-06 7E-06 9E-06
Nitrous Oxide Emissions from Ag Soils (metric tons N2O)
1990 1991 1992 1993 1994 1995 1996 1997 1998 1999 2000 2001 2002 2003 2004 2005 2006 2007 2008
Direct 6810.2 7588 7650.6 6965.9 8765.8 10172 10374 9903.9 9312 8851.1 8688.5 8695.6 8668.1 9345 9486 9189.1 9070.2 9202.1 8555.9
Fertilizers 0 0 0 0 1006.7 2945.5 3015.5 2840.4 2588 2321.7 2138.4 2022 2236.8 2284.9 2347.1 2132.2 2267.7 2075.6 995.43
Crop Residues 380.86 553.47 607.19 342.39 547.35 322.1 403.5 356.43 246.13 238.46 225.79 263.46 222.28 320.18 344.82 286.16 224.97 383.18 506.93
N-Fixing Crops 834.73 1370.9 1311.8 791.24 1221.4 810.03 878.22 766.72 715.86 640.14 604.86 768.99 594.35 890.76 958.22 940.87 709.05 892.58 1301.8
Histosols 0 0 0 0 0 0 0 0 0 0 0 0 0 0 0 0 0 0 0
Livestock 5594.6 5663.6 5731.6 5832.3 5990.3 6094.4 6076.5 5940.3 5762 5650.8 5719.4 5641.2 5614.7 5849.1 5835.8 5829.8 5868.5 5850.7 5751.8
Indirect 1020.2 1036.3 1052.8 1080.8 1446.8 2126.6 2171.2 2107.4 2017.2 1918.1 1858.8 1818 1900.6 1928.1 1958.4 1891.3 1948.5 1895.6 1523.3
Fertilizers 0 0 0 0 111.86 327.3 335.08 315.62 287.58 257.99 237.62 224.68 248.55 253.89 260.81 236.93 251.98 230.64 110.61
Livestock 480.11 487.69 495.46 508.61 521.63 534.86 544.75 542.46 539.93 535.4 536.48 535.71 540.62 545.92 550.33 552.78 558.27 563.75 559.41
Leaching/Runoff 540.12 548.65 557.39 572.19 813.34 1264.5 1291.3 1249.4 1189.7 1124.7 1084.7 1057.6 1111.5 1128.3 1147.2 1101.6 1138.3 1101.2 853.31
Fertilizer Runoff/Leached 0 0 0 0 226.51 662.74 678.49 639.09 582.3 522.39 481.14 454.95 503.28 514.11 528.11 479.75 510.23 467.02 223.97
Manure Runoff/Leached 540.12 548.65 557.39 572.19 586.83 601.71 612.84 610.27 607.42 602.33 603.55 602.67 608.2 614.16 619.13 621.87 628.06 634.22 629.33
TOTAL 7830.4 8624.3 8703.4 8046.7 10213 12299 12545 12011 11329 10769 10547 10514 10569 11273 11444 11080 11019 11098 10079

Appendix p. 6
8 Land Use Change and Forestry (sources and sinks)
Emissions* (MMTCO2E) 1990 1991 1992 1993 1994 1995 1996 1997 1998 1999 2000 2001 2002 2003 2004 2005 2006 2007 2008
Forest Carbon Flux -33.072 -33.072 -33.072 -36.683 -36.683 -36.683 -38.716 -46.535 -46.535 -46.535 -46.535 -46.535 -46.535 -46.535 -46.535 -46.535 -46.535 -46.535 -46.535
Aboveground Biomass -10.986 -10.986 -10.986 -10.986 -10.986 -10.986 -13.333 -22.356 -22.356 -22.356 -22.356 -22.356 -22.356 -22.356 -22.356 -22.356 -22.356 -22.356 -22.356
Below ground Biomass -2.1443 -2.1443 -2.1443 -2.1443 -2.1443 -2.1443 -2.6417 -4.5543 -4.5543 -4.5543 -4.5543 -4.5543 -4.5543 -4.5543 -4.5543 -4.5543 -4.5543 -4.5543 -4.5543
Dead Wood -1.1080 -1.1080 -1.1080 -1.1080 -1.1080 -1.1080 -1.2984 -2.0304 -2.0304 -2.0304 -2.0304 -2.0304 -2.0304 -2.0304 -2.0304 -2.0304 -2.0304 -2.0304 -2.0304
Litter 1.0784 1.0784 1.0784 1.0784 1.0784 1.0784 0.8785 0.1099 0.1099 0.1099 0.1099 0.1099 0.1099 0.1099 0.1099 0.1099 0.1099 0.1099 0.1099
Soil Organic Carbon -4.0396 -4.0396 -4.0396 -4.0396 -4.0396 -4.0396 -2.8385 1.7796 1.7796 1.7796 1.7796 1.7796 1.7796 1.7796 1.7796 1.7796 1.7796 1.7796 1.7796
Total w ood products and landfills -15.872 -15.872 -15.872 -19.483 -19.483 -19.483 -19.483 -19.483 -19.483 -19.483 -19.483 -19.483 -19.483 -19.483 -19.483 -19.483 -19.483 -19.483 -19.483
Liming of Agricultural Soils 0.0000 0.0000 0.0000 0.0000 0.0000 0.0000 0.0040 0.0000 0.0000 0.0000 0.0000 0.0000 0.0000 0.0000 0.0000 0.0000 0.0000 0.0000 0.0000
Limestone 0.0000 0.0000 0.0000 0.0000 0.0000 0.0000 0.0035 0.0000 0.0000 0.0000 0.0000 0.0000 0.0000 0.0000 0.0000 0.0000 0.0000 0.0000 0.0000
Dolomite 0.0000 0.0000 0.0000 0.0000 0.0000 0.0000 0.0005 0.0000 0.0000 0.0000 0.0000 0.0000 0.0000 0.0000 0.0000 0.0000 0.0000 0.0000 0.0000
Urea Fertilization 0.0059 0.0046 0.0114 0.0174 0.0078 0.0124 0.0163 0.0164 0.0133 0.0090 0.0078 0.0087 0.0081 0.0096 0.0104 0.0104 0.0125 0.0162 0.0204
Urban Trees -3.1145 -3.2417 -3.3688 -3.4960 -3.6231 -3.7503 -3.8774 -4.0046 -4.1317 -4.2589 -4.3860 -4.5132 -4.6403 -4.7675 -4.8946 -5.0218 -5.1489 -5.2761 -5.4032
Landfilled Yard Trimmings and
Food Scraps -0.6270 -0.5985 -0.5981 -0.5304 -0.4764 -0.4010 -0.3370 -0.3620 -0.3629 -0.3425 -0.3584 -0.3708 -0.3799 -0.3328 -0.3305 -0.3299 -0.3300 -0.3019 -0.3104
Grass -0.0518 -0.0487 -0.0482 -0.0390 -0.0325 -0.0240 -0.0165 -0.0168 -0.0173 -0.0154 -0.0162 -0.0188 -0.0207 -0.0153 -0.0135 -0.0152 -0.0166 -0.0165 -0.0171
Leaves -0.2559 -0.2471 -0.2460 -0.2174 -0.1958 -0.1668 -0.1396 -0.1357 -0.1332 -0.1233 -0.1217 -0.1263 -0.1294 -0.1103 -0.1016 -0.1050 -0.1076 -0.1036 -0.1032
Branches -0.2554 -0.2460 -0.2445 -0.2148 -0.1924 -0.1622 -0.1340 -0.1300 -0.1273 -0.1170 -0.1153 -0.1200 -0.1232 -0.1034 -0.0944 -0.0976 -0.1000 -0.0963 -0.0959
Landfilled Food Scraps -0.0639 -0.0568 -0.0594 -0.0591 -0.0556 -0.0480 -0.0469 -0.0796 -0.0851 -0.0868 -0.1052 -0.1058 -0.1066 -0.1038 -0.1209 -0.1122 -0.1057 -0.0854 -0.0943
Forest Fires 0.0000 0.0000 0.0000 0.0000 0.0000 0.0000 0.0000 0.0000 0.0000 0.0000 0.0000 0.0000 0.0000 0.0000 0.0000 0.0000 0.0000 0.0000 0.0000
CH4 0.0000 0.0000 0.0000 0.0000 0.0000 0.0000 0.0000 0.0000 0.0000 0.0000 0.0000 0.0000 0.0000 0.0000 0.0000 0.0000 0.0000 0.0000 0.0000
N2O 0.0000 0.0000 0.0000 0.0000 0.0000 0.0000 0.0000 0.0000 0.0000 0.0000 0.0000 0.0000 0.0000 0.0000 0.0000 0.0000 0.0000 0.0000 0.0000
N2O from Settlement Soils 0.0000 0.0000 0.0000 0.0000 0.0312 0.0918 0.0939 0.0884 0.0806 0.0722 0.0665 0.0655 0.0768 0.0784 0.0804 0.0729 0.0777 0.0709 0.0526
Total -36.807 -36.907 -37.027 -40.692 -40.743 -40.730 -42.816 -50.797 -50.936 -51.055 -51.205 -51.345 -51.470 -51.547 -51.669 -51.803 -51.924 -52.026 -52.176
9 Municipal Solid Waste (landfill and combustion)
Total Emissions from Landfills and Waste Combustion (MMTCO2E)
1990 1991 1992 1993 1994 1995 1996 1997 1998 1999 2000 2001 2002 2003 2004 2005 2006 2007 2008
CH4 2.3671 2.3930 2.4891 2.4728 2.6921 2.8668 3.0702 3.1079 3.1431 2.9837 3.1560 2.8868 2.7201 2.7689 2.6544 2.5899 2.7879 2.7508 2.0001
CO2 0.0820 0.0728 0.0731 0.1034 0.1106 0.1117 0.0465 0.0707 0.0528 0.0586 0.0526 0.0469 0.0348 0.0550 0.0765 0.0801 0.0787 0.0785 0.0838
N2O 0.0031 0.0025 0.0025 0.0033 0.0036 0.0036 0.0014 0.0021 0.0015 0.0016 0.0014 0.0012 0.0009 0.0014 0.0018 0.0018 0.0018 0.0018 0.0018
Total 2.4523 2.4683 2.5648 2.5795 2.8063 2.9821 3.1181 3.1806 3.1974 3.0439 3.2100 2.9348 2.7558 2.8252 2.7327 2.6718 2.8683 2.8311 2.0857
CH4 Emissions from Landfills (MTCO2E)
1990 1991 1992 1993 1994 1995 1996 1997 1998 1999 2000 2001 2002 2003 2004 2005 2006 2007 2008
Potential CH4 3E+06 3E+06 3E+06 3E+06 3E+06 4E+06 4E+06 4E+06 4E+06 5E+06 5E+06 5E+06 5E+06 6E+06 6E+06 6E+06 7E+06 7E+06 7E+06
MSW Generation 3E+06 3E+06 3E+06 3E+06 3E+06 3E+06 4E+06 4E+06 4E+06 4E+06 5E+06 5E+06 5E+06 5E+06 6E+06 6E+06 6E+06 6E+06 7E+06
Industrial Generation 178255 184957 191943 202553 218490 235616 252071 265357 289324 303199 318113 329664 348257 374545 399040 421818 443096 451309 459176
CH4 Avoided -94703 -2E+05 -2E+05 -3E+05 -3E+05 -4E+05 -4E+05 -6E+05 -9E+05 -1E+06 -1E+06 -2E+06 -2E+06 -3E+06 -3E+06 -4E+06 -4E+06 -4E+06 -5E+06
Flare 0 -73680 -73680 -3E+05 -3E+05 -2E+05 -82973 -2E+05 -5E+05 -9E+05 -9E+05 -1E+06 -1E+06 -2E+06 -2E+06 -3E+06 -3E+06 -3E+06 -4E+06
Landfill Gas-to-Energy -94703 -94703 -94703 -94703 -94703 -2E+05 -4E+05 -4E+05 -5E+05 -5E+05 -4E+05 -6E+05 -8E+05 -8E+05 -1E+06 -1E+06 -1E+06 -1E+06 -1E+06
Oxidation at MSW Landfills 245180 247386 257366 254491 277258 294958 315917 318780 320295 301194 318850 287781 267408 270192 255019 245576 265447 260508 176308
Oxidation at Industrial Landfills 17826 18496 19194 20255 21849 23562 25207 26536 28932 30320 31811 32966 34826 37454 39904 42182 44310 45131 45918
Total CH4 Emissions 2E+06 2E+06 2E+06 2E+06 3E+06 3E+06 3E+06 3E+06 3E+06 3E+06 3E+06 3E+06 3E+06 3E+06 3E+06 3E+06 3E+06 3E+06 2E+06
CO2, N2O, and CH4 Emissions from Waste Combustion (MTCO2E)
Gas/Waste Product 1990 1991 1992 1993 1994 1995 1996 1997 1998 1999 2000 2001 2002 2003 2004 2005 2006 2007 2008
CO2 82024 72835 73104 103404 110620 111746 46528 70665 52844 58609 52587 46865 34776 54984 76453 80100 78667 78511 83801
Plastics 55009 48958 48847 69303 73283 74514 31030 47672 35671 40128 35764 31747 23547 36959 52296 55359 53835 52876 56646
Synthetic Rubber in MSW 11981 10354 10012 13824 14602 13286 5456.7 7975.1 5871.2 6180.6 5648.4 5148.9 3769.9 5996.3 8125.3 8268.9 7996.2 8602.6 8966.5
Synthetic Fibers 15034 13522 14246 20277 22734 23946 10041 15018 11302 12301 11175 9969.5 7459.7 12029 16032 16471 16836 17032 18189
N2O 3093.5 2474.8 2531 3332.5 3585.6 3585.6 1388.1 2059.3 1510.9 1605.8 1439.3 1188.5 864.95 1362.8 1844.7 1815.6 1786.5 1784.9 1783.3
CH4 83.824 67.059 68.583 90.301 97.159 97.159 37.614 55.8 40.94 43.512 39.001 32.203 23.437 36.926 49.985 49.196 48.408 48.364 48.321
Total CO2, N2O, CH4 Emissions 85201 75377 75704 106827 114302 115429 47953 72780 54396 60258 54065 48086 35665 56383 78347 81964 80502 80344 85633

Appendix p. 7
10 Wastewater
Emissions (MMTCO2E) 1990 1991 1992 1993 1994 1995 1996 1997 1998 1999 2000 2001 2002 2003 2004 2005 2006 2007 2008
Municipal CH4 0.4357 0.4453 0.4546 0.4637 0.4739 0.4835 0.4932 0.5035 0.5136 0.5238 0.5536 0.5662 0.5773 0.5874 0.5993 0.6117 0.6268 0.6405 0.6523
Municipal N2O 0.1773 0.1828 0.1900 0.1938 0.1998 0.2021 0.2079 0.2104 0.2165 0.2247 0.2395 0.2493 0.2478 0.2521 0.2597 0.2675 0.2754 0.2827 0.2886
Industrial CH4 0.0101 0.0109 0.0114 0.0109 0.0115 0.0116 0.0089 0.0075 0.0072 0.0077 0.0083 0.0083 0.0065 0.0063 0.0041 0.0034 0.0038 0.0042 0.0003
Fruits & Vegetables 0.0000 0.0000 0.0000 0.0000 0.0000 0.0000 0.0000 0.0000 0.0000 0.0000 0.0000 0.0000 0.0000 0.0000 0.0000 0.0000 0.0000 0.0000 0.0000
Red Meat 0.0101 0.0109 0.0114 0.0109 0.0115 0.0116 0.0089 0.0075 0.0072 0.0077 0.0083 0.0083 0.0065 0.0063 0.0041 0.0034 0.0038 0.0042 0.0003
Poultry 0.0000 0.0000 0.0000 0.0000 0.0000 0.0000 0.0000 0.0000 0.0000 0.0000 0.0000 0.0000 0.0000 0.0000 0.0000 0.0000 0.0000 0.0000 0.0000
Pulp & Paper 0.0000 0.0000 0.0000 0.0000 0.0000 0.0000 0.0000 0.0000 0.0000 0.0000 0.0000 0.0000 0.0000 0.0000 0.0000 0.0000 0.0000 0.0000 0.0000
Total Emissions 0.6231 0.6391 0.6560 0.6684 0.6852 0.6972 0.7100 0.7214 0.7373 0.7563 0.8014 0.8239 0.8317 0.8458 0.8631 0.8826 0.9059 0.9274 0.9411