10. Tagung „Zahnriemengetriebe“ am Institut für Feinwerktechnik ...
17
10. Tagung „Zahnriemengetriebe“ am Institut für Feinwerktechnik und Elektronik-Design der TU Dresden H. Takagishi (Honda R&D, Tochigi Center, Japan) H. Yoneguchi (Honda R&D, Tochigi Center, Japan) M. Sopouch (AVL List GmbH, Graz, Austria) I. Thiele (AVL Deutschland GmbH, Mainz-Kastel, Germany) Simulation of belt system dynamics using a multi-body approach: Applications to synchronous belts and V-ribbed-belts 1. Abstract 2. Introduction: Dynamic issues arising with belt systems 3. Simulation techniques FEM vs. MBD 4. MBD-model of a belt system 5. Application: Synchronous belt drive 6. Application: V-ribbed belt drive 7. Summary
Transcript of 10. Tagung „Zahnriemengetriebe“ am Institut für Feinwerktechnik ...

10. Tagung „Zahnriemengetriebe“
am Institut für Feinwerktechnik und Elektronik-Design
der TU Dresden
H. Takagishi (Honda R&D, Tochigi Center, Japan) H. Yoneguchi (Honda R&D, Tochigi Center, Japan)
M. Sopouch (AVL List GmbH, Graz, Austria) I. Thiele (AVL Deutschland GmbH, Mainz-Kastel, Germany)
Simulation of belt system dynamics using a multi-body approach: Applications to synchronous belts and V-ribbed-belts
1. Abstract
2. Introduction: Dynamic issues arising with belt systems
3. Simulation techniques FEM vs. MBD
4. MBD-model of a belt system
5. Application: Synchronous belt drive
6. Application: V-ribbed belt drive
7. Summary
10. Tagung „Zahnriemengetriebe“ am Institut für Feinwerktechnik und Elektronik-Design der TU Dresden, 13./14.9.2005
H. Takagishi, M. Sopouch: Simulation of belt system dynamics using a multi-body approach (Seite 1)
1. Abstract
Belts are frequently used in combustion engines for driving the timing/injection system
(synchronous) as well as various accessories (non-synchronous). Irregularities of crankshaft’s
rotary speed on the one hand and alternating driving torques of timing/injection components
on the other hand lead to excitation of belt-system’s natural frequencies. As a consequence,
resonance effects will appear within the operating speed range causing significant rise in
system’s forces, lateral vibrations, wear, and noise. A methodology which allows a reliable
prediction of maximum belt/contact loads and vibration levels is required to estimate lifetime
and noise behaviour in an early stage of the product development. This paper presents a
discrete multi-body dynamics model for the simulation of the belt drives taking into account
the interaction between the belt and all coupled sub-assemblies like crankshaft, cam-
mechanism, and tensioner. The simulation environment used for this purpose is AVL-
TYCON [1].
2. Introduction: Dynamic issues arising with belt systems
In general belt drive dynamics is determined by the time varying characteristics of the system
driving the belt and the system(s) driven by the belt. Furthermore belt and the belt-to-pulley
interface itself may give rise to so called internal excitations caused by belt’s geometrical
deviations and contact compliance (e.g. polygon effect).
For automotive belt applications the main sources of dynamic excitation are given by:
• Irregularity of crankshaft’s rotary motion: Caused by engine combustion and
cranktrain’s mass-forces.
• Alternating drive torques: Caused by cam-mechanisms and injection-components
(common-rail-pump, unit injector).
Figure 1 gives an overview which type of excitation is critical for timing and accessory belt
drives.

10. Tagung „Zahnriemengetriebe“ am Institut für Feinwerktechnik und Elektronik-Design der TU Dresden, 13./14.9.2005
H. Takagishi, M. Sopouch: Simulation of belt system dynamics using a multi-body approach (Seite 2)
Maximum
Minimum
0
500
1000
1500
2000
2500
0 1000 2000 3000 4000 5000 6000 7000 8000
Engine Speed [rpm]
Belt
Forc
e [N
]
∆ω
0
500
1000
1500
2000
2500
3000
0 1000 2000 3000 4000 5000 6000
Engine Speed [rpm]
Bel
t For
ce [N
]
∆M
∆M
∆ωTiming Belt
Accessory Belt
Crankshaft
Valve Trains
Injection (Diesel)
Crankshaft
Figure 1: Overview about critical excitations for timing belt drive and accessory belt drive
In the following typical vibration issues arising with belt systems are listed.
• Belt system’s rotational resonance
The inertia of sub-assemblies driven by the belt and belt’s longitudinal elasticity constitute
a rotational vibratory system. Its 1st natural frequency is mostly the critical vibration mode
of a belt drive. Typical range is 80 Hz to 260 Hz for timing drives and 50 Hz to 200 Hz for
accessory drives.
• Span unloading (=slack spans)
During phases of high dynamic belt loading, spans may temporary become unloaded
(=zero force). This causes a sudden softening of the belt-system accompanied by a drop of
the natural frequency. An instant increase of belt force levels is the result of this highly
non-linear behaviour. To avoid such unfavourable conditions a force reserve of about 50
N shall be maintained even under critical load or resonance conditions.
• Transverse vibrations (parametric excitation)
Transverse belt motion is caused by the fluctuation of the belt tension, which give rise to
so called parametric excitation. Instable belt motion (=high transverse amplitudes)
happens if the excitation frequency is 2/3rd, equal or double the excitation frequency [2].
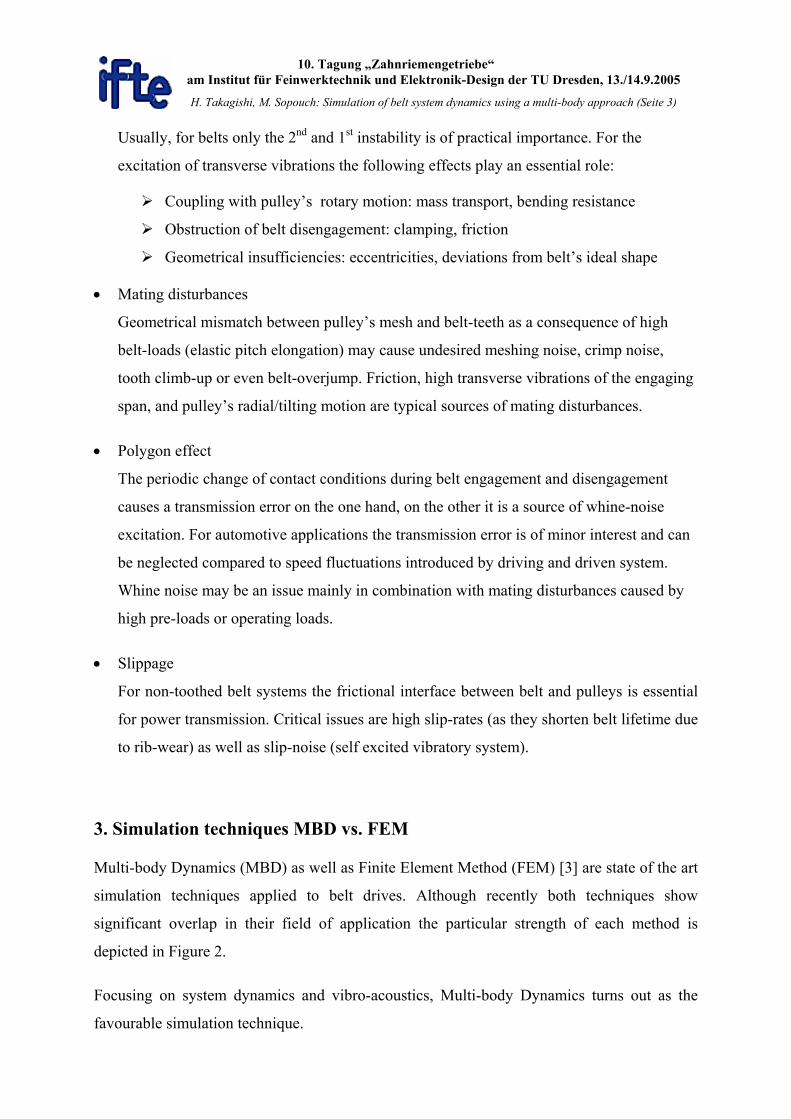
10. Tagung „Zahnriemengetriebe“ am Institut für Feinwerktechnik und Elektronik-Design der TU Dresden, 13./14.9.2005
H. Takagishi, M. Sopouch: Simulation of belt system dynamics using a multi-body approach (Seite 3)
Usually, for belts only the 2nd and 1st instability is of practical importance. For the
excitation of transverse vibrations the following effects play an essential role:
Coupling with pulley’s rotary motion: mass transport, bending resistance
Obstruction of belt disengagement: clamping, friction
Geometrical insufficiencies: eccentricities, deviations from belt’s ideal shape
• Mating disturbances
Geometrical mismatch between pulley’s mesh and belt-teeth as a consequence of high
belt-loads (elastic pitch elongation) may cause undesired meshing noise, crimp noise,
tooth climb-up or even belt-overjump. Friction, high transverse vibrations of the engaging
span, and pulley’s radial/tilting motion are typical sources of mating disturbances.
• Polygon effect
The periodic change of contact conditions during belt engagement and disengagement
causes a transmission error on the one hand, on the other it is a source of whine-noise
excitation. For automotive applications the transmission error is of minor interest and can
be neglected compared to speed fluctuations introduced by driving and driven system.
Whine noise may be an issue mainly in combination with mating disturbances caused by
high pre-loads or operating loads.
• Slippage
For non-toothed belt systems the frictional interface between belt and pulleys is essential
for power transmission. Critical issues are high slip-rates (as they shorten belt lifetime due
to rib-wear) as well as slip-noise (self excited vibratory system).
3. Simulation techniques MBD vs. FEM
Multi-body Dynamics (MBD) as well as Finite Element Method (FEM) [3] are state of the art
simulation techniques applied to belt drives. Although recently both techniques show
significant overlap in their field of application the particular strength of each method is
depicted in Figure 2.
Focusing on system dynamics and vibro-acoustics, Multi-body Dynamics turns out as the
favourable simulation technique.

10. Tagung „Zahnriemengetriebe“ am Institut für Feinwerktechnik und Elektronik-Design der TU Dresden, 13./14.9.2005
H. Takagishi, M. Sopouch: Simulation of belt system dynamics using a multi-body approach (Seite 4)
Aspect
Multi-body Dynamics
System Dynamics,non-linear Vibrations,
Vibro-Acoustics
Mating Behavior
Load Distribution (Mesh)Local stress/strain,
Fatigue
Non-Linear MaterialBehavior
Modeling Effort
Calculation Time1
+ ~
~ +
+-
-
low
moderate
high
high
+
Finite Element Method
© Ifte
System Dynamics,non-linear Vibrations,
Vibro-Acoustics
+ … adequate - … restricted use1 … for Application “Dynamics”
Figure 2: Comparison of methods for belt drive simulation
4. MBD-model of a belt system
When developing a model for belt drive dynamics the following considerations are crucial:
• Requirements of the development process in terms of modelling effort, calculation
time and data availability. This widely depends in which phase of the development a
simulation tool is applied (e.g. concept , prototype, series assessment)
• Effects to be considered: decides about the type of model (e.g. continuos or discrete
belt representation)
The models used with the software TYCON are of a discrete structure where the belt is
considered by a tooth-by-tooth (synchronous belt) or section-by-section (non toothed belt)
approach.
A separate rigid body-element with three Degrees of Freedom (=motion in the belt’s plane)
for each tooth/section is used to consider belt’s mass properties (Figure 3). Beam elements
between the bodies are applied in order to model longitudinal stiffness/damping and bending
behaviour [4].
For synchronous belts the contact between belt tooth and pulley’s tooth gap is evaluated with
consideration of detailed profile shapes at belt and pulley. A so called elastic foundation

10. Tagung „Zahnriemengetriebe“ am Institut für Feinwerktechnik und Elektronik-Design der TU Dresden, 13./14.9.2005
H. Takagishi, M. Sopouch: Simulation of belt system dynamics using a multi-body approach (Seite 5)
model is used to calculate the contact interaction between each belt-tooth and the pulley
(Figure 3).
c , c bending
=
tensile
bendingtensiled , d
tooth i+1
tooth i
tooth i-1
tension memberConnectionbeam
back sidecontact point
section i-1
section i
section i+1
front sidecontact point
tension member
Figure 3: Rigid body representation of synchronous and non-toothed belt
The theoretical area of profile interference given by the current position/orientation of profiles
being in contact is used as basis for the determination of current contact force and direction
(Figure 4). Coulomb’s law is applied for the tangential traction (=friction) in the zone of
contact. Transition from stiction to slip is modelled by a regularised approach.
tooth i
pulleycontour
toothcontour
theoretical areaof profile interference
Figure 4: Contact approach for toothed belt
Slip characteristicsµ
Slipsection i
non-toothed pulley
SkidCreep
Figure 5: Contact & slippage for non toothed belt
For non-toothed belts the interaction between each individual belt section and the pulley is
taken into consideration by a slippage-approach. Linear slip region (=extensional creep) as
well as belt skid are depicted (Figure 5). For V-belts and V-ribbed belts the wedge effect
generates radial friction components between belt flanks and pulley grooves, too. These
forces may be included alternatively, since they are known as a source for the excitation of
transverse belt vibrations.

10. Tagung „Zahnriemengetriebe“ am Institut für Feinwerktechnik und Elektronik-Design der TU Dresden, 13./14.9.2005
H. Takagishi, M. Sopouch: Simulation of belt system dynamics using a multi-body approach (Seite 6)
5. Application: Synchronous Belt Drive
In the following the application to a timing drive system of a modern 5 cylinder diesel engine
with common rail injection is shown. The layout and corresponding TYCON-model are
depicted in Figure 6. Starting from the driving crankshaft pulley the belt (HTDA type) drives
the intake camshaft and the water-pump. In the un-loaded belt span an automatic tensioner
(eccentric type) is used to maintain the required pre-load. Damping is provided mechanically
by friction between bearing pin and eccentric arm. In the tight span an idler is used to prevent
lateral belt vibrations.
CAD-Model of Timing Belt Drive
TYCON Modelin 3D-View
TYCON Model(Component Editor)
Crankshaft
TensionerIdler
Idler
Water-Pump
IntakeCamshaft
Figure 6: Timing drive and corresponding TYCON-model (courtesy of Volvo Car Corporation)
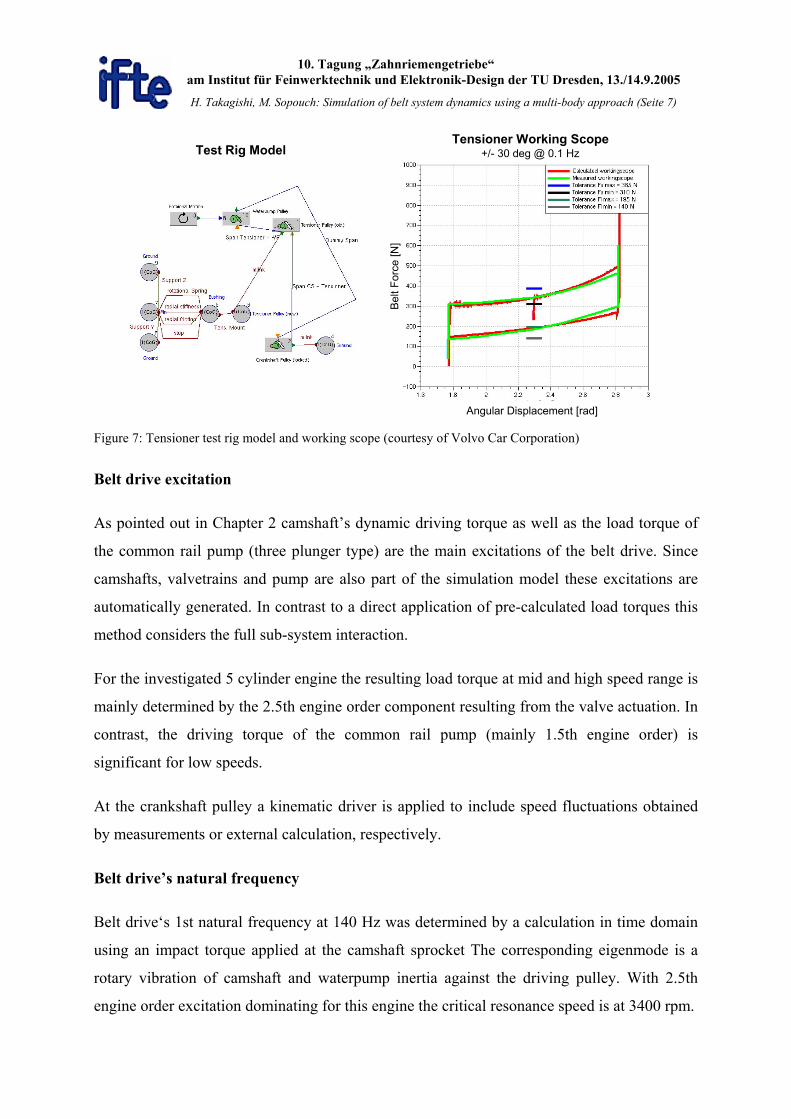
Belt tensioner
It is know that the belt drive dynamics is significantly influenced by the tensioner‘s
characteristics. As a consequence an accurate tensioner model is a pre-requisite to obtain
reliable simulation results. A stand-alone rig-test-model was used to adapt uncertain model
parameters (e.g. friction) by correlating simulation results to a measured tensioner working
scope (Figure 7).
10. Tagung „Zahnriemengetriebe“ am Institut für Feinwerktechnik und Elektronik-Design der TU Dresden, 13./14.9.2005
H. Takagishi, M. Sopouch: Simulation of belt system dynamics using a multi-body approach (Seite 7)
Test Rig Model
Angular Displacement [rad]
Tensioner Working Scope+/- 30 deg @ 0.1 Hz
Bel
t For
ce [N
]
Figure 7: Tensioner test rig model and working scope (courtesy of Volvo Car Corporation)
Belt drive excitation
As pointed out in Chapter 2 camshaft’s dynamic driving torque as well as the load torque of
the common rail pump (three plunger type) are the main excitations of the belt drive. Since
camshafts, valvetrains and pump are also part of the simulation model these excitations are
automatically generated. In contrast to a direct application of pre-calculated load torques this
method considers the full sub-system interaction.
For the investigated 5 cylinder engine the resulting load torque at mid and high speed range is
mainly determined by the 2.5th engine order component resulting from the valve actuation. In
contrast, the driving torque of the common rail pump (mainly 1.5th engine order) is
significant for low speeds.
At the crankshaft pulley a kinematic driver is applied to include speed fluctuations obtained
by measurements or external calculation, respectively.
Belt drive’s natural frequency
Belt drive‘s 1st natural frequency at 140 Hz was determined by a calculation in time domain
using an impact torque applied at the camshaft sprocket The corresponding eigenmode is a
rotary vibration of camshaft and waterpump inertia against the driving pulley. With 2.5th
engine order excitation dominating for this engine the critical resonance speed is at 3400 rpm.

10. Tagung „Zahnriemengetriebe“ am Institut für Feinwerktechnik und Elektronik-Design der TU Dresden, 13./14.9.2005
H. Takagishi, M. Sopouch: Simulation of belt system dynamics using a multi-body approach (Seite 8)
Correlation to measurements
The comparison to measurement was carried out over the entire speed range from 1000 rpm to
5000 rpm. Some uncertain model parameters like belt longitudinal damping or belt-to-pulley
contact stiffness/damping were adjusted within reasonable limits to achieve a high degree of
correlation. In the following the comparison is shown for 3000 rpm and 100 % load. This
speed is already near to the resonance point. As a consequence camshaft angular vibrations as
well as belt forces are close to their maximum.
Figure 8 shows the comparison to measured angular velocity at the intake camshaft pulley. A
good correlation was found. The speed fluctuation is about 15% of the nominal value and
corresponds to an angular vibration amplitude of about 1 deg cam. This is a typical value for
common rail engines which is still acceptable from the viewpoint of valve timing issues.
Time [s]
Ang
ular
Vel
ocity
[ra
d/s]
175
170
165
160
155
150
145
1400.04 0.05 0.06 0.07 0.08 0.09 0.1 0.11 0.12
Angular Velocity - Intake Camshaft Pulley3000 rpm, 100 % Load
MeasurementCalculationω
Figure 8: Angular velocity fluctuation at camshaft pulley (courtesy of Volvo Car Corporation)
The force level in the belt is shown in Figure 9. Since a direct measurement of belt forces is
difficult, the support force of the waterpump pulley was utilised to derive the belt force in the
unloaded span. The comparison shows an acceptable agreement to experimental data. Most
important maximum and minimum values were predicted with sufficient accuracy. A force
reserve of about 100 N is visible against slack (=zero span force). On the tight side, according
to simulation, the maximum force raise up to 2000 N. These values are acceptable to reach the
lifetime requirement for the applied type of belt.

10. Tagung „Zahnriemengetriebe“ am Institut für Feinwerktechnik und Elektronik-Design der TU Dresden, 13./14.9.2005
H. Takagishi, M. Sopouch: Simulation of belt system dynamics using a multi-body approach (Seite 9)
Time [s]
Bel
t For
ce [
N]
700
600
500
400
300
200
100
00.065 0.07 0.075 0.08 0.085 0.1
Belt Force - Water Pump3000 rpm, 100 % Load
MeasurementCalculation
800
0.09 0.095
FBelt
Figure 9: Belt Force at Water-Pump (courtesy of Volvo Car Corporation),
6. Application: V-ribbed belt drive
Introduction
Engine packaging is the main reason why it became popular to drive multiple accessories with
a single V-ribbed belt (serpentine drive). As a consequence the dynamic load applied to the
belt increases and issues like slippage or transversal vibration of belt often lead to a
degradation of durability or noise. In order to avoid these problems, Honda has developed a
method to simulate the slippage between belt and pulley as well as belt’s transversal vibration
with a high degree of accuracy.
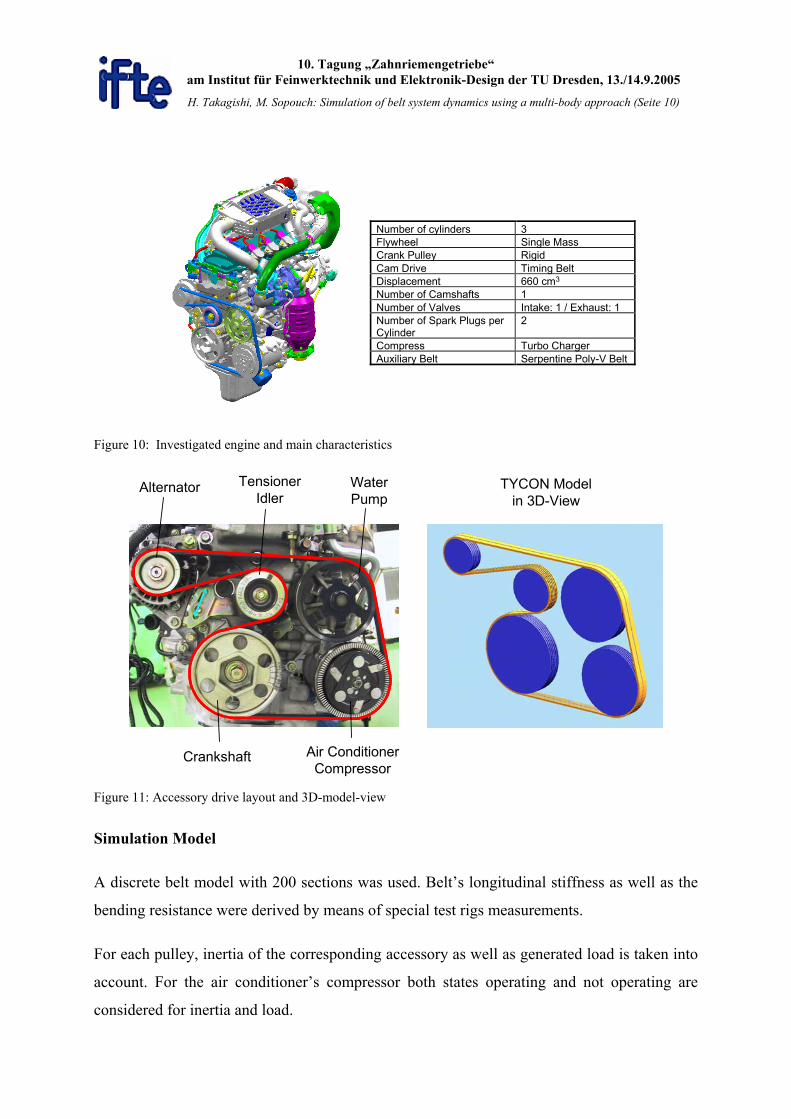
Layout of accessory drive
The engine used for evaluation of the simulation method was a prototype of a 660 cc, turbo-
supercharged, in-line three cylinder gasoline engine. Figure 10. shows an external view and
specifications of this test engine.
A layout of the auxiliary belt drive is shown in Figure 11. A poly-V belt with five ribs was
used to drive the accessories. Tension of belt is adjusted by changing the pivot point of an
idler. It is a so-called “fixed tensioner”.
10. Tagung „Zahnriemengetriebe“ am Institut für Feinwerktechnik und Elektronik-Design der TU Dresden, 13./14.9.2005
H. Takagishi, M. Sopouch: Simulation of belt system dynamics using a multi-body approach (Seite 10)
Number of cylinders 3Flywheel Single MassCrank Pulley RigidCam Drive Timing BeltDisplacement 660 cm3
Number of Camshafts 1Number of Valves Intake: 1 / Exhaust: 1Number of Spark Plugs perCylinder
2
Compress Turbo ChargerAuxiliary Belt Serpentine Poly-V Belt
Figure 10: Investigated engine and main characteristics
Crankshaft Air ConditionerCompressor
Alternator TensionerIdler
WaterPump
TYCON Modelin 3D-View
Figure 11: Accessory drive layout and 3D-model-view
Simulation Model
A discrete belt model with 200 sections was used. Belt’s longitudinal stiffness as well as the
bending resistance were derived by means of special test rigs measurements.
For each pulley, inertia of the corresponding accessory as well as generated load is taken into
account. For the air conditioner’s compressor both states operating and not operating are
considered for inertia and load.

10. Tagung „Zahnriemengetriebe“ am Institut für Feinwerktechnik und Elektronik-Design der TU Dresden, 13./14.9.2005
H. Takagishi, M. Sopouch: Simulation of belt system dynamics using a multi-body approach (Seite 11)
Crankshaft Excitation
Crankshaft rotary speed irregularity is the main reason for the fluctuation of belt tension. A
simple torsional crankshaft model driven by cylinder pressures was developed and coupled to
the belt drive model. Figure 12 shows the correlation between measured and simulated
crankshaft rotary motion at 3000 rpm. Beside the dominating 1.5th engine order, crankshaft’s
torsional natural frequency in the area of 575 Hz is visible.
CrankshaftTorsional Resonance(~575 Hz)
Crankshaft Speed Fluctuation - 3000 rpm
20
21
22
23
24
25
Ang
ular
Vel
ocity
[rad
/s]
0 180 360 540 720Crank Ange [deg]
SimulationMeasured
Crankshaft Speed Fluctuation - 3000 rpm
0
0.1
0.2
0.3
0.4
0.5
0.6
Mag
nitu
de [r
ad/s
]
0 1.5 3 4.5 6 7.5 9 10.5 12 13.5 15Engine Order [-]
SimulationMeasured
Figure 12: Comparison between measured and simulated crankshaft speed fluctuation
Belt drive’s longitudinal resonance
For the determination of drives natural frequencies a step-like change in rotation speed was
applied at the crankshaft’s hub. The investigation of the response in pulley’s rotary motion
indicates several rotational modes constituted by accessories inertia and belt‘s longitudinal
stiffness. Consequently they are also named longitudinal vibrations.
The most important 1st natural frequency is located at 75 Hz where an in phase vibration of
all accessories against the crankshaft pulley takes place. For the dominating excitation with
1.5th engine order this corresponds to a resonance speed of 75 Hz / 1.5th ⋅ 60s/min.= 3000 rpm
The correlation between simulated and measured maximum belt load over engine speed
shows a good agreement (Figure 13). The maximum belt force is visible at 3300 rpm due to a
threefold coincidence of 10.5th engine order excitation, crankshaft torsional resonance (~575
Hz) and 1st parametric instability (~570 Hz with 500 N pre-load) of the belt span between

10. Tagung „Zahnriemengetriebe“ am Institut für Feinwerktechnik und Elektronik-Design der TU Dresden, 13./14.9.2005
H. Takagishi, M. Sopouch: Simulation of belt system dynamics using a multi-body approach (Seite 12)
alternator an idler. At rotational resonance speed (3000 rpm) belt force is lower compared to
1st instability region.
1st parametricInstability
=crankshaftresonance
=
Maximum Belt Load
0
250
500
750
1000
1250
1500B
elt l
oad
[N]
2000 2500 3000 3500 4000 4500Engine speed [rpm]
SimulationMeasured
1st rotationalresonance
=1.5th
engine order 10.5 engine order
Figure 13: Measured and simulated maximum belt load between alternator and idler (500 N belt pre-load)
Slippage between belt and pulley
High slippage between belt and pulley is the primary cause for belt abrasion (durability issue)
and the generation of abnormal noise. Slip noise is caused be a self excited stick-slip vibration
of the belt when the static friction coefficient (stiction) is higher than the dynamic friction
coefficient. For experimental investigations of this phenomenon the speed of belt and
crankshaft pulley was measured using a Laser Doppler System.
Two different belt-designs were evaluated: One that shows significant stick-slip motion
accompanied with abnormal noise, the other one which does not. In the simulation this
behaviour was considered by a modified slip characteristics. For the variant with high stick-
slip motion an increased coefficient of static friction was applied (Figure 14).
Slip Characteristics
0
0.5
1
1.5
2
2.5
3
3.5
Fric
tion
Coe
ffici
ent [
-]
0 0.005 0.01 0.015 0.02 0.025 0.03 0.035 0.04 0.045 0.05Relative Speed (Belt - Pulley) [m/s]
High stick-slip motionLow stick-slip motion
Figure 14: Slip Characteristics for investigated belt designs

10. Tagung „Zahnriemengetriebe“ am Institut für Feinwerktechnik und Elektronik-Design der TU Dresden, 13./14.9.2005
H. Takagishi, M. Sopouch: Simulation of belt system dynamics using a multi-body approach (Seite 13)
A comparison to experimental data was done at the rotation speed of 2800 rpm at which
fluctuation of tension of belt and fluctuation of rotation speed of pulley are high and slippage
easily occurs.
In case of a belt that generates high stick-slip motion (Figure 15, left) it was possible to
simulate that the belt is steeply decelerated and heavily slipping close before the maximum
rotational speed. For a belt that does not generate a significant stick-slip motion (Figure 15,
right), increased slip was detected at maximum rotary speed, too. However, amount of
slippage is small and the belt slips smoothly without generating significant noise. For both
designs, simulation was able to predict stick-slip behaviour with a high degree of accuracy.
Belt design with high stick-slip Belt design with low stick-slip
Velocity of Pulley and Belt - Measurement
280
285
290
295
300
305
310
Rot
ary
Spe
ed [r
ad/s
]
0 90 180 270 360Cam Angle [deg]
BeltPulley
Velocity of Pulley and Belt - Simulation
280
285
290
295
300
305
310
Rot
ary
Spe
ed [r
ad/s
]
0 90 180 270 360Cam Angle [deg]
BeltPulley
High instantaneousslip
Velocity of Pulley and Belt - Measurement
280
285
290
295
300
305
310
Rot
ary
Spe
ed [r
ad/s
]
0 90 180 270 360Cam Angle [deg]
BeltPulley
Velocity of Pulley and Belt - Simulation
280
285
290
295
300
305
310
Rot
ary
Spe
ed [r
ad/s
]
0 90 180 270 360Cam Angle [deg]
BeltPulley
00
Figure 15: Stick-slip motion at crankshaft pulley for two different belt designs
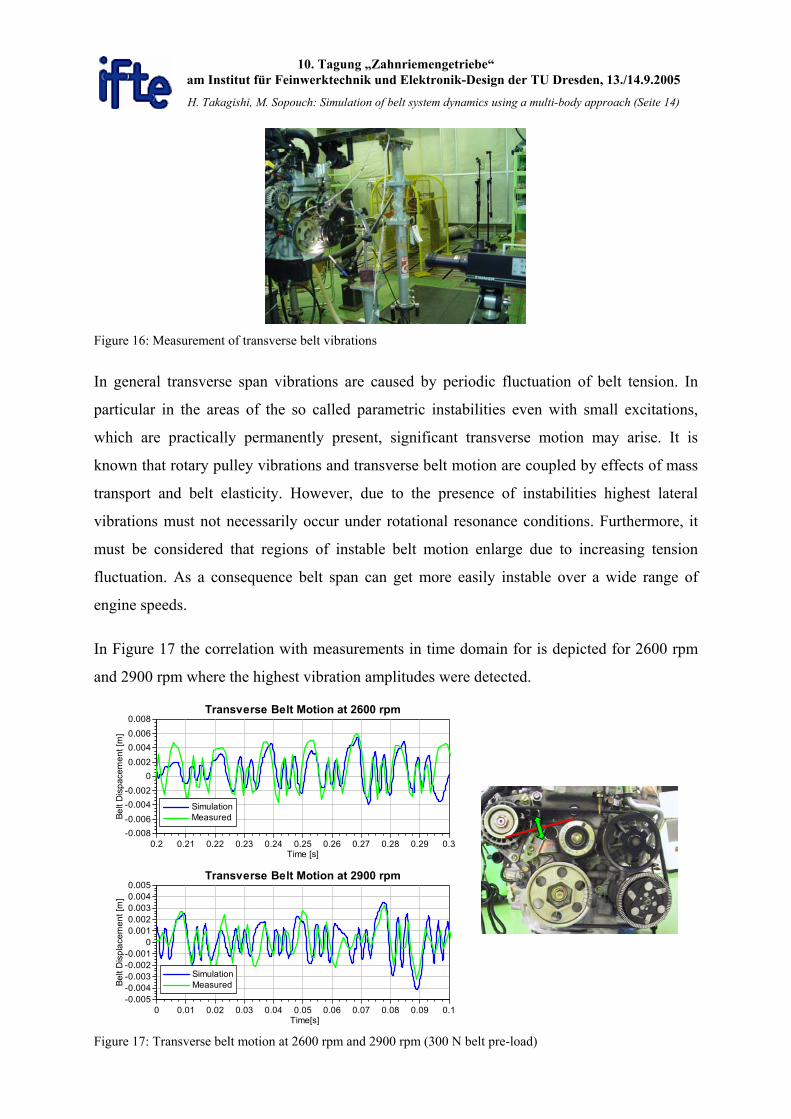
Transverse belt vibrations
For the verification of the simulation model in terms of transverse belt vibrations, belt
displacement was measured under non-contact conditions using an optical displacement
meter. Figure 16 shows a photograph of the measurement set-up.
Investigations were mainly focused on the belt span between alternator and idler where
highest transverse vibrations were observed.
10. Tagung „Zahnriemengetriebe“ am Institut für Feinwerktechnik und Elektronik-Design der TU Dresden, 13./14.9.2005
H. Takagishi, M. Sopouch: Simulation of belt system dynamics using a multi-body approach (Seite 14)
Figure 16: Measurement of transverse belt vibrations
In general transverse span vibrations are caused by periodic fluctuation of belt tension. In
particular in the areas of the so called parametric instabilities even with small excitations,
which are practically permanently present, significant transverse motion may arise. It is
known that rotary pulley vibrations and transverse belt motion are coupled by effects of mass
transport and belt elasticity. However, due to the presence of instabilities highest lateral
vibrations must not necessarily occur under rotational resonance conditions. Furthermore, it
must be considered that regions of instable belt motion enlarge due to increasing tension
fluctuation. As a consequence belt span can get more easily instable over a wide range of
engine speeds.
In Figure 17 the correlation with measurements in time domain for is depicted for 2600 rpm
and 2900 rpm where the highest vibration amplitudes were detected.
Transverse Belt Motion at 2600 rpm
-0.008-0.006-0.004-0.002
00.0020.0040.0060.008
Belt
Dis
pace
men
t [m
]
0.2 0.21 0.22 0.23 0.24 0.25 0.26 0.27 0.28 0.29 0.3Time [s]
SimulationMeasured
Transverse Belt Motion at 2900 rpm
-0.005-0.004-0.003-0.002-0.001
00.0010.0020.0030.0040.005
Belt
Dis
plac
emen
t [m
]
0 0.01 0.02 0.03 0.04 0.05 0.06 0.07 0.08 0.09 0.1Time[s]
SimulationMeasured
Figure 17: Transverse belt motion at 2600 rpm and 2900 rpm (300 N belt pre-load)
10. Tagung „Zahnriemengetriebe“ am Institut für Feinwerktechnik und Elektronik-Design der TU Dresden, 13./14.9.2005
H. Takagishi, M. Sopouch: Simulation of belt system dynamics using a multi-body approach (Seite 15)
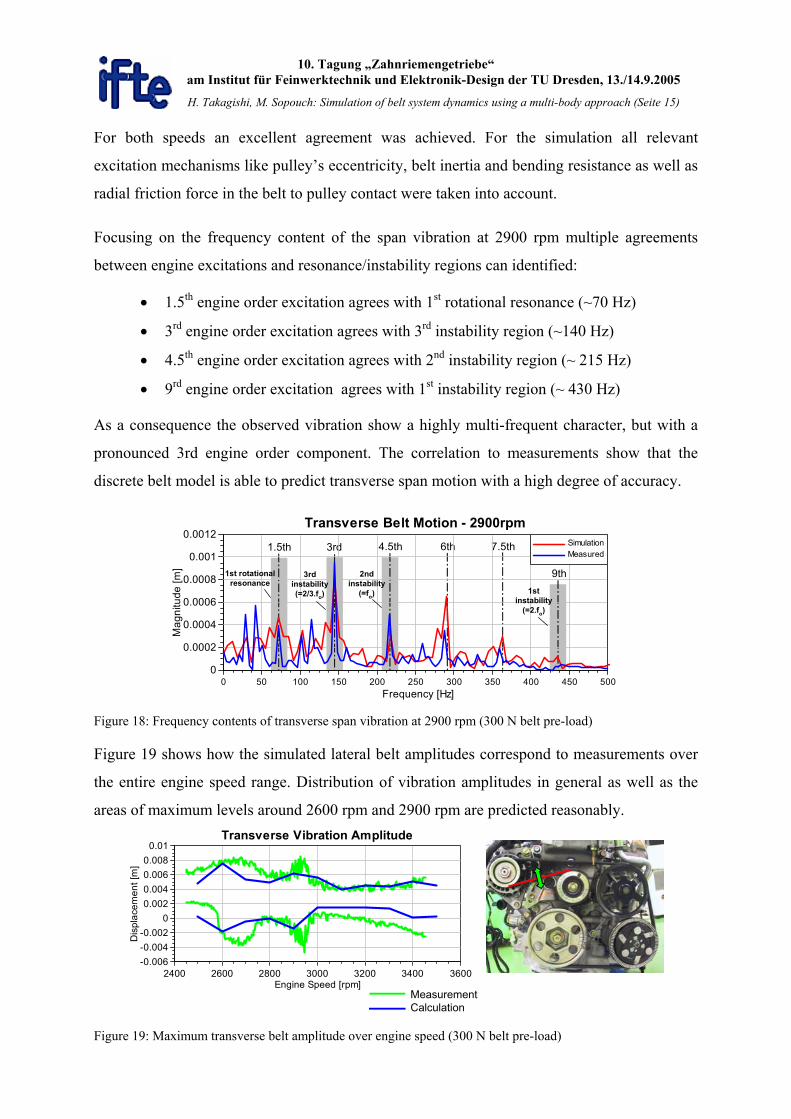
For both speeds an excellent agreement was achieved. For the simulation all relevant
excitation mechanisms like pulley’s eccentricity, belt inertia and bending resistance as well as
radial friction force in the belt to pulley contact were taken into account.
Focusing on the frequency content of the span vibration at 2900 rpm multiple agreements
between engine excitations and resonance/instability regions can identified:
• 1.5th engine order excitation agrees with 1st rotational resonance (~70 Hz)
• 3rd engine order excitation agrees with 3rd instability region (~140 Hz)
• 4.5th engine order excitation agrees with 2nd instability region (~ 215 Hz)
• 9rd engine order excitation agrees with 1st instability region (~ 430 Hz)
As a consequence the observed vibration show a highly multi-frequent character, but with a
pronounced 3rd engine order component. The correlation to measurements show that the
discrete belt model is able to predict transverse span motion with a high degree of accuracy.
1.5th 3rd 4.5th 6th 7.5th
9th
Transverse Belt Motion - 2900rpm
0
0.0002
0.0004
0.0006
0.0008
0.001
0.0012
Mag
nitu
de [m
]
0 50 100 150 200 250 300 350 400 450 500Frequency [Hz]
SimulationMeasured
1st rotationalresonance
3rdinstability(=2/3.fo)
2ndinstability
(=fo) 1stinstability
(=2.fo)
Figure 18: Frequency contents of transverse span vibration at 2900 rpm (300 N belt pre-load)
Figure 19 shows how the simulated lateral belt amplitudes correspond to measurements over
the entire engine speed range. Distribution of vibration amplitudes in general as well as the
areas of maximum levels around 2600 rpm and 2900 rpm are predicted reasonably.
MeasurementCalculation
Transverse Vibration Amplitude
-0.006-0.004-0.002
00.0020.0040.0060.008
0.01
Dis
plac
emen
t [m
]
2400 2600 2800 3000 3200 3400 3600Engine Speed [rpm]
Figure 19: Maximum transverse belt amplitude over engine speed (300 N belt pre-load)

10. Tagung „Zahnriemengetriebe“ am Institut für Feinwerktechnik und Elektronik-Design der TU Dresden, 13./14.9.2005
H. Takagishi, M. Sopouch: Simulation of belt system dynamics using a multi-body approach (Seite 16)
Summary and conclusion
A simulation technique for automotive belt drives was established using a detailed discrete
belt model. Throughout this development process, the following results were obtained:
• For synchronous belts a model incorporating the contact between belt teeth and
pulley’s mesh by taking into account the exact profiles was established.
• With a Poly-V belt model including crankshaft the fluctuation of rotation speed and
belt tension was simulated with high accuracy.
• It became possible to estimate the behaviour of slippage also including the stick-slip
motion by introducing a variable friction coefficient depending on relative slippage
speed.
• Transverse vibration of a Poly-V belt was predicted considering the eccentricity of
pulleys and the frictional obstruction during disengagement.
Acknowledgement
Honda R&D would like to express its thanks to members of Bando Chemical Industries, Ltd.
and Mitsuboshi Belting, Ltd. for their co-operation in establishing the simulation technique
for accessory drives. AVL expresses its appreciation to Volvo Car Corporation in
Gothenburg, Sweden for providing material about the timing belt system presented in this
paper.
References
[1] AVL-Tycon, http://www.avl.com/tycon
[2] Sauer, B.: Stationäre Schwingungen von Keilriemengetrieben im Frequenzbereich bis
240 Hz, VDI-Fortschrittsbericht Nr. 160, VDI-Verlag, Düsseldorf 1988
[3] Institut für Feinwerktechnik der TU Dresden,
http://www.tu-dresden.de/etifwt/wwwroot/forschung/schwerpunkte/zahnriem/
[4] Sopouch, M., Hellinger W., Priebsch, H. H.: Prediction of vibroacoustic excitation due
to the timing chains of reciprocating engines, Proceedings of the Institution of
Mechanical Engineers, Vol. 217 Part K, Journal Multi-body Dynamics, IMechE 2003