![Virginia Department of Rail and Public Transportation (“DRPT”) · Virginia Department of Rail and Public Transportation (“DRPT”) ... [2] MWCOG ... supported by public transportation](https://static.fdocuments.in/doc/165x107/5c7ad28109d3f2f93e8c94f1/virginia-department-of-rail-and-public-transportation-drpt-virginia.jpg)
10-R13 - Virginia Department of Transportation
88
Virginia Transportation Research Council, 530 Edgemont Road, Charlottesville, VA 22903-2454, www.vtrc.net, (434) 293-1900 http://www.virginiadot.org/vtrc/main/online_reports/pdf/10-r13.pdf Final Report VTRC 10-R13 research report Condition Assessment and Determination of Methods for Evaluating Corrosion Damage in Piles on the Hampton Roads Bridge-Tunnel Encapsulated in Protective Jackets Virginia Transportation Research Council BRIAN M. PAILES Graduate Research Assistant MICHAEL C. BROWN, Ph.D., P.E. Research Scientist STEPHEN R. SHARP, Ph.D., P.E. Research Scientist
Transcript of 10-R13 - Virginia Department of Transportation

Virginia Transportation Research Council, 530 Edgemont Road,Charlottesville, VA 22903-2454, www.vtrc.net, (434) 293 -1900
http://www.virginiadot.org/vtrc/main/online_reports/pdf/10-r13.pdf
Final Report VTRC 10-R13
research reportCondition Assessment
and Determination of Methodsfor Evaluating Corrosion Damage
in Pileson the Hampton Roads Bridge-Tunnel
Encapsulated in Protective Jackets
Virginia Transportation Research Council
BRIAN M. PAILESGraduate Research Assistant
MICHAEL C. BROWN, Ph.D., P.E.Research Scientist
STEPHEN R. SHARP, Ph.D., P.E.Research Scientist

Standard Title Page—Report on State Project
Type Report: Final
Project No.: 90260
Report No.: VTRC 10-R13
Report Date: April 2010
No. Pages: 84
Period Covered:
Contract No.:
Title: Condition Assessment and Determination of Methods for Evaluating Corrosion Damage in Piles Encapsulated in Protective Jackets on the Hampton Roads Bridge-Tunnel Author(s): Brian M. Pailes, Michael C. Brown, Ph.D., and Stephen R. Sharp, Ph.D. Performing Organization Name and Address: Virginia Transportation Research Council 530 Edgemont Road Charlottesville, VA 22903
Key Words: Corrosion, concrete piles, encapsulated piles, non-destructive evaluation, destructive evaluation, cross-hole sonic logging, ground penetrating radar, sonic echo, impulse response, electrochemical half-cell, electromagnetic cover meter, electrical resistivity, ultrasonic pulse velocity
Sponsoring Agencies’ Name and Address: Virginia Department of Transportation 1401 E. Broad Street Richmond, VA 23219
Supplementary Notes:
Abstract: The primary purpose of this study was to assess the condition of piles that had been encapsulated in fiberglass and mortar jackets on four bridges that are part of the Hampton Roads Bridge-Tunnel (HRBT). Since these four bridges contain a total of approximately 1,800 piles, it was not feasible to conduct detailed testing and evaluation of each pile. Therefore, a necessary objective of the study was to consider visual, non-destructive, and destructive techniques and recommend those that were most effective and efficient in assessing pile condition under the fiberglass jacket systems. A secondary purpose of this study, at the request of the Virginia Department of Transportation’s State Structure and Bridge Engineer, was to assess the effectiveness of the fiberglass jacket and mortar system in resisting corrosion and to make specific recommendations about application of these or similar systems on Virginia bridges in the future. To accomplish the purposes of this study, 52 HRBT piles were systematically selected for study. These piles represented a variety of conditions, ages, types, and locations. Destructive and non-destructive methods were used to evaluate the piles. Destructive methods included chloride analysis and jacket autopsy. Non-destructive methods included cross-hole sonic logging, ground-penetrating radar, sonic echo, impulse response, half-cell potential, electrical resistivity, ultrasonic pulse velocity, and visual assessment. No single test method was able to assess completely the condition of the jacketed piles. However, a combination of half-cell measurements, sonic echo, impulse response, and chloride analysis was useful in evaluating the condition of jacketed piles. Ultrasonic pulse velocity was used to determine the velocity of sound through the piles, which was used in the calculations for sonic echo, impulse response, and cross-hole sonic logging. Resistivity measurements were used to evaluate the susceptibility of the concrete and mortar to corrosion. Ground-penetrating radar was ineffective in determining the condition of the underlying pile while the jacket was intact because of signal reflection and attenuation caused by steel mesh reinforcement in the mortar. Cross-hole sonic logging was not a practical evaluation method for this application because of the difficulty in placing the transducers on the piles. The HRBT piles that were evaluated displayed corrosion activity ranging from severe section loss of a vertical tendon to no corrosion activity. A majority of the piles exhibited corrosion, but only a small portion showed substantial corrosion-induced damage. The jackets hid corrosion damage, causing the severity of the actual condition of the piles to be underestimated when assessed visually. The study recommends that jackets with mortar fill not be installed on piles with prior corrosion damage, as the jacket will obscure future damage and may accelerate corrosion. The HRBT structure is such a vital structure in southeastern Virginia that the closure of two lanes of traffic would cost users approximately $2.9 million per day. Thus, it is extremely important that the HRBT piles stay in good structural health and that the Virginia Department of Transportation retain the capability to monitor their condition.

FINAL REPORT
CONDITION ASSESSMENT AND DETERMINATION OF METHODS FOR EVALUATING CORROSION DAMAGE IN PILES ENCAPSULATED
IN PROTECTIVE JACKETS ON THE HAMPTON ROADS BRIDGE-TUNNEL
Brian M. Pailes
Graduate Research Assistant
Michael C. Brown, Ph.D., P.E. Research Scientist
Stephen R. Sharp, Ph.D., P.E.
Research Scientist
Virginia Transportation Research Council (A partnership of the Virginia Department of Transportation
and the University of Virginia since 1948)
Charlottesville, Virginia
April 2010 VTRC 10-R13

ii
DISCLAIMER
The contents of this report reflect the views of the authors, who are responsible for the facts and the accuracy of the data presented herein. The contents do not necessarily reflect the official views or policies of the Virginia Department of Transportation, the Commonwealth Transportation Board, or the Federal Highway Administration. This report does not constitute a standard, specification, or regulation. Any inclusion of manufacturer names, trade names, or trademarks is for identification purposes only and is not to be considered an endorsement.
Copyright 2010 by the Commonwealth of Virginia. All rights reserved.

iii
ABSTRACT The primary purpose of this study was to assess the condition of piles that had been encapsulated in fiberglass and mortar jackets on four bridges that are part of the Hampton Roads Bridge-Tunnel (HRBT). Since these four bridges contain a total of approximately 1,800 piles, it was not feasible to conduct detailed testing and evaluation of each pile. Therefore, a necessary objective of the study was to consider visual, non-destructive, and destructive techniques and recommend those that were most effective and efficient in assessing pile condition under the fiberglass jacket systems. A secondary purpose of this study, at the request of the Virginia Department of Transportation’s State Structure and Bridge Engineer, was to assess the effectiveness of the fiberglass jacket and mortar system in resisting corrosion and to make specific recommendations about application of these or similar systems on Virginia bridges in the future. To accomplish the purposes of this study, 52 HRBT piles were systematically selected for study. These piles represented a variety of conditions, ages, types, and locations. Destructive and non-destructive methods were used to evaluate the piles. Destructive methods included chloride analysis and jacket autopsy. Non-destructive methods included cross-hole sonic logging, ground-penetrating radar, sonic echo, impulse response, half-cell potential, electrical resistivity, ultrasonic pulse velocity, and visual assessment. No single test method was able to assess completely the condition of the jacketed piles. However, a combination of half-cell measurements, sonic echo, impulse response, and chloride analysis was useful in evaluating the condition of jacketed piles. Ultrasonic pulse velocity was used to determine the velocity of sound through the piles, which was used in the calculations for sonic echo, impulse response, and cross-hole sonic logging. Resistivity measurements were used to evaluate the susceptibility of the concrete and mortar to corrosion. Ground-penetrating radar was ineffective in determining the condition of the underlying pile while the jacket was intact because of signal reflection and attenuation caused by steel mesh reinforcement in the mortar. Cross-hole sonic logging was not a practical evaluation method for this application because of the difficulty in placing the transducers on the piles. The HRBT piles that were evaluated displayed corrosion activity ranging from severe section loss of a vertical tendon to no corrosion activity. A majority of the piles exhibited corrosion, but only a small portion showed substantial corrosion-induced damage. The jackets hid corrosion damage, causing the severity of the actual condition of the piles to be underestimated when assessed visually. The study recommends that jackets with mortar fill not be installed on piles with prior corrosion damage, as the jacket will obscure future damage and may accelerate corrosion.
The HRBT structure is such a vital structure in southeastern Virginia that the closure of two lanes of traffic would cost users approximately $2.9 million per day. Thus, it is extremely important that the HRBT piles stay in good structural health and that the Virginia Department of Transportation retain the capability to monitor their condition.

FINAL REPORT
CONDITION ASSESSMENT AND DETERMINATION OF METHODS FOR EVALUATING CORROSION DAMAGE IN PILES ENCAPSULATED
IN PROTECTIVE JACKETS ON THE HAMPTON ROADS BRIDGE-TUNNEL
Brian M. Pailes Graduate Research Assistant
Michael C. Brown, Ph.D., P.E.
Research Scientist
Stephen R. Sharp, Ph.D., P.E. Research Scientist
INTRODUCTION
The Hampton Roads Bridge-Tunnel (HRBT) was constructed in 1957, becoming the first gateway connecting Hampton Roads to Norfolk, Virginia. HRBT provided one lane of traffic in each direction, becoming a key artery to the cities of southeastern Virginia. The first HRBT structures were a tunnel and two bridge structures, designated as Structures 2900 and 2902. Because of the increasing traffic demand, a second bridge-tunnel was constructed in 1974, comprising Structures 2827 and 2866, which provided two additional lanes of traffic. In the early 1980s, protective jackets were installed on select piles of Structures 2900 and 2902 because the piles were showing signs of corrosion damage. Soon after, the remainder of the piles were coated in epoxy to protect against further ingress of chlorides. Because of the continued degradation of the HRBT piles, protective jackets were installed on all piles in the period from 1989 through 1994. The Florida Department of Transportation (FDOT) had been using fiberglass jackets on marine piles from the1940s until the 1990s (Hartt et al., 2002). In 1993, Florida’s Bryant Patten Bridge, which had protective jackets, was showing signs of corrosion damage. Because of growing concerns about the condition of the piles, the protective jackets were removed, which revealed that the piles exhibited advanced corrosion in the form of significant cross-section loss and prestressed tendon failure. An in-depth study revealed that the jackets induced accelerated corrosion, resulting from the “ring anode effect;” i.e., accelerated corrosion induced along the perimeter of a concrete repair wherein repair mortar over-cleaned reinforcement creates a cathode in close proximity to steel surrounded by chloride-contaminated concrete. This accelerated corrosion was obscured from view by the fiberglass jacket (Hartt and Rapa, 1998). The jackets used on the HRBT bridge structures are similar in design to the jackets used by FDOT. Visual assessments of the jacketed HRBT piles indicated that they have active corrosion. Further visual inspection revealed that the fiberglass jackets and mortar were falling off and that corrosion product was forming on the jacket mortar and pile surfaces. Cracks were

2
also forming in the jacket mortar and pile concrete. Since the piles were showing signs of corrosion damage, the Virginia Department of Transportation (VDOT) determined that the condition of the piles behind the jackets needed to be evaluated to determine if they were in a condition similar to that observed by FDOT. Because of the anticipated cost and time involved in removing every jacket to inspect the condition of the pile, the researchers decided that non-destructive evaluation (NDE) methods would be used to evaluate pile conditions where possible. NDE could allow for the condition assessment of the HRBT piles without the need for jacket removal.
PURPOSE AND SCOPE
The primary purpose of this study was to assess the condition of piles that had been encapsulated in fiberglass and mortar jackets on four bridges that are part of HRBT. Since these four bridges have a total of approximately 1,800 piles, it was not feasible to conduct detailed testing and evaluation of each pile. Therefore, a necessary objective of the study was to consider visual, NDE, and destructive techniques and recommend those that were most effective and efficient in assessing pile condition under the fiberglass jacket systems. A secondary purpose of the study, at the request of VDOT's State Structure and Bridge Engineer, was to assess the effectiveness of the fiberglass jacket and mortar system in resisting corrosion and to make specific recommendations about application of these or similar systems on Virginia bridges in the future.
In this report, the term jacket implies the fiberglass and mortar system that encapsulates a pile. The evaluation methods used in this study were limited to methods that were well established in the field of concrete investigation and limited to those readily available to the researchers. The research was performed as a field study to directly assess the effectiveness of the evaluation methods in determining the presence of corrosion damage in the piles and the effectiveness of the jacketing system in preventing or stopping corrosion activity. Limits on field access and time at the HRBT bridge structures allowed for the evaluation of 52 piles, which were used to estimate the overall condition of the structure. The piles that were evaluated represented a variety of conditions, ages, types, and locations. Since this was a small sample size, the presentation of the overall condition of the HRBT structures was general.
METHODS To accomplish the objectives of this study, four tasks were performed:
1. Review of construction and inspection documentations:
• construction documents for all four bridge structures • inspection reports completed over the life of the structures.
3
2. Visual assessment of the bridge piles:
• visual survey of the piles accessed by boat • visual evaluation of the fiberglass, mortar, and substrate.
3. Selection of piles for further study: using inspection reports and visual assessment, piles were selected for NDE and physical testing.
4. Selection of methods and evaluation of selected piles using destructive and NDE
methods:
• ground-penetrating radar (GPR) • cross-hole sonic logging (CSL) • sonic echo (SE), impulse response (IR) • chloride sampling • half-cell potentials • ultrasonic pulse velocity (UPV) • resistivity • autopsy, i.e., partial removal of jackets for direct inspection of the substrate.
Review of Construction and Inspection Documentations Review of Construction HRBT comprises four bridge structures and two tunnel sections (Figure 1), with each direction of traffic being carried on its own set of structures consisting of two bridges and one tunnel. VDOT Structures 2827 (Federal Structure Number 20339) and 2866 (20352) carry the eastbound traffic; the westbound traffic is carried by Structures 2900 (20353) and 2902 (20355). The four HRBT bridge structures are supported by 24-in square piles (Figure 2) and 54-in circular diameter piles (Figure 3). Table 1 provides the number of piles for each bridge structure and the number of piles for each cross-section type. To identify each pile on all four structures, a method of labeling each pile was developed for this study based on its location on each bent relative to the east face. At each bent, the pile farthest to the east was designated Pile A and the subsequent piles were labeled in alphabetical order (Figure 4). On some of the bents, piles were paired in a north-south orientation; the northern pile was given the next letter in sequence, followed by the southern pile. The pile layout for each bent varied depending on the type of pile, when the bridge was built, and whether an extension was added. The circular piles were typically grouped in threes and located only on the southern structures, i.e., Structures 2866 and 2900 (Figure 4a). The square piles were in two configurations: (1) a single line, as seen on Structures 2827 and 2866 (Figure 4b), the newer structures, or (2) a single line with pairs of north-south aligned piles along the eastern side that were part of the bridge widening completed in 1999 on Structures 2900 and 2902 (Figure 4c).

4
Figure 1. Layout of Hampton Roads Bridge-Tunnel
Figure 2. Square Pile Cross-Section. Typ. = typical; S/R = stress relieved; Eq. Sp. = equally spaced. Source: Hampton Roads Project, Second Bridge – Tunnel Crossing, Contract T-3, North & South Approach Bridges, Type “A” Pile Bent Details, Drawing No. S-13, Original Design, Virginia Department of Transportation, Plan No. 224-03, 1971, As-built Plan, Parsons Brinkerhoff Quade and Douglas, New York, 1977.

5
Figure 3. Circular Pile Cross-Section. Source: Hampton Roads Project, Second Bridge–Tunnel Crossing, Contract T-3, South Approach Bridge, Type “B” Pile Bent Details, Drawing No. S-14, Original Design, Virginia Department of Transportation, Plan No. 224-03, 1971, As-built Plan, Parsons Brinkerhoff Quade and Douglas, New York, 1977.
Table 1. Number of HRBT Piles
Structure No. Pile Type 2827 2866 2900 2902
Total
24-in Square 338 336 410 472 1,556 54-in Circular 0 105 179 0 284 Total 338 441 589 472 1,840
N
A B C
B
A
C D E F
B A C D E F
North Face
b)
c)
a)
Figure 4. Pile Layout and Labeling: a) Circular Pile Layout; b) Square Pile Layout on Newer Bents;
c) Square Pile Layout on Older Bents

6
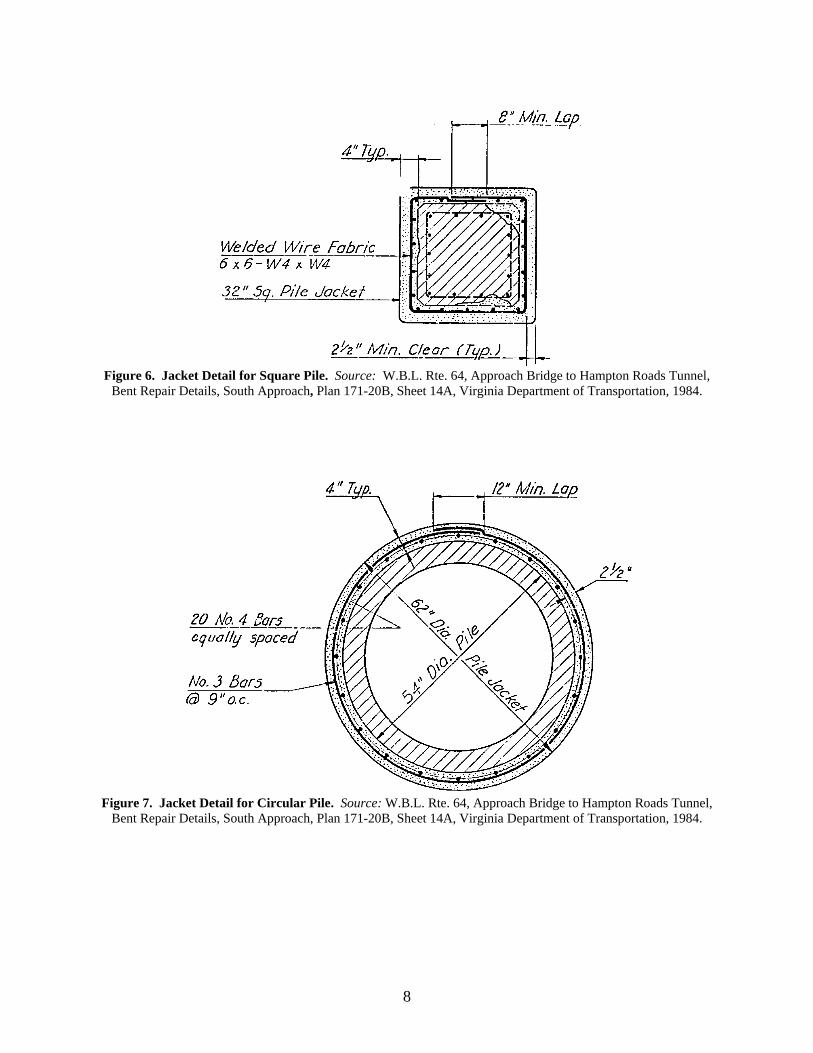
In 1981, because of growing concerns of chloride ingress and corrosion of the HRBT piles, jackets were installed to prevent further corrosion damage. The jackets were intended to stop further chloride infiltration and decrease levels of oxygen and water. Initially, jackets were placed only on piles showing significant cracking and spalling. In the 1990s, all remaining piles were jacketed, regardless of their existing condition. HRBT was expanded in 1999, but personnel of VDOT’s Hampton Roads District decided that the piles on the expansion did not require jackets. Jackets installed on piles with a square cross-section comprise 32-in square fiberglass casings that extend from below the pile cap down to the mud line (Figure 5). In the 4-in gap between the pile and the fiberglass casing, there was typically 4-in by 4-in welded wire fabric (WWF) and vacuum-pumped mortar fill (Figure 6). At the bottom and top of the fiberglass jacket, epoxy (Type EP6 with one part sand) was used to seal the mortar to prevent moisture from infiltrating the mortar or the joint between the mortar and pile. On a few piles, the jackets were not extended to the mud line; the reason for this is unclear. For jackets installed on piles with a circular cross-section, a 62-in-diameter fiberglass casing was placed around the pile and extended from below the pile cap to the mud line (Figure 5). In the cavity between the fiberglass casing and the pile was a cage composed of 20 No. 4 vertical reinforcement bars and No. 3 ties placed at 9-in on center. This cage was located in the center of a vacuum-pumped mortar fill (Figure 7). At the bottom and top of the fiberglass jacket, epoxy (Type EP6 with one part sand) was used to seal the mortar to stop moisture infiltration. On select piles, the jackets were not extended to the mud line; the reason for this is unclear. Review of Inspection Documentation VDOT’s Hampton Roads District is responsible for a biannual inspection of HRBT and an underwater inspection of the submerged substructure every 4 years. The inspectors summarize findings from these inspections in an inspection report. To understand how damage to the structure had progressed over the years, the inspection reports were reviewed for notes of damage to the piles or jackets, starting with the inspection done prior to the installation of the jackets through the most recent inspection. The damage prior to the installation of the jackets was important because FDOT had found that piles with damage prior to jacket installation underwent accelerated corrosion attributable to the ring anode effect (Hartt and Rapa, 1998). Identifying whether piles had damage prior to jacket installation would help determine if those piles were in worse condition than piles that were in sound condition when the jacket was installed. VDOT’s method of jacket installation on damaged piles was similar to the method used by FDOT (Hartt and Rapa, 1998). Damaged concrete was removed from the pile, the reinforcement cleaned of any corrosion product or marine growth, and new mortar placed (Figure 8). The detail of concern is that the steel was left concurrently in contact with chloride-contaminated concrete and, after repair, new chloride-free mortar, which can create an electrochemical potential imbalance, resulting in the ring anode effect.

7
Figure 5. Jacket Repair Detail for Full-length and Partial-length Jacket. Source: W.B.L. Rte. 64, Approach Bridge to Hampton Roads Tunnel, Bent Repair Details, South Approach, Plan 171-20B, Sheet 14A, Virginia Department of Transportation, 1984.
8
Figure 6. Jacket Detail for Square Pile. Source: W.B.L. Rte. 64, Approach Bridge to Hampton Roads Tunnel,
Bent Repair Details, South Approach, Plan 171-20B, Sheet 14A, Virginia Department of Transportation, 1984.
Figure 7. Jacket Detail for Circular Pile. Source: W.B.L. Rte. 64, Approach Bridge to Hampton Roads Tunnel,
Bent Repair Details, South Approach, Plan 171-20B, Sheet 14A, Virginia Department of Transportation, 1984.

9
Figure 8. VDOT Concrete Repair Detail. Source: W.B.L. Rte. 64, Approach Bridge to Hampton Roads Tunnel,
Bent Repair Details, South Approach, Plan 171-20B, Sheet 14B, Virginia Department of Transportation, 1984.
Visual Assessment of Bridge Piles
Visual Survey by Boat Access In June 2008, the researchers performed a visual inspection that focused only on the pile condition. Using a boat for access, the researchers visually inspected 1,840 piles and noted the condition of the fiberglass casing, mortar, and substrate. Researchers documented whether the fiberglass casing was still in position on the pile, if it was breaking apart, or if it was missing. The mortar fill was surveyed for signs of damage in the form of corrosion product, section loss, and exposed reinforcement. If the fiberglass was intact on a pile, it was not possible to assess the condition of the mortar or the substrate. The exception was a small portion of exposed substrate at the top of the pile (Figure 9). The substrate was inspected for signs of damage in the form of corrosion product, cracking, spalling, or section loss, all of which result from steel reinforcement corrosion.
Figure 9. Substrate Exposed Above Jacket

10
Importance was placed on corner cracks resulting from the corrosion of the corner reinforcement of the pile. Corner reinforcement is subjected to chloride intrusion from two directions and often initiates before reinforcement corrosion in other locations. Visual Evaluation of Fiberglass, Mortar, and Substrate To quantify the inspection data, a numerical rating system for the visual condition of the pile components, i.e., fiberglass, mortar, and substrate, was developed, based on a scale from 0 to 5. To establish a rating for the overall visual condition of the pile, a scale from 1 to 5 was used, based on the weighted sum of each component rating. Equation 1 relates the visual condition rating system for each component of the pile to the overall visual condition rating of the pile. The weights were based on several factors; first was the structural importance of the component. The substrate has the largest weight since it is structural, therefore critical to the bridge performance, making any damage a concern. In addition, several piles were selected that represented each overall visual condition rating category. The equation weights were adjusted to ensure the overall visual condition rating equation properly reflected the relative conditions of these referenced piles. Overall condition = Fiberglass rating + Mortar rating * 3 + Substrate rating * 6 [Eq. 1] Fiberglass Condition Rating System Figure 10 and Table 2 provide a description of the fiberglass condition, the associated rating, and a sample image of a pile that received that rating. For fiberglass condition ratings of 3 or higher, mortar was exposed and could be visually assessed. Fiberglass casings were inspected only above the water line, so if a casing was completely missing above the water line, the condition rating was 5. In this instance, a part of the casing could still exist below the water line.
Figure 10. Visual Condition Rating of Fiberglass. Condition ratings are described in Table 2.
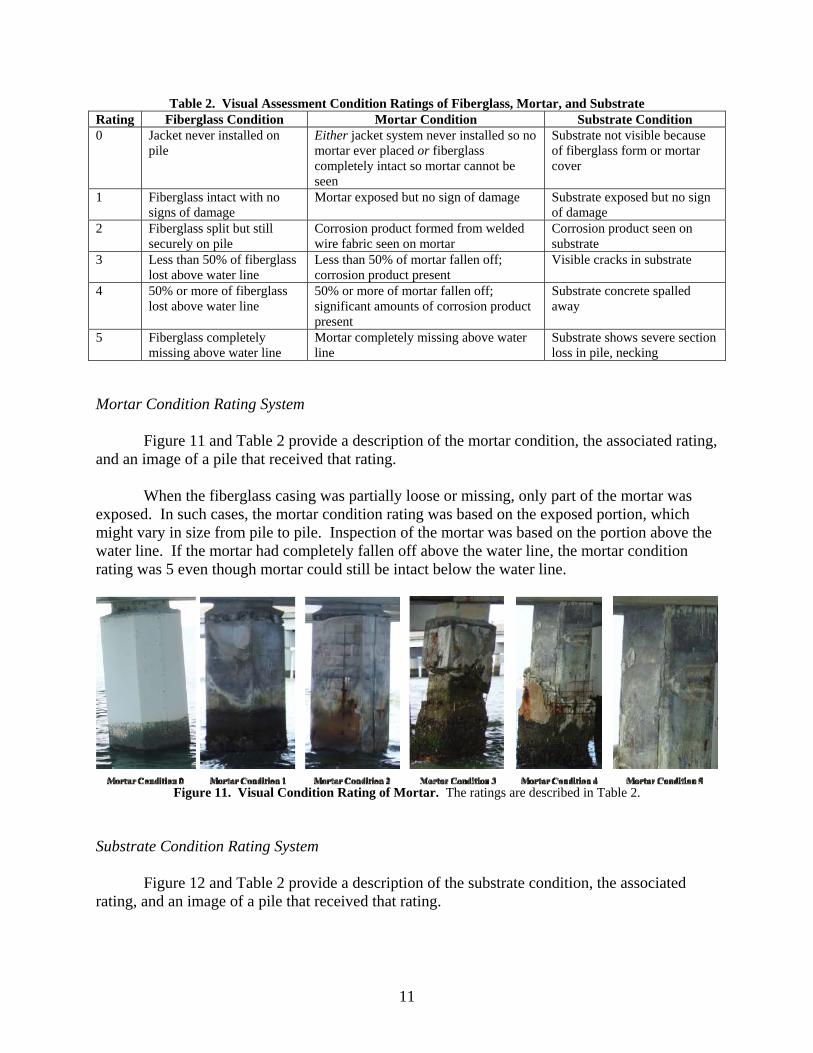
11
Table 2. Visual Assessment Condition Ratings of Fiberglass, Mortar, and Substrate Rating Fiberglass Condition Mortar Condition Substrate Condition 0 Jacket never installed on
pile Either jacket system never installed so no mortar ever placed or fiberglass completely intact so mortar cannot be seen
Substrate not visible because of fiberglass form or mortar cover
1 Fiberglass intact with no signs of damage
Mortar exposed but no sign of damage Substrate exposed but no sign of damage
2 Fiberglass split but still securely on pile
Corrosion product formed from welded wire fabric seen on mortar
Corrosion product seen on substrate
3 Less than 50% of fiberglass lost above water line
Less than 50% of mortar fallen off; corrosion product present
Visible cracks in substrate
4 50% or more of fiberglass lost above water line
50% or more of mortar fallen off; significant amounts of corrosion product present
Substrate concrete spalled away
5 Fiberglass completely missing above water line
Mortar completely missing above water line
Substrate shows severe section loss in pile, necking
Mortar Condition Rating System Figure 11 and Table 2 provide a description of the mortar condition, the associated rating, and an image of a pile that received that rating. When the fiberglass casing was partially loose or missing, only part of the mortar was exposed. In such cases, the mortar condition rating was based on the exposed portion, which might vary in size from pile to pile. Inspection of the mortar was based on the portion above the water line. If the mortar had completely fallen off above the water line, the mortar condition rating was 5 even though mortar could still be intact below the water line.
Figure 11. Visual Condition Rating of Mortar. The ratings are described in Table 2.
Substrate Condition Rating System Figure 12 and Table 2 provide a description of the substrate condition, the associated rating, and an image of a pile that received that rating.

12
Figure 12. Visual Condition Rating of Substrate. The ratings are described in Table 2. The photograph for Condition 4 (*) is from the Route 615 Chickahominy River Bridge in Virginia, not HRBT. The photograph for Condition 5 (**) is from the St. George Island Bridge in Florida, not HRBT (Source: Hartt and Rappa, 1998). Conditions 4 and 5 were not observed on HRBT during this study.
The substrate condition rating reflected the condition of any portion of the substrate exposed by damage to the jacket. If the fiberglass or mortar was intact, the substrate could not be visually evaluated. A small section of substrate was exposed at the top of every jacketed pile. If that area showed no signs of damage and the jacket or mortar obscured the rest of the substrate, the substrate condition rating was 0. If the substrate exposed at the top portion of the pile showed signs of damage, such as corrosion product or spalling, the substrate condition rating reflected that damage. Overall Visual Condition Rating After the fiberglass, mortar, and substrate were rated, the overall condition rating of the pile was determined from the weighted sum of the fiberglass, mortar, and substrate ratings as shown in Equation 1. Based on the weighted summation of the visual condition ratings given to the fiberglass, mortar, and substrate, an overall visual condition rating was given to the pile in accordance with the system shown in Table 3.
Table 3. Overall Visual Condition Rating System for Piles Weighted Summation Value Overall Visual Condition Rating
1 1 2-8 2 9-13 3 14-21 4 22-50 5
Selection of Piles for Further Study The overall visual condition ratings were used to rank the HRBT piles. Since HRBT was composed of four bridge structures with a total of 1,840 piles, every pile could not be studied in the scope of this project. A representative sample of piles was selected to investigate the condition of the piles. Based on limited time and access to the structure, it was initially

13
determined that 10 piles would be sampled from each bridge, with two piles for each of five visual condition categories. The resulting sample was 40 total piles with eight in each condition category. It was also important to use a sample of piles that were documented to have exhibited corrosion damage prior to jacket installation to determine if those piles developed accelerated corrosion attributable to the ring anode effect. Another consideration was that Structures 2866 and 2900 had square and circular cross-section piles, unlike Structures 2827 and 2902, which had only square piles. To determine what effect cross-section had on the effectiveness of the jacket, one pile in each condition category was selected for each cross-section type. Researchers also learned that because of their existing condition 10 other piles had been identified by VDOT for jacket replacement. Several of these piles were selected for autopsy since the existing jackets would be replaced. A night lane closure was also added to the testing schedule, allowing several more piles to be evaluated. Thus, a total of 52 piles were studied. Although each pile selected had a jacket at one time, at the time of inspection the jacket may no longer have been intact.
Selection of Methods and Evaluation of Pile Condition Methods for evaluating pile condition behind the jacket were selected based on the proven effectiveness in assessing the condition of reinforced concrete, applicability to the HRBT piles, and usefulness of information in determining the condition of the steel and concrete. The key areas that the researchers were interested in understanding were the following:
• the condition of the reinforcing steel of the pile substrate • the concrete cross-section integrity • material properties of the concrete • corrosion activity of the substrate steel.
Based on these considerations, the following methods were selected for the evaluation of
the selected HRBT piles: GPR, CSL, SE, IR, chloride analysis, half-cell potential readings, resistivity, and UPV. GPR has the ability to determine the condition of reinforcing steel in concrete members, which made it a good option for determining the condition of the substrate steel. CSL, SE, and IR have the capability of determining the integrity of a concrete cross-section. Resistivity and UPV are methods that would give insight into the material properties of the concrete and mortar of the HRBT piles. Half-cell potential measurements and chloride analysis are capable of determining the probability of corrosion activity of reinforced concrete members. Information regarding the physics and principle of operation for these methods was provided by Pailes (2009). Not every test method selected was used for all 52 piles. The main reason for this was the time constraint. There was only a limited amount of time the researchers were allowed to be on the bridge. This meant that the more rapid test methods, such as SE and IR, were used for more piles than were chloride analysis and half-cell measurements. The chloride analysis and half-cell potential methods were used for a limited number of piles because of the time these tests take. To the best of the researchers’ ability, the subset of the 52 piles sampled for chloride analysis and half-cell measurements represented an even distribution of pile types, conditions, and locations. The rest of the test methods were performed on as many possible piles as time

14
would allow. The piles on which each method was used comprised a random sample of the 52 selected piles. The random sample for each method was dictated by the researchers’ time in the field. Ground-Penetrating Radar The north face of each pile was chosen for GPR scanning because of the limited access provided by the snooper trucks. The north face was used consistently for evaluation with the other techniques. GPR scanning was performed in accordance with ASTM D6432, Standard Guide for Using the Surface Ground Penetrating Radar Method for Subsurface Investigation (ASTM International [ASTM], 2009c). The frequency of the GPR antennas used was 2.6 GHz and 1.6 GHz at a scan rate of 60 scans/ft. With a tape measure and chalk line, a 4-in by 4-in grid was laid out on the face of the pile, above the water line. GPR scans were completed in the horizontal and vertical directions to detect vertical and horizontal reinforcement. Depending on the condition of the pile, the scans were performed over fiberglass, mortar, or substrate. During the autopsy of the jackets, GPR scans were performed on the jacket prior to demolition and then again on the exposed pile substrate. Cross-Hole Sonic Logging CSL was used to evaluate the portion of the pile that was submerged, an area that cannot be visually assessed and is difficult or impractical for other NDE methods to address. CSL was performed in accordance with ASTM D6760, Standard Test Method for Integrity Testing of Concrete Deep Foundations by Ultrasonic Crosshole Testing (ASTM, 2009c). The CSL probes were scanned along the outside of the pile, using polyvinylchloride (PVC) pipes, attached to the pile using adjustable nylon straps. The pipes guided the transmitter and receiver along the length of the pile (Figure 13). CSL configuration was developed such that the greatest amount of cross-section could be scanned despite limited access. The initial scans, which were performed on square piles, used two tubes on each opposing face, which allowed four scans (Figure 14). After the initial field visit with the CSL equipment, the tube configuration was changed. The tubes were placed at the center of the pile face, which would allow six scans (Figure 15). Sonic Echo and Impulse Response SE and IR were conducted simultaneously with the same equipment. SE/IR involves striking the pile with a hammer and measuring the response of the piles. The difference between the two methods is in the post-processing of the data. In IR, the data are normalized by the impact force and the wave is plotted in the frequency domain. SE uses the time domain. SE/IR can detect damage in the pile by measuring the reflections of the compression wave and may give the elevation at which damage exists (Davis, 2003). SE/IR was performed in accordance with ASTM D5882, Standard Test Method for Low Strain Impact Integrity Testing of Deep Foundations (ASTM, 2009c). In a typical SE/IR analysis, the top of the pile is struck with a hammer.

15
Figure 13. Cross-Hole Sonic Logging Test Configuration
Figure 14. Cross-Hole Sonic Logging Two-Face Tube Configuration
Figure 15. Cross-Hole Sonic Logging Centered Tube Configuration

16
However, the HRBT piles have pile caps and access to the top of the cap is limited. A new method for striking the pile was developed, and the accelerometer and geophone were mounted in non-typical locations. Instead of striking the top of the pile with the hammer, the strike was made at the bottom of the pile cap adjacent to the pile of interest, with an upward force, which would send the compression wave to the top of the pile cap and then down into the pile (Figure 16). The geophone was placed at the top of the pile cap, above the pile, and the accelerometer was placed on the vertical pile face, where the substrate was exposed above the jacket. A 3-lb hammer specially designed for this type of test was used to make the impact on the structure. Different impact heads were used to change the wave frequency from the hammer strike. The two hardest rubber heads that were available were used for the testing. The hardness of each head was designated by color, with black being the stiffest and red being the second stiffest. The hammer with the desired head was struck five consecutive times on the underside of the pile cap adjacent to the pile being evaluated. The compression wave traveled up to the top of the cap, reflected down into the pile, and reflected back from the pile toe from changes in pile stiffness or from significant defects. Each pile was evaluated with impacts from both rubber heads.
Figure 16. Travel Path of Sonic Echo / Impulse Response Signal

17
Chloride Sampling To determine the degree of chloride contamination, concrete samples were retrieved from selected piles and the chloride contents and diffusion coefficients were measured. The total acid-soluble chloride content of each concrete sample was determined in accordance with ASTM C1152, Standard Test Method for Acid-Soluble Chloride in Mortar and Concrete (ASTM, 2009b). Initially, powder samples were collected at varying elevations on each sampled pile. The amount and location of the samples varied since the pile surface that could be accessed by the platform snooper varied. The process involved removing the fiberglass jacket with a 4-in hole saw to gain access to the mortar. At the mortar face, drilling began, discarding the first ¼-in of the mortar. A vacuum was placed next to the drill, and as the next ½-in depth was drilled, the vacuum collected the powder sample into an in-line filter. Each ½ in of depth was sampled separately and sealed in a sterile bag. This process continued until the drill reached the pile reinforcing steel. Sampling was stopped at the mortar/concrete interface, whether or not the drilling had reached a ½-in increment as the concrete and mortar represent different materials, ages, and diffusion rates. To improve efficiency, during the later inspections cores rather than powdered samples were taken at different elevations on each pile tested. The number of core samples taken varied because of the water level, which affected the amount of pile surface area that could be accessed by the platform snooper. When cores were taken from jacketed piles, the fiberglass was removed with a 4-in-diameter hole-saw to access the mortar. The first approximately 4 in of the core was of the jacket mortar. This was placed in a sterile bag, sealed, and labeled. A separate core of the concrete substrate was taken that extended from the substrate face to the reinforcement. The typical concrete cover in the HRBT piles was 3 in. Cores were taken back to the laboratory and cut with a dry masonry saw into ½-in wafers. These wafers were then ground to pass a No. 30 sieve and analyzed for chloride content. Half-Cell Potentials The half-cell procedure was conducted in accordance with ASTM C876, Standard Test Method for Half-Cell Potentials of Uncoated Reinforcing Steel in Concrete (ASTM, 2009a), and involved making a connection to the reinforcement cage of the pile. A piece of steel wire and solder were used to connect to the steel by placing the steel wire and hammering the solder to hold the wire firmly to the steel to make an electrical connection. To verify the establishment of an electrical connection, the resistance between the steel connection and steel exposed in another location of the pile was checked. During the first field visit to HRBT, half-cell measurements were taken on the north face of the pile, down the center, starting at the top of the pile and moving downward at 6-in intervals to water line. If the fiberglass jacket was intact, a hole saw was used to remove the jacket in the locations where half-cell measurements were to be made. Along with recording the potential, researchers noted if the half-cell measurement was taken on the mortar surface or on the substrate; no mortar was intentionally removed to reach the substrate during the initial visit.

18
On the subsequent visits, half-cell measurements were taken where cores were made for chloride analysis. After the mortar was removed by coring, half-cell measurements could be made on the substrate face. Measurements were no longer made on the mortar surface. Ultrasonic Pulse Velocity UPV was used to obtain an accurate measure of the velocity of sound through the piles, which is used in the calculations for SE, IR, and CSL. UPV was performed in accordance with ASTM C597, Standard Test Method for Pulse Velocity through Concrete (ASTM, 2009b). UPV transducers were placed on opposite faces of exposed substrate and transmitted a sound wave through the substrate to the receiver. The time for the wave to travel the known distance between the transducers was used to calculate velocity. Several measurements on different piles were taken to determine an average velocity of sound through the pile substrate. Resistivity To measure the resistivity of the HRBT piles, a four-probe resistance meter was used. The probe spacing was set at 1.5 in. The resistance meter produced a square wave at 24 V with an operating frequency of 97 Hz. Resistance measurements were made on the concrete substrate and the mortar fill of the piles at five varying locations on each surface. With the value of resistance, resistivity was calculated using the appropriate equation. Resistivity was determined in accordance with ASTM G57, Standard Test Method for Field Measurement of Soil Resistivity Using the Wenner Four-Electrode Method (ASTM, 2009a). Autopsy
After the NDE work was completed on the selected piles, a subsample of the evaluated piles was selected to have the jackets removed, exposing the substrate beneath for inspection. Observations allowed researchers to verify NDE results and establish the presence and extent of damage behind the jackets. Three primary piles, of the initially sampled 52, were selected for autopsy. The selection was based on the following criteria: (1) a pile with a poor overall visual condition rating (i.e., rating of 5) where NDE tests indicated damage was present; (2) a pile with a good overall visual condition rating (i.e., rating of 1) where NDE indicated damage was present; and (3) a pile with a good overall visual condition rating (i.e., rating of 1) where NDE indicated no damage. By autopsying piles of these three types, researchers could determine the effectiveness of the NDE methods in detecting damage and the extent of the damage to the piles. In order to obtain a larger sample size but still meet time constraints, another pile on the same bent as the selected piles was also autopsied. Table 4 lists the piles selected for autopsy. During initial planning, the researchers planned to test Pile D on Bent 23 on Structure 2902 but limitations on time in the field did not allow for the second pile on Bent 23 to be autopsied.

19
Table 4. Piles Selected for Autopsy Structure No. Bent Pile Overall Visual Condition Rating NDE Indicated Damage 2866 67 G 1 N/A 2866 67 H 1 X 2900 45 A 1 N/A 2900 45 B 5 X 2902 23 C 4
RESULTS
Visual Condition Ratings of Piles As discussed in the “Methods” section, a total of 1,840 piles were visually inspected from a boat by the researchers. Table 5 provides the visual condition rating of all pile components and the overall visual condition rating for the piles. The visual condition rating of each pile component and overall visual condition rating of each pile are provided in Appendix B of Pailes (2009). This appendix also identifies which piles had damage identified by inspectors prior to jacket installation. Whenever a comparison is made between circular and square cross-section piles in this report, the comparison is made only between piles on the southern structures. The northern structures do not have circular piles, so it would not be appropriate to compare the condition of cross-sections that were not exposed to similar conditions.
Table 5. Visual Condition of All Piles (Non-Jacketed Piles Excluded) No. of Piles Receiving Visual Condition Rating Pile
Component Condition Rating 1
Condition Rating 2
Condition Rating 3
Condition Rating 4
Condition Rating 5
Fiberglass 752 (49.8%) 246 (16.3%) 35 (2.3% 3 (0.2%) 475 (31.4%) Mortar 38 (7.4%) 340 (66.6%) 125 (24.5%) 8 (1.6%) 0 (0.0%) Substrate 399 (79.3%) 91 (18.1%) 11 (2.2%) 2 (0.4%) 0 (0.0%) Overall 1,053 (57.2%) 275 (14.9%) 349 (19.0%) 95 (5.2%) 68 (3.7%) Fiberglass Condition The inspection of the fiberglass casings revealed a variety of conditions. The fiberglass was covered by significant marine growth in the tidal region of the pile. Damage to the fiberglass casings was common, in the form of splits along the corners, sections missing, or the complete loss of the fiberglass, all of which were commonly seen on HRBT (Figure 10). Table 5 shows the results of the visual inspection of the fiberglass on the four HRBT bridge structures. Of all jacketed piles, the fiberglass was damaged on 49% (752 piles), which includes the fiberglass being split, partially missing, or completely missing. Jackets were not installed on the piles installed in 1999 as part of the widening of Structures 2900 and 2902. Although these piles comprised 18% (326 piles) of the total HRBT piles, they were not included in the data for Table 5. The non-jacketed piles had a surface-applied epoxy coating along the tidal region (splash zone) of the pile (Figure 17).

20
Figure 17. Epoxy-Coated, Not Jacketed, Pile
The jacket condition on the northern structures was significantly better than that on the southern structures. On the northern structures, 19% (121 piles) of the fiberglass casings were completely missing as compared to 41% (354 piles) on the southern structures. On the southern structures, 39% (249 piles) of the fiberglass casings on the square piles were undamaged as compared to 52% (119 piles) on circular piles. Another significant difference in the circular and square fiberglass was that 18% (112 piles) of the fiberglass on the square piles were in the split condition, condition 2, as compared to only 5% (11 piles) on the circular piles. Structures 2866 and 2900 had the most piles with fiberglass casings that had completely fallen off: 42% (183 piles) and 40% (171 piles), respectively. Structure 2827 had the least: 8% (28 piles). Mortar Condition During the visual inspection, the mortar was typically seen to have cracking, corrosion product, section loss, foreign objects cast into the mortar, and poor consolidation (Figure 11). When the mortar was exposed, typically the reinforcement that was in the mortar was also exposed and suffering from corrosion activity. On a majority of the piles, the mortar reinforcement was placed with very little to no cover. The top portion of the mortar was typically poorly consolidated, resulting in substantial honeycombing. Epoxy was placed in the tidal zone of most piles before the jackets were installed. That epoxy was left in place when jackets were installed, requiring the mortar to bond to the epoxy. Visual inspection of the mortar revealed numerous foreign items cast into the mortar, including sections of PVC pipe, typically 6 in long (Figure 18); blocks of wood, typically 4-in long 2-in by 4-in sections (Figure 19); and in one instance a bundle of rope.

21
Figure 18. Mortar with Polyvinylchloride Pipe
Figure 19. Mortar with Wood Blocks
Based on configuration, wood and PVC seem to have been used as spacers or chairs to support the WWF prior to mortar placement. The mortar reinforcement was inconsistent. The square jackets were to contain WWF, and the round jackets were to contain a reinforcement cage constructed of vertical No. 4 bars and lateral No. 3 bars. However, several of the piles did not have reinforcement or the reinforcement that was present was not in accordance with the specifications on the construction documents (Figure 20). When the mortar reinforcement was incorrectly placed on square piles, it was typical to have WWF placed in only a portion of the jacket or even completely missing. On the circular piles, often the reinforcement cage was missing or a WWF was placed instead of reinforcing bars. Mortar without reinforcement was typically in better condition than the mortar

22
Figure 20. Mortar Without Reinforcement
with reinforcement. In reinforced mortar, the cover was very shallow, which allowed for the initiation of corrosion of the steel very quickly. Once the reinforcement started to corrode, the expansive forces attributable to the formation of the ferric oxide caused cracking and other damage to the mortar. When the mortar did not have reinforcement, no such corrosion product or cracking could occur in the mortar. The mortar could be inspected only when the fiberglass was falling off or if the jacket was removed. Mortar was not visible because of the fiberglass on 66% (1,000 piles) of the piles with jackets installed. With regard to piles in which the mortar was exposed, 93% (473 piles) had mortar with some form of corrosion damage (Table 5). Only 7% (38 piles) of the piles with exposed mortar showed no signs of corrosion damage. The mortar of the northern structures was in significantly better condition than that of the southern structures. Of piles with exposed mortar, 3% (4 piles) showed section loss in the north compared to 35% (129 piles) in the south. With regard to the two cross-section types on the southern structures, there was section loss of the mortar on 57% (56 piles) of the circular piles compared to 26% (73 piles) of the square piles. Regarding mortar condition, the structure with the best mortar condition was Structure 2827, with 45% of the piles (19 piles) not damaged and 55% (23 piles) receiving a mortar condition rating of 2. The structure with the worst mortar condition was Structure 2900, with 43% of piles (78 piles) having section loss and 52% (96 piles) receiving a mortar condition rating of 2.
23
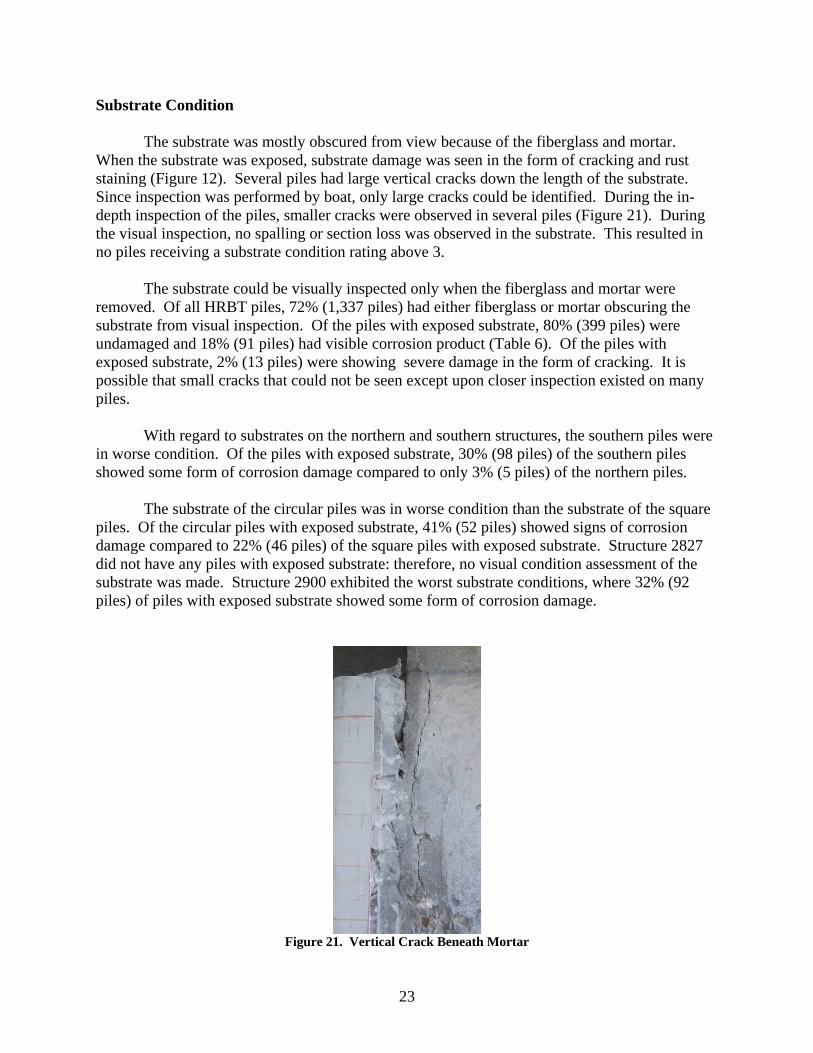
Substrate Condition The substrate was mostly obscured from view because of the fiberglass and mortar. When the substrate was exposed, substrate damage was seen in the form of cracking and rust staining (Figure 12). Several piles had large vertical cracks down the length of the substrate. Since inspection was performed by boat, only large cracks could be identified. During the in-depth inspection of the piles, smaller cracks were observed in several piles (Figure 21). During the visual inspection, no spalling or section loss was observed in the substrate. This resulted in no piles receiving a substrate condition rating above 3. The substrate could be visually inspected only when the fiberglass and mortar were removed. Of all HRBT piles, 72% (1,337 piles) had either fiberglass or mortar obscuring the substrate from visual inspection. Of the piles with exposed substrate, 80% (399 piles) were undamaged and 18% (91 piles) had visible corrosion product (Table 6). Of the piles with exposed substrate, 2% (13 piles) were showing severe damage in the form of cracking. It is possible that small cracks that could not be seen except upon closer inspection existed on many piles. With regard to substrates on the northern and southern structures, the southern piles were in worse condition. Of the piles with exposed substrate, 30% (98 piles) of the southern piles showed some form of corrosion damage compared to only 3% (5 piles) of the northern piles. The substrate of the circular piles was in worse condition than the substrate of the square piles. Of the circular piles with exposed substrate, 41% (52 piles) showed signs of corrosion damage compared to 22% (46 piles) of the square piles with exposed substrate. Structure 2827 did not have any piles with exposed substrate: therefore, no visual condition assessment of the substrate was made. Structure 2900 exhibited the worst substrate conditions, where 32% (92 piles) of piles with exposed substrate showed some form of corrosion damage.
Figure 21. Vertical Crack Beneath Mortar

24
Overall Visual Condition Of all 1,840 HRBT piles, 3.7% (68 piles) received an overall visual condition rating of 5 and 57.2% (1,053 piles) received an overall visual condition rating of 1 (Table 5). A comparison of the piles on the northern structures and southern structures revealed that those on the southern structures were in far worse condition. Of the southern piles, 6% (66 piles) received an overall visual condition rating of 5 compared to 0.2% (2 piles) of the northern piles. The circular piles had a higher percentage of piles with a condition rating of 1, 57% (160 piles) compared to 46% (350 piles) of the square piles. However, the circular piles also had a significantly higher percentage of piles that received an overall visual condition rating of 5, 13% (38 piles) compared to 4% (28 piles). Structure 2900 had the most piles with an overall visual condition rating of 5 at 10% (57 piles). Structure 2827 had the most piles with the best overall visual condition ratings: no pile received an overall visual condition rating above 3. The piles on Structure 2902 also received good visual condition ratings: 75% (352 piles) received an overall visual condition rating of 1.
Piles Selected for Evaluation Table 6 lists the 52 piles selected for evaluation, their overall visual condition ratings, the type of cross-section, whether they were damaged prior to jacket installation, and if they have been selected to receive a second generation jacket. On Structure 2827, none of the piles received an overall visual condition rating above 3, so 3 piles were selected with an overall visual condition rating of 1, another 3 piles with an overall visual condition rating of 2, and 4 piles with an overall visual condition rating of 3.
Evaluation of Piles and Evaluation Methods
Ground-Penetrating Radar
When GPR was scanned over an intact jacket to detect the steel reinforcement of the substrate, the depth to the substrate reinforcement was approximately 7 in. This increased depth of cover along with the reinforcement located in the mortar did not allow the GPR to detect the substrate reinforcement effectively. The mortar reinforcement reflected back most of the radar wave, not allowing enough energy in the radar wave to reach the substrate reinforcement. When a GPR scan was conducted directly on the substrate surface, the steel reinforcement of the piles was detected and researchers were able to determine the condition of the steel and locations of possible corrosion damage by evaluating the steel reflection amplitude. GPR was used on 17 of the 52 piles selected for evaluation. Piles A and B of Structure 2900, Bent 45, were autopsied, exposing substrate, which was scanned with GPR. Two vertical scans each were completed on the piles. The amplitudes from the reflection of the substrate reinforcement were determined and plotted (Figures 22 and 23). The amplitudes are a dimensionless number that represents the voltage received by the antenna.

25
Table 6. Piles Selected for Evaluation
Structure
Bent
Pile Condition
Rating Type of
Cross-section Damage Prior to
Jacket Installation Receiving Second Generation Jacket
4 H 2 Square X 4 F 1 Square 15 F 2 Square 20 H 1 Square X 22 G 3 Square X 23 F 3 Square X 27 H 3 Square 33 H 3 Square X 36 G 2 Square X
2827
40 H 1 Square X 7 B 2 Circular 9 B 4 Circular X 16 C 4 Circular 28 C 1 Circular X 29 B 3 Circular X 34 C 5 Circular 37 H 4 Square X X 38 D 3 Square X 42 E 5 Square 43 F 4 Square X 44 H 3 Square 45 H 3 Square X 58 H 2 Square 67 G 1 Square 67 H 1 Square
2866
77 H 1 Square X 5 B 1 Circular 32 A 4 Circular 45 A 1 Circular 45 B 5 Circular X 46 C 5 Circular X 47 B 3 Circular 50 B 2 Circular 58 C 3 Circular X 68 C 3 Square X 70 G 5 Square 82 C 4 Square X 89 E 4 Square X 105 E 3 Square X 112 C 1 Square 112 H 5 Square X
2900
114 C 2 Square X 4 C 1 Square X 19 C 2 Square 20 D 4 Square 22 C 3 Square 23 C 4 Square X 25 C 3 Square 33 B 4 Square 35 D 1 Square 49 G 5 Square
2902
62 E 2 Square

26
010
2030
4050
0 2000 4000 6000Amplitude
Hei
ght (
in)
00.20.40.60.81Time (ns)
Scan 1 AmplitudeScan 2 AmplitudeScan 1 TimeScan 2 Time
Figure 22. Structure 2900, Bent 45, Pile A, Ground-Penetrating Radar Scan of Horizontal Steel
010
2030
4050
0 2000 4000Amplitude
Hei
ght (
in)
00.20.40.60.81Time (ns)
Scan 1 AmplitudeScan 2 AmplitudeScan 1 TimeScan 2 Time
Figure 23. Structure 2900, Bent 45, Pile B, Ground-Penetrating Radar Scan of Horizontal Steel

27
The steel amplitudes from Pile A ranged from 3,000 to 5,000, and the amplitudes from Pile B ranged from 2,000 to 4,000. Pile B steel reflection amplitudes were significantly lower than those of Pile A, indicating that the Pile B reinforcement has corrosion damage. This was confirmed during the autopsy, when it was revealed that Pile B had corrosion product on the steel reinforcement. The autopsy of Pile A did not reveal any damage to the reinforcement. Along with the plot of the steel reflection amplitude, the time of travel for the GPR signal was also plotted. In a uniform medium, as travel time (and distance) increases, the attenuation of the signal amplitude increases. Structure 2900, Bent 34, Pile A had an average travel time of 0.80 ns, and Structure 2900, Bent 45, Pile B had an average of 0.67 ns, indicating that the reinforcement of Pile B was closer to the surface. The Pile B signal amplitude underwent less attenuation, suggesting that the lower amplitude of the pile compared to Pile A was not due to travel time signal attenuation. GPR was also completed on the substrate of Structure 2902, Bent 23, Pile C to determine the condition of the reinforcement. Pile C is a square pile, so vertical and horizontal scans were made. However, the limited area of exposed substrate allowed only a few short scans. Figure 24 represents the horizontal scans, in which the vertical steel could be detected. The amplitudes of the steel in all three scans varied, but those variations correlated closely to the signal travel time. As the travel time increased, the amplitudes decreased, and as travel time decreased, the amplitudes increased. The amplitude shift seen in the plot was most likely related to increased travel time. This was not indicative of damage but rather to a deeper cover over the reinforcement causing attenuation of the signal.
0500100015002000250030003500400045005000
0246810Length (in)
Am
plitu
de
1
1.1
1.2
1.3
1.4
Tim
e (n
s)
Scan 1 Amplitude Scan 2 Amplitude Scan 3 AmplitudeScan 1 Time Scan 2 Time Scan 3 Time
Figure 24. Structure 2902, Bent 23, Pile C, Ground-Penetrating Radar Scan of Vertical Steel
28
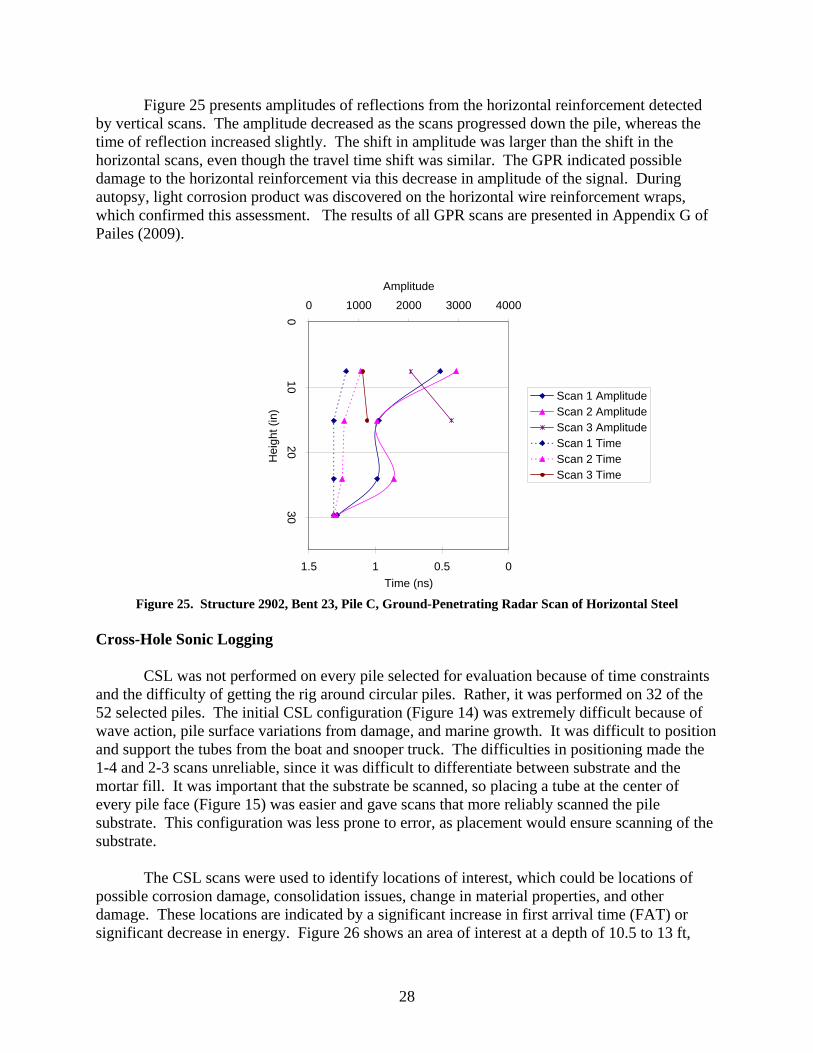
Figure 25 presents amplitudes of reflections from the horizontal reinforcement detected by vertical scans. The amplitude decreased as the scans progressed down the pile, whereas the time of reflection increased slightly. The shift in amplitude was larger than the shift in the horizontal scans, even though the travel time shift was similar. The GPR indicated possible damage to the horizontal reinforcement via this decrease in amplitude of the signal. During autopsy, light corrosion product was discovered on the horizontal wire reinforcement wraps, which confirmed this assessment. The results of all GPR scans are presented in Appendix G of Pailes (2009).
010
2030
0 1000 2000 3000 4000Amplitude
Hei
ght (
in)
00.511.5Time (ns)
Scan 1 AmplitudeScan 2 AmplitudeScan 3 AmplitudeScan 1 TimeScan 2 TimeScan 3 Time
Figure 25. Structure 2902, Bent 23, Pile C, Ground-Penetrating Radar Scan of Horizontal Steel
Cross-Hole Sonic Logging
CSL was not performed on every pile selected for evaluation because of time constraints and the difficulty of getting the rig around circular piles. Rather, it was performed on 32 of the 52 selected piles. The initial CSL configuration (Figure 14) was extremely difficult because of wave action, pile surface variations from damage, and marine growth. It was difficult to position and support the tubes from the boat and snooper truck. The difficulties in positioning made the 1-4 and 2-3 scans unreliable, since it was difficult to differentiate between substrate and the mortar fill. It was important that the substrate be scanned, so placing a tube at the center of every pile face (Figure 15) was easier and gave scans that more reliably scanned the pile substrate. This configuration was less prone to error, as placement would ensure scanning of the substrate. The CSL scans were used to identify locations of interest, which could be locations of possible corrosion damage, consolidation issues, change in material properties, and other damage. These locations are indicated by a significant increase in first arrival time (FAT) or significant decrease in energy. Figure 26 shows an area of interest at a depth of 10.5 to 13 ft,

29
where the FAT increased significantly. Locations of interest were determined by a significant change from the established “zero point” of each CSL scan. The zero point established for each CSL scan was based on the shortest FAT from that scan. Figure 26 shows how the FAT plot was corrected for misalignment of the tubes by subtracting the inherent slope determined by a linear regression. In Figure 26, a height of 6 ft corresponds to the water level. The water level was not constant because of wave and tidal action. Because of this water fluctuation, FAT values corresponding to approximately the top 1 ft of the scan must be disregarded because they will be affected by this periodic loss of the water couple. This can be seen by the sudden increase of FAT at 6.5 ft in Figure 26. Scans performed on the selected HRBT piles were corrected for misalignment, and locations of interest identified. Table 7 shows whether a location of interest was detected for the scans performed. A shaded cell indicates that the scan was performed, and an “X” indicates that a location of interest was located in that scan. A “~” indicates a possible error in the data collection suggested by anomalous data. FAT plots of all the CSL scans are provided in Appendix E of Pailes (2009).
6
7
8
9
10
11
12
13
14
150 100 200 300 400
Time (μs)
Hei
ght (
ft)
Original Data Zero Point Adjusted Data Linear Regression
Area of Possible Damage
Figure 26. First Arrival Time Plot

30
Table 7. Locations of Interest in Cross-Hole Sonic Logging Scans Scan
Structure
Bent
Pile Condition
Rating 1-2 2-3 3-4 4-1 1-3 2-4 4 H 2 X X X X 4 F 1 X X X X 15 F 2 20 H 1 X 22 G 3 X X X 23 F 3 X X 27 H 3 X 33 H 3 X X X 36 G 2 X X X
2827
40 H 1 X X X 37 H 4 X X X 38 D 3 42 E 5 X X X X 44 H 3 X X 58 H 2 X X X
2866
67 H 1 X X X X X X 68 C 3 X 70 G 5 X 82 C 4 X X 89 E 4 X X X 105 E 3 ~ ~ ~ ~ ~ ~ 112 C 1 X X X X 112 H 5 ~ ~ ~ ~
2900
114 C 2 X X X X X X 4 C 1 19 C 2 X X 20 D 4 X X X 25 C 3 ~ X ~ 33 B 4 X X X X 35 D 1 X X 49 G 5 X X X X X X
2902
62 E 2 X X A shaded cell indicates that the scan was performed, and an “X” indicates that an area of interest was located in that scan. A “~” indicates a possible error in the data collection suggested by anomalous data. CSL was not performed on every pile selected for evaluation. All cross-sections were square. Sonic Echo
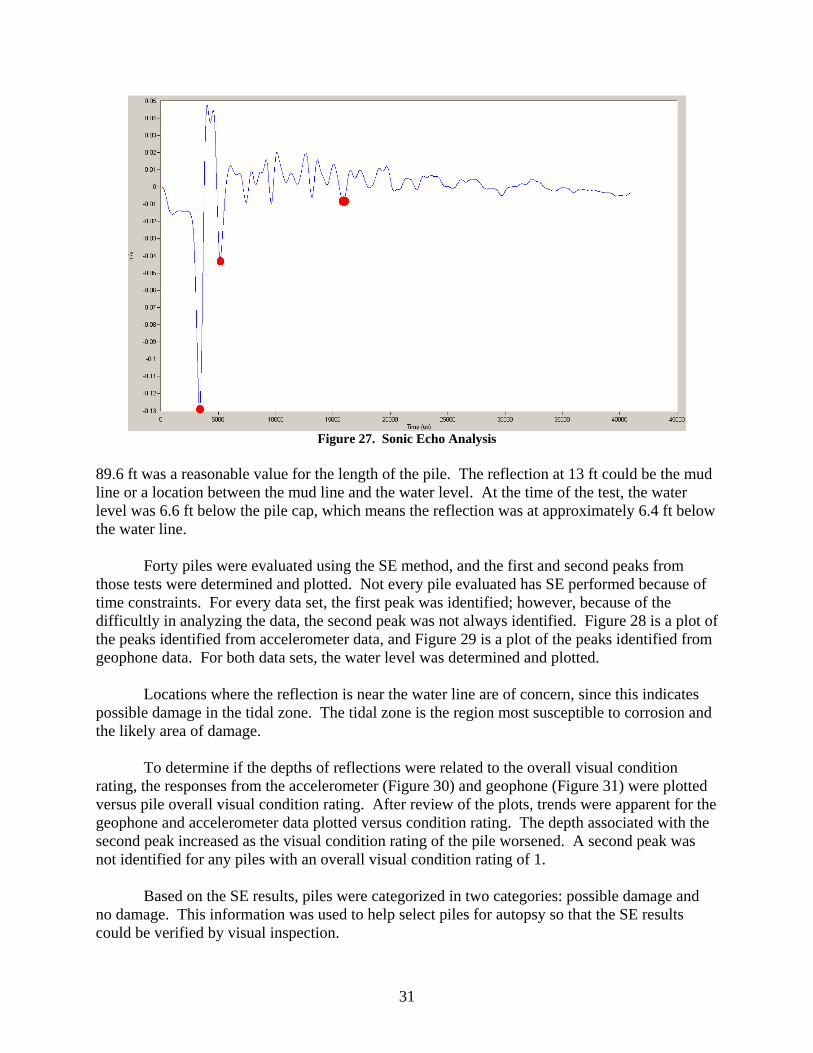
During analysis of SE data, certain parameters were set based on the geometry of the HRBT piles, location of the receiving transducers, and concrete properties. The data were filtered using a 900-Hz low-pass digital filter provided by the SE software to eliminate “ringing” from the pile or pile cap. Ringing would include any of the early reflections caused by the pile cap or noise in the data. The velocity of the wave through the piles was set to 13,700 ft/sec, since this was the average sound velocity determined for the HRBT piles from the UPV test. Figure 27 shows the response from the test conducted on Structure 2866, Bent 28, Pile C. Analysis revealed that the first reflection was at a depth of 13 ft and the second at 89.6 ft. According to construction documents, square piles were to be driven to a minimum depth of 71 ft and cylinder piles were to be driven to a minimum depth of 79 ft, below the mud line. Thus,
31
Figure 27. Sonic Echo Analysis
89.6 ft was a reasonable value for the length of the pile. The reflection at 13 ft could be the mud line or a location between the mud line and the water level. At the time of the test, the water level was 6.6 ft below the pile cap, which means the reflection was at approximately 6.4 ft below the water line. Forty piles were evaluated using the SE method, and the first and second peaks from those tests were determined and plotted. Not every pile evaluated has SE performed because of time constraints. For every data set, the first peak was identified; however, because of the difficultly in analyzing the data, the second peak was not always identified. Figure 28 is a plot of the peaks identified from accelerometer data, and Figure 29 is a plot of the peaks identified from geophone data. For both data sets, the water level was determined and plotted. Locations where the reflection is near the water line are of concern, since this indicates possible damage in the tidal zone. The tidal zone is the region most susceptible to corrosion and the likely area of damage. To determine if the depths of reflections were related to the overall visual condition rating, the responses from the accelerometer (Figure 30) and geophone (Figure 31) were plotted versus pile overall visual condition rating. After review of the plots, trends were apparent for the geophone and accelerometer data plotted versus condition rating. The depth associated with the second peak increased as the visual condition rating of the pile worsened. A second peak was not identified for any piles with an overall visual condition rating of 1. Based on the SE results, piles were categorized in two categories: possible damage and no damage. This information was used to help select piles for autopsy so that the SE results could be verified by visual inspection.

32
0
20
40
60
80
100
120
140
Cal
cula
ted
Ref
lect
ion
Dep
th (f
t)
Tide 1st Response 2nd Response
2827
4 F
2827
4 H
2827
15
F28
27 2
0 H
2827
22
G28
27 2
3 F
2827
27
H28
27 3
3 H
2827
36
G28
27 4
0 H
2866
7 B
2866
9 B
2866
16
C
2866
29
B28
66 3
4 C
2866
37
H28
66 3
8 D
2866
43
F28
66 4
4 H
2866
45
H28
66 5
8 H
2866
67
H28
66 7
7 H
2900
5 B
2900
32
A29
00 4
5 B
2900
46
C29
00 4
7 B
2900
50
B29
00 5
8 C
2900
68
C29
00 7
0 G
2900
82
C29
00 8
9 E
2900
105
E29
00 1
12 C
2900
112
H29
00 1
14 C
2866
28
C
2866
42
E
Figure 28. Sonic Echo Reflections Measured by Accelerometer
0
20
40
60
80
100
120Cal
cula
ted
Ref
lect
ion
Dep
th (f
t)
Tide 1st Response 2nd Response
2827
4 F
2827
4 H
2827
15
F28
27 2
0 H
2827
22
G28
27 2
3 F
2827
27
H28
27 3
3 H
2827
36
G28
27 4
0 H
2866
7 B
2866
9 B
2866
16
C
2866
29B
2866
34
C28
66 3
7 H
2866
38
D
2866
43
F28
66 4
4 H
2866
45
H28
66 5
8 H
2866
67
H28
66 7
7 H
2900
5 B
2900
32
A29
00 4
5 B
2900
46
C29
00 4
7 B
2900
50
B29
00 5
8 C
2900
68
C29
00 7
0 G
2900
82
C29
00 8
9 E
2900
105
E29
00 1
12 C
2900
112
H29
00 1
14 C
2866
28
C
2866
42
E
Figure 29. Sonic Echo Reflections Measured by Geophone

33
0.0
20.0
40.0
60.0
80.0
100.0
120.0
140.00 1 2 3 4 5
Visual Condition Category
Cal
cula
ted
Ref
lect
ion
Dep
th (f
t)
1st Peak 2nd Peak Figure 30. Sonic Echo Reflections Measured by Accelerometer: Ordered by Overall Visual Condition Rating
0.0
20.0
40.0
60.0
80.0
100.0
120.00 1 2 3 4 5
Visual Condition Category
Cal
cula
ted
Ref
lect
ion
Dep
th (f
t)
1st Peak 2nd Peak Figure 31. Sonic Echo Reflections Measured by Geophone: Ordered By Overall Visual Condition Rating

34
Impulse Response
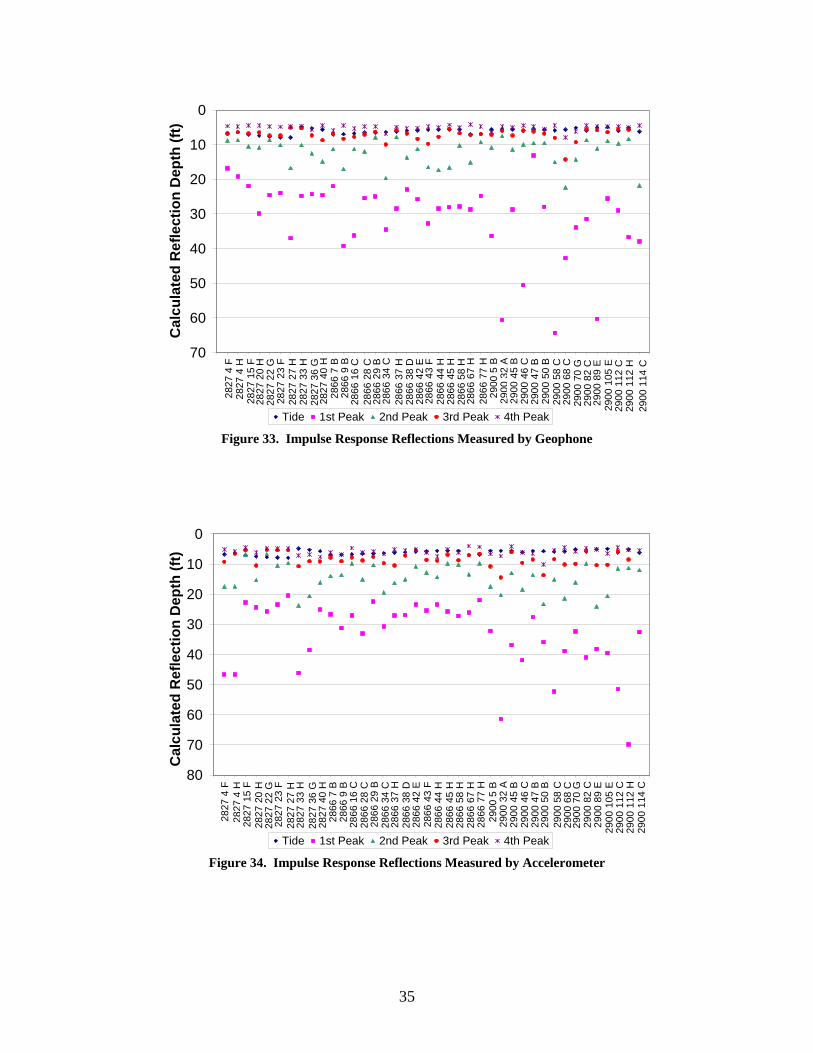
In the analysis of the IR data, certain parameters were defined by the researchers based on the geometry of the HRBT piles, location of the receiving transducers, and concrete properties. The digital low-pass filter was set to 900 Hz to filter out ringing from the pile and pile cap. The concrete velocity was set at 13,700 ft/sec, which was determined from the UPV test on the HRBT piles. Figure 32 shows the selection of the four prominent peaks from a pile response. The four highest peaks of every IR test were plotted for the responses recorded by the geophone (Figure 33) and the accelerometer (Figure 34). The same data were plotted based on the overall visual condition rating of the pile (Figures 35 and 36). No obvious trend emerged as with the SE data. With all four peaks plotted together, responses from the piles were difficult to evaluate. The IR results were also plotted with just the highest amplitude IR response to simplify the analysis. Figure 37 is a plot of the depth to the strongest reflection and the location of the water line at the time of each test, using the data collected from the accelerometer. Several piles had strong reflections near the tidal zone, which indicated possible damage to these piles. Figure 38 is a plot of the same data used for Figure 37, but it is organized by overall visual condition rating. The reflections above 10 ft are of most concern, because these occurred in the tidal zone, where oxygen and water are available.
Figure 32. Impulse Response Peak Selection
35
0
10
20
30
40
50
60
70
Cal
cula
ted
Ref
lect
ion
Dep
th (f
t)
Tide 1st Peak 2nd Peak 3rd Peak 4th Peak
2827
4 F
2827
4 H
2827
15
F28
27 2
0 H
2827
22
G28
27 2
3 F
2827
27
H28
27 3
3 H
2827
36
G28
27 4
0 H
2866
7 B
2866
9 B
2866
16
C
2866
29
B28
66 3
4 C
2866
37
H28
66 3
8 D
2866
43
F28
66 4
4 H
2866
45
H28
66 5
8 H
2866
67
H28
66 7
7 H
2900
5 B
2900
32
A29
00 4
5 B
2900
46
C29
00 4
7 B
2900
50
B29
00 5
8 C
2900
68
C29
00 7
0 G
2900
82
C29
00 8
9 E
2900
105
E29
00 1
12 C
2900
112
H29
00 1
14 C
2866
28
C
2866
42
E
Figure 33. Impulse Response Reflections Measured by Geophone
0
10
20
30
40
50
60
70
80
Cal
cula
ted
Ref
lect
ion
Dep
th (f
t)
Tide 1st Peak 2nd Peak 3rd Peak 4th Peak
2827
4 F
2827
4H
2827
15
F28
27 2
0 H
2827
22
G28
27 2
3 F
2827
27
H28
27 3
3 H
2827
36
G28
27 4
0 H
2866
7 B
2866
9 B
2866
16
C
2866
29
B28
66 3
4 C
2866
37
H28
66 3
8 D
2866
43
F28
66 4
4 H
2866
45
H28
66 5
8 H
2866
67
H28
66 7
7 H
2900
5 B
2900
32
A29
00 4
5 B
2900
46
C29
00 4
7 B
2900
50
B29
00 5
8 C
2900
68
C29
00 7
0 G
2900
82
C29
00 8
9 E
2900
105
E29
00 1
12 C
2900
112
H29
00 1
14 C
2866
28
C
2866
42
E
Figure 34. Impulse Response Reflections Measured by Accelerometer

36
0
10
20
30
40
50
60
700 1 2 3 4 5
Visual Condition Category
Cal
cula
ted
Ref
lect
ion
Dep
th (f
t)
1st Peak 2nd Peak 3rd Peak 4th Peak Figure 35. Impulse Response Data from Geophone: Ordered by Overall Visual Condition Rating
0
10
20
30
40
50
60
70
800 1 2 3 4 5
Visual Condition Category
Cal
cula
ted
Ref
lect
ion
Dep
th (f
t)
1st Peak 2nd Peak 3rd Peak 4th Peak Figure 36. Impulse Response Data from Accelerometer: Ordered by Overall Visual Condition Rating

37
0
10
20
30
40
50
60
70
Cal
cula
ted
Ref
lect
ion
Dep
th (f
t)
Tide Heighest Responce
2827
4 F
2827
4 H
2827
15
F28
27 2
0 H
2827
22
G28
27 2
3 F
2827
27
H28
27 3
3 H
2827
36
G28
27 4
0 H
2866
7 B
2866
9 B
2866
16
C
2866
29
B28
66 3
4 C
2866
37
H28
66 3
8 D
2866
43
F28
66 4
4 H
2866
45
H28
66 5
8 H
2866
67
H28
66 7
7 H
2900
5 B
2900
32
A29
00 4
5 B
2900
46
C29
00 4
7 B
2900
50
B29
00 5
8 C
2900
68
C29
00 7
0 G
2900
82
C29
00 8
9 E
2900
105
E29
00 1
12 C
2900
112
H29
00 1
14 C
2866
28
C
2866
42
E
Figure 37. Impulse Response Peak Reflection Measured by Accelerometer
0
10
20
30
40
50
60
700 1 2 3 4 5
Visual Condition Category
Cal
cula
ted
Ref
lect
ion
Dep
th (f
t)
Figure 38. Impulse Response Peak Reflection Measured by Accelerometer: Ordered by Overall Visual
Condition Rating

38
Figure 39 is a plot of the distance to the strongest reflection using the data collected by geophone. It was apparent that the geophone detected more reflections at a depth of less than 10 ft than the accelerometer. Since the geophone was placed on the top of the cap and the accelerometer was placed below the cap on the exposed substrate of the pile, the ringing within the pile cap was more prominent in the geophone data. Figure 40 presents the geophone data organized by overall visual condition rating. No clear trend emerged as with the SE data. Most of the responses were less than a 10-ft depth for all condition rating categories. IR was also used to calculate the axial flexibility of the pile by calculating the initial slope of the IR data, from 0 to 20 Hz. This frequency range was chosen because at that range the entire pile is anticipated to be completely activated by the frequency range. The flexibility measures the deflection of the pile attributable to a unit load, which in the case of the HRBT piles will be determined by the portion of the pile above the soil that is free to move and the interaction of the soil in the form of skin friction. Using only a 3-lb hammer does not excite the pile very much, so the calculated flexibility represents primarily the portion above the soil and the skin friction of the pile for a short distance into the soil. The length of the pile that is above the soil is important and will affect the flexibility of a pile. Figures 41 and 42 are the plots of the flexibility calculated from accelerometer and geophone data, respectively. When a pile is damaged, its flexibility will increase, because a change in section dimension directly affects structural stiffness. Piles with high-calculated flexibility could possibly be damaged. The flexibilities were also plotted versus overall visual condition rating (Figures 43 and 44). No clear trend emerged.
0
5
10
15
20
25
30
35
40
45
Cal
cula
ted
Ref
lect
ion
Dep
th (f
t)
Tide Hightest Responce
2827
4 F
2827
4 H
2827
15
F28
27 2
0 H
2827
22
G28
27 2
3 F
2827
27
H28
27 3
3 H
2827
36
G28
27 4
0 H
2866
7 B
2866
9 B
2866
16
C
2866
29
B28
66 3
4 C
2866
37
H28
66 3
8 D
2866
43
F28
66 4
4 H
2866
45
H28
66 5
8 H
2866
67
H28
66 7
7 H
2900
5 B
2900
32
A29
00 4
5 B
2900
46
C29
00 4
7 B
2900
50
B29
00 5
8 C
2900
68
C29
00 7
0 G
2900
82
C29
00 8
9 E
2900
105
E29
00 1
12 C
2900
112
H29
00 1
14 C
2866
28
C
2866
42
E
Figure 39. Impulse Response Highest Peak Measured by Geophone

39
0
5
10
15
20
25
30
35
40
450 1 2 3 4 5
Visual Condition Category
Cal
cula
ted
Ref
lect
ion
Dep
th (f
t)
Figure 40. Impulse Response Highest Peak Measured by Geophone: Ordered by Overall Condition Rating
0
2
4
6
8
10
12
14
16
18
Flex
ibili
ty (1
0-7) (
in/lb
f)
2827
4 F
2827
4 H
2827 15 F
2827
20
H28
27 2
2 G
2827
23
F28
27 2
7 H
2827
33
H28
27 3
6 G
2827
40
H28
66 7
B28
66 9
B28
66 1
6 C
2866
29
B28
66 3
4 C
2866
37
H28
66 3
8 D
2866
43
F28
66 4
4 H
2866
45
H28
66 5
8 H
2866
67
H28
66 7
7 H
2900
5 B
2900
32
A29
00 4
5 B
2900
46
C29
00 4
7 B
2900
50
B29
00 5
8 C
2900
68
C29
00 7
0 G
2900
82
C29
00 8
9 E
2900
105
E
2900 112 C
2900
112
H29
00 1
14 C
2866
28
C
2866
42
E
Figure 41. Impulse Response Flexibility Measured by Accelerometer
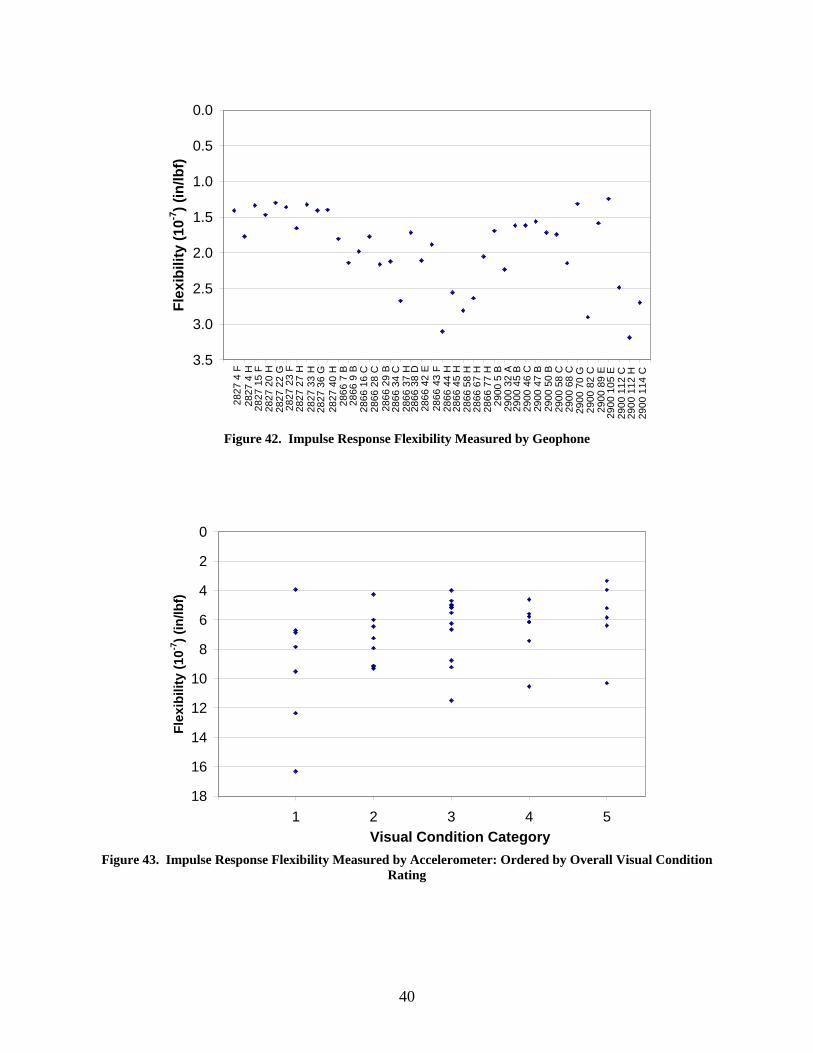
40
0.0
0.5
1.0
1.5
2.0
2.5
3.0
3.5
Flex
ibili
ty (1
0-7) (
in/lb
f)
2827
4 F
2827
4 H
2827
15
F28
27 2
0 H
2827
22
G28
27 2
3 F
2827
27
H28
27 3
3 H
2827
36
G28
27 4
0 H
2866
7 B
2866
9 B
2866
16
C
2866
29
B28
66 3
4 C
2866
37
H28
66 3
8 D
2866
43
F28
66 4
4 H
2866
45
H28
66 5
8 H
2866
67
H28
66 7
7 H
2900
5 B
2900
32
A29
00 4
5 B
2900
46
C29
00 4
7 B
2900
50
B29
00 5
8 C
2900
68
C29
00 7
0 G
2900
82
C29
00 8
9 E
2900
105
E29
00 1
12 C
2900
112
H29
00 1
14 C
2866
28
C
2866
42
E
Figure 42. Impulse Response Flexibility Measured by Geophone
0
2
4
6
8
10
12
14
16
180 1 2 3 4 5
Visual Condition Category
Flex
ibili
ty (1
0-7) (
in/lb
f)
Figure 43. Impulse Response Flexibility Measured by Accelerometer: Ordered by Overall Visual Condition
Rating

41
0.0
0.5
1.0
1.5
2.0
2.5
3.0
3.50 1 2 3 4 5
Visual Condition Category
Flex
ibili
ty (1
0-7) (
in/lb
f)
Figure 44. Impulse Response Flexibility Measured by Geophone: Ordered by Overall Visual Condition
Rating
A geophone is better than an accelerometer at detecting lower frequencies. For flexibility data in the 0 to 20 Hz range, the geophone is more trustworthy (D. Sack, personal communication, March 4, 2009). However, the geophone results are affected by its placement on the pile cap. Based on the IR results, piles were categorized in two categories: possible damage and no damage. This information was used to help select piles for autopsy so that the IR results could be verified by visual inspection. Chloride Sampling
HRBT is located where the James River enters the Chesapeake Bay. Water samples were collected from the water surrounding HRBT to determine the amount of chlorides present. It was determined that the water contained 1.1% chlorides by water weight. The water that surrounds HRBT was classified as brackish water since the chloride level is in the range of 0.05% to 3% (Office of Naval Research, 2009). Samples of the mortar and the substrate were taken to perform chloride analysis on 16 of the 52 selected piles. Apparent diffusion coefficients calculated for substrate concrete ranged from 2 mm2/yr to well over 200 mm2/yr. Figure 45 presents the apparent diffusion coefficients for the substrate concrete samples collected. Figure 46 presents the apparent diffusion coefficients for the mortar samples. In both figures, the diffusion rates were plotted versus the overall visual condition rating of the pile.

42
0
20
40
60
80
100
120
140
160
180
200
0 1 2 3 4 5Visual Condition Category
Diff
usio
n C
oeffi
cien
t (m
m2 /y
ear)
Figure 45. Diffusion Coefficients of the Substrate. To make the plot legible, the y-axis was capped at 200 mm2/yr, even though there were a few higher values. Table 8 lists the individual values above200 mm2/yr.
Table 8. Diffusion Coefficients Not Plotted
Material Visual Condition
Rating Diffusion Coefficient
(mm²/yr) Substrate 1 4114.69 Substrate 1 273.97 Substrate 2 1157.99 Substrate 2 293.53 Mortar 1 4625.34 Mortar 2 1599.17 Mortar 3 5395.04 Mortar 3 1802.73
The chloride profiles of the mortar samples revealed that chlorides were diffusing from two directions (Figure 47). The face of the mortar exposed to the water was expected to have a high chloride concentration, and as the depth increased that concentration was expected to decrease. The concentration decreased until about midway through the sample, where the concentration started to increase again. This was the case for almost every mortar sample collected. The diffusion coefficients calculated from the mortar samples are misleadingly low. The one-dimensional solution of Fick’s law of diffusion used is based on several assumptions, including diffusion from one surface into a semi-infinite medium. The mortar samples violate both of these assumptions since the mortar is only 4 in thick and the chlorides are diffusing from both the jacket and substrate interfaces of the mortar.

43
0
20
40
60
80
100
120
140
160
180
200
0 1 2 3 4 5Visual Condition Category
Diff
usio
n C
oeffi
cien
t (m
m2 /y
ear)
Figure 46. Diffusion Coefficients of the Mortar. To make the plot legible, the y-axis was capped at 200 mm2/yr,
even though there were a few higher values. Table 8 lists the individual values above 200 mm2/yr.
0.0
0.5
1.0
1.5
2.0
2.5
3.0
3.5
4.0
4.5
0 20 40 60 80 100 120Depth (mm)
Chl
orid
e C
once
ntra
tion
(kg/
mm
3 )
Figure 47. Chloride Profile of Mortar

44
The chloride concentration at the depth of the steel reinforcement was tested to determine if the nominal chloride concentration needed to induce corrosion (threshold) had been reached (Figure 48). There is no single value for the threshold for steel reinforcement: it varies depending on many factors, but typically a value ranging from 1 lb Cl-/yd3 concrete to 2 lb Cl-
/yd3 concrete is assumed as the threshold for conventionally reinforced structures (Broomfield, 2007; Funahashi, 1990). The HRBT piles have conventional reinforcement bars and prestressed tendons. Tendons typically have a lower threshold than conventional bars because of internal stresses, greater surface area (Hartt and Rapa, 1998), and different metallurgy. All but four piles had a chloride concentration above 2 lb/yd3 at the reinforcement level, and only two piles had a concentration below 1 lb/yd3. There were significant amounts of chloride at the steel depth to damage severely or destroy the passive oxide layer on the reinforcement. The chloride profiles from all concrete and mortar samples are provided in Appendix F of Pailes (2009).
0
2
4
6
8
10
12
14
16
0 1 2 3 4 5Visual Condition Category
Chl
orid
e C
once
ntra
tion
(lbs/
yd3 )
Figure 48. Chloride Concentrations at Substrate Reinforcement
Half-Cell Potentials
Half-cell potential measurements were made on the substrates of 15 piles. Figure 49 presents the results. A majority, 64% (170 measurements), indicated a potential more negative than -0.350 V vs. CSE. Only 4 measurements were more positive than -0.200 V vs. CSE. A majority of the half-cell measurements indicated that active corrosion in the substrate reinforcement was probable.
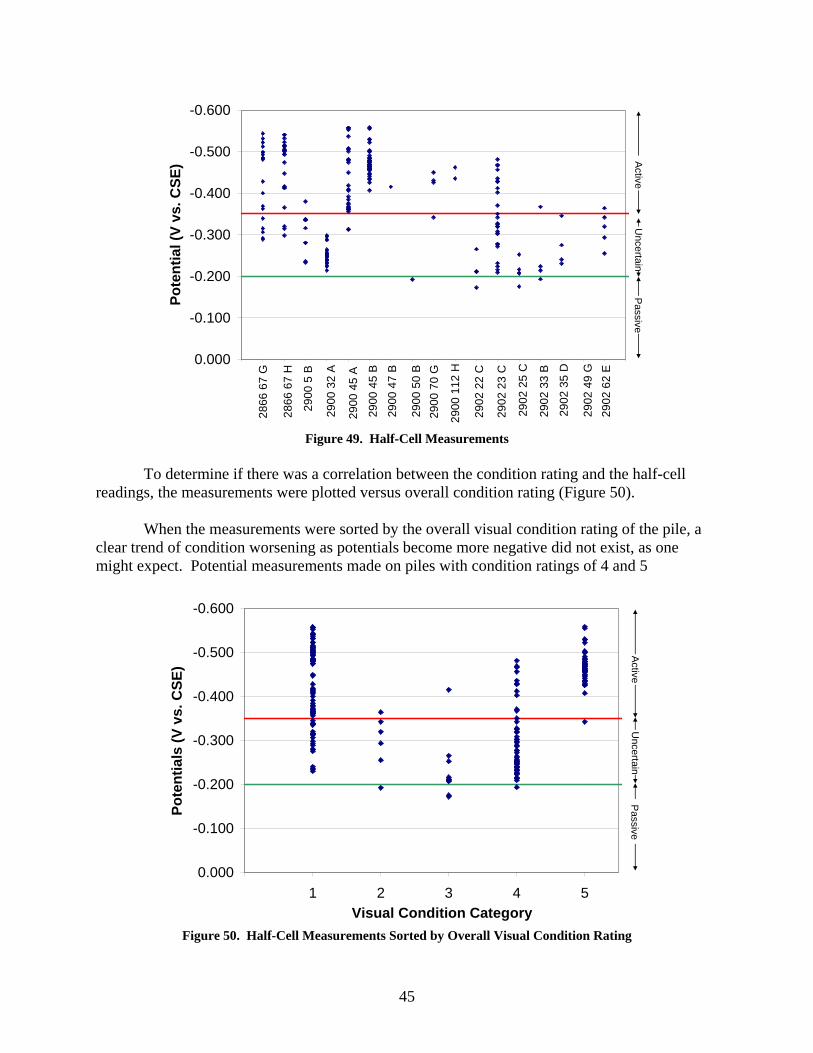
45
-0.600
-0.500
-0.400
-0.300
-0.200
-0.100
0.000
Pote
ntia
l (V
vs. C
SE)
2866
67
G
2866
67
H
2900
5 B
2900
32
A
2900
45
A
2900
45
B
2900
47
B
2900
50
B29
00 7
0 G
2900
112
H
2902
22
C
2902
23
C
2902
25
C
2902
33
B
2902
35
D
2902
49
G29
02 6
2 E
ActiveU
ncertainPassive
Figure 49. Half-Cell Measurements
To determine if there was a correlation between the condition rating and the half-cell readings, the measurements were plotted versus overall condition rating (Figure 50). When the measurements were sorted by the overall visual condition rating of the pile, a clear trend of condition worsening as potentials become more negative did not exist, as one might expect. Potential measurements made on piles with condition ratings of 4 and 5
-0.600
-0.500
-0.400
-0.300
-0.200
-0.100
0.0000 1 2 3 4 5
Visual Condition Category
Pote
ntia
ls (V
vs.
CSE
)Active
Uncertain
Passive
Figure 50. Half-Cell Measurements Sorted by Overall Visual Condition Rating

46
suggested active corrosion, which was consistent with the visual assessment. However, the condition rating 1 category had a significant number of measurements indicating active corrosion potential and a significant number indicating uncertain corrosion activity. Measurements made on piles with a condition rating of 2 or 3 were mostly in the region between -0.200 V vs. CSE and -0.350 V vs. CSE, indicating corrosion activity was uncertain. The largest risk for corrosion activity occurs in the tidal zone of the pile (Hartt and Rapa, 1998). In addition, half-cell measurements are affected by moisture and oxygen levels. To determine if the half-cell measurements changed with elevation, they were plotted as a function of the elevation at which the measurements were made (Figure 51). The measurements in the range of -0.350 to -0.200 V vs. CSE were primarily made at higher elevations. Measurements that were more negative than -0.350 V vs. CSE were made consistently over all elevations. At the front of the data, there was a slight slope of increased negativity as depth increased, but the total change was only -0.10 V vs. CSE. In Figure 51, zero on the y-axis represents the bottom of the pile cap.
0
10
20
30
40
50
60
70-1.000-0.800-0.600-0.400-0.2000.000
Potential (V vs. CSE)
Hei
ght (
in)
Pile Cap
Figure 51. Half-Cell Measurements Sorted by Elevation of Measurement. Zero on the y-axis represents the
bottom of the pile cap.
Ultrasonic Pulse Velocity Table 9 lists the results from the UPV test on the selected piles. A distance of 32 in indicates the test was made over a jacket, and a distance of 24 in indicates the test was on the substrate. Using the results of the UPV tests, the average velocity though the piles was calculated as 13,700 ft/sec. For the other sonic/ultrasonic NDE tests, 13,700 ft/sec was used as the velocity of sound traveling through concrete.

47
Table 9. Ultrasonic Pulse Velocity Measurements Structure Bent Pile Distance (in) Arrival Time (μs) Velocity (ft/sec)
43 F 24 168 11905 45 H 24 136 14684 77 G 24 136 14760 77 G 24 139 14440 77 F 24 153 13055
2866
77 F 24 167 11976 23 C 32 183 14572 23 C 32 196 13605
2902
23 C 32 186 14337 A distance of 32 in indicates the test was made over a jacket, and a distance of 24 in indicates the test was on the substrate.
Resistivity Using a four-point resistivity probe, measurements were made on the concrete and mortar of five piles. Figure 52 presents the resistivity measurements made. The average value of resistivity for the mortar was 23.1 kOhm-cm with a standard deviation of 24.1 kOhm-cm. There was a high variation in the mortar resistivity measurements, as 54% (14 measurements) of the measurements were below 10 kOhm-cm and 23% (6 measurements) of the measurements were below 5 kOhm-cm. Below 5 kOhm-cm, the risk for corrosion is very high; in the range between 5 kOhm-cm and 10 kOhm-cm, the risk for corrosion activity is moderate (Elkey and Sellevold, 1995; Malhotra and Carino, 2004). There is a lot of uncertainty about the limit where corrosion activity is a low risk. Values for low corrosion risk have been given as 10 kOhm-cm (Elkey and Sellevold, 1995), 20 kOhm-cm (Bungey, 1989), and 50 kOhm-cm (Feliu et al., 1996). The mortar resistivity values ranged as high as 79 kOhm-cm.
0
10
20
30
40
50
60
70
80
90
Res
istiv
ity (k
Ohm
-cm
)
Mortar Concrete
Figure 52. Resistivity Measurements of Five Piles
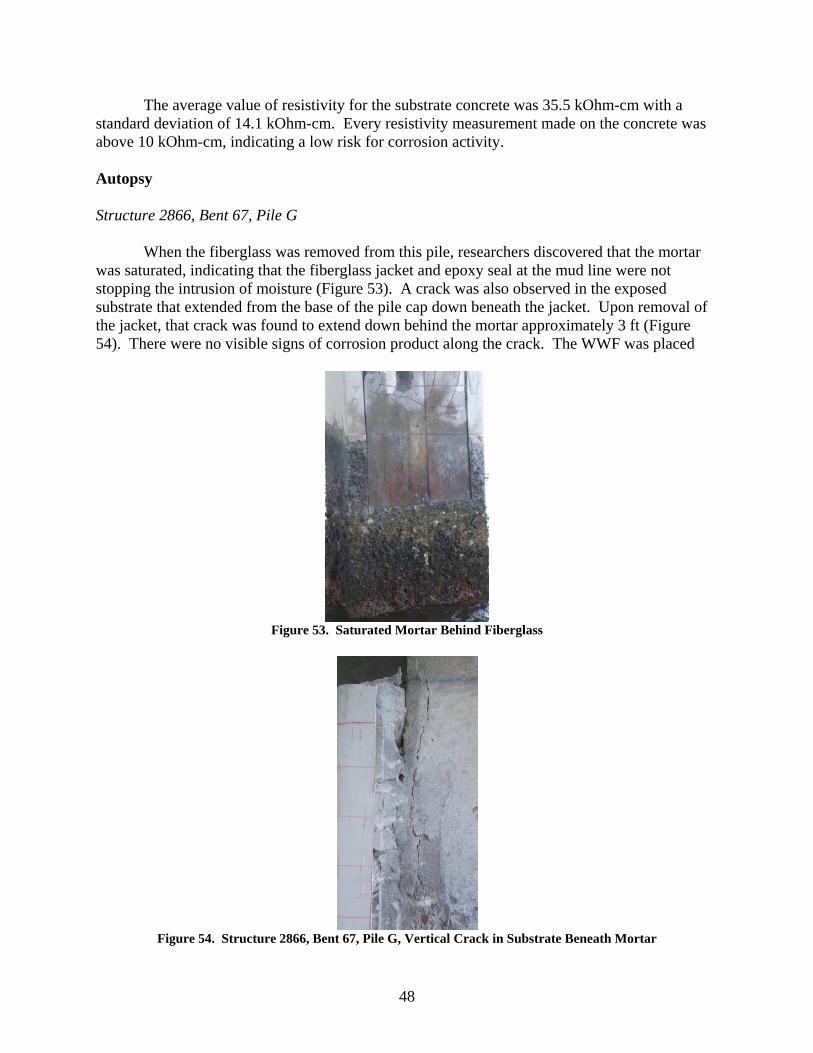
48
The average value of resistivity for the substrate concrete was 35.5 kOhm-cm with a standard deviation of 14.1 kOhm-cm. Every resistivity measurement made on the concrete was above 10 kOhm-cm, indicating a low risk for corrosion activity. Autopsy Structure 2866, Bent 67, Pile G When the fiberglass was removed from this pile, researchers discovered that the mortar was saturated, indicating that the fiberglass jacket and epoxy seal at the mud line were not stopping the intrusion of moisture (Figure 53). A crack was also observed in the exposed substrate that extended from the base of the pile cap down beneath the jacket. Upon removal of the jacket, that crack was found to extend down behind the mortar approximately 3 ft (Figure 54). There were no visible signs of corrosion product along the crack. The WWF was placed
Figure 53. Saturated Mortar Behind Fiberglass
Figure 54. Structure 2866, Bent 67, Pile G, Vertical Crack in Substrate Beneath Mortar
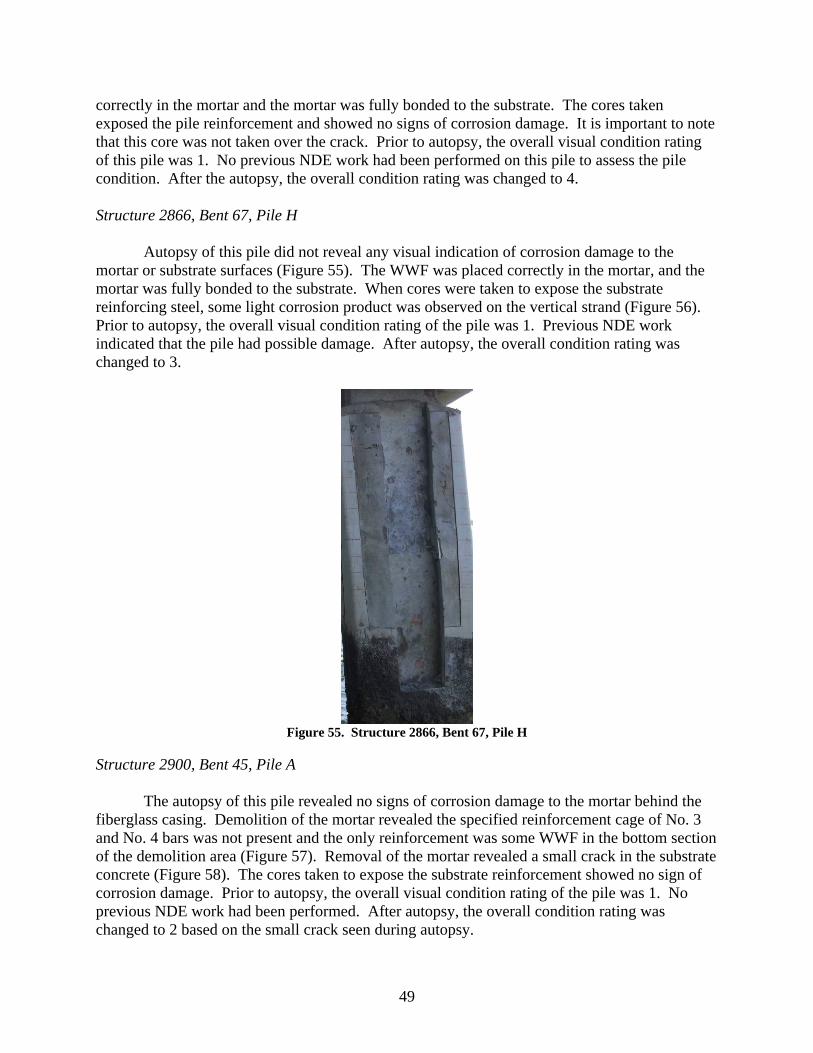
49
correctly in the mortar and the mortar was fully bonded to the substrate. The cores taken exposed the pile reinforcement and showed no signs of corrosion damage. It is important to note that this core was not taken over the crack. Prior to autopsy, the overall visual condition rating of this pile was 1. No previous NDE work had been performed on this pile to assess the pile condition. After the autopsy, the overall condition rating was changed to 4. Structure 2866, Bent 67, Pile H Autopsy of this pile did not reveal any visual indication of corrosion damage to the mortar or substrate surfaces (Figure 55). The WWF was placed correctly in the mortar, and the mortar was fully bonded to the substrate. When cores were taken to expose the substrate reinforcing steel, some light corrosion product was observed on the vertical strand (Figure 56). Prior to autopsy, the overall visual condition rating of the pile was 1. Previous NDE work indicated that the pile had possible damage. After autopsy, the overall condition rating was changed to 3.
Figure 55. Structure 2866, Bent 67, Pile H
Structure 2900, Bent 45, Pile A The autopsy of this pile revealed no signs of corrosion damage to the mortar behind the fiberglass casing. Demolition of the mortar revealed the specified reinforcement cage of No. 3 and No. 4 bars was not present and the only reinforcement was some WWF in the bottom section of the demolition area (Figure 57). Removal of the mortar revealed a small crack in the substrate concrete (Figure 58). The cores taken to expose the substrate reinforcement showed no sign of corrosion damage. Prior to autopsy, the overall visual condition rating of the pile was 1. No previous NDE work had been performed. After autopsy, the overall condition rating was changed to 2 based on the small crack seen during autopsy.

50
Figure 56. Structure 2866, Bent 67, Pile H, Exposed Reinforcement
Figure 57. Structure 2900, Bent 45, Pile A, Improper Reinforcement

51
Figure 58. Structure 2900 Bent 45 Pile A, Vertical Crack Beneath Mortar
Structure 2900, Bent 45, Pile B This pile had a large crack in the substrate that was visible at the top of the pile, above the jacket (Figure 59). The mortar was suffering from section loss, cracking, and significant corrosion staining. The reinforcement in the mortar was constructed per construction documents and was extremely corroded. During the autopsy, the mortar was removed and revealed that the substrate crack extended all the way to the high water line (Figure 60). Since the mortar could not be removed below that point, it was unclear how much further the crack extended. A core was taken over the crack, which exposed corroded reinforcement. The core revealed that the crack followed the length of a vertical tendon that was extremely corroded (Figure 61). Prior to autopsy, the overall visual condition rating of the pile was 5. Previous NDE work indicated that the pile had possible damage. After autopsy, the overall condition rating remained 5.
Figure 59. Structure 2900, Bent 45, Pile B, Prior to Mortar Demolition

52
Figure 60. Structure 2900, Bent 45, Pile B, Exposed Substrate
Figure 61. Structure 2900, Bent 45, Pile B, Exposed Vertical Strand
Structure 2902, Bent 23, Pile C The jacket mortar of this pile had visible corrosion product and section loss (Figure 62). The mortar contained the proper reinforcement. However, it did not have the proper 2-in cover but instead had almost no cover. Once the mortar and WWF were removed, the substrate did not show visual signs of corrosion damage (Figure 63). Coring of the substrate exposed the reinforcement, which revealed some light corrosion product (Figure 64). Prior to autopsy, the overall visual condition rating of this pile was 4. Previous NDE work had determined the pile could have damage. After autopsy, the overall condition rating changed to 5.

53
Figure 62. Structure 2902, Bent 23, Pile C
Figure 63. Structure 2902, Bent 23, Pile C, Exposed Substrate
Figure 64. Structure 2902, Bent 23, Pile C, Exposed Reinforcement
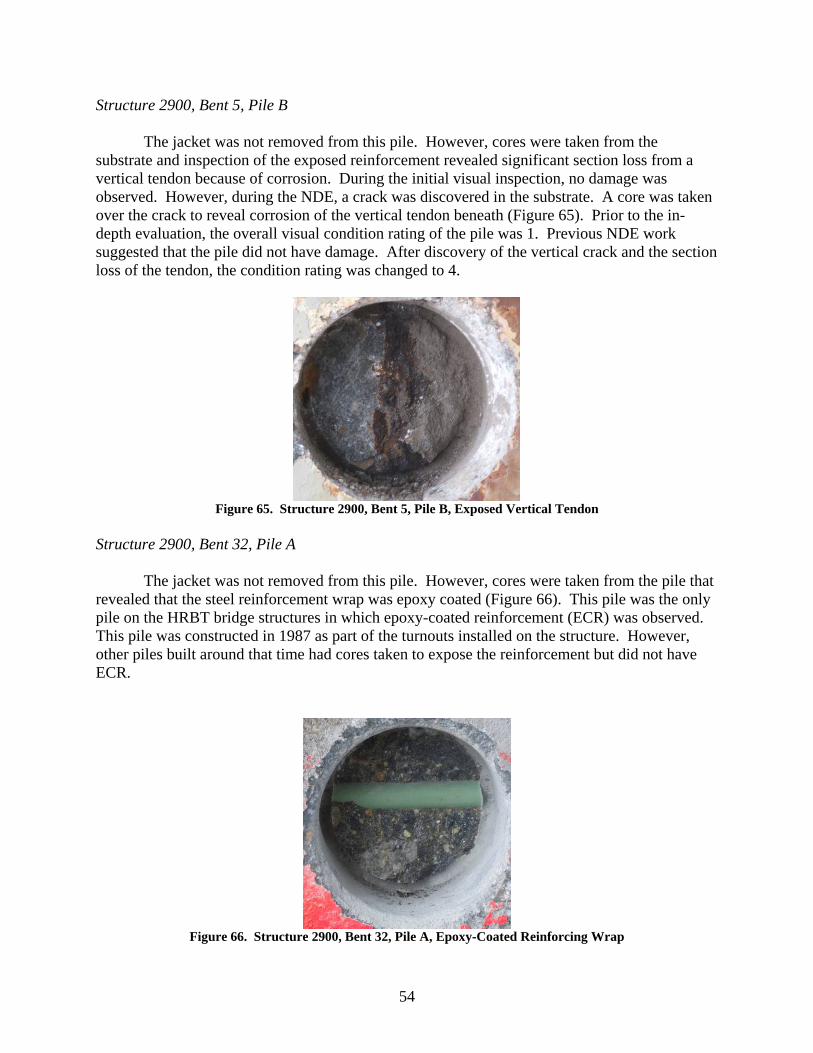
54
Structure 2900, Bent 5, Pile B The jacket was not removed from this pile. However, cores were taken from the substrate and inspection of the exposed reinforcement revealed significant section loss from a vertical tendon because of corrosion. During the initial visual inspection, no damage was observed. However, during the NDE, a crack was discovered in the substrate. A core was taken over the crack to reveal corrosion of the vertical tendon beneath (Figure 65). Prior to the in-depth evaluation, the overall visual condition rating of the pile was 1. Previous NDE work suggested that the pile did not have damage. After discovery of the vertical crack and the section loss of the tendon, the condition rating was changed to 4.
Figure 65. Structure 2900, Bent 5, Pile B, Exposed Vertical Tendon
Structure 2900, Bent 32, Pile A The jacket was not removed from this pile. However, cores were taken from the pile that revealed that the steel reinforcement wrap was epoxy coated (Figure 66). This pile was the only pile on the HRBT bridge structures in which epoxy-coated reinforcement (ECR) was observed. This pile was constructed in 1987 as part of the turnouts installed on the structure. However, other piles built around that time had cores taken to expose the reinforcement but did not have ECR.
Figure 66. Structure 2900, Bent 32, Pile A, Epoxy-Coated Reinforcing Wrap
55
Post-Autopsy Condition Every autopsied pile was given a post-autopsy condition rating based on the condition of the pile that was revealed when the jacket was removed (Table 10). It was seen that the condition ratings of the piles increased, except for Structure 2900, Bent 45, Pile B, which was already at the worst possible rating.
Table 10. Pre-and Post-Autopsy Condition Rating
Structure
Bent
Pile Pre-Autopsy
Rating Post-Autopsy
Rating 67 G 1 4 2866 67 H 1 3 5 B 1 4a
45 A 1 2 2900
45 B 5 5 2902 23 C 4 5
aNot part of the jacket autopsy; rating based on up-close visual survey.
DISCUSSION
Environmental Conditions
The 1.1% chloride in the water surrounding HRBT was relatively low compared to other bridges in salt-water conditions, which can reach chloride levels of 3% or more. In general, HRBT’s environment was less severe than the environment surrounding bridges in Florida, since Florida averages a higher temperature and increased levels of water salinity.
Visible Condition of Encapsulated Piles
At HRBT, a major reason for the difference in condition of the northern and southern structures was that the northern structures were protected by Old Point Comfort (Figure 67), the peninsula that contains Fort Monroe. Old Point Comfort shields these structures from harsh waves and decreases the exposure of the piles during a storm or other inclement weather. Thus, the northern structures were protected from the elements, allowing the fiberglass casings to stay intact longer. This kept the mortar and substrate obscured from view, which resulted in lower overall visual condition rating. The southern structures had 50% of their piles receive a condition rating of 1 compared to 67% of the northern piles. The fiberglass on the southern structures was exposed to worse ocean conditions, causing the fiberglass to come off sooner, which exposed and subsequently caused damage to the mortar. This process drives the visual condition rating of the piles on the southern structures to be far worse (increases overall rating) than those on northern structures. The fiberglass tended to stay intact on square piles better than circular piles. Once the fiberglass of a circular pile had a split, it would soon come off.

56
Figure 67. Northern Structures Protected by Old Point Comfort. Source: VDOT Integrator Enterprise
Geographic Information System, 2009. The mortar was observed to be very poorly constructed, with foreign objects such as wood, PVC, and rope cast into it. In addition, the mortar was poorly consolidated, causing honeycombing to occur in the vast majority of the piles. The reinforcement was also incorrectly placed in the mortar, having little to no cover in some areas, which allowed corrosion to initiate extremely quickly. In some instances, the reinforcement was not present in the mortar or improper reinforcement was placed. Reinforcement in the mortar actually turned out to be counterproductive. This was due to the fact that as the reinforcement in the mortar corroded quickly, it cracked the mortar and allowed chloride to infiltrate through the mortar faster. Piles without reinforcement in the mortar did not have corrosion product on the mortar when the fiberglass fell off, since there was no reinforcement to corrode. This also led to less cracking of the mortar, which allowed the mortar to be a better barrier for the substrate. Most of the piles still had the fiberglass and mortar in place, which did not permit visual inspection of the substrate. Because removal of jackets and visual inspection of the substrate on so many piles was not practical, the need for NDE methods was paramount. The substrate, when exposed, gave good indications of the structural condition. Unfortunately, the substrate was rarely exposed or only small areas were exposed. When corrosion product was observed on the surface of the substrate, closer inspection revealed cracks and the reinforcement beneath had section loss. When the condition of the mortar was poor, the substrate was typically exposed and in a similarly poor state. The age of the structures also played a factor in their condition. Structures 2900 and 2902, at 52 years old, are the oldest structures; Structures 2827 and 2866 are 35 years old. The jackets installed on all the structures were typically 16 years old. Structures 2866 and 2900 are southern structures with similar exposures, but the visual condition of Structure 2900 is significantly worse. This is most likely due to its age. It should be expected that Structure 2866 will be in a similar state in the future because of the similar exposures. The same follows for the
57
two northern structures, Structures 2827 and 2902. Structure 2902 is older and currently in worse condition, but it is only a matter of time until Structure 2827 is in the same condition.
Evaluation of Piles and Methods Used in the Evaluation Ground-Penetrating Radar
GPR has the ability to scan the substrate and detect the condition of the substrate
reinforcement. However, when it was used over the jacket, the depth of cover and mortar reinforcement greatly reduced the effectiveness of GPR. With a jacket in place, GPR was still able to determine the condition of the mortar and if proper reinforcement was placed in the mortar, but the substrate reinforcement was too deep for evaluation.
The amplitudes of the steel reflection measured by GPR were used to determine if the steel was suffering from corrosion damage. A decrease in amplitude was an indication that the steel was damaged. A decrease in amplitude was also caused by attenuations as the wave traveled further distances. In the GPR plots of amplitude, the variation in the amplitude was related closely to the variation of time. With regard to the evaluation of the GPR response from Structure 2900, Bent 45, Pile A and Pile B, Pile A had a higher amplitude reflection than Pile B and a longer time of travel than Pile B. This meant that the difference in amplitude between the two piles was not due to attenuation but likely to degradation of the concrete and steel. It is important to remember that using amplitude to determine pile damage is a relative measurement. Amplitudes can also be affected by permittivity and moisture content. A similar result was seen in Structure 2902, Bent 23, Pile C, where scans in the horizontal and vertical direction had similar travel times but the horizontal scans had higher amplitudes. This indicated that the vertical scans were detecting damage. The vertical scans detected the horizontal steel, which was later exposed to reveal light corrosion product on the wraps. Cross-Hole Sonic Logging CSL was able to indicate locations of interest on many of the piles that were scanned. The difficult part about the CSL was that since these areas of interest are below the water line it was difficult to verify them. The location of interest detected by the CSL equipment could be an area of marine growth or the location of a foreign object that had been cast into the concrete. It could also be a location where significant corrosion had occurred.
The biggest issue with using CSL was the installation of the tubes around the pile. That process took an exorbitant amount of time and was extremely difficult. Even once the tubes were in place, they could not be kept at a precise location because of the irregular pile surface caused by varying marine growth and undulating water conditions. Linearly increasing FAT as depth increased was a firm indication that the tube was not flush with the pile during testing. This was corrected in the FAT plots.

58
It was discovered that the salts in the water were the reason for some data collection errors. If the transducers were not securely fastened to the cables and sealed, salt water infiltrated the connection and caused errors in the transmission and receiving of the signal. In addition, not only do secure connections need to be made, but the transducers must be rinsed with fresh water at the end of each day. Sonic Echo
When the SE peaks were plotted versus the overall visual condition rating, a trend emerged. As the visual condition worsened, the second peak became deeper. A possible reason for this was that as the pile gets a higher visual rating, more of the jacket was damaged. This could allow the SE signal to reach further down the pile. In addition, this could eliminate some of the ringing effect inside the pile, which would limit the overlapping signals that make identifying deeper responses difficult. Further, the jacket could be causing strong impedance when intact. A majority of the signal could be reflected back at the bottom of the jacket because of the large change in stiffness of the pile at this location. As the jacket degrades, the difference in stiffness between the portion with a jacket and the portion without a jacket decreases. This allows the wave to travel further down the pile to give deeper reflections. Impulse Response
IR was difficult to post-process because of the numerous frequencies in the response of the pile. With IR, it was apparent that the accelerometer was the most effective for determining the response of the pile because of its location directly on the pile. The geophone, being on the cap, caused a lot of noise in the data that was difficult to interpret and gave very shallow reflections because of the pile cap. Several of the piles had the most prominent response at a depth less than 10 ft, which is in the tidal zone. This was the area of most concern for corrosion damage, and those piles could have significant damage. When dealing with the flexibility calculations, the geophone was better, because of its increased ability to detect lower frequencies. Damage is usually indicated by a significant increase in the flexibility. In the data collected by the geophone, the range of flexibilities was only 2 x 10⁻⁷ in/lbf. Perhaps the piles are not capable of deflecting much because of their constraints. The length of the pile that is free to move is very short compared to the total length of the pile. In addition, the piles have one end fixed below the mud line and the other end fixed in the pile cap. These constraints do not allow the piles to be very flexible. The damage would have to be severe for the flexibility to increase significantly. Damage seen by FDOT might be capable of increasing the flexibility by orders of magnitude, but the damage to HRBT was insufficient to change flexibility drastically.
Chloride Sampling
The diffusion rates of the substrate samples were relatively low. This was most likely attributable to the piles being constructed off site at a precasting plant, which had better quality control than a cast-in-place operation would. At a precasting plant, the piles would have been properly consolidated and cured in optimal conditions, making the permeability low. Even

59
though the diffusion rate was low, these piles still have significant amounts of chloride penetration because of the length of exposure. Approximately one-half of these piles have been in service for 52 years. Even with a low diffusion rate, chlorides will still eventually reach the steel. During the chloride analysis of the mortar samples, it was discovered that the diffusion of chlorides was not occurring from just the exterior face but also from the surface that was in contact with the substrate. There are two possible explanations for this: the first was that the chlorides were diffusing from the substrate. The mortar was placed on the substrate after the substrate had been in service for approximately 36 years. In those 36 years, the substrate accumulated chlorides so when the chloride-free mortar was placed on the substrate the chlorides could have migrated into the mortar from the substrate. The problem with this theory was that prior to jacket installation, all of the piles were coated with epoxy after 29 years of service. Epoxy is a known barrier to moisture and the diffusion of chlorides. This would slow the intrusion of chlorides and slow the chlorides from subsequently migrating into the mortar. In addition, the chloride concentrations in the mortar were extremely high and the concentrations at each face were similar, which suggests the method of chloride transport was similar on both faces. The second explanation for this reverse diffusion was that seawater wicked up between the mortar and substrate, depositing chlorides in the mortar. During the autopsy of the jackets, it was observed that when the fiberglass jacket was removed from an intact jacket system, the mortar was saturated. Water is most likely infiltrating at the bottom of the jacket where the substrate and mortar meet. Thus, the reverse chloride transport into the mortar is most likely a combination of diffusion from wicking water and migration from the substrate. Several calculated diffusion rates for the mortar and concrete were abnormally high. For instance, one sample had a value of 4114.69 mm2/yr. This value was exorbitantly high and unrealistic. These high values are due to the limitations of the diffusion coefficient calculations. The calculation of the diffusion coefficient is based on Fick’s Second Law of Diffusion, assuming diffusion in one direction into a semi-infinite solid. The mortar samples do not closely fit those assumptions. The amount of chlorides that has reached the steel indicates that the nominal chloride threshold has been reached and the passive layer may be neutralized. The threshold for reinforcement depends on many factors, so it is difficult to say exactly which piles have reached the threshold. Piles with chloride concentrations at the steel over 1 lb/yd3 are considered at risk for losing passivity. Half-Cell Potentials
The half-cell measurements made on the HRBT piles indicated that a vast majority of the piles had a potential indicating active corrosion. Very few of the measurements made were below -0.200 V vs. CSE. It was noted that many of the piles in the condition rating 1 category had potentials in the range of -0.500 V vs. CSE but no visible signs of corrosion. There could be several reasons for this; the first is that corrosion was localized and the small openings that were made happened to be over cathodes, so no ferric oxide was visible. The likelihood of this happening within every pile for which corrosion was not observed was very low. A more

60
probable reason is that the piles in the condition rating 1 category were primed for corrosion but lacked an element necessary to support the corrosion process. Without oxygen, water, an ionic connection, and an electronic connection, corrosion will not occur. The piles in the condition rating 1 category had fully intact jackets, and the mortar was generally saturated with moisture, meaning that the substrate may lack sufficient oxygen to initiate or support stable corrosion, even though the electrical potential would suggest a high probability of corrosion. This means that when the jacket is breached because of exposure or poor mortar quality, oxygen would then be available to the piles and corrosion could initiate quickly. Analysis of the half-cell measurements based on elevation revealed that the half-cell range of -0.200 to -0.350 V vs. CSE was mostly contained to the upper elevations. Half-cell measurements that were more negative than -0.350 V vs. CSE were evenly distributed over all elevations. This decreases the concern that the high potential measurements are due to the saturation of the substrate at lower elevations. Decreases in oxygen and increases in water will cause half-cell measurements to be more negative (Gu and Beaudion, 1998). In the case of the HRBT piles, the highly negative half-cell readings are consistent at all elevations. There was a slight slope in the data, -0.10 V vs. CSE over the measured pile length, which was mostly likely the effect of saturation and decreased oxygen of the piles. With the effect of saturation and decreased oxygen levels removed, the half-cell measurements still indicate a high potential for active corrosion.
Ultrasonic Pulse Velocity
The measured sound velocity through the piles of 13,700 ft/sec was a reasonable value for the HRBT piles. Resistivity The resistivity measurements indicated that the mortar was far more susceptible to corrosion than the concrete, which was also apparent by the visual inspection. This was indicated by no concrete resistivities being below 10 kOhm-cm but 54% of the mortar resistivities being below 10 kOhm-cm. Even though the substrate was at a lower risk, almost one-half of the piles have been in service for 56 years. The resistivity may be low, but chlorides have had a significant amount of time to migrate, break down the passive layer, and initiate corrosion activity. Even high-quality concrete will submit to corrosion over time, although high resistivity will slow the subsequent rate of corrosion. Autopsy The autopsy revealed that the jackets are hiding damage from view. When the mortar was removed, cracking in the substrate was discovered on several piles. The degree of damage found behind the jackets was not nearly as severe as that found by FDOT, but it is still cause for concern. Some of the small cracking that was not accompanied by corrosion product could have been caused by pile installation. Driving of the piles can cause cracking near the cap elevations.

61
When the reinforcement of the substrate was exposed by coring, corrosion product was found on the reinforcement a majority of the time; 56% of reinforcement that was exposed during autopsy had some form of corrosion product. The corrosion was found to be severe in only a few instances, but light corrosion product was present in a significant number of the piles. This occurred on a variety of piles in different conditions, indicating that visual observations were not sufficient to evaluate the jacketed piles. The observations of cracking behind the jackets and corrosion of the substrate reinforcement indicate that the corrosion damage of the piles behind the jackets was underestimated because of the jacket condition. This was a conclusion that FDOT also came to after their study of jacketed piles. Another similar finding of FDOT’s research and this research was that as the condition of the jacket worsens, it gets closer to representing the substrate condition. If the mortar looks severely damaged by corrosion, the substrate beneath will most likely be severely damaged also. If a jacket looked to be in excellent condition, the condition of the substrate behind the jacket was extremely variable. Corrosion could be active in the substrate and cracking may have occurred, but if the jacket was still intact, it would not allow for accurate visual assessment of the pile. The substrate was in worse condition than the external condition of the jackets would suggest. Such a change in condition was also seen by FDOT on a far greater scale (Hartt and Rapa, 1998).
Summary
Table 11 summarizes the effectiveness of each evaluation method used on the HRBT piles. The table relates the relative time each method takes in the field to perform, the quality of the data received from the technique, and whether the method was a NDE method.
Table 11. Summary of Evaluation Methods
Method Time
Efficiency
Usefulness of Data for Current Application
Method Type Visual assessment Fast Useful, but subject to visibility of element of interest.
Jacket masks structural pile Non-destructive
Ground-penetrating radar
Fast Not useful to detect below mortar reinforcement Non-destructive
Cross-hole sonic logging
Slow Not useful because of difficulty in placing guide tubes Non-destructive
Sonic echo Very fast Useful, but as-built data are preferred to aid interpretation Non-destructive Impulse response Very fast Useful, but as-built data are preferred to aid interpretation Non-destructive Half-cell potential Medium Very useful, but requires electrical connection to
reinforcement Non-destructive
Chloride sampling Very slow Very useful to indicate corrosion probability and time to corrosion
Destructive
Resistivity Fast Useful to characterize concrete/mortar quality and ability to support corrosion current flow
Non-destructive
Ultrasonic pulse velocity
Fast Useful to characterize wave speed through concrete Non-destructive
Jacket autopsy Very slow Very useful for ground-truth validation of corrosion activity and subsequent damage
Destructive

62
CONCLUSIONS
Environmental Conditions
• The HRBT environment is not as harsh as the environment surrounding Florida’s bridges. That is one of the reasons the piles of the HRBT and the piles in Florida did not show the same degree of damage. The HRBT environment has a lower seawater chloride concentration and cooler annual average daily temperatures, causing corrosion to not be as severe.
Visible Condition of Encapsulated Piles • The fact that a jacket received a visual rating as undamaged did not indicate that the
substrate beneath was also undamaged. The condition of the substrate behind intact jackets was extremely variable.
• When a jacket appeared severely damaged by corrosion, it was likely that the substrate
beneath was also severely damaged. • Structure exposure was an important factor in the condition of the piles. Structures 2866 and
2900 in the open channel were in far worse condition than Structures 2827 and 2902, which were shielded by Old Point Comfort.
• Reinforcement placed in the jacket mortar corroded rapidly, causing the mortar to degrade
quickly and open pathways for chloride to reach the substrate. • Jackets on piles with circular cross-sections were not as durable as jackets on the square
piles. More circular piles were missing jackets than square piles, allowing the substrate to be directly exposed to the environment.
• The mortar in the jackets was of low quality because of poor construction quality control.
Foreign objects cast into the mortar, poor consolidation, and incorrect placement of reinforcement was seen in most of the piles.
Evaluation of Piles and Methods Used in the Evaluation Ground-Penetrating Radar • If present in the mortar, the WWF reinforcement greatly reduced the effective depth of the
GPR antenna. When the mortar did not have reinforcement, the substrate steel was detectable by the antenna; however, the signal was so faint because of cumulative cover that no reliable information about the steel condition could be determined.

63
• Corrosion damage of the reinforcement can be detected by GPR via decreases in amplitude of the reinforcement reflections. The amplitude of the signal is affected by attenuation in the material, which is based largely on the travel time of the signal. Therefore, a change in amplitude should be checked against travel time of the reflected wave.
• GPR was effective in determining reinforcement condition when used directly on the
substrate. If a jacket was in place, the GPR was not useful to assess the substrate; however, it was useful to assess the condition of the jacket and mortar.
Cross-Hole Sonic Logging • If preinstalled tubes do not exist in a pile, CSL can be used on the outside of the pile to detect
damage. The tubes must be placed with care to ensure good contact and alignment with the pile. CSL was used successfully to scan the submerged portion of the HRBT piles and detect locations of possible damage. However, CSL was not a time-effective method for evaluating the HRBT piles because of the difficulty in tube installation and intensive post-processing of the data. Marine growth, pile conditions, and access issues made installation of the tubes extremely time-consuming, which detracted from CSL’s usefulness as a field test method.
Sonic Echo
• As pile condition worsened, less of the jacket was typically still intact, permitting deeper SE
reflections to be detected. • The degree of damage to the HRBT piles was not great enough to make SE the most effective
test method. Only a few of the piles were damaged enough for detection by SE. SE may be a useful test method for future detection of damage in the HRBT piles as corrosion progresses.
Impulse Response
• The location of the receiving transducers was key to obtaining good information about the
piles. The location of the geophone on the pile cap was not ideal and induced noise in the data.
• Concern regarding corrosion damage was raised by a peak accelerometer response that
indicated reflections near the water line. Such responses may indicate damage within the splash zone, which is most susceptible to corrosion.
• Recorded flexibility values were small because of physical constraints on the piles and the
small impact force applied. The damage to the piles was not severe enough to cause significant change in the flexibility.
• IR was time-efficient and effective in identifying piles with possible damage. However, to be
detected by IR, damage would have to be significant and only a few piles on the HRBT had reached that stage of deterioration.

64
Chloride Sampling • The substrate concrete was of good quality, with a low rate of chloride diffusion. Even so,
about one-half of the piles had been in service for 52 years; thus, significant amounts of chloride were present in the substrate. A sufficient amount of chloride had reached the steel in the substrate to initiate corrosion in most of the HRBT piles tested. The passive layer surrounding the steel is most likely compromised or severely damaged in most piles.
• Jackets do not stop the diffusion of chloride into the substrate, since wicking of chloride-
laden water occurs inside the jacket. Chloride was diffused through both faces of the mortar because of the contact with the chloride-contaminated substrate and intrusion of chloride-laden water.
Half-Cell Potentials • Half-cell measurements conducted on the substrate of the piles indicated that most piles have
the potential for active corrosion. Very few potential measurements indicated a low probability of active corrosion.
• Jackets that had intact, well-bonded fiberglass casing and mortar appeared, in some cases,
to prevent the initiation of corrosion. However, the potential for corrosion was present and in the event jacket integrity is compromised, corrosion could activate quickly.
Ultrasonic Pulse Velocity • The average velocity of a sound wave through concrete in the HRBT piles was 13,700 ft/sec.
This value is typical of moderate-quality concrete. Resistivity • The mortar of the jackets on HRBT had low resistivity, indicating susceptibility to corrosion. • The substrate of the HRBT piles had high resistivity, indicating good resistance to corrosion.
Even with the high resistivity values, the substrate had been in service for a significant time, which allowed the initiation of corrosion.
Autopsy • The jacket system does not prevent water from reaching the surface of the substrate.
Wicking is occurring in the jacket, allowing chloride-laden water to infiltrate the mortar and substrate.
• The mortar in the jackets was of comparatively poor quality, which leads to ineffectiveness of
the jackets.

65
• Most of the piles had iron oxides (corrosion product) forming on the reinforcement in varying degrees. Corrosion product ranged from light surface corrosion to severe section loss. Behind intact jackets, the substrate showed signs of corrosion damage, which indicated the external damage assessment underestimated the severity of damage.
• The substrate of the piles was constructed of good-quality concrete that has provided an
effective barrier to chloride. Though the substrate was of good quality, the piles have been in service for a significant amount of time, which has led to the initiation of corrosion damage.
RECOMMENDATIONS
HRBT Piles
1. When rehabilitating the HRBT structure, VDOT’s Hampton Roads District should begin with the piles that were documented in this report to have a visual condition rating of 5 and piles that records indicate had pre-existing damage when the jackets were installed. Structure 2900 has the worst exposure and is the oldest, most damaged structure, so its piles should be the first priority. Structure 2866 is in the second worst condition, followed by Structure 2902 and Structure 2827.
2. For future investigations of the HRBT piles, VDOT’s Hampton Roads District should use
chloride concentration analysis, electrochemical half-cell measurement, and SE/IR to characterize the condition and corrosion probability of piles encased in mortar-filled jackets. Each of these methods proved effective in assessing aspects of overall pile condition, and a strategic application of these methods will be useful to rate and prioritize pile repairs.
3. VDOT’s Hampton Roads District should not install replacement mortar-filled or epoxy-filled
jackets on the HRBT piles that already exhibit corrosion damage. Such jackets provide minimal structural benefit and are ineffective in stopping corrosion activity, and they may serve to mask the effects of such corrosion.
4. VDOT’s Hampton Roads District should not install conventional mortar-filled or epoxy-filled
jackets on previously untreated HRBT piles, since they have been in service long enough to have reached the chloride threshold limit. Once critical chloride contamination has occurred, the jackets are ineffective at stopping the corrosion process. Corrosion can activate following the jacket installation and proceed undetected until significant pile damage occurs.
5. If replacement jackets are to be installed on the HRBT piles, VDOT’s Hampton Roads
District should ensure that new jackets include a galvanic cathodic protection system to slow or arrest corrosion of the reinforcement. Piles that have significant section loss in the tendons, delamination, spalls, or cracking should be repaired before the installation of the cathodic protection system.

66
VDOT Bridges Built with Piles Located in Marine Environments
6. VDOT’s Structure & Bridge Division should consider installing epoxy-grouted jackets or weather-resistant epoxy coatings to the splash zones of new piles prior to installation or at the beginning of the service life to serve as a barrier to chloride ingress.
7. VDOT’s Structure & Bridge Division should not use jacket systems with cementitious mortar
fill because the mortar is not sufficiently impermeable to water and chloride intrusion, because of the possibility of accelerated corrosion caused by the ring anode effect, and because of the poor durability of the mortar, which limits the effectiveness of the jacket.
8. VDOT’s Structure & Bridge Division should not use steel reinforcement in mortar-filled
jackets. The steel corrodes quickly, decreasing the jackets’ service life. 9. VDOT’s Structure & Bridge Division should not install mortar-filled or epoxy-filled jackets
on piles that exhibit corrosion damage or on piles that have been in service long enough to have reached the chloride concentration threshold at the reinforcement. Conventional mortar-filled jackets are not effective at stopping the corrosion process and may mask significant pile damage.
10. If jackets are to be used by VDOT’s Structure & Bridge Division, the jackets should
implement a galvanic (passive) cathodic protection system to passivate the reinforcement. Piles that have significant section loss in the tendons, delamination, spalls, or cracking should be repaired before the installation of a cathodic protection system.
BENEFITS AND IMPLEMENTATION
HRBT is a vital artery to the communities of southeast Virginia and the U.S. military. Just one of the bridges being removed from service would cost the surrounding communities and the U.S. military $2,930,000 per day (Dougald, 2007). Implementing measures to slow the corrosion process on the HRBT piles can save VDOT money in the future. By extending the life of the HRBT piles and decreasing maintenance costs, the effective life of the structure can be extended.
Using a jacket system with a cementitious mortar fill is uneconomical and ineffective because the jackets, as designed and installed, do not perform their intended purpose of preventing chloride intrusion and hindering corrosion activity. Given this observation, it is not expected that the mortar-filled jackets would extend service life of the piles commensurate with the cost of jacket installation. It is possible that corrosion may proceed, obscured by the jackets, resulting in greater cumulative damage before detected. Mitigation efforts would likely be more expensive, as they would be complicated by the presence of the jackets. Current repairs of the HRBT piles involve using a jacket with an epoxy fill that costs $5 per square foot (W. Forbes, personal communication, October 13, 2009). Jackets that implement

67
epoxy fill can be effective at preventing or slowing ingress of chloride contaminants but in most cases will not hinder corrosion activity, once initiated. Epoxy jackets will conceal damage, as with the mortar jacket. Since the HRBT piles currently have sufficient chloride contamination in the concrete to initiate or continue corrosion activity, retrofitted epoxy-filled jackets will not likely prevent the progress of corrosion.
It would cost approximately $25 per square foot for jackets that would implement a galvanic cathodic protection system (D. Leng, personal communication, October 6, 2009). The benefit of a cathodic protection system is that, if properly designed and installed, it is capable of mitigating corrosion and extending the service life of a pile where corrosion has initiated. The specifics of the design may vary, where quantities of sacrificial mesh or even supplementary bulk anode material can be customized. The resulting service life of the jackets will depend on the amount of sacrificial anode material, the rate of anode consumption (corrosion) that is induced by the service environment, and the ability of the anode to remain active (not passivate or lose electrical continuity). Nonetheless, industry experts and purveyors of these products predict a service life extension of up to 20 years in many cases; up to 50 years may be possible (Broomfield, 2007). The design of galvanic cathodic protection systems for the piles and the associated estimate of service life is beyond the scope of this study, but they are recommended as part of the future maintenance planning process.
ACKNOWLEDGMENTS Special thanks go to VDOT’s Hampton Roads District. Their help was instrumental in providing access to the HRBT piles, understanding its history, and completing this report. They were very accommodating of the demanding schedule of this research and were always more then willing to help with whatever was needed. Special thanks go to Riki Williams and Keith Futrell, who did a tremendous job at operating the boat and getting it wherever it was needed, in a variety of weather conditions. The snooper truck crews, Doug Smith, Cedric Jackson, Alvin Andrews, Nate Williams, and Sam Wolford, did an amazing job operating the snooper trucks and an excellent job in the demolition of the jackets. Appreciation goes out to the people of the Suffolk Bridge Office, including Timothy Felton, Will Forbes, James Long, and Wilt Hughes, who coordinated the schedules of the bridge crews and made sure that proper equipment was available. Sincere gratitude goes out to Cesar Apusen, Aaron Dupont, Bill Ordel, John Connelly, and Chris Hemp who all took part in the trips to the HRBT. They did exceptional work, even though the weather was not always the greatest.
REFERENCES
ASTM International. Annual Book of ASTM Standards, Vol. 3.02. West Conshohocken, PA,
2009a.

68
ASTM International. Annual Book of ASTM Standards, Vol. 4.02. West Conshohocken, PA, 2009b.
ASTM International. Annual Book of ASTM Standards, Vol. 4.09. West Conshohocken, PA,
2009c. Broomfield, J.P. Corrosion of Steel in Concrete. Taylor & Francis, Abingdon, Oxon, England,
2007. Bungey, J.H. Testing of Concrete in Structures, 2nd ed. Chapman & Hall, New York, 1989. Davis, A. The Nondestructive Impulse Response Test in North America: 1985-2001. Non
Destructive Testing & Evaluation International, Vol. 36, No. 4, 2003, pp. 185-193. Dougald, L.E. A Return on Investment Study of the Hampton Roads Safety Service Patrol
Program. VTRC 07-R33. Virginia Transportation Research Council, Charlottesville, 2007.
Elkey, W., and Sellevold, E.J. Electrical Resistivity of Concrete. Norwegian Road Research
Laboratory, Oslo, July 1995. Feliu, S., Gonzalez, J.A., and Andrade, C. Techniques to Assess the Corrosion Activity of Steel
Reinforcement Concrete Structures. In ASTM STP 1276, N.S. Berke, E. Escalante, C.K. Nmai, and D. Whiting, Eds. American Society for Testing and Materials, West Conshohocken, PA, 1996.
Funahashi, M. Predicting Corrosion-Free Service Life of a Concrete Structure in a Chloride
Environment. ACI Materials Journal, Vol. 87, No. 6, November 1990, pp. 581-587. Gu, P., and Beaudion, J.J. Obtaining Effective Half-Cell Potential Measurements in Reinforced
Concrete Structures. Institute for Research in Construction: Construction Technology Update, Vol. 18, No. 4, July 1998, pp. 1-4.
Hartt, W.H., and Rapa, M. Condition Assessment of Jackets Upon Pilings for Florida Bridge
Substructures. WPI No. 0510803. Florida Department of Transportation, Tallahassee, April 13, 1998.
Hartt, W.H., Rapa, M., and Powers, R.G. A Condition Assessment of Pile Jackets Upon Florida
Coastal Bridge Substructures. In Concrete for Extreme Conditions, Proceedings of the International Conference. Thomas Telford Publishing, Heron Quay, London, 2002.
Malhotra, V.M., and Carino, N.J. Handbook on Nondestructive Testing of Concrete. CRC Press
LLC, West Conshohocken, PA, 2004. Office of Naval Research. Ocean Water: Salinity.
http://www.onr.navy.mil/Focus/ocean/water/salinity1.htm. Accessed June 19, 2009.

69
Pailes, B. Determining Methods for Evaluating Corrosion Damage in Piles Encapsulated in Protective Jackets. Master’s Thesis. University of Virginia, Charlottesville, August 2009.

70

71
APPENDIX
PLAN VIEW OF CONDITION RATINGS OF HAMPTON ROADS BRIDGE-TUNNEL PILES

72

73
Figure A-1. Hampton Roads Bridge-Tunnel, Structure 2827 Pile Condition Ratings, Part 1

74
Figure A-2. Hampton Roads Bridge-Tunnel, Structure 2827 Pile Condition Ratings, Part 2

75
Figure A-3. Hampton Roads Bridge-Tunnel, Structure 2866 Pile Condition Ratings, Part 1

76
Figure A-4. Hampton Roads Bridge-Tunnel, Structure 2866 Pile Condition Ratings, Part 2

77
Figure A-5. Hampton Roads Bridge-Tunnel, Structure 2900 Pile Condition Ratings, Part 1

78
Figure A-6. Hampton Roads Bridge-Tunnel, Structure 2900 Pile Condition Ratings, Part 2

79
Figure A-7. Hampton Roads Bridge-Tunnel, Structure 2900 Pile Condition Ratings, Part 3

80
Figure A-8. Hampton Roads Bridge-Tunnel, Structure 2902 Pile Condition Ratings, Part 1

81
Figure A-9. Hampton Roads Bridge-Tunnel, Structure 2902 Pile Condition Ratings, Part 2