1.0 Factsheet Spain - European Commission | Choose your...
36
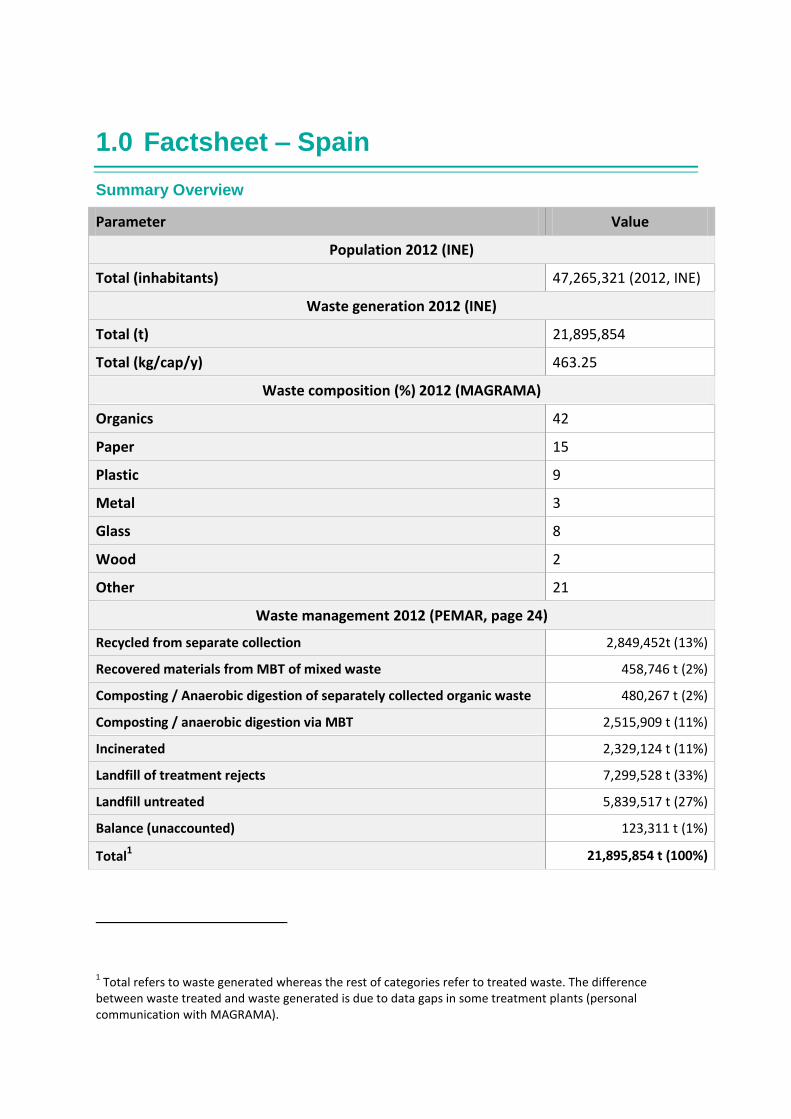
1.0 Factsheet – Spain Summary Overview Parameter Value Population 2012 (INE) Total (inhabitants) 47,265,321 (2012, INE) Waste generation 2012 (INE) Total (t) 21,895,854 Total (kg/cap/y) 463.25 Waste composition (%) 2012 (MAGRAMA) Organics 42 Paper 15 Plastic 9 Metal 3 Glass 8 Wood 2 Other 21 Waste management 2012 (PEMAR, page 24) Recycled from separate collection 2,849,452t (13%) Recovered materials from MBT of mixed waste 458,746 t (2%) Composting / Anaerobic digestion of separately collected organic waste 480,267 t (2%) Composting / anaerobic digestion via MBT 2,515,909 t (11%) Incinerated 2,329,124 t (11%) Landfill of treatment rejects 7,299,528 t (33%) Landfill untreated 5,839,517 t (27%) Balance (unaccounted) 123,311 t (1%) Total 1 21,895,854 t (100%) 1 Total refers to waste generated whereas the rest of categories refer to treated waste. The difference between waste treated and waste generated is due to data gaps in some treatment plants (personal communication with MAGRAMA).
Transcript of 1.0 Factsheet Spain - European Commission | Choose your...
1.0 Factsheet – Spain
Summary Overview
Parameter Value Population 2012 (INE)
Total (inhabitants) 47,265,321 (2012, INE)
Waste generation 2012 (INE) Total (t) 21,895,854
Total (kg/cap/y) 463.25
Waste composition (%) 2012 (MAGRAMA) Organics 42
Paper 15
Plastic 9
Metal 3
Glass 8
Wood 2
Other 21
Waste management 2012 (PEMAR, page 24)
Recycled from separate collection 2,849,452t (13%)
Recovered materials from MBT of mixed waste 458,746 t (2%)
Composting / Anaerobic digestion of separately collected organic waste 480,267 t (2%)
Composting / anaerobic digestion via MBT 2,515,909 t (11%)
Incinerated 2,329,124 t (11%)
Landfill of treatment rejects 7,299,528 t (33%)
Landfill untreated 5,839,517 t (27%)
Balance (unaccounted) 123,311 t (1%)
Total1 21,895,854 t (100%)
1 Total refers to waste generated whereas the rest of categories refer to treated waste. The difference
between waste treated and waste generated is due to data gaps in some treatment plants (personal communication with MAGRAMA).
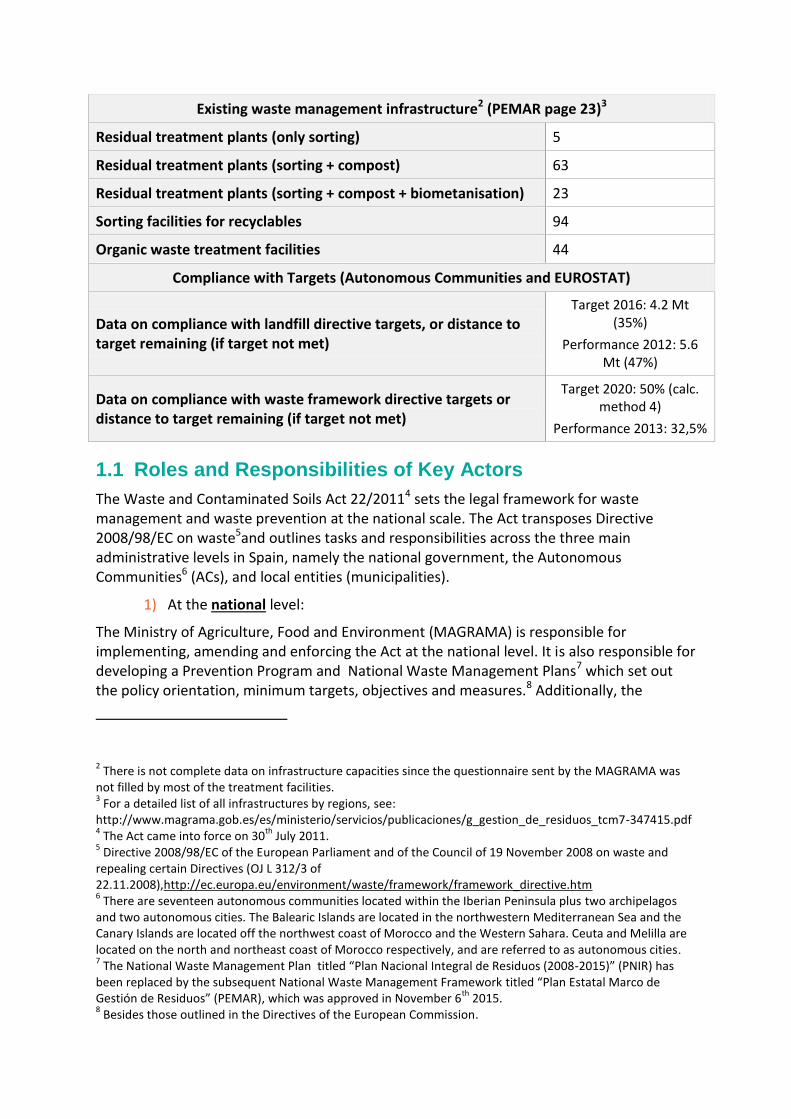
Existing waste management infrastructure2 (PEMAR page 23)3 Residual treatment plants (only sorting) 5
Residual treatment plants (sorting + compost) 63
Residual treatment plants (sorting + compost + biometanisation) 23
Sorting facilities for recyclables 94
Organic waste treatment facilities 44
Compliance with Targets (Autonomous Communities and EUROSTAT)
Data on compliance with landfill directive targets, or distance to target remaining (if target not met)
Target 2016: 4.2 Mt (35%)
Performance 2012: 5.6 Mt (47%)
Data on compliance with waste framework directive targets or distance to target remaining (if target not met)
Target 2020: 50% (calc. method 4)
Performance 2013: 32,5%
1.1 Roles and Responsibilities of Key Actors
The Waste and Contaminated Soils Act 22/20114 sets the legal framework for waste management and waste prevention at the national scale. The Act transposes Directive 2008/98/EC on waste5and outlines tasks and responsibilities across the three main administrative levels in Spain, namely the national government, the Autonomous Communities6 (ACs), and local entities (municipalities).
1) At the national level:
The Ministry of Agriculture, Food and Environment (MAGRAMA) is responsible for implementing, amending and enforcing the Act at the national level. It is also responsible for developing a Prevention Program and National Waste Management Plans7 which set out the policy orientation, minimum targets, objectives and measures.8 Additionally, the
2 There is not complete data on infrastructure capacities since the questionnaire sent by the MAGRAMA was
not filled by most of the treatment facilities. 3 For a detailed list of all infrastructures by regions, see:
http://www.magrama.gob.es/es/ministerio/servicios/publicaciones/g_gestion_de_residuos_tcm7-347415.pdf 4 The Act came into force on 30
th July 2011.
5 Directive 2008/98/EC of the European Parliament and of the Council of 19 November 2008 on waste and
repealing certain Directives (OJ L 312/3 of 22.11.2008),http://ec.europa.eu/environment/waste/framework/framework_directive.htm 6 There are seventeen autonomous communities located within the Iberian Peninsula plus two archipelagos
and two autonomous cities. The Balearic Islands are located in the northwestern Mediterranean Sea and the Canary Islands are located off the northwest coast of Morocco and the Western Sahara. Ceuta and Melilla are located on the north and northeast coast of Morocco respectively, and are referred to as autonomous cities. 7 The National Waste Management Plan titled “Plan Nacional Integral de Residuos (2008-2015)” (PNIR) has
been replaced by the subsequent National Waste Management Framework titled “Plan Estatal Marco de Gestión de Residuos” (PEMAR), which was approved in November 6
th 2015.
8 Besides those outlined in the Directives of the European Commission.
MAGRAMA is responsible for authorizing and monitoring foreign trade of waste and for adhering to reporting requirements on the progress of waste management policies.
2) At the Autonomous Communities (ACs) level:
It is at the ACs level where most of the responsibility for planning and implementation lies. ACs are responsible for:
The development of regional waste management and prevention plans, both general and sectorial (i.e. municipal waste). These plans must set specific regional targets, in line with, or exceeding, those set by the MAGRAMA. Moreover they outline which financial resources are available and how the budget will be allocated. Within some of the ACs there are also agencies and specific Departments focusing specifically on waste management (e.g. Catalan Waste Agency);
Surveillance, authorization, inspection and the application of sanctions on waste management.
Monitoring, recording and reporting data on waste management to the MAGRAMA; and
Developing specific legislation on waste. Apart from the various Acts implementing the regional plans, 13 ACs have also developed and implemented regional legislation on waste. Figure 1.2 displays the current state of regional legislation on waste at the AC scale.
3) At the local level:
Municipalities are responsible for the collection, transport and treatment of municipal waste and they may choose to develop their own waste management and prevention programs. They generally perform these responsibilities by grouping themselves into associations of municipalities (Mancomunidades, Consorcios, etc).
At the intersection of these three administrative levels sits the Commission for the Coordination on Waste (Comisión de Coordinación en materia de residuos), which is formed by representatives from the three main administrative levels in order to trigger cooperation and collaboration between them. Its functions cover:
Reporting and elaborating recommendations for collaboration;
Analysing the application of regulation and their consequences;
Ensuring knowledge on waste management is up to date and ensuring it is easily disseminated (particularly on packaging);
Providing justifications in cases where the waste hierarchy is not followed
Exchanging information and developing recommendations on authorisations regarding the collective systems of extended producer responsibility.
1.2 Summary of Legislative Framework for Waste Management
Directive 2008/98/EC on waste (hereafter referred to as the Waste Framework Directive or WFD) has been transposed by Act 22/2011 of July 28th on Waste and Contaminated Soils,
which repeals Law 10/1998 on waste and its subsequent modifications (Law 11/2012 of July 20th and Law 5/2013 of June 11th). These pieces of legislation set out the framework for planning, defining roles and allocating tasks regarding waste management at the national, regional and municipal level. Furthermore Directive 1999/31/EC9 on the landfill of waste (hereafter referred to as the Landfill Directive) is transposed by Royal Decree 1481/2001, and its subsequent modifications (i.e. Royal Decree 1304/2009 of July 31st and Order AAA/661/2013 of April 18th). Waste incineration is regulated through Royal Decree 815/2013 of October 18th and Act 16/2002 of July 1st. The most recent regulation is Royal Decree 180/2015 on waste transfers between ACs.
The following Directives/provisions have been transposed by a series of legislation:
Directives 2011/65/UE and 2012/12/EC on waste electrical and electronic equipment (WEEE):10 Royal Decree 219/2013 of March 22nd and 110/2015 of February 20th.
Directive 94/62/EC on packaging and packaging waste:11 Law 11/1997 of April 24th, Royal Decree 782/1998 of April 30th, Order of April 27th 1998, Order of October 21st 1999, Order of June 12th 2001, Order of MAM/3624/2006 of November 17th, Royal Decree 252/2006 of March 3rd, and Order AAA/1783/2013 of October 1st.
Ban on landfilling tyres as outlined in the Landfill Directive: Royal Decree 1619/2005 of December 13th.
Directive on waste batteries and accumulators:12 Royal Decree 106/2008 of February 1st and its subsequent modifications (Royal Decree 943/2010 of July 23rd
and Royal Decree 710/2015 of July 24th)
Directive 2000/53/EC on end-of-life vehicles:13 Royal Decree 1383/2002 of December 20th, Order INT/624/2008 of February 26th, Order PRE/26/2014 of January 16th.
Most of the responsibilities regarding waste management have been transferred to the ACs. Most of them have also implemented regional legislation on waste management as outlined in Figure 1.2.
9 Council Directive 1999/31/EC of 26 April 1999 on the landfill of waste (OJ L 182/1 of 16.7.1999)
10 Directive 2002/96/EC of the European Parliament and of the Council of 27th January 2003 on Waste
Electrical and Electronic Equipment (WEEE) (OJ L 37/24 of 13.2.2003) 11
European Parliament and Council Directive 94/62/EC of 20 December 1994 on packaging and packaging waste (OJ No L 365/10 of 31.12.94) 12
Directive 2006/66/EC of the European Parliament and of the Council of 6 September 2006 on batteries and accumulators and waste batteries and accumulators and repealing Directive 91/157/EEC (OJ L 266 of 26.9.2006) 13
Directive 2000/53/EC of the European Parliament and of the Council of 18 September 2000 on End-of Life Vehicles (OJ L 269 of 21.10.2000, p. 34)
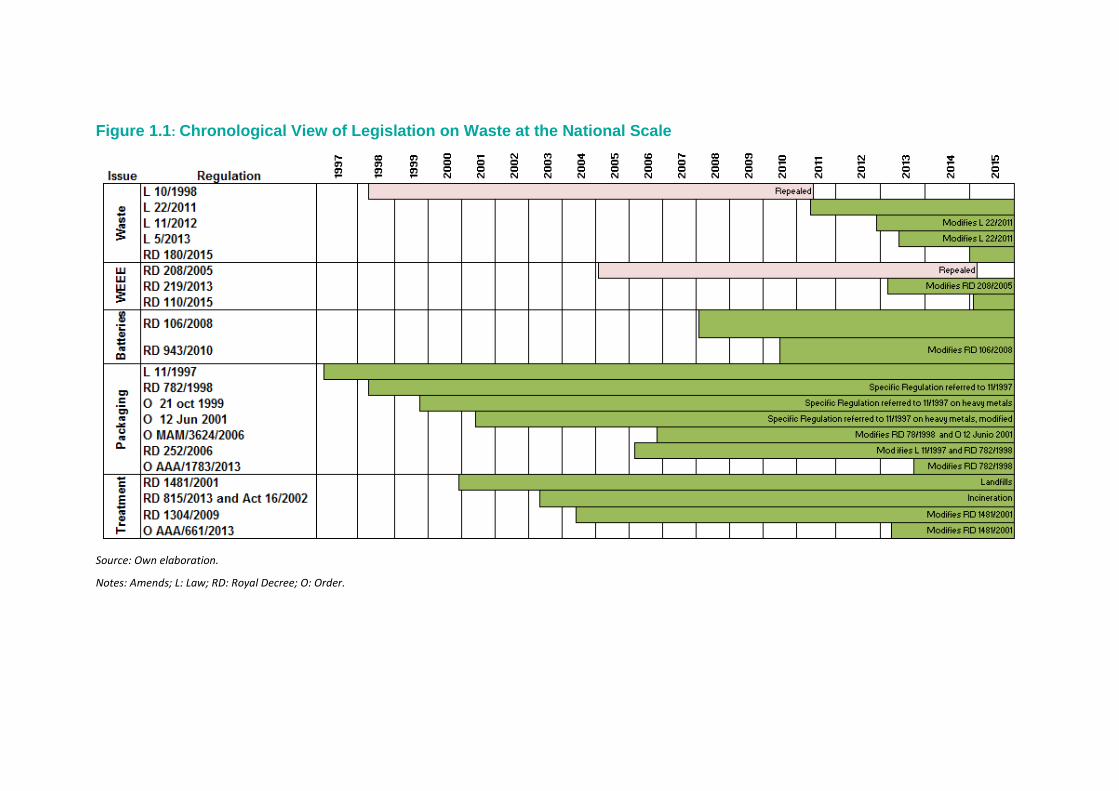
Figure 1.1: Chronological View of Legislation on Waste at the National Scale
Source: Own elaboration.
Notes: Amends; L: Law; RD: Royal Decree; O: Order.
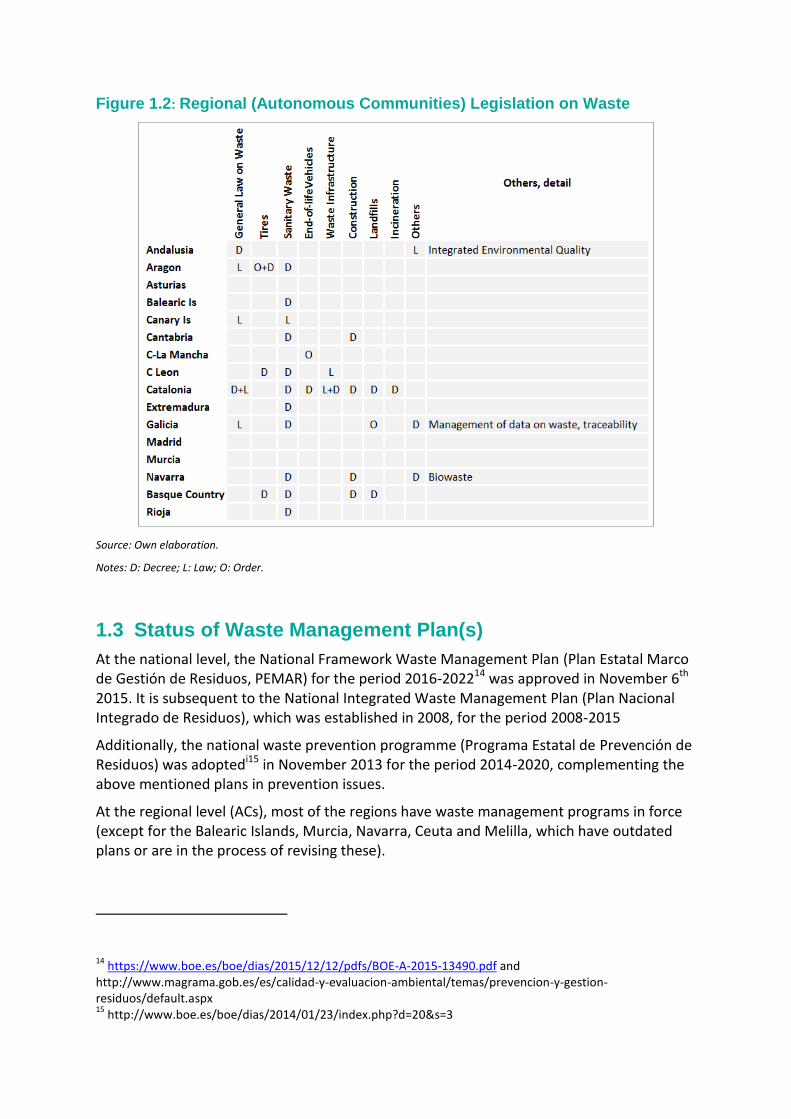
Figure 1.2: Regional (Autonomous Communities) Legislation on Waste
Source: Own elaboration.
Notes: D: Decree; L: Law; O: Order.
1.3 Status of Waste Management Plan(s)
At the national level, the National Framework Waste Management Plan (Plan Estatal Marco de Gestión de Residuos, PEMAR) for the period 2016-202214 was approved in November 6th 2015. It is subsequent to the National Integrated Waste Management Plan (Plan Nacional Integrado de Residuos), which was established in 2008, for the period 2008-2015
Additionally, the national waste prevention programme (Programa Estatal de Prevención de Residuos) was adoptedi15 in November 2013 for the period 2014-2020, complementing the above mentioned plans in prevention issues.
At the regional level (ACs), most of the regions have waste management programs in force (except for the Balearic Islands, Murcia, Navarra, Ceuta and Melilla, which have outdated plans or are in the process of revising these).
14
https://www.boe.es/boe/dias/2015/12/12/pdfs/BOE-A-2015-13490.pdf and http://www.magrama.gob.es/es/calidad-y-evaluacion-ambiental/temas/prevencion-y-gestion-residuos/default.aspx 15
http://www.boe.es/boe/dias/2014/01/23/index.php?d=20&s=3
Waste prevention programmes have been adopted only in some ACs (i.e. Andalusia, Aragon, Asturias, Cantabria, Castile La Mancha, Castile Leon, Catalonia, the Basque Country and Valencia). The other ACs are in the process of implementing their own plans (i.e. Balearic Islands, Madrid, Murcia, Navarra, Ceuta and Melilla).
1.4 Summary of the Key Objectives of the Plans
1.4.1 Waste Management Plan(s)
The goals included in the PEMAR for 2016-2022 for municipal waste are outlined below:
Accomplishing with the Waste Frameworks Directive in terms of their quantitative targets, which implies 50% of preparation for recycling and reuse in 2020, of which 2% will correspond to the preparation for reuse of WEEE, bulky waste and textiles, among others;
Implementing the waste hierarchy so that 10.7 Mt of waste are recycled in 2020;
Energy recovery may reach 15% of municipal waste generated. Inputs to incineration and co-incineration will be limited to rejects from treatment plants and non-recyclable materials;
Measures to boost biowaste separate collection with a view to the composting and anaerobic digestion to promote the use of environmentally safe compost in agriculture, gardening and degraded areas;
Application of self-sufficiency and proximity principle: an integrated network of waste disposal installations and of installations for the recovery of mixed municipal waste must be established, including where such collection also covers similar waste streams from other producers, taking into account best available techniques. This network shall enable waste disposal or recovery of waste previously mentioned in one of the nearest appropriate installations, by means of the most appropriate technologies and methods to ensure a high level of environmental protection and public health;
Accomplishing with the Landfill Directive in 2016;
Eradicate the landfilling of untreated waste;
By 2020, total landfill of waste must be reduced to 35% of total waste generated.
The plan refers to household and commercial waste (including bio-waste), packaging waste, WEEEs, used tyres, end-of-life vehicles, waste batteries and accumulators, construction and demolition waste, oil waste, sewage sludge, PCB & PCT, contaminated soils, non-hazardous industrial and agricultural waste, sanitary waste and end-of-life ship. Specific targets for waste streams are set according to EU Directives; For this report, only the first category has been considered.
The PEMAR has been developed at the same time as this report was being written, so not only the main requirements of the Waste Framework Directive and other Directives have been included, but also recommendations from the European Commission have been explicitly considered. In general, the plan establishes qualitative and quantitative objectives for every waste stream and orientations to achieve them. However, several aspects remain undisclosed:
1) The accounting of the shipments between Autonomous Communities is still a pending issue.
2) Waste treatment, disposal and recovery installations are detailed for every waste category, including the capacity for treatment of future waste streams except for mechanical biological treatment plans due to the underreporting of several Autonomous Communities.
3) According to the data included in page 29, in accounting terms the overall sorting efficiency of MBT plants in 2012 was of 26%. Efficiency from a mass balance point of view is assumed to be constant until 2020. In coherence to promote high quality compost from source separate of biowaste, and taking into account the low quality of bioestabilized materials at MBTs, the PEMAR sets a 40% reduction in the use of biostabilised materials through R10 operations. Therefore the overall contribution of MBTs to the overall recycling rate will decrease by 2020. Consequently, their role in the fulfilment of the targets will be ultimately limited.
4) Although waste collection schemes are properly described, the identification of differences in their effectiveness and costs is not provided;
5) There is no specific identification of the most and less efficient waste treatment facilities, particularly mechanical biological treatment plants;
At regional level, ten of the nineteen regional plans have been approved after the WFD and cover in general the contents set out in Article 28.3 of the Directive. Regarding the regions that generate the largest amounts of waste (Andalusia, Catalonia, Madrid and Valencia), the only plan approved before the WFD is the Madrid Plan, approved in 2007 and currently under revision process.
The PEMAR fully addresses all the provisions of Article 28.3 of the Waste Framework Directive and specifies what the regional plans should consider in accordance with this Article. It also refers to some other mandatory content for the regions, outlined below (PEMAR, pages 14-15):
The type, quantity and source of waste generated within their territory, which is expected to be shipped to other Member States, and where possible to and from other regions;
An assessment of the future evolution of waste streams;
Existing waste collection schemes and major disposal and recovery installations, including any special arrangements for waste oils, hazardous waste or waste streams addressed by specific legislation;
Information on the location criteria for site identification and on the capacity of future disposal of major recovery installations
An assessment of the need for: new collection schemes, closure of existing waste installations, additional waste treatment facilities and related investments;
Waste management policies, including planned waste management technologies and methods and identification of waste that pose specific management problems.
Moreover, PEMAR suggest additional contents in coherence with law 22/2011:
Organisational aspects related to waste management, including a description of the allocation of responsibilities between the public and private operators that deal with the management of residues;
Awareness and information campaigns targeting the general public or a particular group of consumers; and
Identification of historically contaminated waste disposal sites and measures for their rehabilitation.
According to PEMAR, in order to ensure the fulfilment of the national targets, the Autonomous Communities should meet at least, the same targets as those proposed at national level (PEMAR, page 15). When targets refer to municipal waste, local authorities should make their best to fulfil the targets. In any case, the Regional Waste Management Plans may establish the contribution of local authorities to these targets either independently or associated. Taking into account the recommendations of the EC, following the approval of the PEMAR, the Autonomous Communities should review their Regional Waste Management Plans to adapt their structure, targets, period of validity and frequency of revision to PEMAR, specifying the approach to biowaste management, in order to fulfil the targets.
1.4.2 Waste Prevention Plans
The National Waste Prevention Programme of Spain (Programa Estatal de Prevención de Residuos, hereafter referred to as PEPR)16 was adopted by the Council of Ministers on 13th December 2013. The main objective of the programme is to reduce by 10% the amount of waste (in tonnes) produced in 2010 by 2020, and to contribute to reducing marine litter from terrestrial sources. The programme covers the 2014-2020 period and applies to the whole of Spain. It has four strategic points and eight priority areas through which specific measures are organised. These are:
1) Strategic Points: a. Reduce the quantity of waste, with a special focus on food waste,
construction and demolition waste, packaging waste and disposable products;
b. Reuse products and extend products’ life cycle, with a special focus on furniture, textiles, toys and books, electronic devices, packaging and tyres;
c. Reduce the hazardous properties of waste, in particular for the following categories: chemicals industry, batteries and accumulators, vehicles and electronic devices; and
16
http://www.boe.es/boe/dias/2014/01/23/pdfs/BOE-A-2014-679.pdf http://www.magrama.gob.es/es/calidad-y-evaluacion-ambiental/planes-y-estrategias/Planes-y-Programas.aspx
d. Reduce the environmental impacts of waste, as well as its impacts on human health, in particular for: electric and electronic devices, vehicles and packaging.
2) Priority Waste Areas: a. Food waste; b. Construction and demolition waste; c. Packaging; d. Disposable products; e. Chemicals industry; f. Vehicles, tyres and batteries; g. Electronic and electrical devices; and h. Furniture, toys, books and textiles.
The programme also outlines several measures for the reduction of bio-waste, involving national, regional and local administrations as well as economic agents and consumers. The proposed measures include regional and local initiatives to reduce food waste, support the prevention of waste generation, modify the productive processes and promote food banks and responsible consumption.
1.5 Progress towards the Fulfilment of Targets
1.5.1 Landfill Directive Targets
The Landfill Directive sets out specific targets regarding biodegradable municipal waste and how it should be disposed of in landfills. Specifically, by 2006, biodegradable municipal waste going to landfill must have been reduced to 65% of the total amount of biodegradable municipal waste (BMW) generated in 1995. This share is required to be further reduced to 50% and 35% by 2009 and 2016, respectively.
The PEMAR explicitly acknowledges these targets (page 38), and by 2020 it limits the landfill of waste to 35% of total waste generated, restricted to rejects from treatment and incineration plants.
The baseline to be used for calculation purposes is 11,934,142 tonnes of biodegradable municipal waste going to landfill in 1995; therefore the target for 2016 implies that no more than 4,176,950 tonnes of BMW should be landfilled. Both the 2006 and 2009 targets were met, although in 2010 the amount of BMW disposed of in landfills grew to 6,200,000 tonnes, exceeding the 2009 target by 0.2 million tonnes. By 2012 this amount had fallen to 5,600,000 tonnes.
On average, since 1995, the disposal of BMW to landfills has decreased by ~315,000 tonnes per year. In order to meet the 2016 target, an annual reduction of ~400,000 tonnes is needed on between 2012 and 2016 (Figure 1.3).

Figure 1.3: Biodegradable Municipal Waste Landfilled in Spain, 2006-2012
Source: MAGRAMA
Figure 1.3 shows the amount of BMW sent to landfill by ACs in the period 2010-2012, and how this relates to the targets set out in the Landfill Directive. Seven out of 17 ACs had not met the 2009 target in the year 2010, whilst four ACs had already met the 2016 target and three of them were very close to doing so. The most populated regions (Andalusia, Madrid, Valencia and Catalonia) account for approximately 60% of Spain's population and they contributed to 60% of the total landfilled BMW in 2012. Whereas some regions (Balearic Islands, Castile-La Mancha and Castile-Leon, La Rioja) already meet the 2016 target, Andalusia, Madrid and Valencia missed the 2009 target. In Aragon, the amount of BMW landfilled in 2012 was higher than in 1995.
According to the MAGRAMA, each AC is responsible for the calculation of BMW sent to landfill. The methodological details could not be found either in the regional plans or the PEMAR.
7.77
6.55 6.55
5.64
6.20 6.18
5.63
1
2
3
4
5
6
7
8
9
20
06
20
07
20
08
20
09
20
10
20
11
20
12
Mt
Biowastelandfilled
target 2016
target 2009
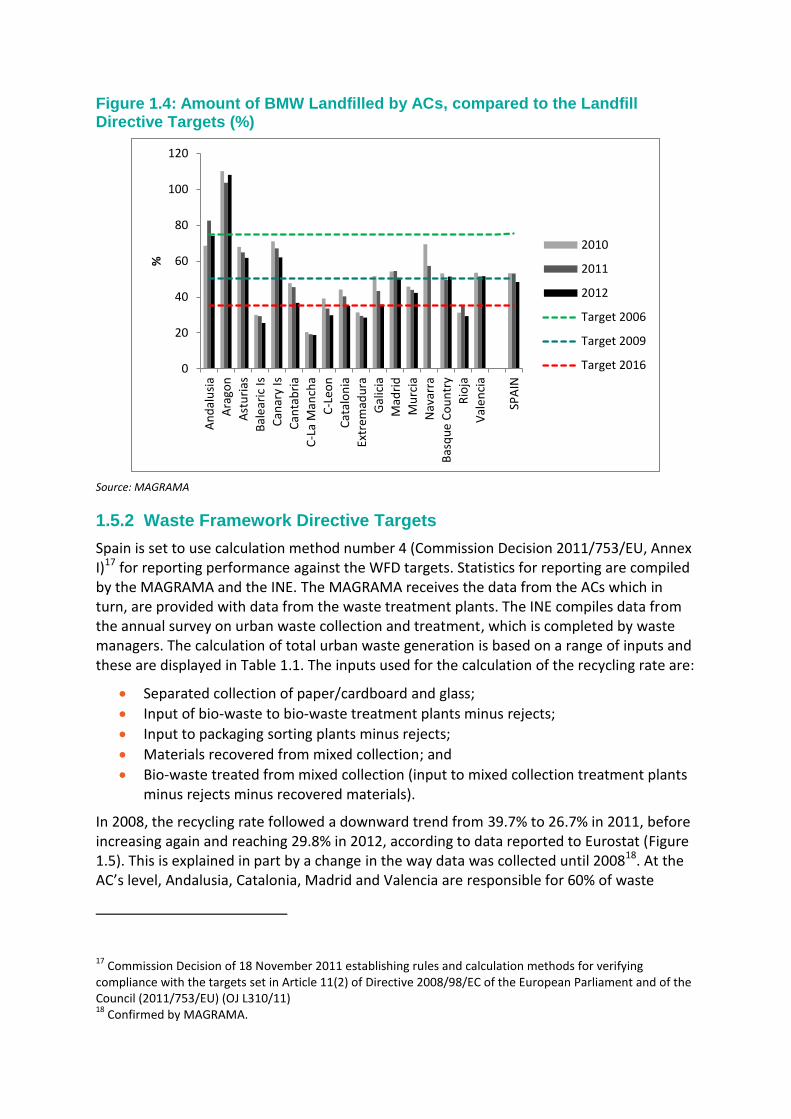
Figure 1.4: Amount of BMW Landfilled by ACs, compared to the Landfill Directive Targets (%)
Source: MAGRAMA
1.5.2 Waste Framework Directive Targets
Spain is set to use calculation method number 4 (Commission Decision 2011/753/EU, Annex I)17 for reporting performance against the WFD targets. Statistics for reporting are compiled by the MAGRAMA and the INE. The MAGRAMA receives the data from the ACs which in turn, are provided with data from the waste treatment plants. The INE compiles data from the annual survey on urban waste collection and treatment, which is completed by waste managers. The calculation of total urban waste generation is based on a range of inputs and these are displayed in Table 1.1. The inputs used for the calculation of the recycling rate are:
Separated collection of paper/cardboard and glass;
Input of bio-waste to bio-waste treatment plants minus rejects;
Input to packaging sorting plants minus rejects;
Materials recovered from mixed collection; and
Bio-waste treated from mixed collection (input to mixed collection treatment plants minus rejects minus recovered materials).
In 2008, the recycling rate followed a downward trend from 39.7% to 26.7% in 2011, before increasing again and reaching 29.8% in 2012, according to data reported to Eurostat (Figure 1.5). This is explained in part by a change in the way data was collected until 200818. At the AC’s level, Andalusia, Catalonia, Madrid and Valencia are responsible for 60% of waste
17
Commission Decision of 18 November 2011 establishing rules and calculation methods for verifying compliance with the targets set in Article 11(2) of Directive 2008/98/EC of the European Parliament and of the Council (2011/753/EU) (OJ L310/11) 18
Confirmed by MAGRAMA.
0
20
40
60
80
100
120
An
dal
usi
a
Ara
gon
Ast
uri
as
Bal
ear
ic Is
Can
ary
Is
Can
tab
ria
C-L
a M
anch
a
C-L
eon
Cat
alo
nia
Extr
emad
ura
Gal
icia
Mad
rid
Mu
rcia
Nav
arra
Bas
qu
e C
ou
ntr
y
Rio
ja
Val
en
cia
SPA
IN
%
2010
2011
2012
Target 2006
Target 2009
Target 2016
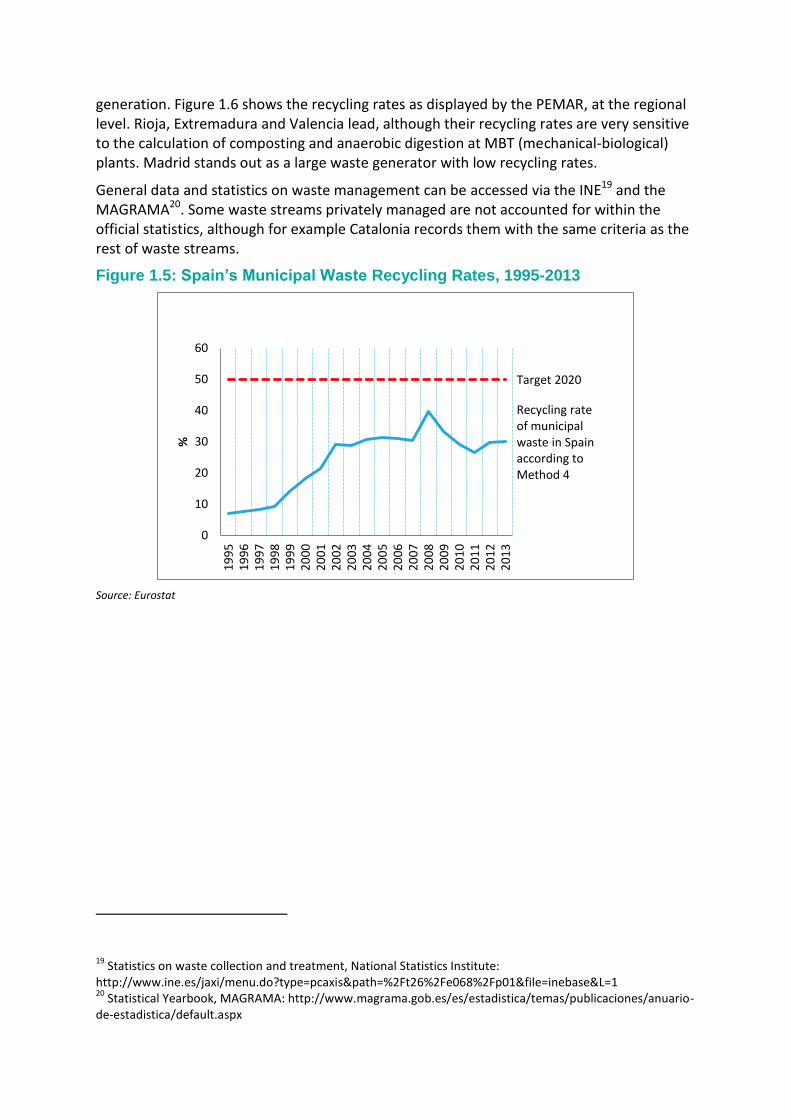
generation. Figure 1.6 shows the recycling rates as displayed by the PEMAR, at the regional level. Rioja, Extremadura and Valencia lead, although their recycling rates are very sensitive to the calculation of composting and anaerobic digestion at MBT (mechanical-biological) plants. Madrid stands out as a large waste generator with low recycling rates.
General data and statistics on waste management can be accessed via the INE19 and the MAGRAMA20. Some waste streams privately managed are not accounted for within the official statistics, although for example Catalonia records them with the same criteria as the rest of waste streams.
Figure 1.5: Spain’s Municipal Waste Recycling Rates, 1995-2013
Source: Eurostat
19
Statistics on waste collection and treatment, National Statistics Institute: http://www.ine.es/jaxi/menu.do?type=pcaxis&path=%2Ft26%2Fe068%2Fp01&file=inebase&L=1 20
Statistical Yearbook, MAGRAMA: http://www.magrama.gob.es/es/estadistica/temas/publicaciones/anuario-de-estadistica/default.aspx
Recycling rate of municipal waste in Spain according to Method 4
Target 2020
0
10
20
30
40
50
60
19
95
19
96
19
97
19
98
19
99
20
00
20
01
20
02
20
03
20
04
20
05
20
06
20
07
20
08
20
09
20
10
20
11
20
12
20
13
%
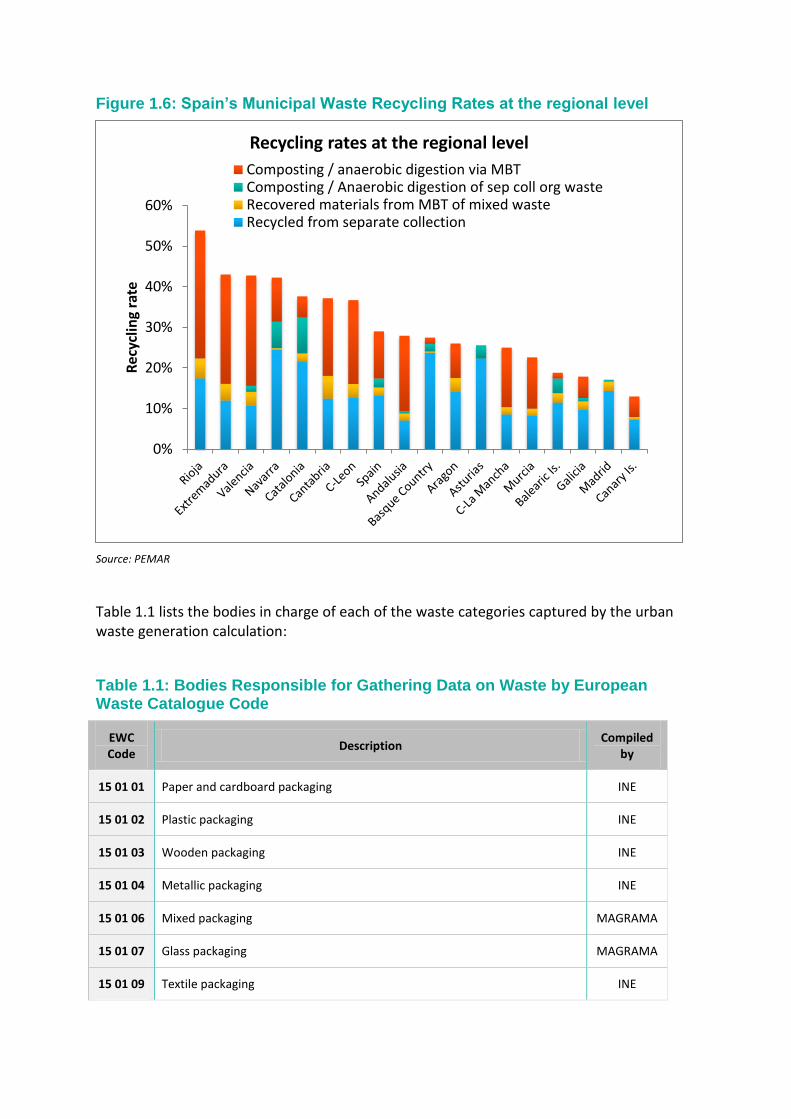
Figure 1.6: Spain’s Municipal Waste Recycling Rates at the regional level
Source: PEMAR
Table 1.1 lists the bodies in charge of each of the waste categories captured by the urban waste generation calculation:
Table 1.1: Bodies Responsible for Gathering Data on Waste by European Waste Catalogue Code
EWC Code
Description Compiled
by
15 01 01 Paper and cardboard packaging INE
15 01 02 Plastic packaging INE
15 01 03 Wooden packaging INE
15 01 04 Metallic packaging INE
15 01 06 Mixed packaging MAGRAMA
15 01 07 Glass packaging MAGRAMA
15 01 09 Textile packaging INE
0%
10%
20%
30%
40%
50%
60%
Rec
ycli
ng
rate
Recycling rates at the regional level
Composting / anaerobic digestion via MBTComposting / Anaerobic digestion of sep coll org wasteRecovered materials from MBT of mixed wasteRecycled from separate collection
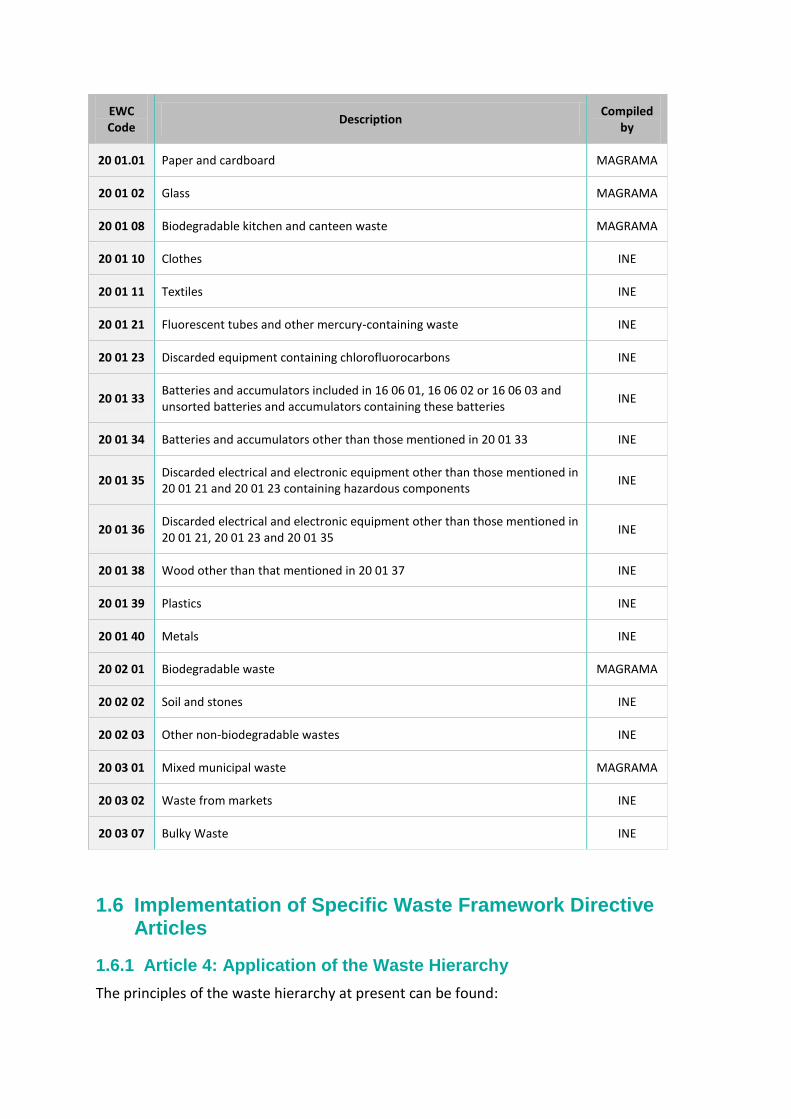
EWC Code
Description Compiled
by
20 01.01 Paper and cardboard MAGRAMA
20 01 02 Glass MAGRAMA
20 01 08 Biodegradable kitchen and canteen waste MAGRAMA
20 01 10 Clothes INE
20 01 11 Textiles INE
20 01 21 Fluorescent tubes and other mercury-containing waste INE
20 01 23 Discarded equipment containing chlorofluorocarbons INE
20 01 33 Batteries and accumulators included in 16 06 01, 16 06 02 or 16 06 03 and unsorted batteries and accumulators containing these batteries
INE
20 01 34 Batteries and accumulators other than those mentioned in 20 01 33 INE
20 01 35 Discarded electrical and electronic equipment other than those mentioned in 20 01 21 and 20 01 23 containing hazardous components
INE
20 01 36 Discarded electrical and electronic equipment other than those mentioned in 20 01 21, 20 01 23 and 20 01 35
INE
20 01 38 Wood other than that mentioned in 20 01 37 INE
20 01 39 Plastics INE
20 01 40 Metals INE
20 02 01 Biodegradable waste MAGRAMA
20 02 02 Soil and stones INE
20 02 03 Other non-biodegradable wastes INE
20 03 01 Mixed municipal waste MAGRAMA
20 03 02 Waste from markets INE
20 03 07 Bulky Waste INE
1.6 Implementation of Specific Waste Framework Directive Articles
1.6.1 Article 4: Application of the Waste Hierarchy
The principles of the waste hierarchy at present can be found:
1) In Act22/2011 through which the WFD is transposed; a. Specifically within Article 8, Paragraph 1 which states:
In developing the policies and legislation concerning waste prevention and waste management, the competent authorities shall implement the waste hierarchy in the following order of priority, in order to achieve the best overall environmental outcome: prevention; preparation for re-use; recycling; other recovery, e.g. energy recovery; and disposal.
2) The PEMAR a. Outlines how the principle of waste hierarchy is applied to the waste
prevention and management policies in Spain, defining qualitative and quantitative objectives and measures for the achievement thereof for the various waste streams;
3) Within the regional waste management plans a. The ACs which have regional waste management plans in place or which
have plans that are currently being revised21 or finalised22 have incorporated the principle of waste hierarchy; and
4) In most of the new regional legislation on waste: a. Waste Regulation of Andalusia (Decree 73/2012 of March 22nd): Article 50
on waste management hierarchy. b. Decree 2/2006 of January 16th of Aragon approving the Regulation on the
production, possession and management of non-hazardous industrial waste and on the legal regime of the public service for disposal of non-hazardous industrial waste not suitable for recovery (Article 9); Decree 236/2005, approving the Regulation on the production, possession and management of hazardous waste and on the legal regime of the public service for disposal of hazardous waste (Articles 2 and 5); Decree 262/2006 approving the Regulation on the production, possession and management of non-hazardous waste from construction and demolition, and on the legal regime of the public service for disposal and recovery of debris that does not come from minor construction work or domestic repairs (Article 9); and Decree 40/2006 of February 7th of Aragon which regulates used tyres.
c. Decree 1/2009 of July 21st (General Law on wastes); Decree 89/2010 of June 29th (on construction wastes); Decree 16/2010 (on waste management infrastructure); and Decree 87/2010 of June 29th of Catalonia (on municipal waste management).
d. Law 1/1999 of January 29th on waste in the Canary Islands (Article 2). e. Decree 104/2006 of October 19th on waste slag of Cantabria, to
encourage the recovery of slag and prevent the dumping thereof; and Decree 72/2010 of October 28th regulating construction and demolition
21
Navarra. 22
Murcia.
waste production and management, to encourage the recovery of construction and demolition waste and prevent the dumping thereof.
f. Law 5/2010 of June 23rd on prevention and environmental quality of Extremadura.
g. Law 10/2008 of November 3rd of Galicia, and h. Law 5/2003 of March 20th on waste of Madrid.
On a national level, waste generation decreased by 10% since the onset of the economic crisis in 2008. The recycling rate decreased (Figure 1.5) whereas the landfill rate (60% in 2012) decreased only very gradually at the national scale since then, which can be explained in part by an improvement in the way data was collected and a change of calculation method. In 2012, 8% of waste generated was incinerated.
These trends have been acknowledged in the PEMAR, which sets specific recommendations and quantitative targets devoted to increasing the rates of separate collection. It also recommends developing economic instruments such as developing municipal charges on waste according to the quantity and type of waste collected. Furthermore the PEMAR is recommending the implementation of landfill and incineration taxes to incentive reuse and recycling. At the moment, Castile Leon, Catalonia and Extremadura have approved landfill taxes for municipal waste and only Catalonia has implemented an incineration tax. The MAGRAMA reports a landfill cost of €30-40 per tonne in Spain, which might be considered low as compared to other Member States.23 Evidence from other Member states suggests that an introduction of (harmonised) landfill taxes in all AC’s and a significant increase would be needed to provide sufficient incentives to divert waste from landfills.
PEMAR includes the following targets for 2020 in regards to the waste hierarchy:
A decrease of 10% in municipal waste generation by means of waste prevention, taking 2010 as the baseline; this means decreasing municipal waste generation from 22.7 Mt in 2010 to 21.4 Mt in 2020, of which 10.7 Mt will be recycled;
Energy recovery estimated to be 15% of municipal waste generation (3.4 Mt) and restricted to rejects streams from treatment plants;
In addition to the targets set by the Landfill Directive on BMW, the aim is to landfill a maximum of 35% of municipal waste and only after it has been treated; and
Increase separate collection from 2.7 Mt in 2012 to 8.7 Mt in 2020.
In 2012, on average, 26.7% of total waste generation was landfilled without any treatment although several ACs are well above this figure: the Canary Islands (77%), Asturias (74%) and the Basque Country, Navarra, Aragon, and Madrid (all over 40%).
1.6.2 Article 10: Recovery
The Waste Framework Directive defines recovery as “any operation the principal result of which is waste serving a useful purpose by replacing other materials which would otherwise have been used to fulfil a particular function, or waste being prepared to fulfil that function,
23
ETC/SCP. 2012: http://scp.eionet.europa.eu/publications/WP2012_1/wp/WP2012_1
in the plant or in the wider economy”(Article 3.15). In practice it includes recycling, reuse and incineration.
The recovery targets for 2020 as stated in the PEMAR are to increase preparation for reuse and recycling to 50% of total waste generation, with energy recovery accounting for 15% of overall waste (3.4 Mt) and confined to the refuse fraction from treatment plants. Thus, recovery as a whole should reach 65% of total municipal waste generated by 2020. In 2012 the amount of waste recycled, reused and incinerated out of the total generated was 39%.
1.6.3 Article 11: Reuse and Recycling
The PEMAR targets an increase in the net recycling from separate collection of biowaste, paper, glass, plastic and metals. The aim is to recycle 2.3 of biowaste, 2.3 Mt of paper/cardboard, 1.3 Mt of glass, 1 Mt of plastic and 0.3 Mt of metals from separately collected materials by 2020. The measures proposed to achieve these targets are:
1) Increase separate collection: a. Implementing separate collection of bio-waste; b. Fostering home composting in rural areas; c. Increasing treatment capacity for bio-waste, mostly for composting
facilities; d. Regulating the end-of-waste criteria for high quality compost and
digestate; e. Focusing on the main generators of paper/cardboard such as offices,
universities, etc.; f. Intensifying efforts to foster the separation of glass in households; g. Setting specific efforts for better separation of plastic in households and
other sources which generate large amounts of waste; h. Setting specific efforts for better separation of metals in households and
other sources which generate large amounts of waste; i. Setting specific efforts for better separation of beverage cartons in
households and other sources which generate large amounts of waste; j. Implementing separate collection of wood, focused on sources which
generate large amounts of waste and recycling centres; k. Developing agreements with organisations for better collection of
textiles; and l. Increasing the network of recycling centres for the collection of batteries,
furniture, domestic oils, sanitary and waste from electric and electronic equipment (WEEE).
2) Ensure an appropriate treatment of non-separated waste by prioritising: a. The recovery of glass, metals and plastic from non-separated collection; b. The development a clear regulatory framework for the recovery of
biostabilised materials; and c. The energetic recovery of the refuse fraction.
3) Development and implementation of economic instruments such as: a. Municipal charges; and b. Landfill and incineration taxes.
4) Information: a. Making data from collection and treatment plants available;
b. Making data on collection and treatment of municipal waste and derived costs available;
c. Using this data to evaluate the efficiency of waste management systems in order to introduce changes, if necessary;
d. Adequately recording the budget allocated for waste collection and treatment at the local level;
e. Periodically characterising waste, particularly waste to landfill; f. Compiling data on non-hazardous commercial and industrial waste
collected and managed privately; and g. Developing an information system, which improves the collection of data
directly from collection and treatment plants, in order to be able to publish more accurate statistics on these
5) Education and training: a. Training for municipalities regarding collection and treatment models,
targets, costs and operative settings; b. Dissemination of new models for collection in order to communicate to
citizens their role regarding domestic separation; c. Dissemination of good practices for waste collection and management at
the local level; and d. Making information on waste management costs available to the public.
6) Investments must be devoted to: a. Complementing the existent collection systems and new
implementations; b. New infrastructure for reuse and recycling; c. Adaptation, modernisation and improvement of current infrastructure; d. Improving tools for capturing data on waste and traceability; e. Environmental education to promote separation in public bodies and
enterprises; and Campaigns regarding the implementation of new collection and management models.
7) Strengthening of markets for recovered and recycled materials.
Table 1.2 illustrates the separate collection models currently used in Spain for urban waste, as reported in Spain’s reply to the Implementation Questionnaire on the WFD for 2010-2012. Separate collection accounted for 15% of overall waste collection in 2012. According to Ecoembes (the integrated waste management system for packaging), currently 99.8% of the population have access to separate collection for paper/cardboard and packaging waste, through more than 100 agreements with local authorities.24 Similarly, Ecovidrio (the integrated waste management system for glass) reports that they supply separate collection for glass waste to 7,976 municipalities, which comprise 98.3% of the population.25
24
Ecoembes. 2015: https://www.ecoembes.com/es/administraciones/recogida-selectiva 25
Ecovidrio. 2013: http://www.ecovidrio.es/files/Publications/00000022.pdf
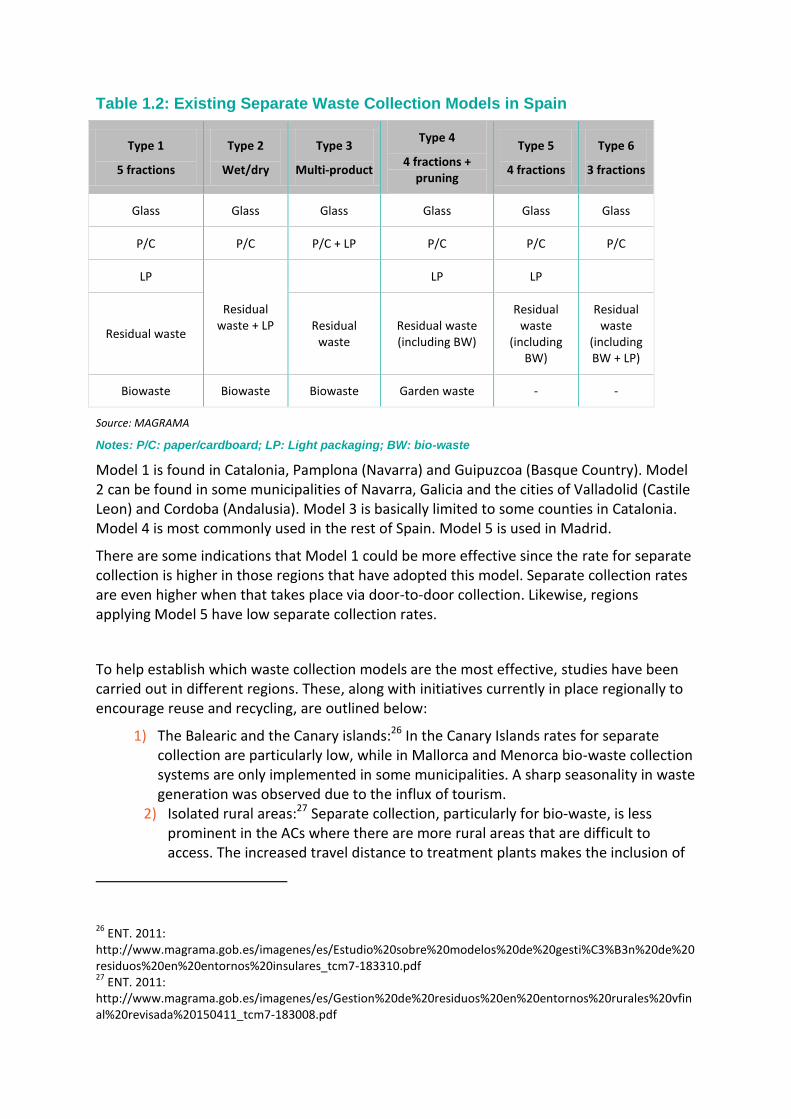
Table 1.2: Existing Separate Waste Collection Models in Spain
Type 1
5 fractions
Type 2
Wet/dry
Type 3
Multi-product
Type 4
4 fractions + pruning
Type 5
4 fractions
Type 6
3 fractions
Glass Glass Glass Glass Glass Glass
P/C P/C P/C + LP P/C P/C P/C
LP
Residual waste + LP
LP LP
Residual waste Residual
waste Residual waste (including BW)
Residual waste
(including BW)
Residual waste
(including BW + LP)
Biowaste Biowaste Biowaste Garden waste - -
Source: MAGRAMA
Notes: P/C: paper/cardboard; LP: Light packaging; BW: bio-waste
Model 1 is found in Catalonia, Pamplona (Navarra) and Guipuzcoa (Basque Country). Model 2 can be found in some municipalities of Navarra, Galicia and the cities of Valladolid (Castile Leon) and Cordoba (Andalusia). Model 3 is basically limited to some counties in Catalonia. Model 4 is most commonly used in the rest of Spain. Model 5 is used in Madrid.
There are some indications that Model 1 could be more effective since the rate for separate collection is higher in those regions that have adopted this model. Separate collection rates are even higher when that takes place via door-to-door collection. Likewise, regions applying Model 5 have low separate collection rates.
To help establish which waste collection models are the most effective, studies have been carried out in different regions. These, along with initiatives currently in place regionally to encourage reuse and recycling, are outlined below:
1) The Balearic and the Canary islands:26 In the Canary Islands rates for separate collection are particularly low, while in Mallorca and Menorca bio-waste collection systems are only implemented in some municipalities. A sharp seasonality in waste generation was observed due to the influx of tourism.
2) Isolated rural areas:27 Separate collection, particularly for bio-waste, is less prominent in the ACs where there are more rural areas that are difficult to access. The increased travel distance to treatment plants makes the inclusion of
26
ENT. 2011: http://www.magrama.gob.es/imagenes/es/Estudio%20sobre%20modelos%20de%20gesti%C3%B3n%20de%20residuos%20en%20entornos%20insulares_tcm7-183310.pdf 27
ENT. 2011: http://www.magrama.gob.es/imagenes/es/Gestion%20de%20residuos%20en%20entornos%20rurales%20vfinal%20revisada%20150411_tcm7-183008.pdf

these rural areas within the integrated management systems problematic, impacting on recycling and recovery rates.
3) Separate collection of bio-waste:28 General guidelines have been published regarding the implementation of separate collection of bio-waste. 4) The Catalan Association of Municipalities for Door-to-Door Selective Waste
Collection has carried out a study on the costs of this system as compared to regular collection.29
5) The MAGRAMA has made available the simulation software SIMUR30 to facilitate decision-making related to waste collection models.
6) Producer responsibility schemes for urban waste are currently in place for: a. Domestic Packaging (other materials than glass): managed by Ecoembes; b. Glass domestic packaging: managed by Ecovidrio; c. Domestic medicines packaging: managed by SIGRE d. WEEE: managed by Ambilamp, Ecoasimelec, Ecofimática, Ecolec, Ecolum,
Eco-Raee’s, Ecotic, Erp, Reinicia, Fundación Canaria para el Reciclaje y el Desarrollo, Sunreuse;
e. Batteries: managed by Ecopilas, ERP, EcoRaee’s and Ecolec.
1.6.4 Article 14: Costs of Waste Management
According to Puig Ventosa and Sastre (2016), more than a half of the Spanish municipalities report to have incomes from municipal waste charges, although these are generally not directly linked to waste generation (e.g. per flat charges, per square meter charges, as a ratio of water consumption, etc.). This share is higher for large municipalities and capital cities (more than 75%). An average household (i.e. a two people household) in Spain is estimated to pay around €85 per year, although great differences are found. Data on costs and cost coverage is not reliable as to report an estimate..
vaPay as You Throw (PAYT) is scarcely implemented by the Spanish municipalities. Only seven out of more than 8,000 municipalities had implemented PAYT schemes by the beginning of 2015 (Table 1.). The PEMAR describes PAYT as one of the key economic instruments to improve separate collection. Catalonia’s regional waste management plan
28
MAGRAMA. 2013: http://www.magrama.gob.es/es/calidad-y-evaluacion-ambiental/publicaciones/Guia-para-implantacion-recogida-separada-gestion-biorresiduos-competencia-municipal.aspx 29
Catalan Association of Municipalities for Door-to-Door Selective Waste Collection. 2014: http://portaaporta.cat/documents/arxiu_portaaporta_173.pdf 30
MAGRAMA. 2015: http://www.magrama.gob.es/es/calidad-y-evaluacion-ambiental/temas/prevencion-y-gestion-residuos/actuaciones/Aplicacion-programa-SIMUR.aspx
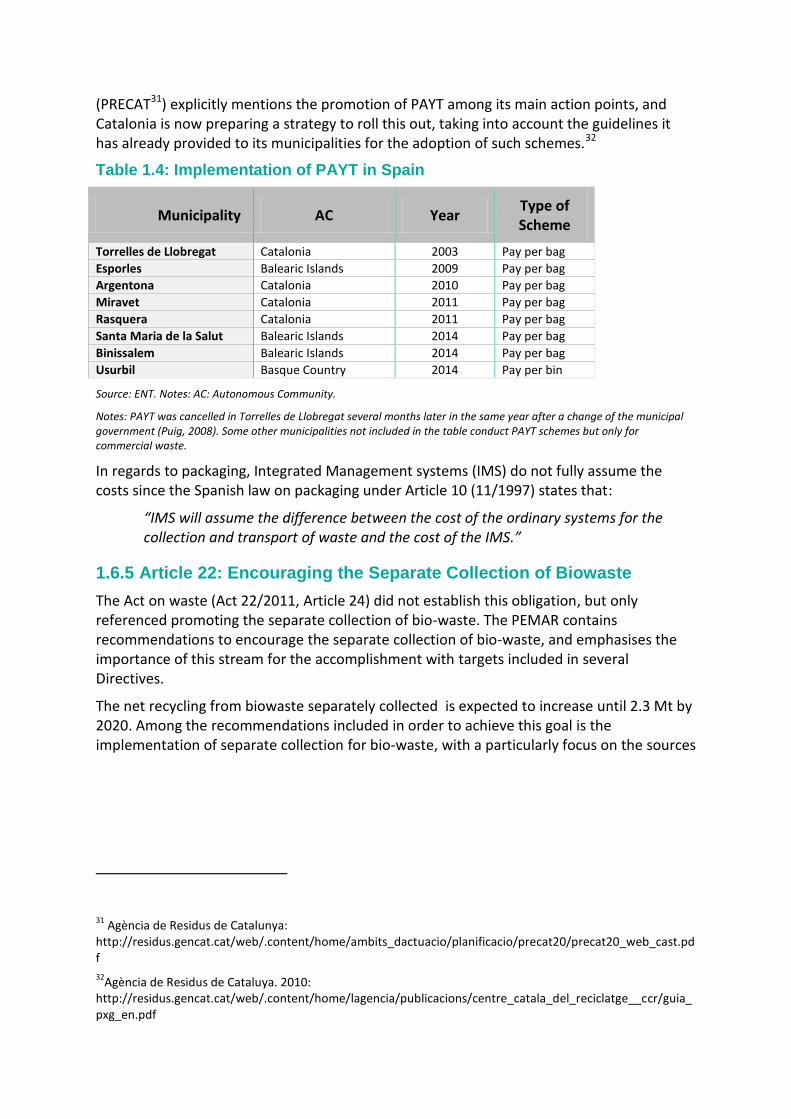
(PRECAT31) explicitly mentions the promotion of PAYT among its main action points, and Catalonia is now preparing a strategy to roll this out, taking into account the guidelines it has already provided to its municipalities for the adoption of such schemes.32
Table 1.4: Implementation of PAYT in Spain
Municipality AC Year Type of Scheme
Torrelles de Llobregat Catalonia 2003 Pay per bag
Esporles Balearic Islands 2009 Pay per bag
Argentona Catalonia 2010 Pay per bag
Miravet Catalonia 2011 Pay per bag
Rasquera Catalonia 2011 Pay per bag
Santa Maria de la Salut Balearic Islands 2014 Pay per bag
Binissalem Balearic Islands 2014 Pay per bag
Usurbil Basque Country 2014 Pay per bin
Source: ENT. Notes: AC: Autonomous Community.
Notes: PAYT was cancelled in Torrelles de Llobregat several months later in the same year after a change of the municipal government (Puig, 2008). Some other municipalities not included in the table conduct PAYT schemes but only for commercial waste.
In regards to packaging, Integrated Management systems (IMS) do not fully assume the costs since the Spanish law on packaging under Article 10 (11/1997) states that:
“IMS will assume the difference between the cost of the ordinary systems for the collection and transport of waste and the cost of the IMS.”
1.6.5 Article 22: Encouraging the Separate Collection of Biowaste
The Act on waste (Act 22/2011, Article 24) did not establish this obligation, but only referenced promoting the separate collection of bio-waste. The PEMAR contains recommendations to encourage the separate collection of bio-waste, and emphasises the importance of this stream for the accomplishment with targets included in several Directives.
The net recycling from biowaste separately collected is expected to increase until 2.3 Mt by 2020. Among the recommendations included in order to achieve this goal is the implementation of separate collection for bio-waste, with a particularly focus on the sources
31
Agència de Residus de Catalunya: http://residus.gencat.cat/web/.content/home/ambits_dactuacio/planificacio/precat20/precat20_web_cast.pdf
32Agència de Residus de Cataluya. 2010:
http://residus.gencat.cat/web/.content/home/lagencia/publicacions/centre_catala_del_reciclatge__ccr/guia_pxg_en.pdf
which generate most waste, such as parks and gardens and domestic waste in urban and rural areas33.
1.7 Summary of Policy Mechanisms and Instruments to Meet Targets
The main instruments used in Spain over the last few years in order to help meet the targets outlined in the Landfill Directive and the Waste Framework Directive are:
1) Legal Instruments: a. Adoption of Act 22/2011, of July 28thon Waste and Contaminated Soils,
which transposes the Waste Framework Directive; b. Adoption of the Royal Decree 1304/2009 of July 31st and Order
AAA/661/2013 of April 18th, which amend the Royal Decree 1481/2001 that transposes the Landfill Directive;
c. Adoption and implementation of the National Waste Management Plan, PEMAR 2016-2022; and
d. Implementation of the National Waste Prevention Plan 2014-2020 e. In relation to bio-waste, the most advanced regulation is Law 9/2008 of
July 10th, which modifies Law 6/1993 of July 15th regulating waste in Catalonia. It establishes the obligation to undertake separate collection of bio-waste for the entire region. Other regional plans (e.g. Asturias, Castile La Mancha, Basque Country) also provide instruments to encourage bio-waste collection, but without establishing separate collection as mandatory.
2) Economic/Fiscal Instruments: a. Application of extended producer responsibility to packaging, WEEE,
tyres, end-of-life vehicles, mineral oils and batteries; b. Implementation of landfill taxes in several Autonomous Communities,
and an incineration tax in Catalonia; c. Grants awarded to the regional governments for the closure or
conditioning of landfills; and d. Introduction of taxes or fixed prices in some regions for disposable plastic
bags. 3) Administrative Instruments:
a. Completion of the network of waste treatment facilities, although there are still gaps in the network for facilities on recovery and recycling;
b. Adaptation of landfills and incinerators to new requirements arising from EU regulations;
c. Closure of illegal landfills across Spain;
33 Studies have shown that the quality of separately collected bio-waste depends greatly on the type of
collection schemes, being by door-to-door collection models the most effective in this regard (Puig Ventosa et al, 2013)
d. Improving systems for monitoring, inspecting and surveilling environmental crime, particularly those infringements related to illegal dumping;
e. Creation of the Coordination Commission on Waste, consisting of members of the Government, the regional governments and local authorities; and
f. Promotion of voluntary agreements with associations and companies to move towards a more efficient use of resources and better waste management.
4) Informative Instruments a. Improving information available on waste, establishing common
requirements and exchange of information between the competent authorities and the sectors concerned;
b. Development of information systems and collaboration with the National Statistics Institute for implementing EU regulations on waste statistics; and
c. Public awareness campaigns on recycling, conducted in collaboration with regional and local authorities and private entities. In particular there have been several campaigns to reduce the use of disposable plastic bags.
However, as set out in Section 1.5, these measures are not sufficient to achieve the targets set by the Waste Framework and Landfill Directives in all regions. In accordance, the Ministry has included additional instruments in the PEMAR, primarily aimed at increasing recycling and composting rates. The main instruments and guidelines that the regions should apply are:
1) General Guidelines: a. Implementation and reinforcement of separate collection of biowaste
from households in rural and urban areas, gardening and big producers; b. Strengthen the promotion of home composting; c. Make the necessary changes in the existing collection systems to reduce
the presence of impurities; d. Improve the separate collection of paper, especially among sources which
generate large amounts of waste (e.g. administrations, offices, universities, etc.);
e. Improve the separate collection of glass in households and among sources which generate large amounts of waste;
f. Improve the separate collection of plastic packaging in households and sources which generate large amounts of waste, and even allow the joint collection of packaging and non-packaging plastic;
g. Implement the selective collection of wood among sources which generate large amounts of waste and increase the uptake of wood in waste recycling centres;
h. Improve the separate collection of textiles and improve the collection network of textiles; and
i. Increase the collection network of special waste streams (e.g. WEEE, batteries, etc.).
2) Guidelines about Infrastructure:
a. Construction of new bio-waste facilities near the points of generation, and prioritising composting vs. anaerobic digestion; and
b. Mechanical biological treatment and recovery of waste non-separately collected.
3) Legal Guidelines: a. Regulate compost/digestate and promote its use as a product; b. Develop a legal framework for the bio-stabilized material use in the soil
and reduce its application in agriculture by 2020; c. Analyse the application of the extended producer responsibility principle
to other commercial and industrial packaging; and d. Develop technical specifications for materials according to the needs of
the recycling industry, taking into account developments in technology and in the materials market.
4) Economic/Fiscal Guidelines: a. Establish differentiated rates for municipal waste management services,
moving towards PAYT schemes; b. Establish a framework for environmental taxation, for landfilling as a first
step and for incineration as a second step; and c. Work towards detailed accountability of the costs associated with the
collection and treatment of waste for each type of management. 5) Information Guidelines:
a. Improve data collection on collection and treatment waste facilities, as well as on the managers of these facilities;
b. Perform periodic characterisations of different waste streams at the entrance to the treatment facilities, especially for landfilling;
c. Improve the information available on non-hazardous commercial and industrial waste managed privately;
d. Develop an information database that includes annual reports from facilities and allows for the development of statistics using the information these include; and
e. Conduct training and awareness campaigns targeted at both local authorities and citizens in relation to the new collection models and their costs.
The sanctions included in Act 22/2011 of July 28th are related to the non-compliance of management operators (e.g. waste management without the administrative permit or littering). These are divided into three categories and include fines up to €1,750,000. Since targets are not regionalised, there are no mechanisms currently to enforce regional authorities to accomplish national targets. However, the PEMAR sets for first time regionalized objectives for the ACs, which according to Act 22/2011 would permit to reallocate penalties to those regions where non-compliance with targets occur.
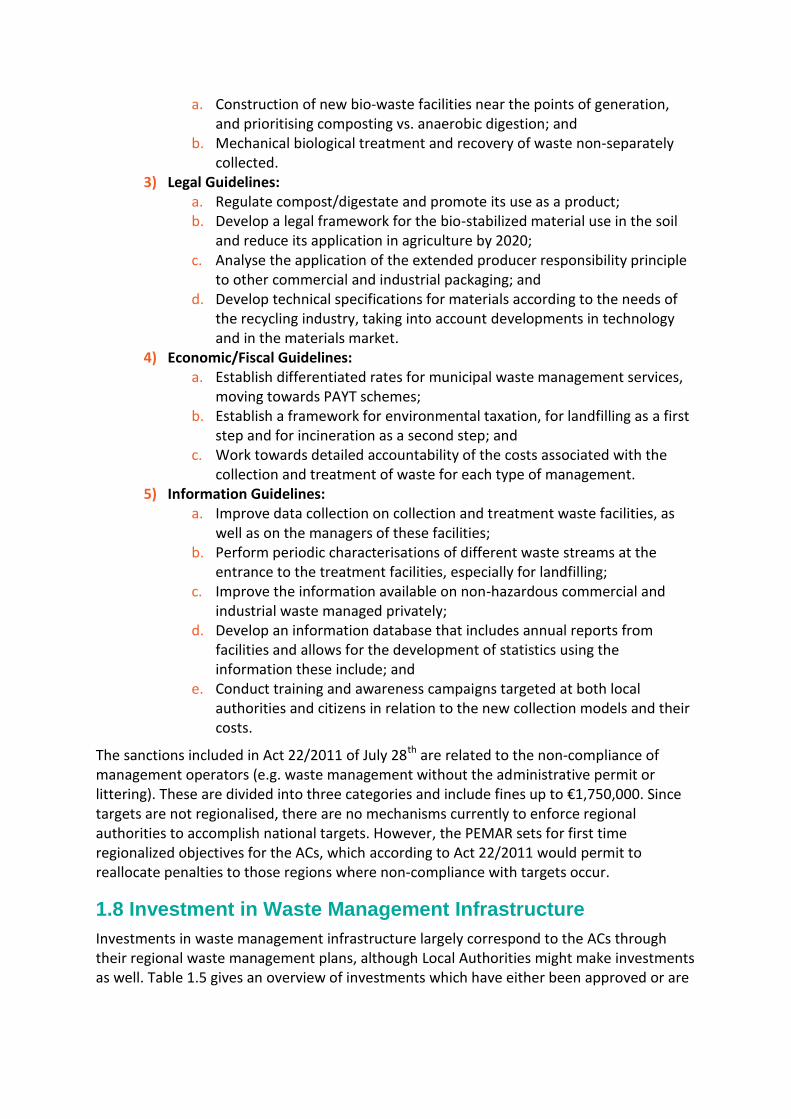
1.8 Investment in Waste Management Infrastructure
Investments in waste management infrastructure largely correspond to the ACs through their regional waste management plans, although Local Authorities might make investments as well. Table 1.5 gives an overview of investments which have either been approved or are

in the planning stages of ongoing waste management plans. Many WMPs are outdate and/or do not seem to foresee enough investments to reach the targets.
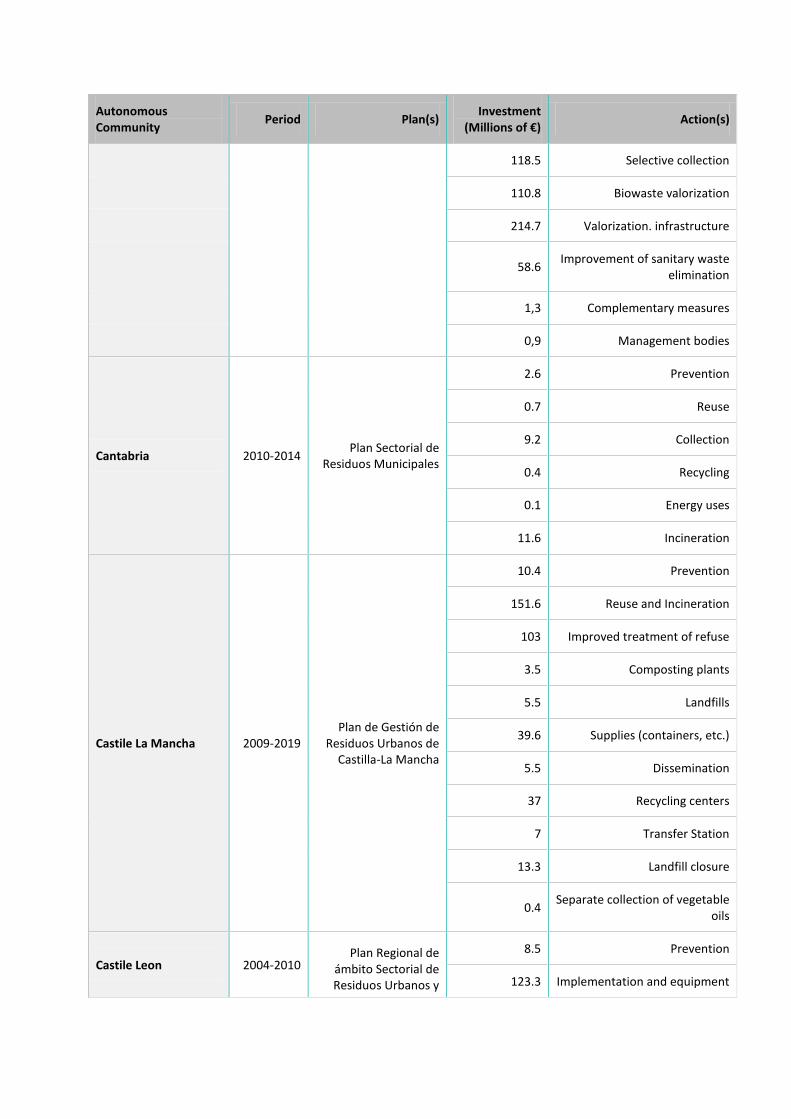
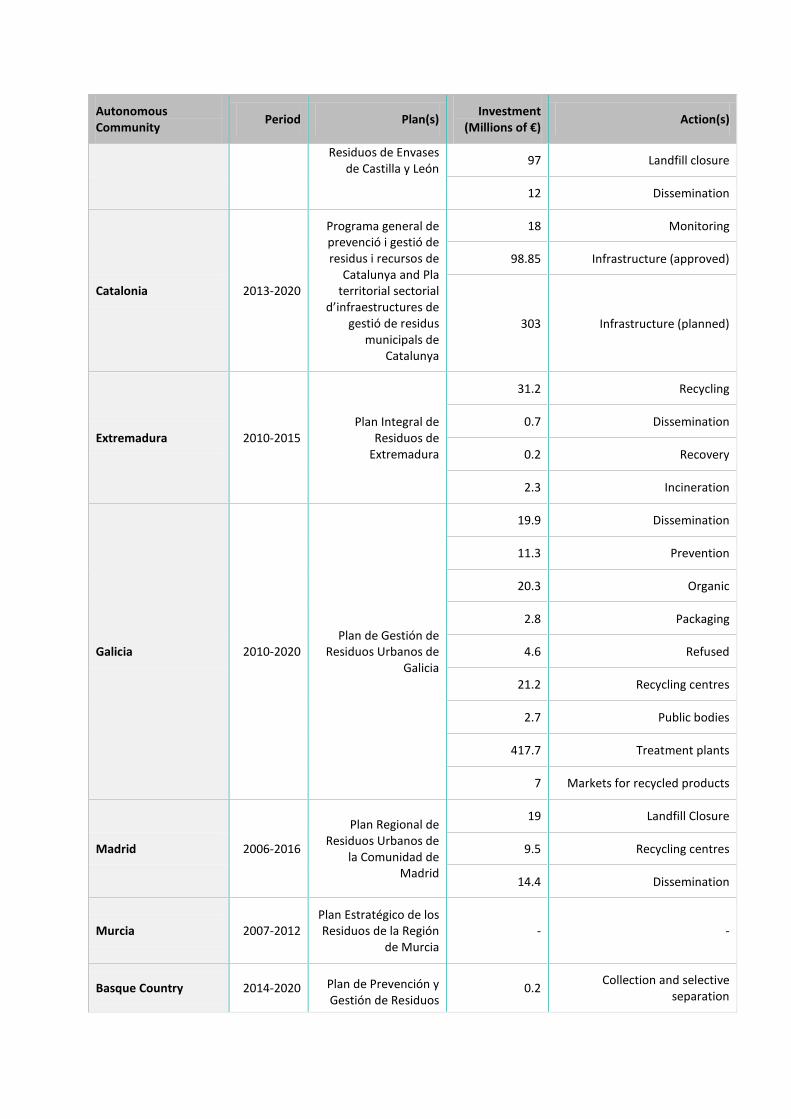
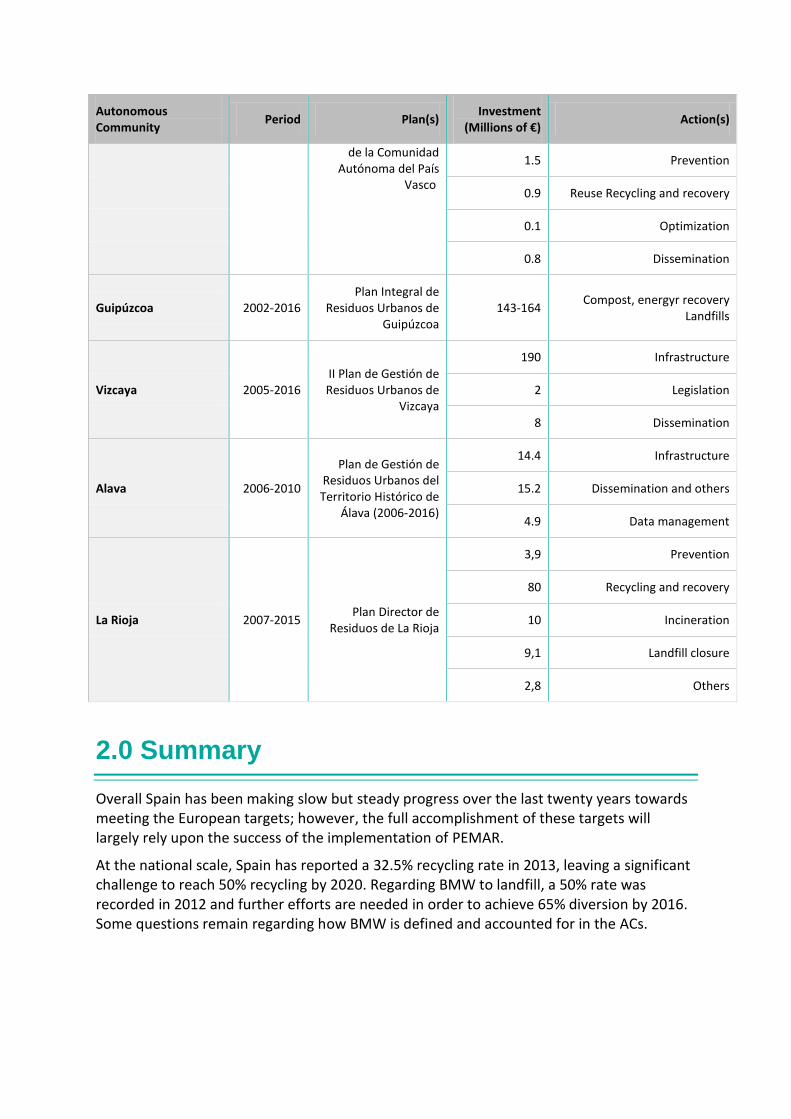
Table 1.5: Investments in Infrastructure as Included Within Regional Waste Management Plans
Autonomous Community
Period Plan(s) Investment
(Millions of €) Action(s)
Andalusia 2010-2019
Plan Director Territorial de Gestión
de Residuos No peligrosos de
Andalucía
2.5 Prevention
2,139 Infrastructure
5.9 Others
7.1 Monitoring
29.2 Dissemination
Aragon 2009-2015 Plan Integral para la
gestión de residuos de Aragón
36.6 Infrastructures and others
Asturias 2014-2024 Plan Estratégico de
residuos del Principado de Asturias
287.2 Infrastructure
Balearic Is. Mallorca 2000-2006
Plan Director Sectorial para la gestión de los residuos urbanos de
Mallorca
6.2 Reduction and Recycling
1.3 Containers
69.5 Infrastructures
21.5 Others
Balearic Is. Ibiza and Formentera
2000-2006
Plan Director Sectorial para la gestión de los residuos urbanos de Eivissa y Formentera
57.2 Infrastructure
6.9 Others
Balearic Is. Menorca - No information
available. - -
Canary Is. Santa Cruz de Tenerife
2007-2016
Plan Territorial Especial de
Ordenación de los Residuos
9.1 Containers refuse
206.9 Infrastructure
10 Containers selective
38.4 Others
Canary Is. Las Palmas 2014-2020 Plan Territorial
Especial de Residuos de Gran Canaria
1 Prevention
0.01 Reuse
Autonomous Community
Period Plan(s) Investment
(Millions of €) Action(s)
118.5 Selective collection
110.8 Biowaste valorization
214.7 Valorization. infrastructure
58.6 Improvement of sanitary waste
elimination
1,3 Complementary measures
0,9 Management bodies
Cantabria 2010-2014 Plan Sectorial de
Residuos Municipales
2.6 Prevention
0.7 Reuse
9.2 Collection
0.4 Recycling
0.1 Energy uses
11.6 Incineration
Castile La Mancha 2009-2019 Plan de Gestión de
Residuos Urbanos de Castilla-La Mancha
10.4 Prevention
151.6 Reuse and Incineration
103 Improved treatment of refuse
3.5 Composting plants
5.5 Landfills
39.6 Supplies (containers, etc.)
5.5 Dissemination
37 Recycling centers
7 Transfer Station
13.3 Landfill closure
0.4 Separate collection of vegetable
oils
Castile Leon 2004-2010 Plan Regional de
ámbito Sectorial de Residuos Urbanos y
8.5 Prevention
123.3 Implementation and equipment
Autonomous Community
Period Plan(s) Investment
(Millions of €) Action(s)
Residuos de Envases de Castilla y León
97 Landfill closure
12 Dissemination
Catalonia 2013-2020
Programa general de prevenció i gestió de residus i recursos de
Catalunya and Pla territorial sectorial
d’infraestructures de gestió de residus
municipals de Catalunya
18 Monitoring
98.85 Infrastructure (approved)
303 Infrastructure (planned)
Extremadura 2010-2015 Plan Integral de
Residuos de Extremadura
31.2 Recycling
0.7 Dissemination
0.2 Recovery
2.3 Incineration
Galicia 2010-2020 Plan de Gestión de
Residuos Urbanos de Galicia
19.9 Dissemination
11.3 Prevention
20.3 Organic
2.8 Packaging
4.6 Refused
21.2 Recycling centres
2.7 Public bodies
417.7 Treatment plants
7 Markets for recycled products
Madrid 2006-2016
Plan Regional de Residuos Urbanos de
la Comunidad de Madrid
19 Landfill Closure
9.5 Recycling centres
14.4 Dissemination
Murcia 2007-2012 Plan Estratégico de los Residuos de la Región
de Murcia - -
Basque Country 2014-2020 Plan de Prevención y Gestión de Residuos
0.2 Collection and selective
separation
Autonomous Community
Period Plan(s) Investment
(Millions of €) Action(s)
de la Comunidad Autónoma del País
Vasco
1.5 Prevention
0.9 Reuse Recycling and recovery
0.1 Optimization
0.8 Dissemination
Guipúzcoa 2002-2016 Plan Integral de
Residuos Urbanos de Guipúzcoa
143-164 Compost, energyr recovery
Landfills
Vizcaya 2005-2016 II Plan de Gestión de Residuos Urbanos de
Vizcaya
190 Infrastructure
2 Legislation
8 Dissemination
Alava 2006-2010
Plan de Gestión de Residuos Urbanos del Territorio Histórico de
Álava (2006-2016)
14.4 Infrastructure
15.2 Dissemination and others
4.9 Data management
La Rioja 2007-2015 Plan Director de
Residuos de La Rioja
3,9 Prevention
80 Recycling and recovery
10 Incineration
9,1 Landfill closure
2,8 Others
2.0 Summary
Overall Spain has been making slow but steady progress over the last twenty years towards meeting the European targets; however, the full accomplishment of these targets will largely rely upon the success of the implementation of PEMAR.
At the national scale, Spain has reported a 32.5% recycling rate in 2013, leaving a significant challenge to reach 50% recycling by 2020. Regarding BMW to landfill, a 50% rate was recorded in 2012 and further efforts are needed in order to achieve 65% diversion by 2016. Some questions remain regarding how BMW is defined and accounted for in the ACs.
Significant interregional differences have been identified in work elsewhere, such as that by the European Topic Centre in 2014.34 To date, the contribution of each region to the overall targets remains quite varied. Therefore, achieving the appropriate focus within regional legislation and waste management plans will be crucial in order to achieve these goals, particularly since investments are mostly made up of regional budgets. Strengthening coordination and cooperation amongst the three administrative levels is also necessary in order to address waste management challenges in the short- and medium-term.
Main Strengths:
There is an adequate level of legislation in place or under development in order to support appropriate waste management policies;
The necessary involvement of administrative bodies at different levels (i.e. national, regional and local) allows for a reasonable degree of flexibility in terms of the adaptation of different tools to specific contexts (e.g. rural areas, islands or big cities);
Regional waste management plans have sufficient detail on the different waste streams addressed, budget allocations and priority issues;
The PEMAR is accurate in its diagnosis of the different streams It clearly relates means to goals;
PEMAR includes a proposal for minimum contents to be included within regional waste management plans in order to ensure their coherence;
Some regions have gained significant experience in developing prevention and recycling policies, implementing separate collection and recycling schemes. Those regions lagging behind could benefit from their experiences and guidance documents and tools, as well as from tools developed by MAGRAMA and European organisations (such as R4R and ACR+). In addition, these regions could benefit from recent experiences on PAYT schemes and landfill and incineration taxes applied in other regions. These precedents may encourage other regions to set up similar systems in the near future.
Potential Weaknesses:
Existing legislation is currently weak with regards to the establishment of monitoring systems necessary to enforce the compliance with targets at the regional scale. This gap is also seen as one of the main weaknesses for waste management at the national scale;
The implications in terms of cost efficiency of devolving the responsibility for the accomplishment with the Waste Framework Directive to the Autonomous Communities are not addressed. This implies that those regions that have already met the target or are close to meet it will have no incentives to go beyond the required levels, whereas other regions might have to allocate their financial resources to solutions devoted to get short terms results (i.e. mechanical biological treatment plants) instead of implementing strategic long term approaches (i.e. increase the separate collection of bio-waste).
34
ETC/SCP.2014: http://scp.eionet.europa.eu/wp/wp2014_1
Regional plans are too diverse in terms of time span, waste streams covered, instruments used and budget, and some of them are currently out of date and in need of revisions;
The relation between the current endowment and planned investments in waste management infrastructure and the actual demand is not clearly stated in the PEMAR and in the regional waste management plans.
The low efficiency of MBT plants regarding material recovery and composting seriously constitutes a bottleneck for the compliance with the recycling target. The contribution of MBTs to the overall recycling rate by 2020 is expected to decrease by 40%. Consequently the role of MBTs in the fulfilment of the targets will be limited.
Overcapacity in energy recovery facilities constitutes a barrier to prevention and recycling policies in the Balearic Islands;
There is no cross-regional identification of priorities and opportunities and how these could potentially contribute to the accomplishment of targets. Some highlights/examples of good practices would be useful;
There is no official information published on the various recycling rates associated with the different waste collection models, which makes it difficult to take stock and highlight lessons learnt;
Given the allocation of responsibilities (i.e. executive competences correspond to the ACs) most of instruments and proposals within PEMAR, particularly those referring to the use of taxes and economic incentives, are not mandatory since they are not underpinned by legislation at the national scale;
The slow progress made in adopting more effective separate collection schemes, especially in areas responsible for large amounts of waste generation -namely Madrid and Andalusia- may be an obstacle in accomplishing the recycling and landfilling targets. Further efforts, particularly regarding separate collection of bio-waste, will have to be promoted in order to boost the contribution of these key ACs to overall national targets;
There is very limited use of landfill/incineration taxes which disincentive waste diversion from landfill;
There is very limited use of PAYT schemes in Spain currently, although the existing collection arrangements would make such application somewhat problematic, except where door-to-door separate collection is already implemented.
A business as usual scenario (i.e. in the absence of further measures on waste prevention, profound changes in waste collection systems and the use of appropriate economic instruments) would lead to the non-compliance with targets plus an increase in total waste generated in 2020.
If the WFD targets are to be met by each region, specific attention should be paid to the worst performers in the short term: namely Canary Is., Madrid, Galicia, Balearic Is., Murcia, C-La Mancha, Asturias, Aragon, Basque Country and Andalusia. Moreover, some of the best performers, namely La Rioja, Extremadura and Valencia strongly rely on the calculation of recycling figures at MBT plants where mass losses are accounted for as recycling.
In order for the Landfill Directive’s target to be met by 2016, further measures should be implemented in Andalusia, Madrid, Valencia, the Canary Islands, the Basque Country and Aragon. Furthermore, the details on how biodegradable waste sent to landfill is calculated in each region should be assessed in order to ensure
methodological transparency and enhance comparability, reliability and soundness of the figures reported.
3.0 Information Sources
- Agencia de Residus de Cataluya. 2010. Guide for the Implementation of Pay-As-You-Throw Systems for municipal Waste (PAYT). 2013.
- Anuario de Estadística. MAGRAMA. Accessed: 22nd January 2016 http://www.magrama.gob.es/es/estadistica/temas/publicaciones/anuario-de-estadistica/default.aspx
- Association of Catalan municipalities for Door-to-Door Selective Collection. 2014. Economic balance of door to door and road containers waste collection for local authorities and proposals for optimization. Accessed: 22nd January 2016 http://portaaporta.cat/documents/arxiu_portaaporta_173.pdf
- Ecovidrio. 2013. Informe de sostenibilidad. Accessed: 22nd January 2016 http://www.ecovidrio.es/BlankSite/media/Docs/Memoria-2013.pdf?ext=.pdf
- ENT. 2011. Estudio sobre modelos de gestión en entornos rurales aislados. Accessed: 22nd January 2016 http://www.magrama.gob.es/imagenes/es/Gestion%20de%20residuos%20en%20entornos%20rurales%20vfinal%20revisada%20150411_tcm7-183008.pdf
- ENT. 2011. Estudio sobre modelos de gestión en zonas insulares. Accessed: 22nd January 2016 http://www.magrama.gob.es/imagenes/es/Estudio%20sobre%20modelos%20de%20gesti%C3%B3n%20de%20residuos%20en%20entornos%20insulares_tcm7-183310.pdf
- ETC/SCP. 2012. Overview of the use of landfill taxes in Europe. Working Paper 1/2012. Accessed: 22nd January 2016 http://scp.eionet.europa.eu/publications/WP2012_1/wp/WP2012_1
- II Plan de Gestión de Residuos Urbanos de Vizcaya. 2006-2016. Accessedc 2016 http://bizkaia.eus/home2/Temas/DetalleTema.asp?Tem_Codigo=539&Idioma=CA
- Instituto Nacional de Estadística: Estadísticas sobre recogida y tratamiento de residuos. Residuos urbanos. Accessed: 22nd January 2016. http://www.ine.es
- Instituto Nacional de Estadística: Estadísticas sobre recogida y tratamiento de residuos. Tratamiento de residuos. Accessed: 22nd January 2016. http://www.ine.es
- MAGRAMA. 2013. Gestión de biorresiduos de competencia municipal. Guía para la implantación de la recogida separada y tratamiento de la fracción orgánica. Accessed: 22nd January 2016 http://www.magrama.gob.es/es/calidad-y-evaluacion-ambiental/publicaciones/guia_mo_def_tcm7-285227.pdf
- Pla territorial sectorial d’infraestructures de gestió de residus municipals de Catalunya. 2013-2020. Accessed: 22nd January 2016 http://residus.gencat.cat/web/.content/home/ambits_dactuacio/planificacio/pla_territorial_sectorial_dinfraestructures_de_gestio_de_residus/memoria.pdf
- Plan de Gestión de Residuos Urbanos de Castilla La Mancha. 2009-2019. Accessed: 22nd January 2016 http://pagina.jccm.es/medioambiente/planes_programas/plan%20de%20ru%20de%20castilla%20la%20mancha_v2.pdf
- Plan de Gestión de Residuos Urbanos de Galicia. 2010-2020. Accessed: 22nd January 2016 http://sirga.cmati.xunta.es/c/document_library/get_file?folderId=190428&name=DLFE-16056.pdf
- Plan de Gestión de Residuos Urbanos del Territorio Histórico de Álava. 2006-2016. Accessed: 22nd January 2016 http://www.araba.eus/cs/Satellite?c=DPA_Plan_FA&cid=1193046719573&pageid=1193046468688&pagename=DiputacionAlava%2FDPA_Plan_FA%2FDPA_plan
- Plan de Gestión Integral de Residuos de Aragón. 2009-2015. Accessed: 22nd January 2016 http://aragonparticipa.aragon.es/sites/default/files/plan_gestion_integral_residuos_de_aragon_2009-2015.pdf
- Plan de Prevención y Gestión de Residuos de la Comunidad Autónoma del País Vasco. 2014-2020. Accessed: 22nd January 2016 https://www.irekia.euskadi.eus/uploads/attachments/6052/ResumenEjecutivoCAS__Plan_RESIDUOS_2020.pdf?1425984424
- Plan Director de Residuos de La Rioja. 2007-2015. Accessed: 22nd January 2016 http://www.larioja.org/npRioja/cache/documents/477711_PLAN_DIRECTOR_RESIDUOS_2007-2015.pdf?idtab=477905
- Plan Director Sectorial para la gestión de los residuos urbanos de Mallorca. 2000-2006. Accessed: 22nd January 2016 http://www.tirme.com/es/upload/file_aj30_06_11_11_07_24.pdf
- Plan Director Sectorial para la gestión de los residuos urbanos de Eivissa y Formentera. 2006-2010. Accessed: 22nd January 2016 http://dgrer.caib.es/www/DirEivisa/maincast.html
- Plan Director Territorial de Gestión de Residuos No peligrosos de Andalucía. 2010-2019. Accessed: 22nd January 2016 http://www.juntadeandalucia.es/medioambiente/portal_web/web/temas_ambientales/residuos/Gestion_De_Los_Residuos_Solidos/Residuos_urbanos/2010_11_02_plan_rnpa.pdf
- Plan Estatal Marco de Gestión de Residuos (PEMAR).MAGRAMA. Accessed: 22nd January 2016 https://www.boe.es/boe/dias/2015/12/12/pdfs/BOE-A-2015-13490.pdf
- Plan Estratégico de los Residuos de la Región de Murcia. 2007-2012. Accessed: 22nd January 2016 http://www.fmrm.es/UPLOAD/DOCUMENTO/Plan%20Estrat%C3%A9gico%20de%20la%20Regi%C3%B3n%20de%20Murcia%202007-2013.pdf
- Plan Estratégico de Residuos del Principado de Asturias. 2014-2024. Accessed: 22nd January 2016 http://asturies.com/sites/default/files/Plan%20Estrat%C3%A9xiu%20de%20Residuos%20del%20Princip%C3%A1u%20d'Asturies%202014-2024.pdf
- Plan Integral de Residuos de Extremadura- 2010-2015. Accessed: 22nd January 2016 http://extremambiente.gobex.es/files/biblioteca_digital/PIREX_2009_2015.pdf
- Plan Integral de Residuos Urbanos de Guipúzcoa. 2002-2016. Accessed: 22nd January 2016 http://www4.gipuzkoa.net/MedioAmbiente/gipuzkoaingurumena/es/secciones/residuosurbanos/eddpplanificacion.asp
- Plan Regional de ámbito Sectorial de Residuos Urbanos y Residuos de Envases de Castilla y León. 2004-2010. Accessed: 22nd January 2016 http://www.jcyl.es/web/jcyl/binarios/368/922/Decreto_18_2005.pdf?blobheader=application%2Fpdf%3Bcharset%3DUTF-8&blobheadername1=Cache-Control&blobheadername2=Expires&blobheadername3=Site&blobheadervalue1=no-store%2Cno-cache%2Cmust-
revalidate&blobheadervalue2=0&blobheadervalue3=JCYL_MedioAmbiente&blobnocache=true
- Plan Regional de Residuos Urbanos de la Comunidad de Madrid. 2006-2016. Accessed: 22nd January 2016 http://www.madrid.org/cs/Satellite?blobcol=urldata&blobheader=application/pdf&blobheadername1=Content-Disposition&blobheadervalue1=filename=PLAN_REGIONAL_RESIDUOS_URBANOS.pdf&blobkey=id&blobtable=MungoBlobs&blobwhere=1196173051689&ssbinary=true
- Plan Sectorial de Residuos Municipales. 2010-2014. Accessed: 22nd January 2016 http://www.medioambientecantabria.es/documentos_contenidos/23830_9.plan.solo.municipales.pdf
- Plan Territorial Especial de Ordenación de los Residuos. 2007-2016. Accessed: 22nd January 2016 2015 http://www.tenerife.es/planes/PTEOResiduos/PTEOResiduosindex.htm
- Programa general de prevenció i gestió de residus i recursos de Catalunya. 2013-2020. Accessed: 22nd January 2016 http://www20.gencat.cat/docs/arc/Home/Ambits%20dactuacio/Planificacio/PROCAT20/PRECAT20.pdf
- Puig Ventosa, I. “Charging systems and PAYT experiences for waste management in Spain”. International Journal of Integrated Waste Management, Science and Technology 28, 2008, p. 2767–2771.
- Puig-Ventosa, I., Freire Gonzàlez, J., Jofra-Sora, M. “Determining factors for the presence of impurities in selectively collected biowaste”. Waste Management & Research, 31: 510-517. 2013.
- Puig Ventosa, I., Sastre, S. 2016. Las tasas de residuos en España. Crónicas Tributarias. Accepted.
- Resolución de 20 de enero de 2009, de la Secretaría de Estado de Cambio Climático, por la que se publica el Acuerdo del Consejo de Ministros por el que se aprueba el Plan Nacional Integrado de Residuos para el período 2008-2015. Accessed: 22nd January 2016 http://www.boe.es/boe/dias/2009/02/26/pdfs/BOE-A-2009-3243.pdf