1 UNDERTAKING J5.1 2 3 Undertaking 4 5 To … · (AP-913), Configuration Management (AP-929) and...
97
Filed: 2008-06-06 EB-2007-0905 J5.1 Page 1 of 1 UNDERTAKING J5.1 1 2 Undertaking 3 4 To determine whether OPG can obtain and produce a copy of the Supply Chain Report. 5 6 7 Response 8 9 The report titled Ontario Power Generation Nuclear Supply Chain – 2006 10 Benchmarking Report is attached. 11
Transcript of 1 UNDERTAKING J5.1 2 3 Undertaking 4 5 To … · (AP-913), Configuration Management (AP-929) and...

Filed: 2008-06-06 EB-2007-0905
J5.1 Page 1 of 1
UNDERTAKING J5.1 1 2
Undertaking 3 4 To determine whether OPG can obtain and produce a copy of the Supply Chain Report. 5 6 7 Response 8 9 The report titled Ontario Power Generation Nuclear Supply Chain – 2006 10 Benchmarking Report is attached. 11

Internal Use Only Document Number:
N-REP-08130-10003 Sheet Number: Revision:
Report
N/A R001 Title:
ONTARIO POWER GENERATION NUCLEAR SUPPLY CHAIN - 2006 BENCHMARKING REPORT
Associated with document type REP N-TMP-10010-R006X
© Ontario Power Generation Inc., 2008. This document has been produced and distributed for internal Ontario Power Generation Inc. purposes only. No part of this document may be reproduced, published, converted, or stored in any data retrieval system, or transmitted in any form or by any means (electronic, mechanical, photocopying, recording, or otherwise) without the prior written permission of Ontario Power Generation Inc.
Ontario Power Generation Nuclear Supply Chain - 2006 Benchmarking Report
N-REP-08130-10003-R001
2007-11-07
Order Number: N/A
Other Reference Number: N/A
Internal Use Only
Prepared by:
Alex Visan Senior Specialist Methods Nuclear Supply Chain
Date
Approved by:
Wendy Gowans A/Director Business Integration and Change Management, Nuclear Supply Chain
Date
Filed: 2008-06-06 EB-2007-0905 J5.1 Attachment

Internal Use Only Document Number:
Report N-REP-08130-10003 Sheet Number: Revision: Page:
N/A R001 2 of 96 Title:
ONTARIO POWER GENERATION NUCLEAR SUPPLY CHAIN - 2006 BENCHMARKING REPORT
N-TMP-10010-R006X
Acknowledgments
Ontario Power Generation wishes to thank the Nuclear Supply Chain Strategic Leaders (NSCSL) and the following utilities and industry organizations for providing the personnel and resources necessary to perform this project.
• Entergy Operations, Inc. • Exelon Corporation • Nuclear Power Corporation of India, Ltd. • PG&E • Societatea Nationala Nuclearelectrica SA • Tennessee Valley Authority • USA Alliance
Filed: 2008-06-06 EB-2007-0905 J5.1 Attachment

Internal Use Only Document Number:
Report N-REP-08130-10003 Sheet Number: Revision: Page:
N/A R001 3 of 96 Title:
ONTARIO POWER GENERATION NUCLEAR SUPPLY CHAIN - 2006 BENCHMARKING REPORT
N-TMP-10010-R006X
Filed: 2008-06-06 EB-2007-0905 J5.1 Attachment
Internal Use Only Document Number:
Report N-REP-08130-10003 Sheet Number: Revision: Page:
N/A R001 4 of 96 Title:
ONTARIO POWER GENERATION NUCLEAR SUPPLY CHAIN - 2006 BENCHMARKING REPORT
N-TMP-10010-R006X
Executive Summary
In 2004 Supply of Parts and Services to Ontario Power Generation’s Nuclear Power Stations was identified as a major business risk for the corporation. As a result, a number of changes were made which included organizational change and leadership changes at all layers of the organization. In 2005 the new leadership performed several internal and external assessments including an exhaustive employee survey by Hewitt, a process audit by A.T. Kearney and a technical audit by Wardrop. These assessments were used as a basis to develop a strategic and business plan to take the organization from a state of firefight to one that aligned well with best nuclear supply chain performers. Nuclear Supply Chain’s strategies are: Improved Customer Satisfaction, Establishment of a Competent Nuclear Supply Chain Organization, and Optimization of OPG Inventory to Meet Approved Business Requirements
One of the root cause drivers of poor performance was complex and conservatively developed processes that required multiple hand offs throughout the organization and multiple managerial reviews and approvals in order to execute the material and service fulfillment process. A strategic initiative was developed to map the existing processes, to benchmark with the industry to determine industry best practices and to develop “to be” processes that are consistent with best nuclear industry processes.
The first half of 2006 was dedicated to mapping existing OPG Nuclear (OPGN) Supply Chain Processes. This involved mapping each of the NSC processes in detail down to the task level. NEI AP-908, Rev. 2, Materials and Services Process Description (AP-908) was used as a reference framework during this process.
OPGN conducted the benchmarking project between August and December 2006 as defined below to identify industry best practices. This included establishing an initial OPGN performance bases from self-assessment data gathered between 2004 and 2006. Performance data for supply chain processes was defined by AP-908. The overall industry standard for cost and performance data is found in the NEI Standard Nuclear Performance Model, Rev. 4 (SNPM). Key references required for operation of Canadian nuclear plants were also be employed (N286, IAEA-DS113) and standard non-nuclear commercial supply chain metrics were included as part of the overall review. The project conducted six site visits to nuclear plants located in the United States (US), Romania and India and also collected comparative data from Canadian nuclear facilities. The overall benchmarking target was Level III processes (sub-process and activity levels of AP-908).
The project was managed by OPGN with the assistance of a consultant subject matter expert who provided internal team support, coordination and assessment of the final draft report contents. Mentoring and peer manpower support for project team was provided by the Nuclear Supply Chain Strategic Leadership (NSCSL), the nuclear industry Community of Practice for supply chain processes. Additional support was obtained from the USA Alliance, which coordinates their performance activities through NSCSL. All other support was provided by OPGN.
Filed: 2008-06-06 EB-2007-0905 J5.1 Attachment
Internal Use Only Document Number:
Report N-REP-08130-10003 Sheet Number: Revision: Page:
N/A R001 5 of 96 Title:
ONTARIO POWER GENERATION NUCLEAR SUPPLY CHAIN - 2006 BENCHMARKING REPORT
N-TMP-10010-R006X
The project is sponsored by the Vice President, OPG Nuclear Supply Chain. Performance improvement initiatives will be evaluated by the sponsor for implementation in 2007 and after.
The scope of the project is summarized as follows:
• Establish a benchmarking team led by an OPG project manager and assisted by the consultant.
• Conduct at least four benchmarking visits of top industry performers in supply chain processes.
• Benchmarking of AP-908 /SNPM process interfaces was also included in the project scope such as ties to Work Management (AP-928), Equipment Reliability (AP-913), Configuration Management (AP-929) and Performance Improvement (LP002).
• The gap is the difference between the “as is” OPG process as compared to the team-recommended “to be” processes changes at Level III.
• OPG NSC has prepared a set of strategic recommendations based on data analysis of this benchmarking report and the self-assessment report. Details of the recommendations are provided in a separate report.
Site visits were conducted based on a selection process described in Appendix A.
The sites that were visited together with the most outstanding best practices were:
• Cernavoda – Competitive Bidding Process (Appendix D) • Diablo Canyon – Simplified Warehouse Process (Appendix F) • Indian Point – Challenge Process (Appendix G) • MAPS – Strategic Maintenance Approach (Appendix H) • Sequoyah – Surplussing of Unneeded Materials - (Appendix I) • Quad Cities – Category Managers (Appendix M).
General observations appear in Section 2 and are organized into categories of Leadership, Culture, Organization and Roles and Business /Cost Focus, Infrastructure and Nuclear Core Process Support.
Supply chain process observations appear in Section 3 and are organized by Materials and Services Process (MS001, MS002, etc). A translation table for converting MS processes to OPG NSC processes also appears in Section 4.
Filed: 2008-06-06 EB-2007-0905 J5.1 Attachment
Internal Use Only Document Number:
Report N-REP-08130-10003 Sheet Number: Revision: Page:
N/A R001 6 of 96 Title:
ONTARIO POWER GENERATION NUCLEAR SUPPLY CHAIN - 2006 BENCHMARKING REPORT
N-TMP-10010-R006X
Table of Contents
Page
Acknowledgments...................................................................................................................... 2 Executive Summary ................................................................................................................... 4 Table of Contents....................................................................................................................... 6 LIST OF TABLES AND FIGURES.............................................................................................. 9 Revision Summary....................................................................................................................10
1.0 INTRODUCTION...........................................................................................................11 1.1 Overview .......................................................................................................................11 1.1.1 Process Definitions........................................................................................................11 1.1.2 Prior Benchmarking Studies ..........................................................................................12 1.1.3 Project Team.................................................................................................................12 1.1.4 Key References.............................................................................................................12 1.1.5 OPGN Self-Assessment ................................................................................................12 1.1.6 Site Visits ......................................................................................................................13 1.2 Common Contributors ...................................................................................................13 1.2.1 Leadership ....................................................................................................................13 1.2.2 Culture...........................................................................................................................13 1.2.3 Organization and Job Roles ..........................................................................................13 1.2.4 Business/Cost Focus.....................................................................................................13 1.2.5 Infrastructure .................................................................................................................13 1.2.6 Nuclear Core Process Support ......................................................................................14 1.3 Best Practices ...............................................................................................................15 1.4 Key Performance Indicators ..........................................................................................15 1.5 Conclusions...................................................................................................................15 1.6 Recommendations.........................................................................................................16 1.6.1 General .........................................................................................................................16 1.6.2 MS001...........................................................................................................................17 1.6.3 MS002...........................................................................................................................17 1.6.4 MS003...........................................................................................................................17 1.6.5 MS004...........................................................................................................................18 1.6.6 MS005...........................................................................................................................18 1.6.7 MS006...........................................................................................................................18 1.7 Site Selection Process...................................................................................................18 1.8 Site Visit Highlights........................................................................................................18 1.8.1 Cernavoda.....................................................................................................................19 1.8.2 Diablo Canyon...............................................................................................................20 1.8.3 Indian Point ...................................................................................................................20 1.8.4 MAPS............................................................................................................................21 1.8.5 Sequoyah ......................................................................................................................22 1.8.6 Quad Cities ...................................................................................................................23
Filed: 2008-06-06 EB-2007-0905 J5.1 Attachment

Internal Use Only Document Number:
Report N-REP-08130-10003 Sheet Number: Revision: Page:
N/A R001 7 of 96 Title:
ONTARIO POWER GENERATION NUCLEAR SUPPLY CHAIN - 2006 BENCHMARKING REPORT
N-TMP-10010-R006X
2.0 GENERAL HIGH PERFORMANCE AREAS.................................................................24 2.1 Leadership ....................................................................................................................24 2.1.1 Executive direction ........................................................................................................25 2.1.2 Accountability ................................................................................................................25 2.1.3 Day-to-day business......................................................................................................25 2.1.4 Employee initiative and incentives .................................................................................25 2.2 Culture...........................................................................................................................25 2.2.1 Teamwork .....................................................................................................................25 2.2.2 Decision Making ............................................................................................................25 2.2.3 Business Focus .............................................................................................................26 2.3 Organization and Job Roles ..........................................................................................26 2.3.1 Broader general roles ....................................................................................................26 2.3.2 Cross-training ................................................................................................................26 2.4 Business/Cost Focus.....................................................................................................27 2.5 Infrastructure .................................................................................................................27 2.5.1 Logistics ........................................................................................................................27 2.5.2 Information Technology .................................................................................................27 2.5.3 Industry Cooperation .....................................................................................................28 2.6 Nuclear Core Process Support ......................................................................................28 2.6.1 Work Management ........................................................................................................28 2.6.2 Equipment Reliability .....................................................................................................29 2.6.3 Configuration Management ...........................................................................................30 2.7 Infrastructure .................................................................................................................30 2.7.1 Logistics ........................................................................................................................30 2.7.2 IT tools are integrated....................................................................................................30 2.7.3 Industry Cooperation .....................................................................................................30 2.8 Nuclear Core Process Support ......................................................................................30 2.8.1 Work Management Support...........................................................................................31 2.8.2 Equipment Reliability .....................................................................................................31 2.8.3 Configuration Management ...........................................................................................32 2.8.4 Process Integration........................................................................................................32
3.0 SUPPLY CHAIN HIGH PERFORMANCE AREAS........................................................32 3.1 MS001 Provide Inventory Management.........................................................................32 3.1.1 Inventory Accuracy........................................................................................................33 3.1.2 Returns Ratio ................................................................................................................34 3.1.3 Inventory Carrying Cost.................................................................................................34 3.1.4 Inventory Value .............................................................................................................34 3.1.5 Inventory Management..................................................................................................35 3.2 MS002 – Procure Materials ...........................................................................................35 3.2.1 Procurement Engineering Function ...............................................................................36 3.2.2 Procure Materials Cycle Time........................................................................................37 3.2.3 Outsourcing of Component Categories..........................................................................37 3.2.4 Control of Inventory Creep.............................................................................................37 3.2.5 Commercial Grade Dedication.......................................................................................38
Filed: 2008-06-06 EB-2007-0905 J5.1 Attachment
Internal Use Only Document Number:
Report N-REP-08130-10003 Sheet Number: Revision: Page:
N/A R001 8 of 96 Title:
ONTARIO POWER GENERATION NUCLEAR SUPPLY CHAIN - 2006 BENCHMARKING REPORT
N-TMP-10010-R006X
3.3 MS003 Procure Services...............................................................................................39 3.3.1 Vendor Quality Management .........................................................................................39 3.4 MS004 Provide Warehousing ........................................................................................40 3.4.1 Broaden Roles and Cross-Training................................................................................40 3.4.2 Efficient receipt and Inspection......................................................................................40 3.4.3 Reduce need for staging ...............................................................................................40 3.4.4 Other items....................................................................................................................40 3.4.5 Quality Control and Quality Assurance ..........................................................................41 3.5 MS005 Repairs, Refurbishment and Returns.................................................................41 3.5.1 Minimize Returns...........................................................................................................42 3.5.2 In-Storage Maintenance ................................................................................................42 3.6 MS006 – Disposition of Unneeded Material ...................................................................42 3.6.1 Surplussing ...................................................................................................................42 3.6.2 Scientech RapidPartSmart ............................................................................................43 3.6.3 Distributors ....................................................................................................................43 3.6.4 Other Surplus Disposal Methods ...................................................................................43 3.7 MS Process Enablers ....................................................................................................43 3.7.1 Training Programs.........................................................................................................43 3.7.2 Outage Jobs as Employee Development.......................................................................43 3.7.3 Cross-Training outside MS Processes...........................................................................44
4.0 PROCESS MAP AND KEY PERFORMANCE MEASURES .........................................44 4.1 AP-908 Process Maps...................................................................................................44 4.2 OPGN Process Maps ....................................................................................................46 4.3 TERMINOLOGY AND ACRONYMS ..............................................................................47 4.4 Performance measures .................................................................................................47 Appendix A: Site Selection Process .......................................................................................49 Appendix B: Site Profiles and Organization Charts ................................................................50 Appendix C: Benchmarking Team..........................................................................................62 Appendix D: Integrated Bidding Process ................................................................................65 Appendix E: Multi-Function Job..............................................................................................66 Appendix F: Warehouse Process Simplification.....................................................................67 Appendix G: Challenge Process.............................................................................................70 Appendix H: Strategic Maintenance Approach .......................................................................72 Appendix I: Surplussing of Unneeded Materials ...................................................................73 Appendix J: Inventory Challenge Process .............................................................................75 Appendix K: Warehouse Multi-Function Job...........................................................................77 Appendix L: Inventory as an Asset ........................................................................................78 Appendix M: Category Managers ...........................................................................................80 Appendix N: Management Controls........................................................................................82 Appendix O: Glossary of Terms..............................................................................................84
Filed: 2008-06-06 EB-2007-0905 J5.1 Attachment

Internal Use Only Document Number:
Report N-REP-08130-10003 Sheet Number: Revision: Page:
N/A R001 9 of 96 Title:
ONTARIO POWER GENERATION NUCLEAR SUPPLY CHAIN - 2006 BENCHMARKING REPORT
N-TMP-10010-R006X
LIST OF TABLES AND FIGURES
LIST OF FIGURES:
Figure 4-1 Industry Supply Chain Level I Process Map………………………………………..45 Figure B-1 Typical Site Supply Chain (Corporate not shown)………………………………....57 Figure B-2 Typical Nuclear Genco Supply Chain……………………………………………….58 Figure B-3 Typical Regional Nuclear Supply Chain…………………………………………….59 Figure B-4 Typical Single Site Nuclear Supply Chain…………………………………………..60 Figure B-5 Typical Corporate Supply Chain……………………………………………………..61 Figure K-1 Scientech RapidPartStart “EZ Search” Example…………………………………..79 LIST OF TABLES:
Table 4-1 OPGN Process Cross-reference List………………………………………………..46 Table 4-2 NSCSL Key Performance Measures………………………………………………...47 Table 4-3 Existing Supply Chain Performance Measures…………………………………….48 Table B-1 Cernavoda Profile Data……………………………………………………………….50 Table B-2 Diablo Canyon Profile Data...………………………………………………………...51 Table B-3 MAPS Profile Data………………………….…………………………………………52 Table B-4 Indian Point Profile Data....................……………………………………………….53 Table B-5 Sequoyah Profile Data………………………………………………………………...54 Table B-6 Quad Cities Profile Data………………………………………………………………55
Filed: 2008-06-06 EB-2007-0905 J5.1 Attachment

Internal Use Only Document Number:
Report N-REP-08130-10003 Sheet Number: Revision: Page:
N/A R001 10 of 96 Title:
ONTARIO POWER GENERATION NUCLEAR SUPPLY CHAIN - 2006 BENCHMARKING REPORT
N-TMP-10010-R006X
Revision Summary
Revision Number Date Comments
R001 2007-07-04 Initial issue. R001 2007-11-07 Revised to include letter from Joseph A. DiChiara
Filed: 2008-06-06 EB-2007-0905 J5.1 Attachment

Internal Use Only Document Number:
Report N-REP-08130-10003 Sheet Number: Revision: Page:
N/A R001 11 of 96 Title:
ONTARIO POWER GENERATION NUCLEAR SUPPLY CHAIN - 2006 BENCHMARKING REPORT
N-TMP-10010-R006X
1.0 INTRODUCTION
1.1 Overview
OPGN established a new supply chain organization in early 2006. A strategic plan was developed. At this time in the execution of the plan, a benchmarking project and gap analysis has been specified as the next step. This project will help satisfy the strategic plan planning requirements. Following project completion, the Business Improvement and Change Management (BICM) organization will begin process improvement tasks.
1.1.1 Process Definitions
The relevant Materials and Services (MS) process definitions from the SNPM are as follows:
1.1.1.1 MS001 – Provide Inventory Management
All activities relating to the demand management of materials and services including identification and stock-level maintenance of warehoused material. Includes identification of unneeded inventory.
1.1.1.2 MS002 – Procure Materials
All activities associated with the evaluation and procurement of materials. Includes processing and administration of purchase requisitions, purchase orders and internal supply requests, material contracts and leases, expediting materials, filing damage claims, resolving shipping discrepancies, total cost of ownership planning, make/buy decisions, and standardization of materials/variety reduction. All activities associated with planning, development of material contracting and leasing strategies, maintaining market intelligence and performance, and management of suppliers of strategic materials. Includes other functions in the support of procurement (e.g., procurement engineering) and periodic nuclear vendor qualification and oversight related to procurement of materials.
1.1.1.3 MS003 – Procure Services
All activities associated with evaluation and procurement of services. Includes processing and administration of purchase requisitions, requests for quotes, purchase orders, and service contracts. Includes all activities associated with planning, development, award and maintenance of services contracts and purchase orders, contracting strategies, contract negotiation, maintaining market analysis and performance, management of suppliers for strategic services, and payment authorization. Includes other functions in the support of procurement of services (e.g. Procurement Engineering) and periodic nuclear vendor qualification and oversight related to procurement of services.
Filed: 2008-06-06 EB-2007-0905 J5.1 Attachment

Internal Use Only Document Number:
Report N-REP-08130-10003 Sheet Number: Revision: Page:
N/A R001 12 of 96 Title:
ONTARIO POWER GENERATION NUCLEAR SUPPLY CHAIN - 2006 BENCHMARKING REPORT
N-TMP-10010-R006X
1.1.1.4 MS004 – Provide Warehousing
All activities relating to receipt, inspection, storage, counting, distribution, issuance and shipping of equipment and materials.
1.1.1.5 MS005 – Repairs, Refurbishment and Returns
All activities associated with onsite and offsite repairs, refurbishment and returns including quality control activities and dispositioning of discrepant repaired, refurbished and returned materials.
1.1.1.6 MS006 – Disposition of Unneeded Material
All activities relating to the recovery of inventory investment by disposing of unneeded materials.
1.1.2 Prior Benchmarking Studies
Two related industry-wide benchmarking projects have been done in the past. A Materials and Services Benchmarking project for MS-001 through MS006 was conducted by NEI in 2000. A Strategic Sourcing Methods Benchmarking Project for more details in MS002 and MS003 was conducted by NEI/NSCSL in 2001. Both of these references contain valuable information that were incorporated into project team training.
1.1.3 Project Team
The team for this benchmarking activity was drawn from OPG NSC resources and two consultant subject matter experts. OPGN provided the project manager.
1.1.4 Key References
SNPM - The Standard Nuclear Performance Model is intended to document and maintain a comprehensive knowledge base that includes all INPO and NEI process descriptions, an aligned set of activity-based costing definitions for use in submission of cost data to the Electric Utilities Cost Group (EUCG), and an aligned set of key performance indicators (KPIs).
1.1.5 OPGN Self-Assessment
A self-assessment summary report has been completed to capture all relevant data collected between 2004 and 2006. The format of the self-assessment report and this benchmarking report facilitates comparisons between OPGN “As is” performance and industry best practices identified in this report.
Filed: 2008-06-06 EB-2007-0905 J5.1 Attachment

Internal Use Only Document Number:
Report N-REP-08130-10003 Sheet Number: Revision: Page:
N/A R001 13 of 96 Title:
ONTARIO POWER GENERATION NUCLEAR SUPPLY CHAIN - 2006 BENCHMARKING REPORT
N-TMP-10010-R006X
1.1.6 Site Visits
Site visits were conducted based on a process that involved the evaluation of: responses to a comprehensive list of MS questions. The sites that were visited together with the most outstanding best practice were:
• Cernavoda – Competitive Bidding Process (Appendix D) • Diablo Canyon – Warehouse process Simplification (Appendix F) • Indian Point – Challenge Process (Appendix G) • MAPS – Strategic Maintenance Approach (Appendix H) • Sequoyah – Surplussing of Unneeded Materials (Appendix I) • Quad Cities – Category Managers (Appendix M).
1.2 Common Contributors
Common contributors are critical management and work practices done well by all or most sites visited. The most significant attributes for effective MS processes were determined to be:
Leadership, Culture, Organization and Job Roles and Business/Cost Focus, Infrastructure and Nuclear Core Process Support.
1.2.1 Leadership
Effective leadership managed initiatives and drove key behaviors at all sites.
1.2.2 Culture
Culture identifies the specific values and beliefs that shape behavior. The Team determined key cultural dimensions at the sites visited to be related to teamwork, decision making and business/cost focus.
1.2.3 Organization and Job Roles
Site job roles tended to be broad in scope with an emphasis on cross-training and employee development.
1.2.4 Business/Cost Focus
Much of the day-to-day activity involved understanding the supply chain as a business and being able to make data-driven decisions. Employees understood how much their process cost and were focused on adding value for the organization.
1.2.5 Infrastructure
Site MS processes were supported by an infrastructure that allowed them to be successful. This included logistical capability, information technology tools and alignment through NSCSL with their counterparts across the industry for sharing peer manpower, inventory, performance measure results and ideas for improvement.
Filed: 2008-06-06 EB-2007-0905 J5.1 Attachment

Internal Use Only Document Number:
Report N-REP-08130-10003 Sheet Number: Revision: Page:
N/A R001 14 of 96 Title:
ONTARIO POWER GENERATION NUCLEAR SUPPLY CHAIN - 2006 BENCHMARKING REPORT
N-TMP-10010-R006X
1.2.6 Nuclear Core Process Support
The most important element for success of the supply chain function was determined to be alignment and support for the nuclear core processes of work management, equipment reliability and configuration management. Process simplification was also an important goal.
Materials and Services processes have generally been simplified over the past few years to improve their support effectiveness. Methods include a reduction in number of required approval levels, based on the safety significance of the item. The historical tendency was to be ‘over cautious’ but now plants recognize what is need to meet standards in specific work situations by using a “graded approach”.
(a) Work Management
Work Management is the driver for supply chain’s success (in meeting parts demands) hence optimizing WM process results in planned needs being met and tactical support of emergent work. Materials and services activities were well integrated into the work management process, resulting in increased efficiency and providing a responsive and customer-focused supply organization.
A key to the Supply Chain success is improved planning and scheduling implemented by the sites. This process educates customers on the role that Supply Chain plays in the overall success of schedule implementation. Intelligent assessing is the end result of developing a maintenance strategy. No backlog in assessing means that material requirements are made known in a timely fashion.
(b) Equipment Reliability
Identification of critical equipment, predictive maintenance, a living preventive maintenance program, proactive integration with corrective action and life cycle management principles are the key elements of Equipment Reliability. This knowledge enabled the creation of strategic maintenance strategies for each plant system and critical component. All plants visited had complete ER methods and maintenance strategies. Therefore the warehouses contained the right inventory and inventory was maintained to a high level of accuracy.
(c) Configuration Management
Most sites had robust Configuration Management processes where design documentation closely matched installed equipment. Modifications effectively managed the addition of new bills of material (BOM) as well as the deletion of BOM data for removed equipment. Most plants continue to look for ways to proactively address obsolete equipment parts issues.
Filed: 2008-06-06 EB-2007-0905 J5.1 Attachment

Internal Use Only Document Number:
Report N-REP-08130-10003 Sheet Number: Revision: Page:
N/A R001 15 of 96 Title:
ONTARIO POWER GENERATION NUCLEAR SUPPLY CHAIN - 2006 BENCHMARKING REPORT
N-TMP-10010-R006X
(d) Cost Management Culture
There is a culture of cost management at both the corporate level and site level. Cost goals are cross-functional, and all staff to have a common focus. This allows the integration and alignment of many departments using overall business efficiency as a key area of focus.
1.3 Best Practices
The best practices identified in this benchmarking activity appear in Appendices D through M. The best practices represent examples of specific work practices that exceed the common contributor methods outlined above and expanded upon in Sections 2 and 3. Best practices are from the stations that were interested in supporting the project. There may be other sites that have similar or better capabilities or practices, but they were unable to be project participants.
1.4 Key Performance Indicators
Numerous performance indicators were identified in the plant visits. NSCSL key performance indicators (KPIs) are:
• Total Cost of Process • Total Value of Pos Placed • PO Value/Total Cost • Fleet Inventory Value/Plant • Fleet Field Issue to Returns Ratio by Item • Fleet Inventory Creep/Plant/Year • Fleet Non-outage Material Availability • Percent Emergent Orders (new in 2007)
A detailed listing of performance measures is provided in Section 4.
1.5 Conclusions
As a result of this benchmarking study several conclusions and recommendations have been developed as described below:
• The benchmarking process proved to be a useful way to quickly assemble best practices and validate OPGN opportunity areas.
• OPGN has not been sufficiently involved with the NSCSL and other industry Communities of Practice in order to take maximum advantage of their benefits.
• Other nuclear plants continue to share valuable incites and readily agree to host plant visits
Filed: 2008-06-06 EB-2007-0905 J5.1 Attachment

Internal Use Only Document Number:
Report N-REP-08130-10003 Sheet Number: Revision: Page:
N/A R001 16 of 96 Title:
ONTARIO POWER GENERATION NUCLEAR SUPPLY CHAIN - 2006 BENCHMARKING REPORT
N-TMP-10010-R006X
• OPGN can significantly improve their materials and services processes based in part to benchmarking observations of best practices and then adopting those practices as part of a comprehensive change management process and
• The benchmarking process in a continuous improvement item, not a one-time project event.
1.6 Recommendations
“It’s all about The Dog”. During the project members of the Team quickly realized the critical dependent relationship between overall nuclear operations (The Dog) and supply chain services (The Tail). While improvements are clearly required within OPGN Supply Chain itself, the overall amount of net benefit to the company cannot be fully realized without improving the effectiveness of the overall core processes. The proper identification of critical equipment and strategic maintenance approach establish inventory requirements and make inventory an asset. Also an efficient and effective work management process sets the pace for material support in outages as well as for weekly work.
Based on review and OPG NSC Self-Assessment Report as well as the findings of this report, the Team identified the following major gap areas for improvement:
1.6.1 General
Develop a cost conscious awareness in both supply chain and other divisions in the line organization to increase profitability. The vehicle for such an intervention should be an all-employee workshop where training is provided by “natural work team”. During training as the ownership for existing issues emerges, employee should be encouraged to identify improvement ideas.
Create a workforce plan for OPGN for the next 15 years. Identify likely sources of gain and losses of employees. Establish a mechanism where labour cost savings in day-to-day operations can be used to gradually shift personnel into the new Refurbishment and New Plants Construction Department. OPGN should also be prepared for resignation employee losses if new plants construction in other counties starts before it does in Ontario.
Tie financial performance to individual, department, site and company overall performance using financial indicators such as cost/KWh and capacity factor as well as achievement of specific across-department projects.
Establish clear roles and accountabilities for process owners in order to increase process productivity and greater product quality. Assign a single individual as process owner for each MS process.
Consolidate roles and empower staff to carry out their job and eliminate hand-offs Collapse jobs into a fewer roles in order to simplify the procurement function. Increase pay rates and rewards to consistently match the value new roles have within the
Filed: 2008-06-06 EB-2007-0905 J5.1 Attachment

Internal Use Only Document Number:
Report N-REP-08130-10003 Sheet Number: Revision: Page:
N/A R001 17 of 96 Title:
ONTARIO POWER GENERATION NUCLEAR SUPPLY CHAIN - 2006 BENCHMARKING REPORT
N-TMP-10010-R006X
company business structure. This includes supervisory, procurement and material management functions.
Improve staff training methods and qualification processes to match the newly established roles.
Evaluate the benefits of a single IT platform company-wide, considering the net overall benefits of modern architecture and functionality as well as ongoing legacy costs and loss of productivity as a result of using multiple IT systems.
Set supply chain performance goals to begin measuring performance using NSCSL standards in 2007 and reach median performance levels by 2009.
1.6.2 MS001
Improve inventory management by limiting access to CAT ID creation and maintenance.
Perform regular cycle counts and analyze data for ways to increase inventory accuracy inventory.
Establish clear inventory ownership and create incentives to use inventory efficiently. Let plant management decide who the inventory owner should be.
Increase inventory sharing across OPGN sites and COG members and use RapidPartSmart more effectively to share inventory outside OPGN.
Install a challenge process for material and service demand.
Identify excess and dead inventory and dispose of it prior to any major warehouse consolidation efforts.
1.6.3 MS002
Increase commercial materials purchasing power for OPG and OPGN by securing strategic alliances through “categories”, monitoring market conditions and establishing blanket purchase orders. Identify strategic suppliers that are aligned and committed to helping OPGN reach its operating and financial goals
1.6.4 MS003
Increase commercial services purchasing power for OPG and OPGN by securing strategic alliances through “categories”, monitoring market conditions and establishing blanket purchase orders. Identify strategic suppliers that are aligned and committed to helping OPGN reach its operating and financial goals.
Filed: 2008-06-06 EB-2007-0905 J5.1 Attachment

Internal Use Only Document Number:
Report N-REP-08130-10003 Sheet Number: Revision: Page:
N/A R001 18 of 96 Title:
ONTARIO POWER GENERATION NUCLEAR SUPPLY CHAIN - 2006 BENCHMARKING REPORT
N-TMP-10010-R006X
1.6.5 MS004
Establish a warehouse strategy to decide what degree of centralized or decentralized warehouse support is required. Then move frequently used items closer to the plants that need the material. Establish a robust inventory sharing policy among sites and other COG members.
1.6.6 MS005
Adopt the best practices regarding the return of materials to stores and repairs.
Improve in-storage maintenance practices.
1.6.7 MS006
Adopt the best practices regarding the surplussing of materials. Establish distributor relationships for consigning and salvaging excess materials.
1.7 Site Selection Process
Benchmark site selection was made with the assistance of the NSCSL Steering team based on existing 2004-2005 KPI’s and site visit availability. Key Performance Measures were used as a selection screen. Based on KPI results and after preliminary discussions with potential candidates the following utilities were selected: Progress Energy, PG&E, Entergy Northeast, TVA, Exelon, and Duke. Due to fall outage schedule conflicting with some OPGN proposed visit dates, the final list of visit plants was made.
Additional CANDU international sites were contacted for data exchange purposes. Two of these international plants, Cernavoda in Romania and MAPS in India, were also visited.
A description of the of the site selection process are contained in Appendix A.
1.8 Site Visit Highlights
The team conducted two-day site visits between September and October 2006. Site interviews were conducted with key personnel to identify candidates for good practices. The interview plan for each site was developed based on survey responses in the areas of project interest.
Interviews of various station and corporate personnel were conducted. Additionally, documents, procedures and performance measures were reviewed to further understand the potential good practices. Interview notes were taken and draft summaries of the potential good practices were documented.
Filed: 2008-06-06 EB-2007-0905 J5.1 Attachment
Internal Use Only Document Number:
Report N-REP-08130-10003 Sheet Number: Revision: Page:
N/A R001 19 of 96 Title:
ONTARIO POWER GENERATION NUCLEAR SUPPLY CHAIN - 2006 BENCHMARKING REPORT
N-TMP-10010-R006X
The following site visit descriptions summarize the key attributes and findings. Additional common contributor details are contained in Sections 2 and 3. Best practices are discussed in Appendices D through N.
1.8.1 Cernavoda
Cernavoda Nuclear Plant is a single –unit, 706 MW station. It became commercially operational in 1996. An identical second unit will be commercially operational by the Spring of 2007. Units 3 and 4 are in construction. The site is located in the southern part of Romania on the shore of the Danube-Black Sea channel. Unit 1 capacity factor was 90.08% for 2005. There is a one-year outage cycle with outage duration of 23 days.
The supply chain is part of the Business unit together with the financial department managed by a Business Manager. The supply chain includes a section for purchasing of materials and services section and inventory management and materials control section responsible as well to managing the warehouses. Procurement engineering is part of plant design engineering and physically located in another building.
Procurement engineering coordinates a projects executed by external contractors to create equipment data sheets for all pieces of equipment to as-built equipment. This is an important configuration management initiative that will align the physical plant to the paper plant and maintain up to date information on make and model number for plant equipment.
The station uses a “Work Management System” platform similar to what OPG Nuclear used before the implementation of PassPort. This will be replaced next year by the PassPort Work Management module. Materials management and inventory software is CANDU Material Management System (CMMS) similar to the OPG Nuclear used before the implementation of Passport. This will be replaced by the end of 2006 by a Romanian developed IT platform called SIMS. It will be fully integrated with the procurement software called PROXIS. As a result of using CMMS, the stock code number for materials has embedded in its structure intelligence that makes the SCN database easily searchable and more user friendly.
The maintenance department is the budget holder for spare parts for plant processes therefore is the inventory owner. The maintenance department is responsible for tool cribs. This make maintenance accountable for the material spent and puts the onus of rationalizing the expenditure in the right place.
A competitive bidding process (Appendix D) is in place for both materials and services, enabled by National laws and regulations and aligned to the European Community regulations for public acquisitions. A nationwide electronic public acquisitions system will be implemented by the Romanian government by the end of 2006. This system is being integrated with a European Union e-bidding system.
The warehouse shipping and handling services have been outsourced to an external service provider. That was said to save about 10% on labour costs.
Filed: 2008-06-06 EB-2007-0905 J5.1 Attachment
Internal Use Only Document Number:
Report N-REP-08130-10003 Sheet Number: Revision: Page:
N/A R001 20 of 96 Title:
ONTARIO POWER GENERATION NUCLEAR SUPPLY CHAIN - 2006 BENCHMARKING REPORT
N-TMP-10010-R006X
1.8.2 Diablo Canyon
Diablo Canyon (DCNPP) is a two-unit 1,100 MWe PWR. It is a 1960s vintage design similar to Pickering A. It went into commercial use in the 1980s due to technical issues related to seismic qualification and political issues in the State of California. Diablo Canyon is the only nuclear plant in PG&E and is in a remote location of the state. The remote location and the California time zone contributes to a number of issues that need to be taken into consideration for comparison purposes. An example of this is DCNPP would consider having higher inventory to mitigate the risk of time difference issues with eastern states and longer expediting times because of its remote nature.
The staff worked at a steady pace and pulled in the same direction. Organizational barriers appear to be non-existent and ownership and accountability were apparent. Staff generally do not need to work overtime and are empowered to exercise their jobs. The business is operated by line managers and staff and there was no visible senior leadership involvement in day-to-day issues. Cross-functional teamwork was excellent. Many observations were made where staff from different departments worked together effectively to resolve issues. The vice-president and directors were only visible in the planning process and in dealing with the regulator.
DCNPP has been very effective in embedding quality assurance into the workers and leaders culture. All staff were aware of the contribution their activities made toward nuclear safety and to quality assurance. The internal quality assurance (QA) function is much more proactive and part of the team. QA support for supply chain sits near the supply chain manager and while keeping independence is part of the team. Internal QA performs audit of the supply chain and it appeared the director and the staff found the process effective.
DCNPP has used PIMS (a mainframe predecessor of PassPort for many years. While the technology is somewhat dated, supply chain functions have been effectively integrated into IT tools. DCNPP plans to switch IT platforms to SAP in 2007. Planning work for this is essentially complete and the change will be made after the next refueling outage.
There are a number of strategies that the DCNPP Procurement Services Organization have in place that drives their process simplification. This includes a number of practices in warehousing (Appendix F). DCNPP also features efficiently consolidated job roles also. (Appendix E).
1.8.3 Indian Point
Indian Point is two 1000 MWe PWR operating units located just north of New York City, NY. These using operate in the Entergy Northeast regional fleet. They were constructed in the 1970s. One older unit has been shutdown but still provides some common site systems. Unit 2 is formerly owned by Consolidated Edison and Unit 3 is formerly owned by New York Power Authority. All units were purchased by Entergy and since then many common processes have been developed. However, inventory warehouses are still operated separately due to company’s decision to run each plant as a separate LLC.
Filed: 2008-06-06 EB-2007-0905 J5.1 Attachment

Internal Use Only Document Number:
Report N-REP-08130-10003 Sheet Number: Revision: Page:
N/A R001 21 of 96 Title:
ONTARIO POWER GENERATION NUCLEAR SUPPLY CHAIN - 2006 BENCHMARKING REPORT
N-TMP-10010-R006X
Indian Point is planning to move to a corporate Passport standard in the summer of 2007. Indian Point is currently using both SAP and MAXIMO for Work Management. Future plans include establishing a standard IT platform for the company.
The materials and services process is fully dedicated to supporting work management at Indian Point. Procurement engineering is part of the Preventive Maintenance (PM) program. Their role is to check on parts availability if anything is obsolete and vendors are still in business. Their involvement goes as far as working on new PM’s and challenge the stock code number on existing PM’s. Also challenge the min/max levels on PM’s.
Major Projects Review Committee, reviews major projects and expenditures. Members are Plant Manager, Site VP and Directors. Supply would only get involved to discuss any requests for material that was removed from inventory during Supply’s May/2006 initiative to lower inventory. Indian Point reclassified $26,039,907 worth of inventory due to the accounting department interpretation of FAS 151. The May reduction of inventory looked at: any material that was greater value of $10,000 not issued for at least two years and less than or equal to 5 in stock.
This inventory can still be used but it is now being capitalized and depreciated. Any new material purchase that has been categorized as such has to go through the Material review Board prior to purchasing whether the material is in stock or not.
Material analysts are to challenge all new CAT ID requests as to what is the need for, ensuring that if this type of material is only going to be used every year or two that it will not be stocked. If customer insists then the issue is raised to the Material Supervisor for resolution, meaning that the recommendation to stock material is only a recommendation; this will be changed to 0 and 1, meaning only to buy when there is a demand. For replenishment a buy is not created without first looking at what is in staged areas. If other work related to the materials request is complete then the MA contacts the warehouse to remove the staging from that work order and then transfers it to the current request. No new material order is required.
Indian Point uses a Challenge Process to limit purchases, manage inventory and manage cash flow. (Appendix G).
1.8.4 MAPS
Madras Atomic Power Station (MAPS) is a two-unit PHWR station rated at 220 MWe each and operated by Nuclear Power Corporation of India, Ltd (NPCIL). There are 13 units in the NPCIL fleet. Their fleet operates at about 90% capacity factor. Some of the units are over 20 years old and they are undergoing a full refurbishment lasting about 15 months to extend their lifetime. BSD outages lasting about 25 days occur once in two years. Each outage performs about 2,000 work orders.
Purchasing supply chain staff includes eight officials comprising of senior manager, managers and assistant managers. The warehouse has an additional 7 supervisors
Filed: 2008-06-06 EB-2007-0905 J5.1 Attachment

Internal Use Only Document Number:
Report N-REP-08130-10003 Sheet Number: Revision: Page:
N/A R001 22 of 96 Title:
ONTARIO POWER GENERATION NUCLEAR SUPPLY CHAIN - 2006 BENCHMARKING REPORT
N-TMP-10010-R006X
as purchase assistants and 18 storekeepers. Along with an additional three unskilled helpers, they have augmented the warehouse function with outsourcing support for loading, unloading and container operations. Not counting the outsource staff, the total supply chain compliment is about 36 staff members. Engineers may also be called in to provide technical support in the receiving and inspection functions. The total maintenance organization is 354 staff including 18 supervisors, 36 engineers and about 300 “hands on” employees. Station staff is about 900 personnel.
MAPS uses a custom Computerized Maintenance Management System (CMMS). The CMMS system and their level of planning is not detailed. However their craft, technical and management staff was highly skilled and experienced. MAPS overall material condition is excellent. All maintenance is done from a strategic point of view and the supply chain processes are able to stock recurring items and obtain long lead items and obsolete items from their supply chain partners without much difficulty.
Maintenance owns the warehouse inventory and they lead the management of material requirements including decisions about reorder points and max/min stocking levels.
A centralized design function leads analysis of technical issues including obsolescence.
Noteworthy practices at MAPS includes:
• Simple but effective process design • Excellent control on the supply base • In-house initiatives to qualify new suppliers • Reengineering/manufacturing of some items internally • Control of inventory levels and • Leveraging a strategic Maintenance Approach (Appendix H)
1.8.5 Sequoyah
Sequoyah is a two-unit PWR located in Tennessee near the Tennessee Valley Authority (TVA) headquarters. Sequoyah is managed as part of a large generating fleet composed of fossil, hydro and nuclear units. TVA is a very process-focused organization with fleet standards for most work functions, including the supply chain. It has common procedures in place for all generating units and additional standard nuclear procedures. Their supply chain services the entire company.
Sequoyah uses EMPAC Work Management, but is planning to move to PassPort Version 10 in the next year or two for work management. CAT IDs have a sourcing element code in the description panel that allows CAT IDs to be segregated out. TVA built a PassPort search tool for CAT ID reduction.
The Supply Chain treats the site as a customer, and levied a surcharge for each CAT ID created on the customer, instead of Supply Chain being an overhead cost.
Filed: 2008-06-06 EB-2007-0905 J5.1 Attachment
Internal Use Only Document Number:
Report N-REP-08130-10003 Sheet Number: Revision: Page:
N/A R001 23 of 96 Title:
ONTARIO POWER GENERATION NUCLEAR SUPPLY CHAIN - 2006 BENCHMARKING REPORT
N-TMP-10010-R006X
This drives the correct behaviors with respect to accountability and cost consciousness.
Planners put in material requests for main component and spare parts. The shops have a single point of contact that review the material requests and determine if there is an actual need. This reduces the return rate. They do not stage material and have a less than 1% material return rate. The planning horizon for on-line repetitive maintenance work looks out 24 to 48 weeks. Maintenance coordinators go over issues and identify long lead material. Challenge teams work together to select the right process to provide workable parts to the plant. They use strategy guides to plan repair and replacement work. Sequoyah has a strong repair process
TVA has a fossil maintenance shop with QA qualified personnel to do refurbishment work. They also have a general agreement for motors etc. and an MOU for turbine refurbishment.
TVA has historically been recognized for outstanding contracts management practices as well as being a leader in the formulation of performance measures. In 2003, Tennessee Valley Authority TVA issued a Contractor Workforce Management policy in order to reduce contractor cost and to improve performance reporting. The policy implemented strict requirements on pay, term length and the use of retirees. The success of the implementation has been overwhelming. They also have an attorney dedicated to Supply Chain Issues; this allows specialization, quick response.
TVA outages are managed using 106 milestones and they are thinking about adding more.
They staff the warehouse 24-7 for outages, but they have minimal coverage on off-days. Outages last from 25 to 30 days normally. TVA effectively employs Outage High Impact Teams (HIT). These teams are assigned to equipment categories (i.e. ice protection, cranes etc.) and job system performance is monitored during the outage using a color scheme.
Noteworthy practices at Sequoyah include Surplussing of Unneeded Materials (Appendix I), Inventory Challenge Process, (Appendix J) and Warehouse Multi-Function Jobs, (Appendix K).
1.8.6 Quad Cities
Quad Cities is a two-unit 912 MWe PWR operating in Illinois as part of the Exelon’s Midwest regional generation fleet. It was commissioned in 1972. The capacity factor is 96% to 97%. Number of staff in the total facility was 760 with 28 of those employees directly reporting into Supply Chain. Exelon averages about 31 staff at each of their ten nuclear sites. The team observed that housekeeping in Quad Cities to be at a very high standard. About 598 staff members provide all Exelon supply chain services for generation, energy delivery and all other functions. The corporate management and support staff consist of about 106 staff members.
Filed: 2008-06-06 EB-2007-0905 J5.1 Attachment
Internal Use Only Document Number:
Report N-REP-08130-10003 Sheet Number: Revision: Page:
N/A R001 24 of 96 Title:
ONTARIO POWER GENERATION NUCLEAR SUPPLY CHAIN - 2006 BENCHMARKING REPORT
N-TMP-10010-R006X
Organizational barriers appear to be non-existent and ownership and accountability are apparent. Staff generally does not need to work overtime, except during outage periods, and staffs are empowered to execute their jobs. The business is operated by managers and supervisors and there was no visible senior leadership involvement in day-to-day issues.
Quad Cities has been very effective in embedding quality assurance into the workers and leaders culture. All staff were aware of the contribution of their activities to nuclear safety and to quality assurance. The internal quality assurance function is proactive and part of the team. Self-assessments and audits are both conducted every two years. Quad Cities has a recognition process that consists of vouchers of $15 and $25 vouchers and ‘Lunch on Me’ given informally by the Supply Chain Manager for employees that have extended themselves with overtime worked etc.
Observation and coaching is an important factor at Quad Cities. The supervisors are measured on preset number of FMS (Fundamental Management System) entries.
Quad Cities currently uses PassPort, the standard work management software for their regional fleet.
There are a number of strategies that drive process simplification. In general, only one person is required to affect a purchase. An example would be in the fulfillment where the process is carried out by a single “Planner/Buyer” and procedure. Also the evaluation and pre-screening function is conducted by a five procurement engineers and a supervisor.
The supply chain staffs undergo a two-year training process based on job task professional who have cross-training in multiple site and corporate job functions.
Noteworthy practices at Quad Cities include Inventory as an Asset (Appendix L), Category Managers (Appendix M) and Management Controls, (Appendix N).
2.0 GENERAL HIGH PERFORMANCE AREAS
General high performance areas to support effective supply chain processes were determined to be Leadership, Culture, Organization and Job Roles, Business /Cost Focus, Infrastructure and Nuclear Core Process Support.
2.1 Leadership
Leadership was key in both management of initiatives as well as carrying out daily business activities. The Team characterized leadership as consisting of executive sponsorship and direction, establishing accountability, operating the business, delegating well-defined roles to others and providing performance feedback and incentives.
Filed: 2008-06-06 EB-2007-0905 J5.1 Attachment
Internal Use Only Document Number:
Report N-REP-08130-10003 Sheet Number: Revision: Page:
N/A R001 25 of 96 Title:
ONTARIO POWER GENERATION NUCLEAR SUPPLY CHAIN - 2006 BENCHMARKING REPORT
N-TMP-10010-R006X
2.1.1 Executive Direction
Executives were clearly in charge of the overall business. Plans and resources were established and monitored for results. Examples of direction setting include a trend to broader employee job roles. This decision to consolidate job functions was driven by requirement to improve business results. Subsequently that decision led to the need to train and educate the supply chain employees that in return created an array of benefits for both the company and employees.
2.1.2 Accountability
Accountability was evident at all levels of management. In many cases employees were empowered to make decisions within their job roles.
2.1.3 Day-to-day Business
Supervisors and front line employees operated the day-to-day business. Management was involved with exceptions and as part of regularly scheduled meetings. Smaller sites conducted few meetings and large fleets held regional meetings for high level oversight of the business.
Observation and coaching is an important factor at Quad Cities. The supervisors are measured on preset number of FMS (Fundamental Management System) entries.
2.1.4 Employee Initiative and Incentives
Employees were empowered to do their jobs effectively through peer review / recognition and incentive programs.
DCNPP has a recognition process that, while low key, encourages and allows cross functional peer recognition.
2.2 Culture
Key elements of nuclear culture included teamwork, decision making and business focus.
2.2.1 Teamwork
All sites exhibited a high degree of teamwork across departmental lines. The overall focus was supporting reliable plant operations and carrying out the business plan. This was demonstrated most clearly in conjunction with execution of the work management process as well as the outage planning process.
2.2.2 Decision Making
All sites processed large amounts of data to support decision making. This included cost data, site and department performance measures and in some cases
Filed: 2008-06-06 EB-2007-0905 J5.1 Attachment

Internal Use Only Document Number:
Report N-REP-08130-10003 Sheet Number: Revision: Page:
N/A R001 26 of 96 Title:
ONTARIO POWER GENERATION NUCLEAR SUPPLY CHAIN - 2006 BENCHMARKING REPORT
N-TMP-10010-R006X
performance indices. Within a specific job role, employees were also allowed to make decisions and they applied data insights in a similar fashion, but at their job level.
2.2.3 Business Focus
Cost Management methods are the primary tools in use by the supply chain. In addition teamwork between supply chain and their customers supports nuclear generation goals. Quality to the line has reduced receiving and inspection costs without adversely affecting quality.
There is a dominant cost consciousness across the plants visited. Supply chain staff show knowledge of their process costs and realize how those costs could affect the profitability of the company. Meaningful performance measures are aligned vertically in supply chain divisions and horizontally integrated with the rest of the company. The budget is communicated and understood at all decision making levels. Clear and common cost goals and relevant targets exist at each level (individual, team, department). Cost savings and avoidance programs are important drivers of individual and group performance and they are used to demonstrate value in organizations such as Procurement Engineering. Specific cost like expediting costs is tracked carefully to demonstrate benefit. Wasteful practices are regularly identified and eliminated.
All sites were well educated in how nuclear power generation was a business. Each employee understood their role and accepted cost and performance measures as an acceptable “yardstick” that drove daily work.
2.3 Organization and Job Roles
2.3.1 Broader General Roles
Site roles were multi-faceted with a goal of being more productive, flexible and accountable. Related jobs were combined into a single role.
2.3.2 Cross-training
Increased staff flexibility across job roles was developed through cross-training programs. This included roles related to department interface and outage roles as a minimum. There was an emphasis on continuous learning. The organization benefited by having employees developed to the highest levels possible.
The enablers for that is primarily the executive decision to consolidate job functions that was driven by the mandate to increase the profit. Subsequently that decision lead to the need to train and educate the supply chain employees that in return created an array of benefits for both the company and employees.
Indian Point has recently rotated staff in the supply chain, while ensuring previous managers are available for mentoring. Staff receives direct bonuses based on outage performance. The metrics include safety performance during outages and keeping costs down including inventory.
Filed: 2008-06-06 EB-2007-0905 J5.1 Attachment
Internal Use Only Document Number:
Report N-REP-08130-10003 Sheet Number: Revision: Page:
N/A R001 27 of 96 Title:
ONTARIO POWER GENERATION NUCLEAR SUPPLY CHAIN - 2006 BENCHMARKING REPORT
N-TMP-10010-R006X
2.4 Business/Cost Focus
There is a culture of cost management at corporate level and site level. These goals are cross-functional, but all staff to have a common focus. This allows the integration and alignment of many departments.
• Clear and common / shared cost goals and targets relevant at every level (individual, team, department)
• Alignment to company goals – communicated and understood at all levels
• Greater knowledge of costs throughout nuclear
• Program to capture and review costs savings and avoidance
• Recognize the need for checks and balances on what should be stocked or just one time buy
• Work Management partner in sharing cost consciousness (stable schedule)
• All staff are aware of the contribution of their activities to nuclear safety and to quality assurance
2.5 Infrastructure
2.5.1 Logistics
Company logistics were well established for support of the supply chain processes. This included the number and location of warehouses, intra-site shipping methods and industry sharing of inventory. Corporate meetings with key site staff and regular conference calls were important for ongoing communications and feedback.
2.5.2 Information Technology
All site operated work management, supply chain and other core processes from a single IT platform. From a fleet perspective this helped establish standards and gain the a high degree technology leverage. The brand of IT software did not appear as important as the sites understanding how to use it and upgrade it to accomplish their work. It was also important to understand where high areas of functionality could be leveraged by the site as well as understanding which modules may not be providing added value.
Sequoyah does not use PASSPORT AAAs to process CAT IDs or any other work related to supply chain processes but rather puts this information into a print code. Sequoyah uses the PASSPORT inventory algorithms as a guide but not as a requirement.
Filed: 2008-06-06 EB-2007-0905 J5.1 Attachment

Internal Use Only Document Number:
Report N-REP-08130-10003 Sheet Number: Revision: Page:
N/A R001 28 of 96 Title:
ONTARIO POWER GENERATION NUCLEAR SUPPLY CHAIN - 2006 BENCHMARKING REPORT
N-TMP-10010-R006X
2.5.3 Industry Cooperation
All sites were regular participants in NSCSL and more importantly, the member participated regularly with many serving for several on the Executive Steering Team. This has developed a deep understanding of how to manage supply chain activities as well as perform a consistent role in development and testing of industry-wide metrics. Steering team members also work with specifically assigned special issue groups and other CoP leaders across nuclear core processes for joint benefit and understanding needed for overall business operations.
Cooperating extends to planned support for peer visits and participation is project work teams for things such as periodic revisions and testing of AP-908.
2.6 Nuclear Core Process Support
Process simplification is achieved at most nuclear sites. Processes used at other utilities are becoming less complex. Simplify processes within Supply Chain to improve efficiencies. Reduction in the different levels of the review/approval required; such as the review/verify/approve process for procurement evaluation, N286 industry standard describes the two-step review-approve process. Change to business philosophy of thinking ‘over cautious’, recognize that you do not have to do more than what is necessary to meet the standard.
2.6.1 Work Management
Work Management is the driver for supply chain’s success (in meeting parts demands) hence optimizing WM process results in planned needs being met and tactical support of emergent work. Materials and services activities are well integrated into the work management process, resulting in increased efficiency and providing a responsive and customer-focused supply organization. Significant factors that affect the implementation of this integration include the physical location of the warehouse, transportation needs, methods used to move materials to end user locations, the use of process management to cut across organizational boundaries and the application of planning and scheduling methods to focus support priorities.
• Burning platform from the CNO
• Common goals from the top; meaningful at all levels
• Scope stability of >90%
• Purposeful face to face discussions
• Supply Chain is seen as a player at all WM planning meetings
• Understand where cross functional teams could focus on problems and better integrated planning
Filed: 2008-06-06 EB-2007-0905 J5.1 Attachment

Internal Use Only Document Number:
Report N-REP-08130-10003 Sheet Number: Revision: Page:
N/A R001 29 of 96 Title:
ONTARIO POWER GENERATION NUCLEAR SUPPLY CHAIN - 2006 BENCHMARKING REPORT
N-TMP-10010-R006X
• Supply Chain staff working seamlessly within the interfacing organizations
• Job shadowing programs / cross functional training
Indian Point supply chain operates in an environment where all groups are held accountable for meeting the work planning milestones of both the 13-week and outage planning process. Indian Point has also recognized the benefits of having mutual cross-department accountability when it comes to meeting work planning milestones of both the 13 week and outage planning process.
At TVA the planning horizon for on-line repetitive maintenance work looks out 24 to 48 weeks. Maintenance coordinators go over issues and identify long lead material.
TVA outages are managed using 106 milestones and they thinking about adding more.
They staff the warehouse 24-7 for outages, but they have minimal coverage on off-days. Outages last from 25 to 30 days normally. TVA effectively employs Outage High Impact Teams (HIT). These teams are assigned to equipment categories (i.e. ice protection, cranes etc.) and job system performance is monitored during the outage using a color scheme.
Quad Cities does not have a backlog in assessing. This allows supply chain to be able to see all of the parts needs well in advance of the task being scheduled or required.
2.6.2 Equipment Reliability
Identification of critical equipment, predictive maintenance, a living preventive maintenance program, proactive integration with corrective action and life cycle management principles are the key elements of Equipment Reliability. This knowledge enabled the creation of strategic maintenance strategies for each plant system and critical component. All plants visited had complete ER methods and maintenance strategies. Therefore the warehouses contained the right inventory and inventory was maintained to a high level of accuracy.
A key to the Supply Chain success is improved planning and scheduling implemented by the sites. This process educates customers on the role that Supply Chain plays in the overall success of schedule implementation. Intelligent assessing is the end result of developing a maintenance strategy. No backlog in assessing means that material requirements are made known in a timely fashion.
• Plan what you need and stock what you use
• Process to identify orphaned material for possible use/surplus/scrap
• Proactive IOP and outage planning with all key players and parts utilization metrics
• Implement scorecard with Work Management to track issues/returns
Filed: 2008-06-06 EB-2007-0905 J5.1 Attachment

Internal Use Only Document Number:
Report N-REP-08130-10003 Sheet Number: Revision: Page:
N/A R001 30 of 96 Title:
ONTARIO POWER GENERATION NUCLEAR SUPPLY CHAIN - 2006 BENCHMARKING REPORT
N-TMP-10010-R006X
Development of a Maintenance Strategy at OPGN is recognized as one of the enablers for the achievement of “intelligent” assessing and the reduction in assessing backlog.
2.6.3 Configuration Management
Most sites had robust Configuration Management processes where design documentation closely matched installed equipment. Modifications effectively managed the addition of new bills of material (BOM) as well as the deletion of BOM data for removed equipment. Most plants continue to look for ways to proactively address obsolete equipment parts issues.
At TVA non-QA parts CAT IDs are processed by material analysts directly without help from engineering but all safety or quality parts go through Engineering. Additions and changes to the material catalog are limited to a finite set of individual through password security. The creation or change of table values (noun names, units of measure, descriptive attributes, etc.) in the catalog is limited to three individuals through password security.
2.7 Infrastructure
2.7.1 Logistics
2.7.2 IT tools are Integrated
Tools are standard across generating units
There is a common understanding that IT solutions have to be capable to manage the inventory, support purchasing and integrate with work management. Single IT platform is preferred and good supply chain organizations employ that to their advantage. Those organizations that employ two platforms are moving towards a single IT platform or contemplate to do so. One single IT solution enhance the strategic use of the system and result in improved efficiencies.
2.7.3 Industry Cooperation
All US sites were active members of the NSCSL. The NSCSL meets twice per year to share best practices, KPIs and arrange support for peer visist among the members for performing AP-908 self-assessments. The NSCSL also coordinates the activities of all other industry supply chain groups on behalf of industry chief nuclear officers.
2.8 Nuclear Core Process Support
Most of the visited sites had simpler supply chain processes aligned and stemmed from simpler station processes i.e. work management. Some of the examples are as follows: just in time delivery - do not stage parts for on line maintenance; simpler procurement process by minimizing handoffs and providing agreed target delivery
Filed: 2008-06-06 EB-2007-0905 J5.1 Attachment

Internal Use Only Document Number:
Report N-REP-08130-10003 Sheet Number: Revision: Page:
N/A R001 31 of 96 Title:
ONTARIO POWER GENERATION NUCLEAR SUPPLY CHAIN - 2006 BENCHMARKING REPORT
N-TMP-10010-R006X
dates. The level of approval has been reduced and rationalized and staff empowered to carry out the task for demand - material request to Purchase Order.
2.8.1 Work Management Support
Work Management is the driver for supply chain success in meeting parts demand. Planned work is about 80% of demand and unplanned work represents about 20% of demand. Optimizing the work management process results in an understanding of ongoing demand together with regular milestones where supply chain can demonstrate performance. The factors needed to achieve high capacity factors includes the following:
• Active participation in work management planning meetings
• Establishing accountability both ways when discussing lead-times and action item due dates
• Cross-functional awareness of all work management process relationships
• Clear communications on scheduled items and prompt updates when information changes
• Striving to meet plant needs and continually looking for ways to improve support methods
• Establishing mutual objectives whenever possible
• Facilitating accountability behaviors that flow both ways between plant staff and supply chain.
Site-specific examples include the following:
• Exelon is doing an Initiative to improve communication with supply chain called “Help Me Help You”. Also performance measures are structured to hold both plant staff and supply chain accountable for work activities.
• Quad Cities has a recognition process that consists of vouchers of $15 and $25 vouchers and ‘Lunch on Me’ given informally by the Supply Chain Manager for employees that have extended themselves with overtime worked etc.
• At Indian Point support for work management constitutes 100% of their assigned work
2.8.2 Equipment Reliability
Integrated maintenance strategies exist to align supply chain sourcing and inventory strategies. AP-913 is used as a guide to categorized plant equipment and set preventive maintenance program requirements. Program feedback is documented in the corrective action system. Preventive maintenance frequencies are validated in a
Filed: 2008-06-06 EB-2007-0905 J5.1 Attachment

Internal Use Only Document Number:
Report N-REP-08130-10003 Sheet Number: Revision: Page:
N/A R001 32 of 96 Title:
ONTARIO POWER GENERATION NUCLEAR SUPPLY CHAIN - 2006 BENCHMARKING REPORT
N-TMP-10010-R006X
continuous process. Predictive maintenance and condition monitoring are used as cost effective elements of equipment reliability. Life cycle management analysis sets in place an overall cost framework that shapes maintenance strategies. The maintenance strategy and plans are linked to timely identification of spare parts and services needs. This means that inventory is being used as an asset.
All sites have completed equipment reliability critical parts identification. Warehouse inventory supports preventive maintenance as well as critical failures.
2.8.3 Configuration Management
Creation of new CAT IDs is centralized. IT leverage is used when feasible.
2.8.4 Process Integration
Integration is accomplished through councils, meetings IT architecture and procedures. Work management is central to the overall integration methods.
3.0 SUPPLY CHAIN HIGH PERFORMANCE AREAS
This section summarizes and organizes methods to implement supply chain processes MS001 through MS006.
Most sites have made concerted attempts to simplify supply chain process in addition to aligning then to nuclear core processes. The industry has determined that simple processes improve supply chain efficiencies. Techniques include broad individual job roles, reducing levels of approval to that which is required to insure adequate levels of safety and to strive whenever possible to meet material and services demand the first time in accordance with work schedules. This is a business-oriented philosophy that supports high capacity factor operation as well as short outages.
With an inventory accuracy of near 99%, most utilities do not need to pre-stage material and which in turn results in less unnecessary transportation, material damage and loss of resources. Procurement Engineering is usually governed by a single administrative procedure. Work with the procedure is then segmented into a few key parts that correspond to job roles that foster efficiency and accountability. These job roles can also more attractive to highly trained professional because they can be more productive as well as justify a higher salary and incentives as compared to less skilled individual who has a reduced role. Additional information appears in the subsections below.
3.1 MS001 Provide Inventory Management
Inventory is an asset to plant operation because it adds value to the business. The supply chain maintains control of the inventory. One or more site departments act as the inventory owner. The type of material maintained in inventory is based on the
Filed: 2008-06-06 EB-2007-0905 J5.1 Attachment

Internal Use Only Document Number:
Report N-REP-08130-10003 Sheet Number: Revision: Page:
N/A R001 33 of 96 Title:
ONTARIO POWER GENERATION NUCLEAR SUPPLY CHAIN - 2006 BENCHMARKING REPORT
N-TMP-10010-R006X
strategic maintenance needs of the plant. The needs are driven by equipment reliability and specific maintenance approaches selected by the company. Items having a direct effect on reliability and critical spares are kept on-site or readily available within the supply chain network .The number of items required to be in inventory is carefully managed by material analysts or in some cases a site committee chartered with the decision process. The creation role for CAT IDs is strictly controlled and assigned to staff with knowledge and skills to perform the role. To prevent creep of inventory automated replenishment is carefully monitored or disabled entirely.
Tools fall in most of the cases under the Maintenance departments’ management. The tool cribs are being held in by the warehouse but the actual budget, management, maintenance and overall responsibility reside with the Maintenance department.
The inventory carrying cost at many plants is much lower than it was five years ago. This has occurred because a higher volume of material is being maintained and issued by a smaller warehouse staff and the amount of items returned is much lower. In addition supply chain is challenging customers prior to buying new material to determine if the demand is real and to see if the demand can be met in other ways.
Other advantages to improved inventory management are as follows:
• Reduction of transactions • Selecting the best cost alternative • Sole sourcing leading to cost reductions, less auditing, purchasing • Improved vendor relationship • Reduce vendor list • Opportunity for material standardization
Specific examples related to good inventory methods appear below.
At DCNPP quality assurance is also grouped under one role called “Quality Assurance Auditor” who performs source and receiving inspection and vendor auditing.
3.1.1 Inventory Accuracy
Inventory accuracy is very high at all sites. Specific details include the following:
• Quad Cities maintains inventory accuracy of 98.6%. The site follows a sampling cycle count process of 200 CAT ID’s monthly. Corporate Supply Chain supplies the list of items to be counted. This list does not include “zero bin counts” but they are added by the station in addition to the 200 items listed in the regular count. The warehouse staff performs counts and adjusts all cycle count records.
• AT DCNPP inventory accuracy is 99%, a level that justifies reduction of inventory validation requirements. They also employ a continuous cycle count process over a two-year period that ensures continued inventory accuracy.
Filed: 2008-06-06 EB-2007-0905 J5.1 Attachment

Internal Use Only Document Number:
Report N-REP-08130-10003 Sheet Number: Revision: Page:
N/A R001 34 of 96 Title:
ONTARIO POWER GENERATION NUCLEAR SUPPLY CHAIN - 2006 BENCHMARKING REPORT
N-TMP-10010-R006X
3.1.2 Returns Ratio
Low return ratio has been noted at the visited sites. This was due to well-tuned work management that allowed higher rate of schedule adherence all along the work management cycle. Another important enabler for low returns is the challenge process that allowed warehouse personnel to refuse returns unless a set of conditions was met i.e. high usage history, need for another planned work in the plant.
3.1.3 Inventory Carrying Cost
Inventory carrying costs varies from site to site from 9% to about 24%. The median return cost is below 15%. At Indian Point this is charged to the customer as a loader fee. The loader fee is used also as a tool to optimize the demand for materials and contingency material release.
3.1.4 Inventory Value
Site-specific observations about inventory value include the following:
• At TVA new items are placed in inventory only if they replace an existing item or if no item exists to satisfy the need. Prior to the procurement of inventory other TVA sites are searched for the potential transfer of the required material in lieu of purchasing. A structured decision process determines stocking levels based on item type, material usage, and an approval hierarchy. This process keeps the inventory value down and goes hand in hand with the TVA philosophy of “Best buy is no buy”.
• At TVA guidelines are established in the procedures that identify different stocking rules based on item type. This includes the establishment of new items, the review of stocking levels as part of the replenishment process, material for outages and DCN work, and the appropriate approval levels.
• TVA’s inventory management system includes an automated stocking algorithm that takes into account average unit priced, lead-time, usage history, outstanding demand, and schedules. This is used only as a guideline with the final determination made by the Material Analyst with input and/or approval of the appropriate management.
• At Cernavoda stock without movement in the last 24 months was analyzed to establish the min/max levels. For all the other stocked items min/max levels are analyzed every year and levels adjusted according to past usage.
• A similar practice exists also at other sites for stock other than critical parts as defined by local maintenance strategies.
Filed: 2008-06-06 EB-2007-0905 J5.1 Attachment
Internal Use Only Document Number:
Report N-REP-08130-10003 Sheet Number: Revision: Page:
N/A R001 35 of 96 Title:
ONTARIO POWER GENERATION NUCLEAR SUPPLY CHAIN - 2006 BENCHMARKING REPORT
N-TMP-10010-R006X
3.1.5 Inventory Management
Site specific details concerning inventory value is as follows:
TVA Inventory is categorized into the following Item Types: Critical Spare, Spare Part, Storm Restoration, Consumable and Bulk. The Item Type reflects
• The end use and frequency of use for the material and allows stocking policies to be tailored to the attributes of the material. The process allow for consistency among all sites. This provides a common understanding of the process that in turn facilitates the transfer of inventory in lieu of purchasing additional inventory.
• TVA planners put in material requests for main component and spare parts. The shops have a single point of contact that review the material requests and determine if there is an actual need. This reduces the return rate. They do not stage material and have a less than 1% material return rate.
3.2 MS002 Procure Materials
Five of the sites have procurement engineering (PE) as part of the engineering organization (either design engineering, equipment or component engineering). In one instance the PE function was integrated into the Supply Chain. At most of the sites procurement engineering perform the engineering function for both safety-related and non-safety related items. In one instance the non-safety-related purchases go directly to the buyer and there is no requirement for PE to be involved. Procurement specialists perform the function of material analyst, pre-screener and PE specialist. PE employs one level of check/verification to satisfy the nuclear safety principle of independent verification.
All sites use generic evaluation to some extent. Some of them have generic evaluations that cover up to 30% of the PE workload.
Another common element observed was that auto reorder function is selectively used on a case-by-case basis.
Site-specific observations about procurement of materials are as follows:
• There was a strong focus on procurement strategies at TVA. In one case the process for providing parts is selected via managed processes to optimize cost and delivery; material needs are reviewed and the best process for procurement is selected with upper management involvement. Groups of materials are selected, put out for tender and long term blanket orders are used. Range of materials could include nuclear valve vendors, but is mostly commodities at this time.
• There was a strong focus on procurement strategies at Exelon. Category Managers establish, monitor and manage through incentives a leveraged
Filed: 2008-06-06 EB-2007-0905 J5.1 Attachment
Internal Use Only Document Number:
Report N-REP-08130-10003 Sheet Number: Revision: Page:
N/A R001 36 of 96 Title:
ONTARIO POWER GENERATION NUCLEAR SUPPLY CHAIN - 2006 BENCHMARKING REPORT
N-TMP-10010-R006X
supplier area (category) with strategic contracts for materials or services for about three-year intervals. (Appendix M).
• At DCNPP they used historic outage information to help predict next outage requirements (resources, contractors, parts and services). Outages were supported by knowledgeable employees who had as much as 25 years of experience. Experienced stafsf were used to both predict and limit material demands for outages. There were predictable outage durations (22-32 days) and material demand was approx 8,000 parts per outage.
3.2.1 Procurement Engineering Function
The procurement engineering function could perform several of the following:
• Equivalency Evaluations • Create Stock Code (CAT ID) Descriptions based on Design Specifications • Respond to Buyer Inquiries Buyers related to Manufacturers • Disposition Material Receipt Discrepancies ("OSD&Ds") • Find replacement requirements for stock codes • Update Bills of Material • Update Master Equipment List • Arrange for repair of stocked items • Commercial Grade Dedication • Material Downgrades • All responses via electronic request system • Performance Measured by hard dollar savings-cost avoidance • Shelf Life Evaluations based on EPRI Guideline and OPEX • Vendor Manual Revision reviews • Establish-Maintain Max-Min-Emergency Stock Levels
Generally, most PE functions reported to engineering and one reported to engineering.
The ways PE was leveraged by most sites was by one or more of the following:
• Absorb as many engineering functions related to procurement as possible
• Maintain highly experience PE staff
• Delegate non-safety significant PE functions to material analysts. Material analysts generally follow Original Equipment Manufacturer (OEM) recommendations.)
• Align PE work with the plant work management and outage schedules.
Filed: 2008-06-06 EB-2007-0905 J5.1 Attachment

Internal Use Only Document Number:
Report N-REP-08130-10003 Sheet Number: Revision: Page:
N/A R001 37 of 96 Title:
ONTARIO POWER GENERATION NUCLEAR SUPPLY CHAIN - 2006 BENCHMARKING REPORT
N-TMP-10010-R006X
3.2.2 Procure Materials Cycle Time
The time it takes a site to arrange for delivery of service was minimized by establishing categories for blanket purchase orders by corporate buyers and then allowing the sites to execute releases against those blankets.
Site specifics are as follows:
• TVA uses leverage contracts to great advantage, with a strongly managed process, automation. There has been an enormous reduction in the supplier base by use of blanket orders about 67% of the time.
• Documented strategic procurement savings for the fiscal year ending September 30 were $20M, in 2005 and $9.9M in 2006. Leveraged contracts are negotiated and monitored at the corporate level.
• Each vendor can have two vendor numbers. One number is for QA work (with a Q in the name) and the other is for standard non-safety contracts. This is done such that the QA blanket orders will receive the proper QA review.
• TVA has a contract with GLOBAL INSIGHT, a company that provides market conditions and costs, to enable an economic rationality check for the prices being paid for items.
3.2.3 Outsourcing of Component Categories
All sites visited have programs or intend to have vendor managed inventory program for non-safety-related consumables, e.g. cleaning supplies, plumbing, tools.
Vendors may manage inventory at site or at their location. When managed on-site, the material is brought to the receiving area, stock keepers put this material aside and vendor representatives located on site pick up the material. The vendor stocks this material in the vendor managed storage area until requested.
Site specific examples are as follows:
• At Indian Point tools are managed by one vendor. When the tool room is low a request is sent to the vendor on site who delivers the material to the tool room. The vendor bills at the point of delivering which is the Tool Room. To get this started an arrangement was made to have the vendor buy existing inventory and then buy back what was needed over time. This represents a net inventory reduction and the vendor receives a premium for handling the tools.
3.2.4 Control of Inventory Creep
In more than one case supply chain is set up as a profit center and treats the site as a customer, and charge the customer fiscally responsible amounts (i.e. put in a surcharge on a CAT ID basis or charge o loader fee for issued materials). In case of
Filed: 2008-06-06 EB-2007-0905 J5.1 Attachment
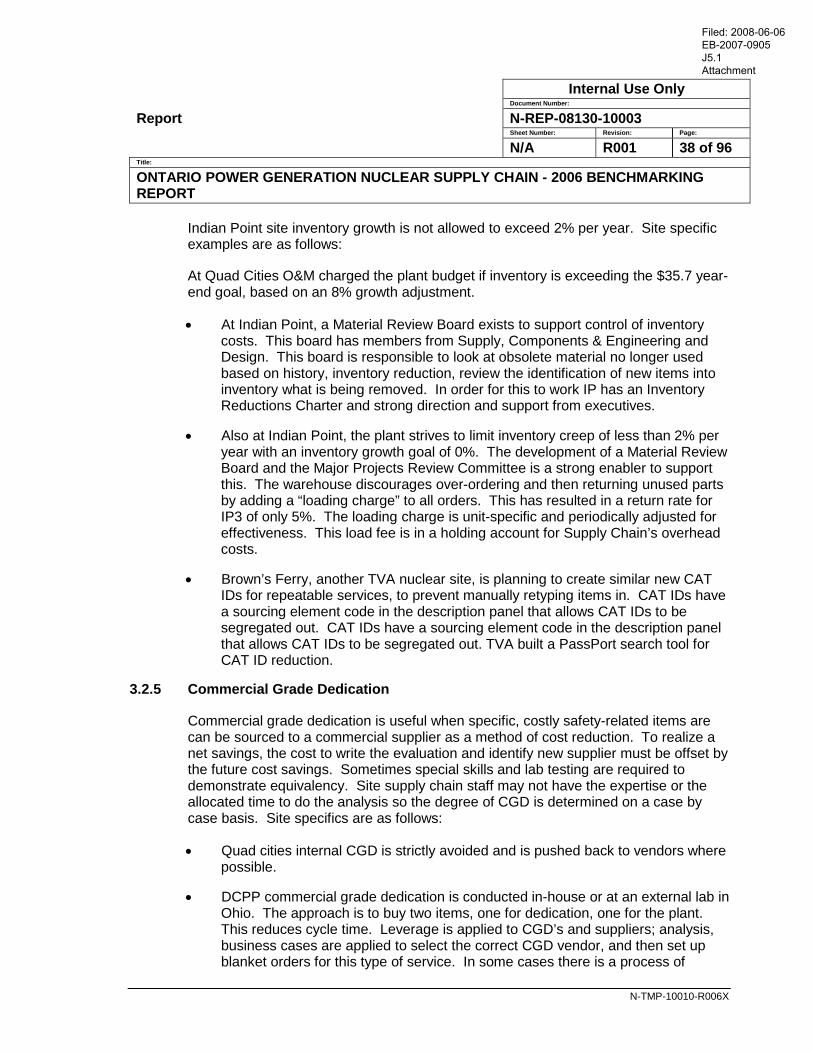
Internal Use Only Document Number:
Report N-REP-08130-10003 Sheet Number: Revision: Page:
N/A R001 38 of 96 Title:
ONTARIO POWER GENERATION NUCLEAR SUPPLY CHAIN - 2006 BENCHMARKING REPORT
N-TMP-10010-R006X
Indian Point site inventory growth is not allowed to exceed 2% per year. Site specific examples are as follows:
At Quad Cities O&M charged the plant budget if inventory is exceeding the $35.7 year-end goal, based on an 8% growth adjustment.
• At Indian Point, a Material Review Board exists to support control of inventory costs. This board has members from Supply, Components & Engineering and Design. This board is responsible to look at obsolete material no longer used based on history, inventory reduction, review the identification of new items into inventory what is being removed. In order for this to work IP has an Inventory Reductions Charter and strong direction and support from executives.
• Also at Indian Point, the plant strives to limit inventory creep of less than 2% per year with an inventory growth goal of 0%. The development of a Material Review Board and the Major Projects Review Committee is a strong enabler to support this. The warehouse discourages over-ordering and then returning unused parts by adding a “loading charge” to all orders. This has resulted in a return rate for IP3 of only 5%. The loading charge is unit-specific and periodically adjusted for effectiveness. This load fee is in a holding account for Supply Chain’s overhead costs.
• Brown’s Ferry, another TVA nuclear site, is planning to create similar new CAT IDs for repeatable services, to prevent manually retyping items in. CAT IDs have a sourcing element code in the description panel that allows CAT IDs to be segregated out. CAT IDs have a sourcing element code in the description panel that allows CAT IDs to be segregated out. TVA built a PassPort search tool for CAT ID reduction.
3.2.5 Commercial Grade Dedication
Commercial grade dedication is useful when specific, costly safety-related items are can be sourced to a commercial supplier as a method of cost reduction. To realize a net savings, the cost to write the evaluation and identify new supplier must be offset by the future cost savings. Sometimes special skills and lab testing are required to demonstrate equivalency. Site supply chain staff may not have the expertise or the allocated time to do the analysis so the degree of CGD is determined on a case by case basis. Site specifics are as follows:
• Quad cities internal CGD is strictly avoided and is pushed back to vendors where possible.
• DCPP commercial grade dedication is conducted in-house or at an external lab in Ohio. The approach is to buy two items, one for dedication, one for the plant. This reduces cycle time. Leverage is applied to CGD’s and suppliers; analysis, business cases are applied to select the correct CGD vendor, and then set up blanket orders for this type of service. In some cases there is a process of
Filed: 2008-06-06 EB-2007-0905 J5.1 Attachment

Internal Use Only Document Number:
Report N-REP-08130-10003 Sheet Number: Revision: Page:
N/A R001 39 of 96 Title:
ONTARIO POWER GENERATION NUCLEAR SUPPLY CHAIN - 2006 BENCHMARKING REPORT
N-TMP-10010-R006X
positive vendor recognition, using both score cards and a specifically picked team. Good performing vendors receive plaques and small reception is held.
3.3 MS003 Procure Services
Common to all the sites visited were the following:
• Services spend was over 70% of total spend
• A high percentage of services work was devoted to outage support
• Over a certain dollar value, a formal bidding price was required to acquire services as well as material.
Site specifics are as follows:
• At Indian Point the milestone date for identification of contractor needs for upcoming outages is three months ahead. Operating groups work with the vendor for the type of skills required to work on site. Meetings are held a few weeks prior to outage to identify expectations of the service provider. The site is very demanding of their vendors and puts pressure on them perform, at times for a premium.
• Indian Point has two people well versed in legal issues at White Plains, and a legal firm in New Orleans.
• At a certain point in the procurement phase business unit representative i.e. technical department evaluates the bids and grade them based on a set of criteria. The business units don’t get to see the price and the contract is not necessarily awarded to the lowest bidder.
Ways to leverage the procurement engineering in the services function are as follows:
• Assign PE services work by “Category”/Commodity Groups
• Establish strategic sourcing and pricing as a corporate function
• Allow the sites to spend against the categories and provide services feedback
• Reward high performing suppliers and be proactive in working with suppliers that require improvement.
3.3.1 Vendor Quality Management
Site specifics are as follows:
• DCNPP employs one job description that performs both audits and inspections. DCNPP tends to qualify all staff to the highest level of performance (audits) giving limited license along the way (receiving inspection). Quality Services
Filed: 2008-06-06 EB-2007-0905 J5.1 Attachment

Internal Use Only Document Number:
Report N-REP-08130-10003 Sheet Number: Revision: Page:
N/A R001 40 of 96 Title:
ONTARIO POWER GENERATION NUCLEAR SUPPLY CHAIN - 2006 BENCHMARKING REPORT
N-TMP-10010-R006X
reports into central QA (Corporate Risk Services) but generally behave as if they report into the station.
• NUPIC is used for 85 % of the qualifications and they accept other nuclear plant qualifications based on a survey of the audit. They do some contracting out but it is limited to the vendors not covered by NUPIC.
3.4 MS004 Provide Warehousing
3.4.1 Broaden Roles and Cross-Training
Site specifics are as follows:
• At DCNPP education and experience to execute jobs is related to the breadth of the role. These staff roles include engineering, operations, outage, warehousing, procurement and quality. Typically an employee recruited to these roles would have a four year university degree in supply chain management, quality engineering, industrial engineering or engineering science.
3.4.2 Efficient Receipt and Inspection
• At DCNPP they used historic outage information to help predict next outage requirements (resources, contractors, parts and services).
3.4.3 Reduce Need for Staging
3.4.4 Other Items
• Diablo will often package in groups by average unit of issue, and place a number of labels in the package if the material is issued individually.
• At Quad Cities a manual oil dispensing and filtration system adds value because of on reduced particle contamination
• At Quad City “Rolling racks” support inside steel shape storage. This is a very innovative very innovative and ergonomically easy way to operate and save space.
• Diablo has oil dispensing filtration system that adds value by reducing contamination; they also issue oil in one-time use containers of one gallon units that are labeled with the product name, warehouse label and with a shelf life of thirty days. This is very impressive reduction of oil-to-oil contamination. Oil companies do not guarantee particulate contamination free oil.
Filed: 2008-06-06 EB-2007-0905 J5.1 Attachment

Internal Use Only Document Number:
Report N-REP-08130-10003 Sheet Number: Revision: Page:
N/A R001 41 of 96 Title:
ONTARIO POWER GENERATION NUCLEAR SUPPLY CHAIN - 2006 BENCHMARKING REPORT
N-TMP-10010-R006X
3.4.5 Quality Control and Quality Assurance
• At Quad City, QC inspection do not have to add an Inspection labels to the material as the UTC and the material labels themselves lead to the inspection confirmation that is retained electronically in their work management IT systems.
• At Quad Cities all manufacturer shelf life chemicals recommendations are accepted as requirements.
• At DCNPP quality assurance is also grouped under one role called “Quality Assurance Auditor” who performs source and receiving inspection and vendor auditing.
3.5 MS005 Repairs, Refurbishment and Returns
The Repairs, Refurbishment and Returns process insures many key parts of the inventory will function as expected when they are needed in the plant. It supports the concept tat inventory is an asset.
Several sites had dedicated space for updating repair parts with new parts/equipment. The material was sent out for refurbishment and received back at repair cost.
All sites had working processes.
Site specifics include the following:
• Sequoyah has a strong repair process with maintenance strategy guides to repair/replace. Challenge teams work together to select the right process to provide workable parts to the plant. Sequoyah does not use the repair process within PassPort. The warehouse must receive approval to repair. This is a purchase order for an externally completed repair and a work order for internally completed repair, before accepting the item for repair.
• At Quad City repair evaluations are completed once only by PE. Their preference is to repair versus replace. There is a collaborative working relationship established among supply chain, maintenance and OEM. This enables effective stocking of replacement items.
• Returns at Indian Point are credited at the cost of repair. The initial cost to procure the part is charged to the site at time of issue and is not credited back when material is returned for repair.
• At DCNPP there are reduced process complexities in that material returns are completed by the warehouse staff including inspection activities; this means fewer handoffs to QC inspection. Backlogs of material return processing are very low.
Filed: 2008-06-06 EB-2007-0905 J5.1 Attachment
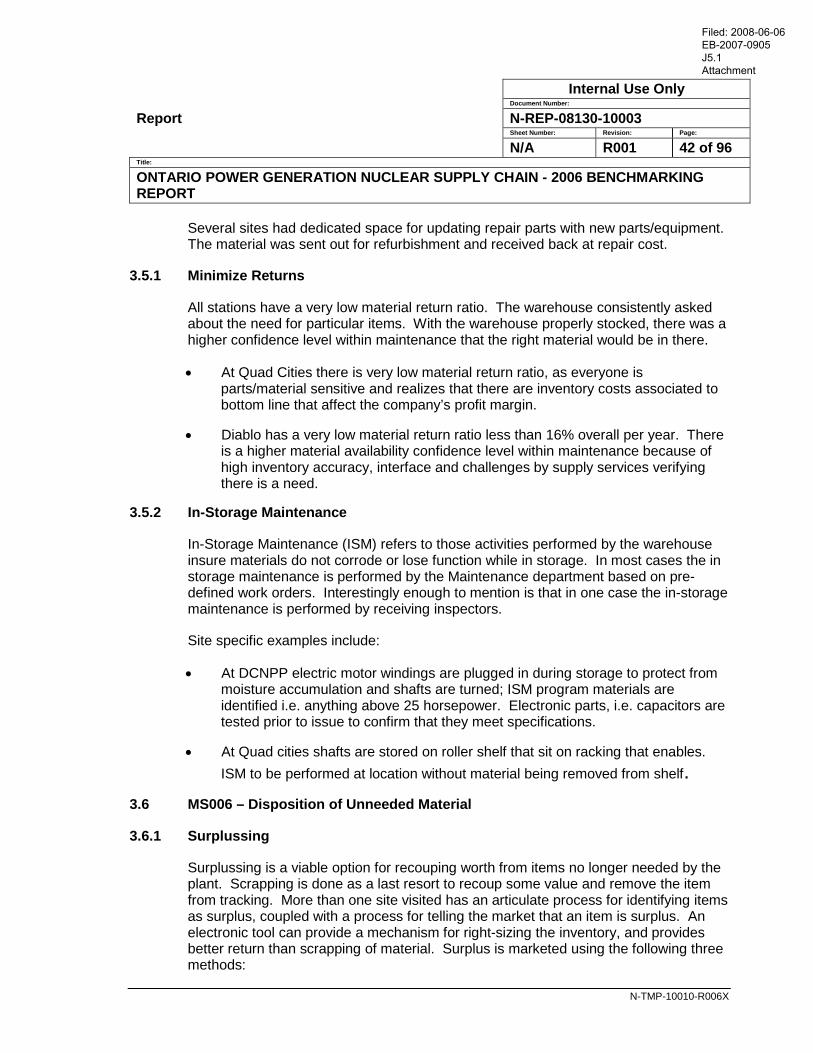
Internal Use Only Document Number:
Report N-REP-08130-10003 Sheet Number: Revision: Page:
N/A R001 42 of 96 Title:
ONTARIO POWER GENERATION NUCLEAR SUPPLY CHAIN - 2006 BENCHMARKING REPORT
N-TMP-10010-R006X
Several sites had dedicated space for updating repair parts with new parts/equipment. The material was sent out for refurbishment and received back at repair cost.
3.5.1 Minimize Returns
All stations have a very low material return ratio. The warehouse consistently asked about the need for particular items. With the warehouse properly stocked, there was a higher confidence level within maintenance that the right material would be in there.
• At Quad Cities there is very low material return ratio, as everyone is parts/material sensitive and realizes that there are inventory costs associated to bottom line that affect the company’s profit margin.
• Diablo has a very low material return ratio less than 16% overall per year. There is a higher material availability confidence level within maintenance because of high inventory accuracy, interface and challenges by supply services verifying there is a need.
3.5.2 In-Storage Maintenance
In-Storage Maintenance (ISM) refers to those activities performed by the warehouse insure materials do not corrode or lose function while in storage. In most cases the in storage maintenance is performed by the Maintenance department based on pre-defined work orders. Interestingly enough to mention is that in one case the in-storage maintenance is performed by receiving inspectors.
Site specific examples include:
• At DCNPP electric motor windings are plugged in during storage to protect from moisture accumulation and shafts are turned; ISM program materials are identified i.e. anything above 25 horsepower. Electronic parts, i.e. capacitors are tested prior to issue to confirm that they meet specifications.
• At Quad cities shafts are stored on roller shelf that sit on racking that enables. ISM to be performed at location without material being removed from shelf.
3.6 MS006 – Disposition of Unneeded Material
3.6.1 Surplussing
Surplussing is a viable option for recouping worth from items no longer needed by the plant. Scrapping is done as a last resort to recoup some value and remove the item from tracking. More than one site visited has an articulate process for identifying items as surplus, coupled with a process for telling the market that an item is surplus. An electronic tool can provide a mechanism for right-sizing the inventory, and provides better return than scrapping of material. Surplus is marketed using the following three methods:
Filed: 2008-06-06 EB-2007-0905 J5.1 Attachment

Internal Use Only Document Number:
Report N-REP-08130-10003 Sheet Number: Revision: Page:
N/A R001 43 of 96 Title:
ONTARIO POWER GENERATION NUCLEAR SUPPLY CHAIN - 2006 BENCHMARKING REPORT
N-TMP-10010-R006X
• Returned to the vendor for full value. • Sold back to the vendor for a percent of full value • Sold as surplus for some dollar amount.
Effective surplus practices dispositions material as soon as it is known to be surplus to get it off the books. Some companies provide a financial incentive to getting rid of surplus material to avoid government tax penalties (i.e. a 1% surcharge to the inventory owner) on the value of surplus stock. Most sites have an inventory recovery process that takes declared surplus material and tries to sell it first, but if it can’t, scraps the surplus quickly. Modifications or replacement of systems that resulted in material currently inventoried not being required, are funded in the project budget
3.6.2 Scientech RapidPartSmart
Several companies used Scientech RapidPartSmart effectively to locate shared inventory or buy parts form another company in the network. This product is owned by all North American nuclear generators. Several utility fleets leverage this tool for locating material and to also reduce inventory. (Appendix L).
3.6.3 Distributors
Several distributors will accept surplus material on consignment. These same distributors will also help identify buyers and sellers for consigned material and they can also be a salvage purchaser of unneeded items.
3.6.4 Other Surplus Disposal Methods
Unneeded material may also be sold through the internet on an item by item basis, sold to employees (example-personal computers) or sold in quantity through auction-type sales models.
3.7 MS Process Enablers
3.7.1 Training Programs
Most sites had effective MS training processes, desk-top job aides and employees were encouraged to attain MS-related professional qualifications (example: Certified Purchasing Manager (CPM)).
3.7.2 Outage Jobs as Employee Development
Temporary “Outage Jobs” can be a powerful tool for employee development. Personnel can be reassigned from other sites not doing an outage and placed in the outage organization or the supply organization and used in a capacity that increases their job knowledge and experience. Outage jobs also let the employee see what the host department is like with a new perspective.
Filed: 2008-06-06 EB-2007-0905 J5.1 Attachment

Internal Use Only Document Number:
Report N-REP-08130-10003 Sheet Number: Revision: Page:
N/A R001 44 of 96 Title:
ONTARIO POWER GENERATION NUCLEAR SUPPLY CHAIN - 2006 BENCHMARKING REPORT
N-TMP-10010-R006X
3.7.3 Cross-Training Outside MS Processes
Supply chain personnel in functions such as procurement can benefit from a wide variety of work experiences. This cross-training can be positively reinforced by management through workforce planning and formal rotation and exchange programs.
Many supply chain functions can become more valuable when the staff gain a deep appreciation for work management, equipment reliability and configuration management processes.
At Diablo Canyon the knowledge base is outstanding. Personnel are very strong base knowledge and have the appropriate training for warehouse operations and material requirements. They also are capable to apply for outage work duties; there by resource loading for an outage is shared by all departments not just contract trades and maintenance. Diablo is very good at identifying courses offered outside at community colleges that are associated to Supply Chain operations, and help defer costs when personnel complete the course.
4.0 PROCESS MAP AND KEY PERFORMANCE MEASURES
A process is defined as a sequence of behaviors or series of steps designed to produce a product or service. These are tangible structures established to direct the behavior of individuals in a predictable, repeatable fashion as they perform various tasks. A process map is a tool to describe the scope, core activities, conditions, and relationships of a particular process. It consists of a process diagram and words describing the process steps.
4.1 AP-908 Process Maps
AP-908 provides a three-level process description for all industry recognized supply chain processes. The Level I chart appears below as Figure 4-1. There are also flow charts for each Level II process, for example MS001, Inventory Management. Finally Level III chapters discuss each Level II step along with more detailed considerations.
Filed: 2008-06-06 EB-2007-0905 J5.1 Attachment
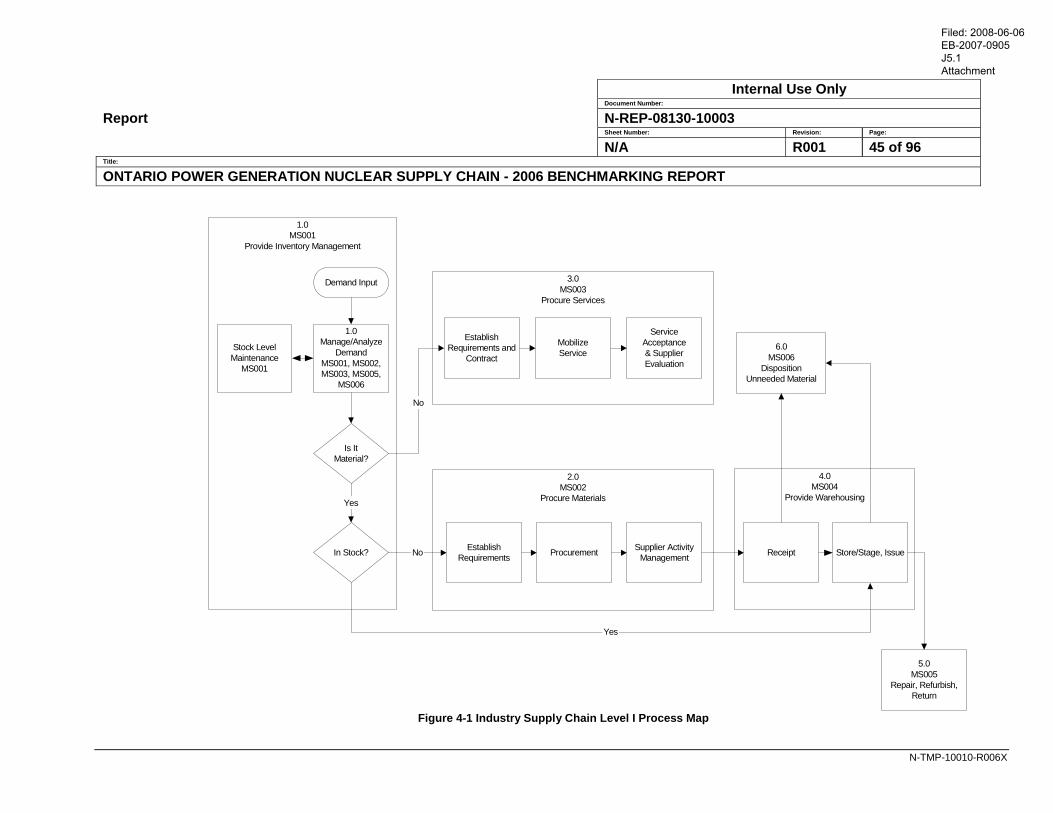
Internal Use Only Document Number:
Report N-REP-08130-10003 Sheet Number: Revision: Page:
N/A R001 45 of 96 Title:
ONTARIO POWER GENERATION NUCLEAR SUPPLY CHAIN - 2006 BENCHMARKING REPORT
N-TMP-10010-R006X
Figure 4-1 Industry Supply Chain Level I Process Map
4.0MS004
Provide Warehousing
3.0MS003
Procure Services
2.0MS002
Procure Materials
1.0MS001
Provide Inventory Management
Demand Input
1.0Manage/Analyze
DemandMS001, MS002,MS003, MS005,
MS006
Is ItMaterial?
EstablishRequirements and
Contract
5.0MS005
Repair, Refurbish,Return
In Stock?
ServiceAcceptance& SupplierEvaluation
6.0MS006
DispositionUnneeded Material
Receipt
Stock LevelMaintenance
MS001
Store/Stage, Issue
No
Yes
Yes
EstablishRequirements Procurement Supplier Activity
Management
MobilizeService
No
Filed: 2008-06-06 EB-2007-0905 J5.1 Attachment

Internal Use Only Document Number:
Report N-REP-08130-10003 Sheet Number: Revision: Page:
N/A R001 46 of 96 Title:
ONTARIO POWER GENERATION NUCLEAR SUPPLY CHAIN - 2006 BENCHMARKING REPORT
N-TMP-10010-R006X
4.2 OPGN Process Maps
In 2006, OPGN mapped Supply Chain “As-is” processes. These are listed below to show how they fit compare with AP-908 process categories.
Table 4-1 OPGN Supply Chain Process Map Cross-Reference Table
MS001 Inventory Management Inventory Analysis - ERN ROP/TMAX Inventory Certification MS002 Procure Materials MEL/BOM - New EC Process Prescreening/PE Evaluations Requisition & PO - Preparation & Award Approved Suppliers List & Approved Suppliers List - New Item Approved Manufactures List Obsolescence Source Surveillance Sourcing & Contract Management for Engineered Materials MS003 Provide Services Service Provider- Contract Management MS004 Provide Warehousing Receipt Inspection Receiving Pick Stage & Issue PB Material Release Process Cycle Count In-Storage Maintenance Trace Change Shelf Life Q Level Change MS005 Repairs, Returns, Refurbishments Material Repair Material Return - Vendor Return - OSDD OSDD Shipping MS006 Disposal of Unneeded Materials Disposition of Material Surplus Material
Filed: 2008-06-06 EB-2007-0905 J5.1 Attachment

Internal Use Only Document Number:
Report N-REP-08130-10003 Sheet Number: Revision: Page:
N/A R001 47 of 96 Title:
ONTARIO POWER GENERATION NUCLEAR SUPPLY CHAIN - 2006 BENCHMARKING REPORT
N-TMP-10010-R006X
4.3 TERMINOLOGY AND ACRONYMS
Key definitions are included in Appendix O, Glossary of Terms.
4.4 Performance Measures
AP-908 lists recommended industry-wide performance measures called Key Performance Measures (KPIs).
Table 4-2 summarizes KPIs for most of the companies visited. These are standard KPIS collected by NSCSL.
Table 4-2 NSCSL Key Performance Measures
Industry KPI Title PG&E Entergy Exelon TVA Total Cost of Process $5.3M $13M $35M $12M Total Value of Pos Placed $135M $70M $217M $135M PO Value/Total Cost $26.00 $6.00 $8.00 $12.00 Fleet Inventory Value/Plant $82M $40M $30M $30M Fleet Field Issue to Returns Ratio by Item 12% 12% 13% 13% Fleet Inventory Creep/Plant/Year $1.8M $2M $2M $1.8M Fleet Non-outage Material Availability 99.8% 97.5% 98.8% 97.5% Percent Emergent Orders (new in 2007) NA NA NA NA
Table 4-3 summarizes supply chain performance measures compiled from high performing nuclear plants.
Appendix B Site profile charts identify additional performance data for comparison purposes.
Appendix B also provides several “Typical” Organization charts. High performing larger organizations can achieve greater efficiency by centralizing policy and other corporate roles. Single site “Typical” organization charts illustrate the minimum functions seen by a two-unit nuclear site and can be composed of up to about 45 personnel. Multi-site organizations leave basic supply chain functions at each site and provide those services with about 30-35 personnel.
Filed: 2008-06-06 EB-2007-0905 J5.1 Attachment

Internal Use Only Document Number:
Report N-REP-08130-10003 Sheet Number: Revision: Page:
N/A R001 48 of 96 Title:
ONTARIO POWER GENERATION NUCLEAR SUPPLY CHAIN - 2006 BENCHMARKING REPORT
N-TMP-10010-R006X
Table 4-3 Existing Supply Chain Performance Measures
KPI UnitsCalculation (-- means no calculation required; raw number used) Definitions, Explanations, and Directions
Average Age of Material Requisitions in Workload Days -- [note: can be compared across groups] Average Age of PE Evaluations Days -- PE = Procurement EngineeringAverage Number of Material Requisitions in Workload Days -- [note: can be compared across groups] Average Number of PE Evaluations Days -- PE = Procurement EngineeringAverage Supply Chain Lead Time Days (date part needed) - (date request is received) Average (weighted) over all critical partsCycle Time of Materials Request Days (date material requested) - (date order placed) Time Required to Complete Service Request Days --Annual Cost of End-of-Shelf-Life Disposal Dollars --Cost of Shelf Life and Stock Rotation Plan Dollars ROI for investment recovery Calculation/metrics may differ from site to siteAnnual Demand Validity Number total number of requisitions voided, canceled, or deferredAnnual Reorder Frequency Number total number of periodic reordersAnnual Stock Min/Max Changes
Number total number of adjustments to min/max levels Average Budget Exceedance Percentage Percent
Demand Quality Factor Percent(number of requisitions on hold for additional information)/(total requisitions)
On-Time Parts Availability Percent (number of on-time parts deliveries)/(all parts deliveries)
PE Performance to Target Percent(number of PE evaluations completed before or on commitment date)/(total number of PE evaluations) PE = Procurement Engineering
Percent of Issued Material Returned to Stock (Annual) Percent(measure of issued material returned to stock [$ value, item count]/measure of total issued material)
Percentage of Supplier/Contractor Work Completed On-Budget Percent
(number of projects completed on-budget)/(total number of projects)
Receiving Discrepancy Ratio Percent (total receiving discrepancies)/(total items received)
Scheduling Effectiveness Percent(number of holds at freeze date)/(number of holds at cutoff date for material identification)
Inventory Growth Factor Ratio(quantity of items issued - quantity of items returned)/(quantity of items receipted)
Return Efficiency Ratio (total units returned)/(total units issued) Stock Code Growth Factor Percent (total number of new stock codes created between T0 Maintenance Rule Performance Indicators (none)
Equipment-Related LERs or Significant Events Number/year(total number of LER/SE related to ER over X year period/ number of years in period)
Percentage of Equipment-Related Root Causes and Corrective Actions Reviewed Percent (items reviewed in period)/(total items in period)
Should typically include repeat failures and consistency of engineering effort and quality
Percentage of Systems in Accelerated Testing Percent (systems in accelerated testing)/(total number of systems)Use of percentage rather than count intended to avoid inconsistencies across plants due to definition of "system"
Filed: 2008-06-06 EB-2007-0905 J5.1 Attachment

Internal Use Only Document Number:
Report N-REP-08130-10003 Sheet Number: Revision: Page:
N/A R001 49 of 96 Title:
ONTARIO POWER GENERATION NUCLEAR SUPPLY CHAIN - 2006 BENCHMARKING REPORT
N-TMP-10010-R006X
Appendix A: Site Selection Process
Benchmark site selection was made based on existing 2004-2005 KPI’s and site visit availability. Several visits were coordinated through the NSCSL Executive Steering Team. The following KPI’s were used to develop candidate plants
• $/PO Cost • Inventory Value • Return to inventory ratio both item and dollar value • Inventory creep • Non-outage material availability
Based on KPI results and after preliminary discussions with potential candidates the following utilities were selected: Progress Energy, PG&E, Entergy Northeast, TVA, Exelon, and Duke.
Due to fall outage schedule conflicting with some OPGN proposed visit dates, the following U.S. sites were ultimately selected:
• Diablo Canyon • Indian Point • Sequoyah • Quad Cities
Additional CANDU international sites were contacted for data exchange purposes. Two international plants were visited.
• Cernavoda • MAPS
Site summaries are provided in Section 1. Site profiles appear in Appendix B.
Filed: 2008-06-06 EB-2007-0905 J5.1 Attachment
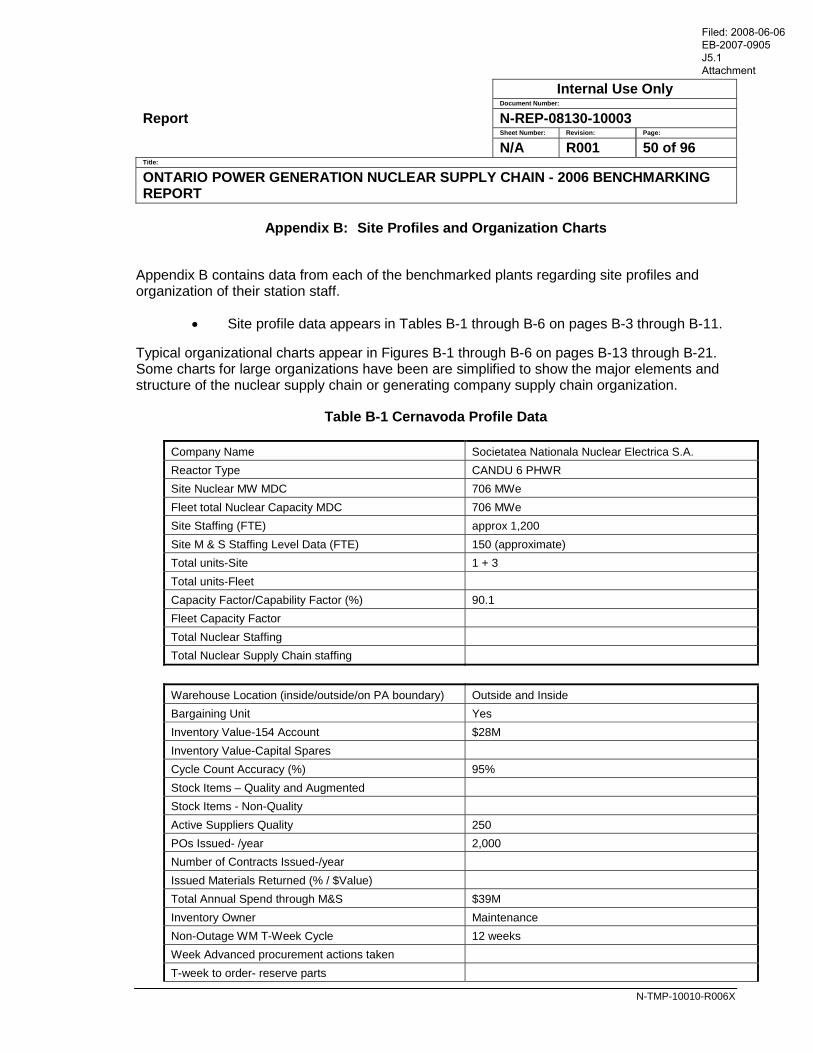
Internal Use Only Document Number:
Report N-REP-08130-10003 Sheet Number: Revision: Page:
N/A R001 50 of 96 Title:
ONTARIO POWER GENERATION NUCLEAR SUPPLY CHAIN - 2006 BENCHMARKING REPORT
N-TMP-10010-R006X
Appendix B: Site Profiles and Organization Charts
Appendix B contains data from each of the benchmarked plants regarding site profiles and organization of their station staff.
• Site profile data appears in Tables B-1 through B-6 on pages B-3 through B-11.
Typical organizational charts appear in Figures B-1 through B-6 on pages B-13 through B-21. Some charts for large organizations have been are simplified to show the major elements and structure of the nuclear supply chain or generating company supply chain organization.
Table B-1 Cernavoda Profile Data
Company Name Societatea Nationala Nuclear Electrica S.A. Reactor Type CANDU 6 PHWR Site Nuclear MW MDC 706 MWe Fleet total Nuclear Capacity MDC 706 MWe Site Staffing (FTE) approx 1,200 Site M & S Staffing Level Data (FTE) 150 (approximate) Total units-Site 1 + 3 Total units-Fleet Capacity Factor/Capability Factor (%) 90.1 Fleet Capacity Factor Total Nuclear Staffing Total Nuclear Supply Chain staffing
Warehouse Location (inside/outside/on PA boundary) Outside and Inside Bargaining Unit Yes Inventory Value-154 Account $28M Inventory Value-Capital Spares Cycle Count Accuracy (%) 95% Stock Items – Quality and Augmented Stock Items - Non-Quality Active Suppliers Quality 250 POs Issued- /year 2,000 Number of Contracts Issued-/year Issued Materials Returned (% / $Value) Total Annual Spend through M&S $39M Inventory Owner Maintenance Non-Outage WM T-Week Cycle 12 weeks Week Advanced procurement actions taken T-week to order- reserve parts
Filed: 2008-06-06 EB-2007-0905 J5.1 Attachment
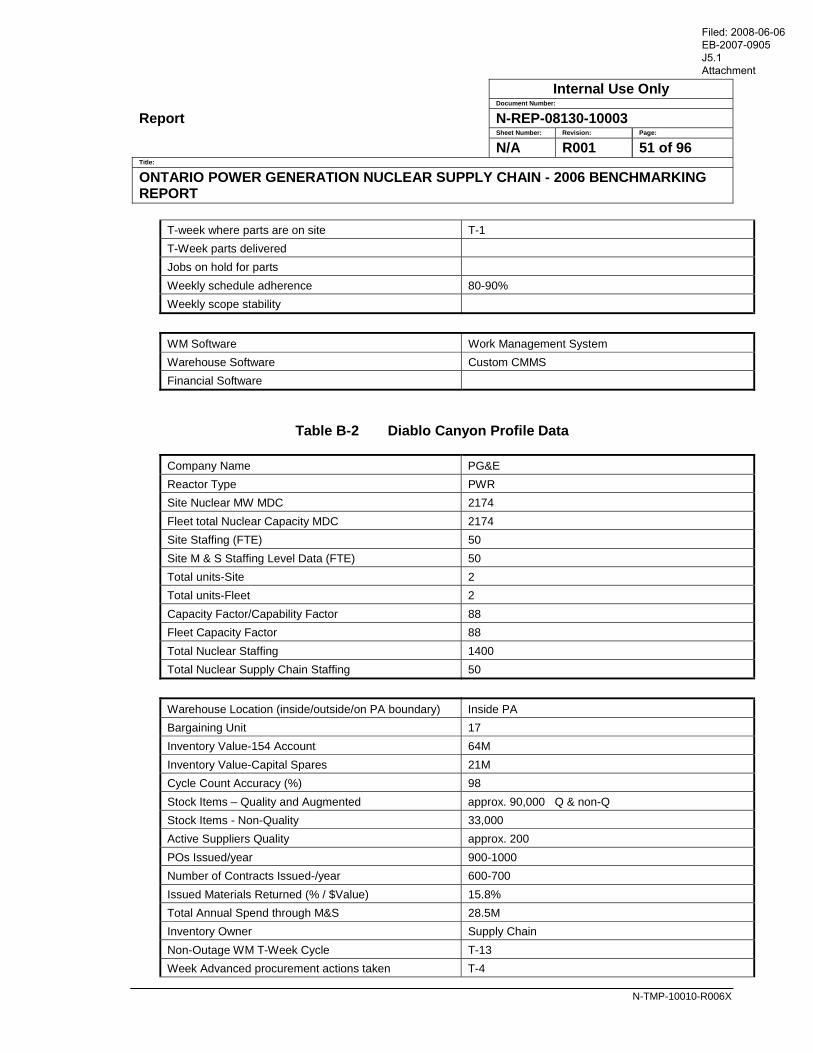
Internal Use Only Document Number:
Report N-REP-08130-10003 Sheet Number: Revision: Page:
N/A R001 51 of 96 Title:
ONTARIO POWER GENERATION NUCLEAR SUPPLY CHAIN - 2006 BENCHMARKING REPORT
N-TMP-10010-R006X
T-week where parts are on site T-1 T-Week parts delivered Jobs on hold for parts Weekly schedule adherence 80-90% Weekly scope stability
WM Software Work Management System Warehouse Software Custom CMMS Financial Software
Table B-2 Diablo Canyon Profile Data
Company Name PG&E Reactor Type PWR Site Nuclear MW MDC 2174 Fleet total Nuclear Capacity MDC 2174 Site Staffing (FTE) 50 Site M & S Staffing Level Data (FTE) 50 Total units-Site 2 Total units-Fleet 2 Capacity Factor/Capability Factor 88 Fleet Capacity Factor 88 Total Nuclear Staffing 1400 Total Nuclear Supply Chain Staffing 50
Warehouse Location (inside/outside/on PA boundary) Inside PA Bargaining Unit 17 Inventory Value-154 Account 64M Inventory Value-Capital Spares 21M Cycle Count Accuracy (%) 98 Stock Items – Quality and Augmented approx. 90,000 Q & non-Q Stock Items - Non-Quality 33,000 Active Suppliers Quality approx. 200 POs Issued/year 900-1000 Number of Contracts Issued-/year 600-700 Issued Materials Returned (% / $Value) 15.8% Total Annual Spend through M&S 28.5M Inventory Owner Supply Chain Non-Outage WM T-Week Cycle T-13 Week Advanced procurement actions taken T-4
Filed: 2008-06-06 EB-2007-0905 J5.1 Attachment

Internal Use Only Document Number:
Report N-REP-08130-10003 Sheet Number: Revision: Page:
N/A R001 52 of 96 Title:
ONTARIO POWER GENERATION NUCLEAR SUPPLY CHAIN - 2006 BENCHMARKING REPORT
N-TMP-10010-R006X
T-week to order- reserve parts T-8 T-week where parts are on site T-10 T-Week parts delivered T-3 Jobs on hold for parts Re-schedule Weekly schedule adherence 85% Weekly scope stability 89%
WM Software PIMS Warehouse Software SAP Financial Software SAP
Table B-3 MAPS Profile Data
Company Name Nuclear Power Corporation of India, Ltd Reactor Type CANDU Site Nuclear MW MDC 2 units at 220 MWe each Fleet total Nuclear Capacity MDC 3,600 Site Staffing (FTE) approx. 900 Site M & S Staffing Level Data (FTE) TBD-(portion of Maint/WH/Eng Total units-Site 2 to 4 Total units-Fleet 14 Capacity Factor/Capability Factor 90 Fleet Capacity Factor 90.6 Total Nuclear Staffing TBD Total Nuclear Supply Chain staffing TBD
Warehouse Location Inside PA boundary Bargaining Unit Craft only Inventory Value-154 Account $5M Inventory Value-Capital Spares TBD Cycle Count Accuracy (%) Very high Stock Items – Quality and Augmented 20,000 Stock Items - Non-Quality TBD Active Suppliers Quality 300 POs Issued- /year 1,200 Number of Contracts Issued-/year TBD Issued Materials Returned (% / $Value) Very low Total Annual Spend through M&S TBD Inventory Owner Maintenance Non-Outage WM T-Week Cycle 4 weeks
Filed: 2008-06-06 EB-2007-0905 J5.1 Attachment
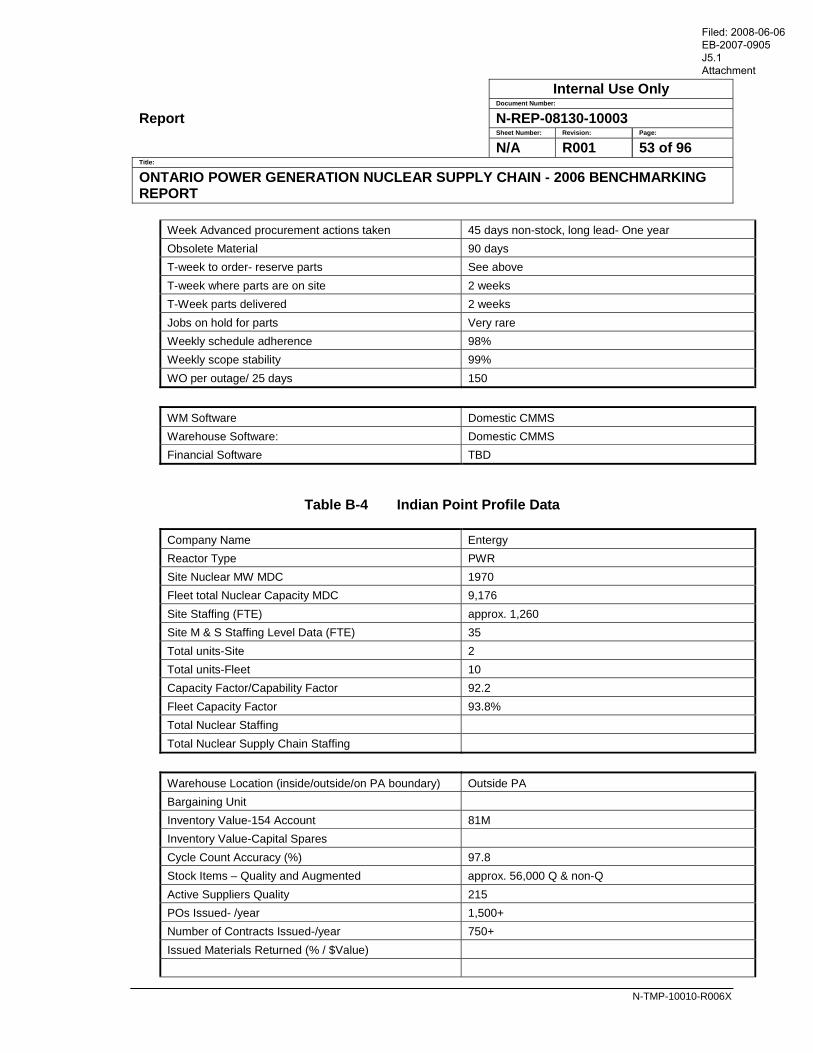
Internal Use Only Document Number:
Report N-REP-08130-10003 Sheet Number: Revision: Page:
N/A R001 53 of 96 Title:
ONTARIO POWER GENERATION NUCLEAR SUPPLY CHAIN - 2006 BENCHMARKING REPORT
N-TMP-10010-R006X
Week Advanced procurement actions taken 45 days non-stock, long lead- One year Obsolete Material 90 days T-week to order- reserve parts See above T-week where parts are on site 2 weeks T-Week parts delivered 2 weeks Jobs on hold for parts Very rare Weekly schedule adherence 98% Weekly scope stability 99% WO per outage/ 25 days 150
WM Software Domestic CMMS Warehouse Software: Domestic CMMS Financial Software TBD
Table B-4 Indian Point Profile Data
Company Name Entergy Reactor Type PWR Site Nuclear MW MDC 1970 Fleet total Nuclear Capacity MDC 9,176 Site Staffing (FTE) approx. 1,260 Site M & S Staffing Level Data (FTE) 35 Total units-Site 2 Total units-Fleet 10 Capacity Factor/Capability Factor 92.2 Fleet Capacity Factor 93.8% Total Nuclear Staffing Total Nuclear Supply Chain Staffing
Warehouse Location (inside/outside/on PA boundary) Outside PA Bargaining Unit Inventory Value-154 Account 81M Inventory Value-Capital Spares Cycle Count Accuracy (%) 97.8 Stock Items – Quality and Augmented approx. 56,000 Q & non-Q Active Suppliers Quality 215 POs Issued- /year 1,500+ Number of Contracts Issued-/year 750+ Issued Materials Returned (% / $Value)
Filed: 2008-06-06 EB-2007-0905 J5.1 Attachment
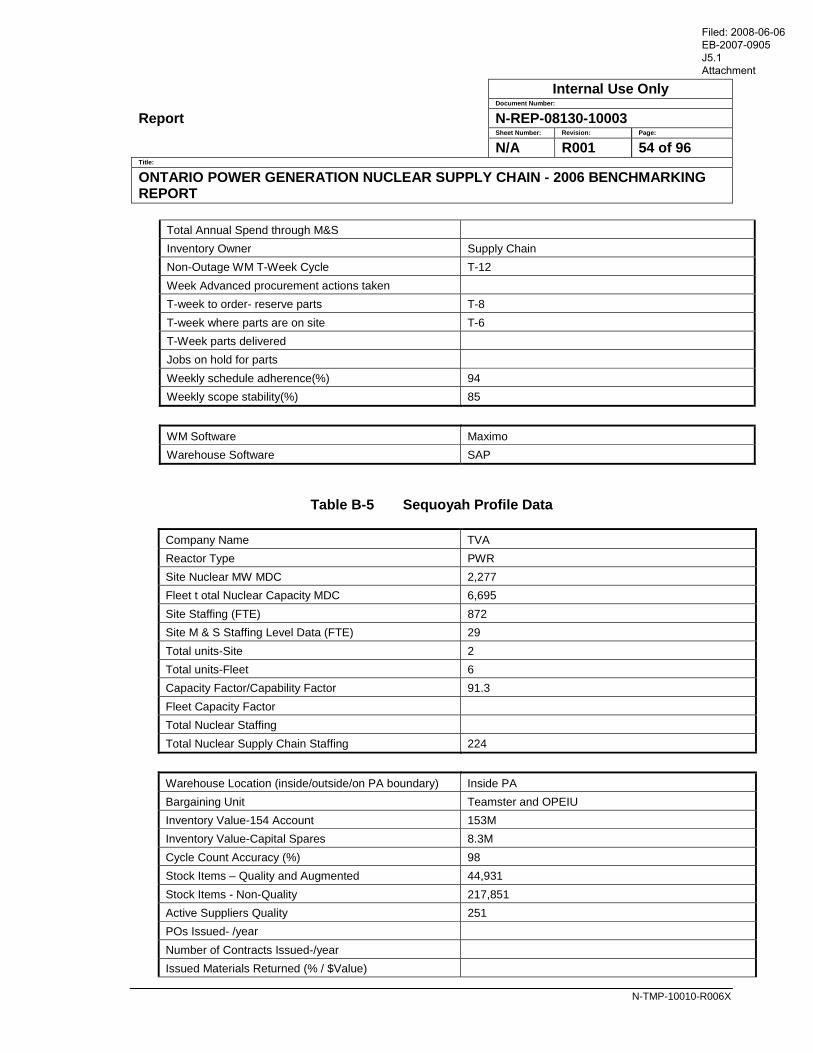
Internal Use Only Document Number:
Report N-REP-08130-10003 Sheet Number: Revision: Page:
N/A R001 54 of 96 Title:
ONTARIO POWER GENERATION NUCLEAR SUPPLY CHAIN - 2006 BENCHMARKING REPORT
N-TMP-10010-R006X
Total Annual Spend through M&S Inventory Owner Supply Chain Non-Outage WM T-Week Cycle T-12 Week Advanced procurement actions taken T-week to order- reserve parts T-8 T-week where parts are on site T-6 T-Week parts delivered Jobs on hold for parts Weekly schedule adherence(%) 94 Weekly scope stability(%) 85
WM Software Maximo Warehouse Software SAP
Table B-5 Sequoyah Profile Data
Company Name TVA Reactor Type PWR Site Nuclear MW MDC 2,277 Fleet t otal Nuclear Capacity MDC 6,695 Site Staffing (FTE) 872 Site M & S Staffing Level Data (FTE) 29 Total units-Site 2 Total units-Fleet 6 Capacity Factor/Capability Factor 91.3 Fleet Capacity Factor Total Nuclear Staffing Total Nuclear Supply Chain Staffing 224
Warehouse Location (inside/outside/on PA boundary) Inside PA Bargaining Unit Teamster and OPEIU Inventory Value-154 Account 153M Inventory Value-Capital Spares 8.3M Cycle Count Accuracy (%) 98 Stock Items – Quality and Augmented 44,931 Stock Items - Non-Quality 217,851 Active Suppliers Quality 251 POs Issued- /year Number of Contracts Issued-/year Issued Materials Returned (% / $Value)
Filed: 2008-06-06 EB-2007-0905 J5.1 Attachment

Internal Use Only Document Number:
Report N-REP-08130-10003 Sheet Number: Revision: Page:
N/A R001 55 of 96 Title:
ONTARIO POWER GENERATION NUCLEAR SUPPLY CHAIN - 2006 BENCHMARKING REPORT
N-TMP-10010-R006X
Total Annual Spend through M&S $565M Inventory Owner Maintenance Non-Outage WM T-Week Cycle T-16 Week Advanced procurement actions taken T-week to order- reserve parts T-week where parts are on site T-Week parts delivered Jobs on hold for parts Weekly schedule adherence (%) Weekly scope stability (%)
WM Software EMPAC (Indus) Warehouse Software PassPort
Table B-6 Quad Cities Profile Data
Company Name Exelon Reactor Type BWR Site Nuclear MW MDC 1734 Fleet total Nuclear Capacity MDC 17300 Site Staffing (FTE) 706 Site M & S Staffing Level Data (FTE) 28 Total units-Site 2 Total units-Fleet 17 Capacity Factor/Capability Factor 94 Fleet Capacity Factor Total Nuclear Staffing Total Nuclear Supply Chain Staffing
Warehouse Location (inside/outside/on PA boundary) Outside PA Bargaining Unit IBEW Inventory Value-154 Account $34M Inventory Value-Capital Spares Cycle Count Accuracy (%) 98.6 Stock Items – Quality and Augmented 13,414 Stock Items - Non-Quality 45,052 Active Suppliers Quality 212 POs Issued- /year 11,000 Number of Contracts Issued-/year 748 Issued Materials Returned (% / $Value) 21% / 6.9M
Filed: 2008-06-06 EB-2007-0905 J5.1 Attachment
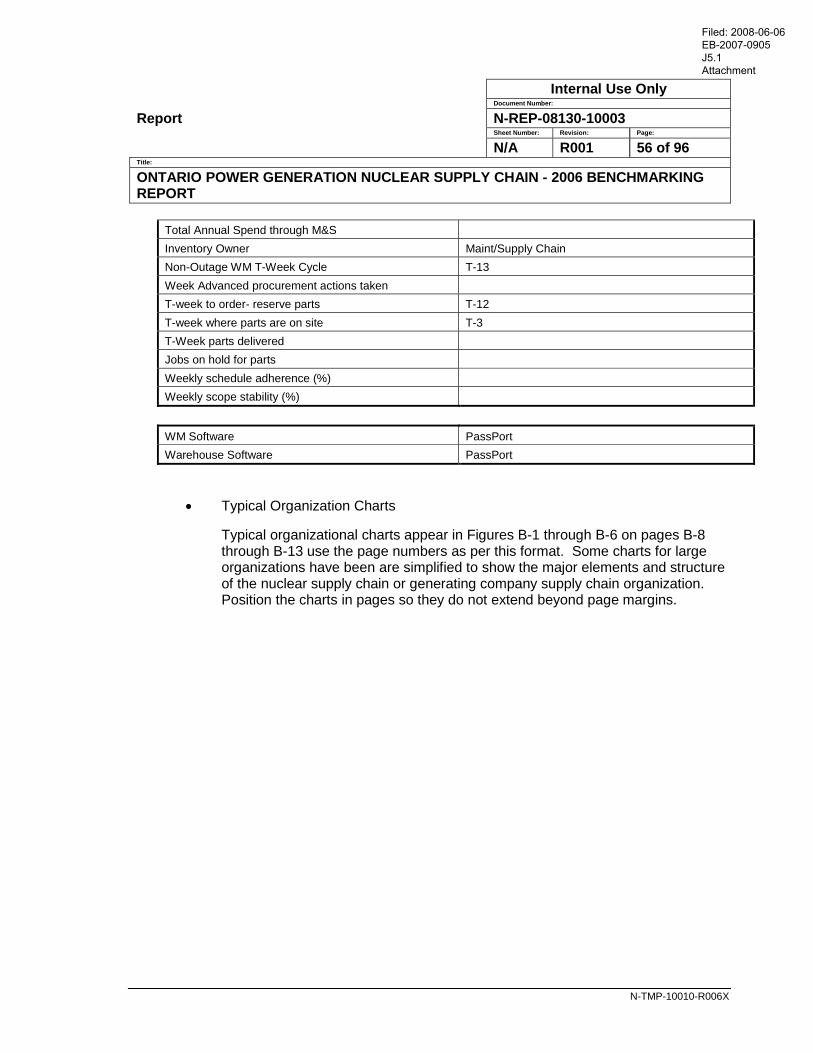
Internal Use Only Document Number:
Report N-REP-08130-10003 Sheet Number: Revision: Page:
N/A R001 56 of 96 Title:
ONTARIO POWER GENERATION NUCLEAR SUPPLY CHAIN - 2006 BENCHMARKING REPORT
N-TMP-10010-R006X
Total Annual Spend through M&S Inventory Owner Maint/Supply Chain Non-Outage WM T-Week Cycle T-13 Week Advanced procurement actions taken T-week to order- reserve parts T-12 T-week where parts are on site T-3 T-Week parts delivered Jobs on hold for parts Weekly schedule adherence (%) Weekly scope stability (%)
WM Software PassPort Warehouse Software PassPort
• Typical Organization Charts
Typical organizational charts appear in Figures B-1 through B-6 on pages B-8 through B-13 use the page numbers as per this format. Some charts for large organizations have been are simplified to show the major elements and structure of the nuclear supply chain or generating company supply chain organization. Position the charts in pages so they do not extend beyond page margins.
Filed: 2008-06-06 EB-2007-0905 J5.1 Attachment
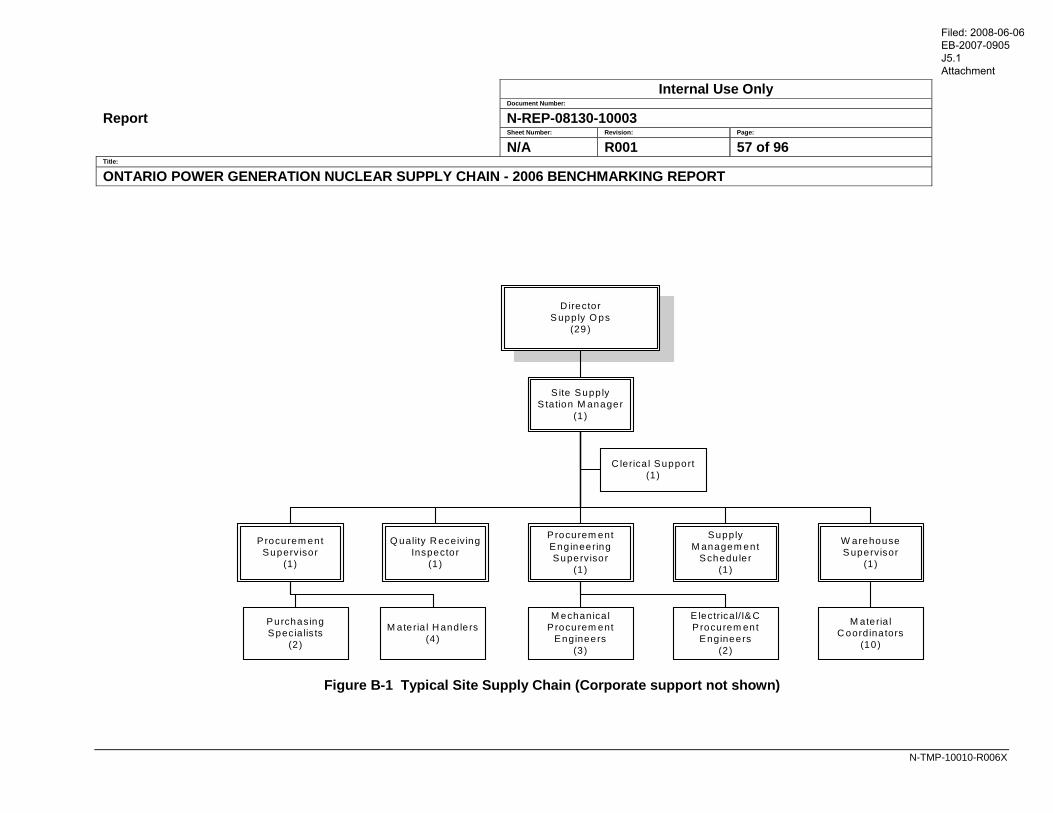
Internal Use Only Document Number:
Report N-REP-08130-10003 Sheet Number: Revision: Page:
N/A R001 57 of 96 Title:
ONTARIO POWER GENERATION NUCLEAR SUPPLY CHAIN - 2006 BENCHMARKING REPORT
N-TMP-10010-R006X
D irectorS upp ly O ps
(29 )
S ite Supp lyS tation M anager
(1 )
C lerica l Support(1)
P rocurem ent Eng ineering Supervisor
(1 )
Supply M anagem ent
Schedu ler(1 )
Q uality R eceiving Inspector
(1 )
W arehouse S upervisor
(1 )
P rocurem ent Superv isor
(1)
Purchasing Spec ia lis ts
(2)
M ateria l H and lers(4)
M echan ica l P rocurem ent
Engineers(3)
E lectrical/I& C P rocurem ent
Engineers(2)
M ateria l C oordina tors
(10)
Figure B-1 Typical Site Supply Chain (Corporate support not shown)
Filed: 2008-06-06 EB-2007-0905 J5.1 Attachment
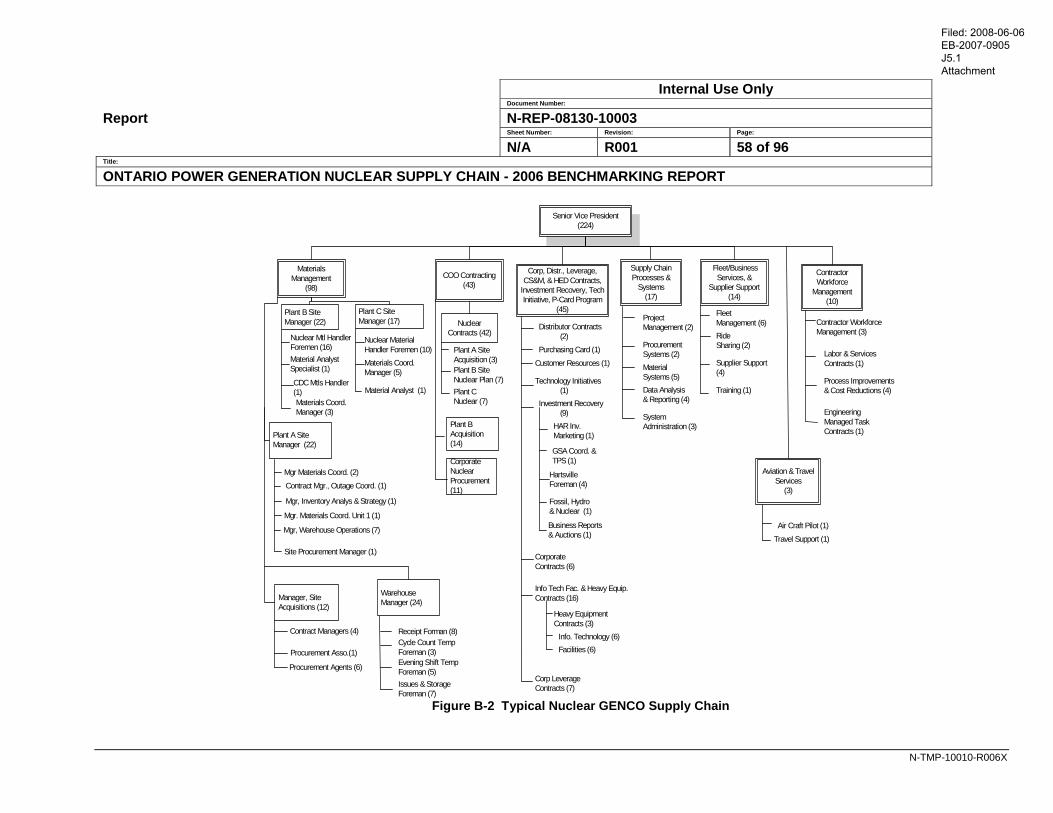
Internal Use Only Document Number:
Report N-REP-08130-10003 Sheet Number: Revision: Page:
N/A R001 58 of 96 Title:
ONTARIO POWER GENERATION NUCLEAR SUPPLY CHAIN - 2006 BENCHMARKING REPORT
N-TMP-10010-R006X
Senior Vice President (224)
Supply Chain Processes &
Systems(17)
Fleet/Business Services, &
Supplier Support(14)
Corp, Distr., Leverage, CS&M, & HED Contracts,
Investment Recovery, Tech Initiative, P-Card Program
(45)
Contractor Workforce
Management(10)
COO Contracting(43)
Aviation & Travel Services
(3)
Materials Management
(98)
Plant A Site Acquisition (3)Plant B Site Nuclear Plan (7)Plant C Nuclear (7)
Distributor Contracts (2)Purchasing Card (1)
Investment Recovery (9)
Customer Resources (1)
Corporate Contracts (6)
Info Tech Fac. & Heavy Equip. Contracts (16)
Corp Leverage Contracts (7)
Technology Initiatives (1)
Project Management (2)
Procurement Systems (2)Material Systems (5)Data Analysis & Reporting (4)
System Administration (3)
Fleet Management (6)Ride Sharing (2)
Supplier Support (4)
Training (1)
Contractor Workforce Management (3)
Labor & Services Contracts (1)
Process Improvements & Cost Reductions (4)
Engineering Managed Task Contracts (1)
Air Craft Pilot (1)
Travel Support (1)
Nuclear Mtl Handler Foremen (16)Material Analyst Specialist (1)
CDC Mtls Handler (1)Materials Coord. Manager (3)
Nuclear Material Handler Foremen (10)Materials Coord. Manager (5)
Material Analyst (1)
Mgr Materials Coord. (2)
Contract Mgr., Outage Coord. (1)
Mgr, Inventory Analys & Strategy (1)
Mgr. Materials Coord. Unit 1 (1)
Mgr, Warehouse Operations (7)
Contract Managers (4)
Procurement Agents (6)
Procurement Asso.(1)
Receipt Forman (8)Cycle Count Temp Foreman (3)Evening Shift Temp Foreman (5)Issues & Storage Foreman (7)
HAR Inv. Marketing (1)
GSA Coord. & TPS (1)
Hartsville Foreman (4)
Fossil, Hydro & Nuclear (1)
Business Reports & Auctions (1)
Heavy Equipment Contracts (3)
Info. Technology (6)Facilities (6)
Site Procurement Manager (1)
Plant B Site Manager (22)
Plant C Site Manager (17)
Plant A Site Manager (22)
Manager, Site Acquisitions (12)
Warehouse Manager (24)
Nuclear Contracts (42)
Plant B Acquisition (14)
Corporate Nuclear Procurement (11)
Figure B-2 Typical Nuclear GENCO Supply Chain
Filed: 2008-06-06 EB-2007-0905 J5.1 Attachment

Internal Use Only Document Number:
Report N-REP-08130-10003 Sheet Number: Revision: Page:
N/A R001 59 of 96 Title:
ONTARIO POWER GENERATION NUCLEAR SUPPLY CHAIN - 2006 BENCHMARKING REPORT
N-TMP-10010-R006X
Regional Nuclear GENCO
Director 1
Site Managers
4
WPO Contracts Manager
1
WPO Material
Manager 1
Analyst5
Contract Administrators
8
Purchasing Supervisor
4
Materials Supervisor
3
Stores Supervisor
4
Warehouse Personnel
Plant A – 16Plant B – 10Plant C – 6Plant D – 6
Technical Specialist
Plant A – 16Plant B – 10Plant C – 6Plant D – 6
Receipt Inspectors
Plant A– 16Plant B – 10Plant C – 6Plant D – 6
Procurement Specialist
Plant A – 16Plant B – 10Plant C – 6Plant D – 6
Clerk1
Admin. Assistant
3
Figure B-3 Typical Regional Nuclear Supply Chain
Filed: 2008-06-06 EB-2007-0905 J5.1 Attachment
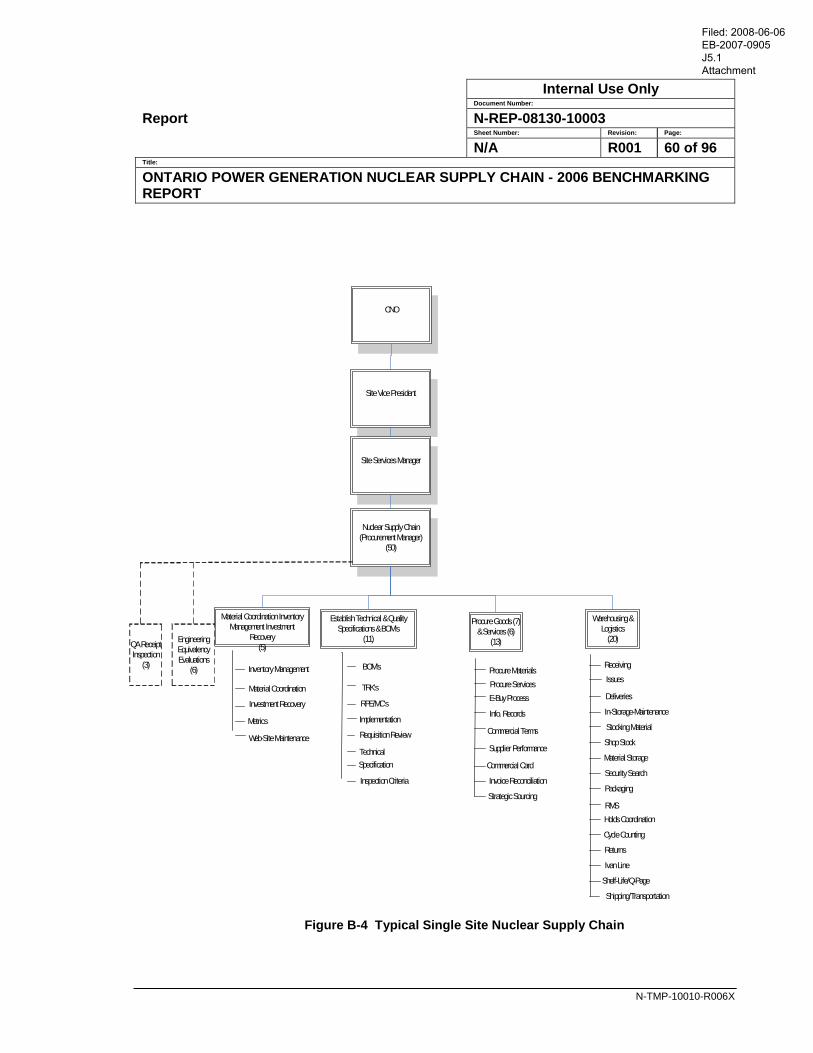
Internal Use Only Document Number:
Report N-REP-08130-10003 Sheet Number: Revision: Page:
N/A R001 60 of 96 Title:
ONTARIO POWER GENERATION NUCLEAR SUPPLY CHAIN - 2006 BENCHMARKING REPORT
N-TMP-10010-R006X
Figure B-4 Typical Single Site Nuclear Supply Chain
Nuclear Supply Chain (Procurement Manager)
(50)
Establish Technical & Quality Specifications & BOM’s
(11)
Procure Goods (7) & Services (6)
(13)
Material Coordination Inventory Management Investment
Recovery(5)
Warehousing & Logistics
(20)
CNO
Site Vice President
Site Services Manager
Inventory Management
Material Coordination
Investment Recovery
Metrics
Web-Site Maintenance
BOM’s
TRK’s
RPE/MC’s
Requisition Review
Implementation
TechnicalSpecification
Inspection Criteria
Procure MaterialsProcure ServicesE-Buy Process
Info. Records
Commercial Terms
Supplier Performance
Commercial Card
Invoice Reconciliation
Strategic Sourcing
Receiving
Issues
Deliveries
In-Storage-Maintenance
Stocking Material
Shop Stock
Material Storage
Security Search
Packaging
RMSHolds Coordination
Cycle Counting
Returns
Ivan Line
Shelf-Life/Q-Page
Shipping/Transportation
QA Receipt Inspection
(3)
Engineering Equivalency Evaluations
(6)
Filed: 2008-06-06 EB-2007-0905 J5.1 Attachment

Internal Use Only Document Number:
Report N-REP-08130-10003 Sheet Number: Revision: Page:
N/A R001 61 of 96 Title:
ONTARIO POWER GENERATION NUCLEAR SUPPLY CHAIN - 2006 BENCHMARKING REPORT
N-TMP-10010-R006X
Figure B-5 Typical Corporate Supply Chain
Chief Supply OfficerSVP BSC
Acting VP
VP Supply Business Ops and
Governance(Total #)
Director
VP Strategic Sourcing(Total #)
Director, Strategic Sourcing EED
(#)
Director, Strategic Sourcing Services Generation (#)
Director, Strategic Sourcing Materials
Generation (#)
Strategic SourcingMerger Integration
Team Lead (#)
Manager Advanced Sourcing
(#)
DirectorIT/Corporate Services (#)
ManagerDiverse Business Enablement (#)
Acting ManagerSupply Projects &
ManagerSupply
Governance, Policies
Managere-Business &
System Administration (#)
ManagerFulfillment Mgmt
ManagerT&S Parts
ManagerMaterial Availability
(#)
ManagerMaterial & Logistics
ManagerMaterials & Logistics
ManagerSystem Shops
DirectorSupply Ops
ManagerT&S Parts
ManagerMaterial Availability
Manager
Manager
Manager
Manager, EED Services (#) Manager, EED Materials (#)
ManagerSpecial Projects (#)
Mgr, Exelon Services/Materials (#)
Acting MgrIT/Telecom (#)
Project Management (#) Programs Management (#)
Supplier Diversity Coordinator (#)
E-Business (#) Data Analysis (#) Business Process Analysis (#)
Inventory Specialist (7)
Mgr, M&L East (#) Mgr, Material Availability (#) Acting Mgr, Systems Shops (#) Mgr, T&S (#)
Supply Supervisor (#) Supply Supervisor (#) Supervisor Area 1 Heavy Hauling (#) Supervisor Area 2 & 3 Heavy Hauling (#) Supervisor Area 4 Heavy Hauling (#)
Filed: 2008-06-06 EB-2007-0905 J5.1 Attachment

Internal Use Only Document Number:
Report N-REP-08130-10003 Sheet Number: Revision: Page:
N/A R001 62 of 96 Title:
ONTARIO POWER GENERATION NUCLEAR SUPPLY CHAIN - 2006 BENCHMARKING REPORT
N-TMP-10010-R006X
Appendix C: Benchmarking Team
Note: Appendix C has been redacted to remove personal information
Ms. Lynn Adams Senior Process Specialist – Methods Nuclear Supply Chain Ontario Power Generation 889 Brock Road Pickering, ON, L1W 3J2 Phone: 905-839-6746, x 4133 [email protected]
Mr. Patrick Alfred Section Manager – Strategic Procurement Engineering Nuclear Supply Chain Ontario Power Generation 777 Brock Road Pickering, ON, L1W 4A7 Phone: 905-839-1151, x 2901 [email protected]
Mr. James Arnone Senior Process Specialist – Methods Nuclear Supply Chain Ontario Power Generation 889 Brock Road Pickering, ON, L1W 3J2 Phone: 905-839-6746, x 4105 [email protected]
Mr. Teodor Chirica General Director Societatea Nationala “Nuclearelectrica” S.A. 65 Polona Street 010494 - Bucharest – Sector 1 Romania Phone: 40-21-203-8200 [email protected]
Joe DiChiara Director, Materials, Purchasing & Contracts Entergy Nuclear Generation Northeast 440 Hamilton Ave. White Plains, NY 10601 Phone: 914-272-3302 [email protected]
Mr. J. Vincent Gilbert Director, Principal Strategist Total Resource Management 510 King Street, Suite 300 Alexandria, Virginia 22314 Phone: (202) 422-8238 [email protected]
Mr. Edward J. Finnegan Manager, Genco Materials Strategy/Sourcing Exelon Supply – Cantera 4300 Winfield Road Warrenville, IL 60555 [email protected]
Mr. Randall G. German Superintendent – Central Receiving and Dedication Facility Nuclear Engineering & Services Progress Energy Carolinas, Inc. 5413 Shearon Harris Road New Hill, NC 27562 Phone: 919-362-2565 [email protected]
Mr. Mike Gurney Senior Process Specialist – Methods Nuclear Supply Chain Ontario Power Generation 889 Brock Road Pickering, ON, L1W 3J2 Phone: 905-839-6746, x 4156
Mr. Steve Jones Senior Process Specialist – Methods Nuclear Supply Chain Ontario Power Generation 889 Brock Road Pickering, ON, L1W 3J2 Phone: 905-839-6746, x 4105
Filed: 2008-06-06 EB-2007-0905 J5.1 Attachment

Internal Use Only Document Number:
Report N-REP-08130-10003 Sheet Number: Revision: Page:
N/A R001 63 of 96 Title:
ONTARIO POWER GENERATION NUCLEAR SUPPLY CHAIN - 2006 BENCHMARKING REPORT
N-TMP-10010-R006X
[email protected] [email protected] Mr. Bryan Keelan Manager Strategic Procurement Engineering Nuclear Supply Chain Ontario Power Generation 777 Brock Road Pickering, ON, L1W 4A7 Phone: 905-839-1151, x 7555 [email protected]
Mr. S. Krishnamurthy Station Director Nuclear Power Corporation of India Madras Atomic Power Station Kalpakkam – 603 102, Tamil Nadu, India Phone: 044-2748-0331 [email protected]
Mr. Larry Mathews Consultant Nuclear Supply Chain Ontario Power Generation 889 Brock Road Pickering, ON, L1W 3J2 Phone: 905-839-6746, x 4102 larry@[email protected]
Mr. Mike Meko Director Site Services Diablo Canyon Nuclear Power Plant 8.5 miles northwest of Avila Beach, Avila Beach California, 93424 Phone: 805-545-6625 [email protected]
Mr. Karunaa Murthy Section Manager – Strategic Procurement Engineering Nuclear Supply Chain Ontario Power Generation 777 Brock Road Pickering, ON, L1W 4A7 Phone: 905-839-1151, x 8043 [email protected]
Ms. Elena Negulici Business Manager Cernavoda Nuclear Power Plant Medgidia Street 1 P.O. Box 42 905200 – Cernavoda Phone: 40-241-238-610 [email protected]
Mr. Bhavesh Patel Supervisor – Procurement Engineering & Dedication Nuclear Engineering & Services Progress Energy Carolinas, Inc. 5413 Shearon Harris Road New Hill, NC 27562 Phone: 919-362-2566 [email protected]
Mr. Scott Piepenbrink Quad Cities Nuclear Generating Station Supply Chain Manager Exelon Supply 22710 – 206th Avenue North Cordova, IL, 61242 Phone: 309-227-3500 [email protected]
Mr. Del Ritchie Manager Supply Chain Diablo Canyon Nuclear Power Plant 8.5 miles northwest of Avila Beach Avila Beach, CA 93424 Phone: 805-545-4667 [email protected]
Ms. Elaine Rowden Manager – Supply Services Pickering Nuclear Supply Chain Ontario Power Generation 1675 Montgomery Park Road Pickering, ON, L1V 2R5 Phone: 905-839-1150, x 6618 [email protected]
Filed: 2008-06-06 EB-2007-0905 J5.1 Attachment
Internal Use Only Document Number:
Report N-REP-08130-10003 Sheet Number: Revision: Page:
N/A R001 64 of 96 Title:
ONTARIO POWER GENERATION NUCLEAR SUPPLY CHAIN - 2006 BENCHMARKING REPORT
N-TMP-10010-R006X
Mr. Derek A. Smith Manager, TVA Nuclear Site Acquisition Tennessee Valley Authority 1101 Market Street Mail Code BR C124 Chattanooga, Tennessee 37401 Phone: 423-751-4117 [email protected]
Mr. Alex Visan Senior Process Specialist – Methods Nuclear Supply Chain Ontario Power Generation 889 Brock Road Pickering, ON, L1W 3J2 Phone: 905-839-6746, x 4105 [email protected]
Mr. Ray Vitale Warehouse Supervisor Entergy Nuclear Operations, Inc Indian Point Energy Center 450 Broadway Buchanan, NY 10511-0249 Phone: 914-271-7179 [email protected]
Mr. Troy Woudwyk Senior Process Specialist – Methods Nuclear Supply Chain Ontario Power Generation 889 Brock Road Pickering, ON, L1W 3J2 Phone: 905-839-6746, x 5490 [email protected]
Mr. Paul Young Director - Business Integration and Change Management Nuclear Supply Chain Ontario Power generation 889 Brock Road Pickering, ON, L1W 3J2 Phone: (905) 839-6746, x 5166 [email protected]
Filed: 2008-06-06 EB-2007-0905 J5.1 Attachment

Internal Use Only Document Number:
Report N-REP-08130-10003 Sheet Number: Revision: Page:
N/A R001 65 of 96 Title:
ONTARIO POWER GENERATION NUCLEAR SUPPLY CHAIN - 2006 BENCHMARKING REPORT
N-TMP-10010-R006X
Appendix D: Integrated Bidding Process
Site: Cernavoda – Societatea Nuclear Electrica
Process Map Linkage: MS002, MS003 Procure Materials and Services
Description
The buying process is regulated by a national law applicable to all state owned companies. The law is integrated with similar European Union (EU)-similar laws. All requisitions must go through a transparent and competitive bidding process, available to all qualified suppliers/market operators across the EU. This process ensures that all the operators are treated equally and both the company and supplier assume responsibility, thus the company budget is being used efficiently.
The preferred means of conducting the requisition process is through the Electronic System for Public Acquisitions (ESPA), an electronic system integrated with a similar EU electronic systems. The requisition can be made through any one of the following five methods:
• Open bid,
• Limited bid – restricted to qualified vendor/service providers as of for Q items,
• Competitive dialogue with qualified candidates to identify and establish the desired outcome employed mostly for complex technical solutions
• Negotiation following the issuance of appropriate notification in the ESPA system
• Request for proposal, a simplified procedure to request competitive offers from interested suppliers.
Below a threshold of euro 5,000 for materials and euro 40,000 for repetitive service contracts direct acquisition is an option with proper justification of single sourcing. All of the requisitions over one million euro requires approval from the Head Office and are negotiated by Head Office.
Enablers and Drivers
Integration of economic legislation with the European Union is the main enabler that makes this process work. Although the process has been perceived as somehow slowing down the buying process, in the long run this will standardized practices and reduce overall supply chain spend.
Cost and Performance Measures
• Efficient utilization materials and services resources.
• Standardization of the buying process by using the electronic ESPA system.
• Simple acquisition practices.
• Increased confidence of suppliers and service providers due to system transparency and integration.
Filed: 2008-06-06 EB-2007-0905 J5.1 Attachment
Internal Use Only Document Number:
Report N-REP-08130-10003 Sheet Number: Revision: Page:
N/A R001 66 of 96 Title:
ONTARIO POWER GENERATION NUCLEAR SUPPLY CHAIN - 2006 BENCHMARKING REPORT
N-TMP-10010-R006X
Appendix E: Multi-Function Job
Site: Diablo Canyon – PG&E
Process Map Linkage: MS002, MS003 Procure Materials and Services
Description
Multi-tasking observed within the Procurement Engineering organization at Diablo Canyon allows one job function for BOM builder, pre-screener, Procurement Engineering and Material Analyst. A more efficient process was achieved through a single function/position such that there would be a reduction in the number of hold-types on work order tasks with an associated reduction in hand-offs.
Enablers/Drivers
Consolidating roles and responsibilities and redefining job descriptions, it is important that challenging performance goals be set for the employees. In conjunction with this, employees should be empowered to make decisions on their own, while still being held accountable for the decisions they make.
Implementation of cross-training of staff increases both knowledge and skills and also provide greater operating efficiencies.
Contributors to the success of the challenge process:
• Less hand-offs ‘one stop shop’ • More streamlined and efficient process • Higher pay for multi-skilled staff, attracts more skilled people (Hiring) • Training/knowledge and understanding of the full process from ‘cradle to grave’ • Job ownership and accountabilities accepted (Culture, reliance on teamwork) • Approval authority up to $100,000. Responsibility and empowerment
Cost/Performance Measures
This strategy is simple and effective by providing a single, multi-skilled point of contact. This results in quick resolution of customer requirements with minimal handoffs and fewer holds on work order tasks.
Work of this type is also easier to track for schedule and accountability purposes.
Filed: 2008-06-06 EB-2007-0905 J5.1 Attachment
Internal Use Only Document Number:
Report N-REP-08130-10003 Sheet Number: Revision: Page:
N/A R001 67 of 96 Title:
ONTARIO POWER GENERATION NUCLEAR SUPPLY CHAIN - 2006 BENCHMARKING REPORT
N-TMP-10010-R006X
Appendix F: Warehouse Process Simplification
Site: Diablo Canyon – PG&E
Process Map Linkage: MS004 Provide Warehousing
Description
Diablo Canyon has simplified warehouse processes to improve efficiencies in material storage, handling and delivery. They also add value to their customers by employing best of the best material handling and delivery initiatives. This description covers storage structure, packaging and storage, receiving, material picking, dispensing, issue and material delivery.
Warehousing support uses several simple but effective practices including the following:
(a) High-density storage structures, high-rise shelving and racking including palletized material. They use guided picking equipment for material put-away and picks.
(b) Packaging storage and handling:
(1) Reduced the need to apply shelf life for elastomer-type items, i.e. o-rings do not have a shelf life and they do not employ opaque packaging, they do employ shelf life and opaque packaging to large diaphragms.
(2) Chemicals and hazardous goods are colour-coded with labels for ease of segregation, i.e. oxidizers from base products and they have also employed the same information to the storage locations. They run simple reports to monitor and make sure products are properly segregated.
(c) Oil dispensing and filtration systems reduce contamination potential. One-time containers at the point of issue were labeled with the product name and a shelf life of thirty days.
(d) Reduced warehouse inspection complexities/reduced hand-offs to QC inspection.
(e) Receiving
(1) Visual aids are used in the warehouse to identify process activity, colour coded cones, red for priority receiving, black at receiving, blue in QC Inspection, white for quarantine and green on material for put-away. This gives supervision a quick percentage of work to be completed. Back-logs are very low.
(2) QC inspection does not have to add an inspection labels since it documented electronically in the work management system.
Filed: 2008-06-06 EB-2007-0905 J5.1 Attachment

Internal Use Only Document Number:
Report N-REP-08130-10003 Sheet Number: Revision: Page:
N/A R001 68 of 96 Title:
ONTARIO POWER GENERATION NUCLEAR SUPPLY CHAIN - 2006 BENCHMARKING REPORT
N-TMP-10010-R006X
(f) Material Picking Dispensing and Issue:
(1) Based on maintenance agreements and the work management system material to be identified, picked and delivered the next day and. All material is pre issued prior to the end user retrieving the material from drop off locations.
(g) Material Delivery:
(1) Outage trailers are set up by work order and discipline i.e. MM vs. CM and Trades. This would equate to three trailers that are loaded up with outage material pre issued and set in place at the general work location were the end user retrieves their material. This also simplifies outage returns as the material and the associated paper work is available to complete returns and credit the appropriate work order. This enables a better history for material usage for a give work program and or project.
(2) For on line work they deliver to pre determined work locations (approximately 100 locations) pre issued material that is available for the end user to retrieve. They are also considering increasing the number of locations they deliver to.
Enablers/Drivers
Enablers include:
(a) Simplify governance and the existence of a :”Demand Cancellation Policy”
(1) Communication (reporting tool) on canceled demand (2) Remove from stage area to another work order demand (3) Hold onto new receiving re do not stock return to vendor
(b) Improved training plans and desktops guides
(c) Cross-training combining job tasks / functions
(1) QL3 material receiving / returns and inspection as a single task (2) Emphasis on accountability (3) More staff flexibility, resource loading where needed
(d) Improve warehouse logistics design
(1) Long lead items in central warehouse (2) Common facility receiving area (3) Reduce stocking duplication (4) Fast-moving material at station warehouses
(e) Elimination of printing and attaching of unnecessary RI tagging (reduce duplication)
Filed: 2008-06-06 EB-2007-0905 J5.1 Attachment

Internal Use Only Document Number:
Report N-REP-08130-10003 Sheet Number: Revision: Page:
N/A R001 69 of 96 Title:
ONTARIO POWER GENERATION NUCLEAR SUPPLY CHAIN - 2006 BENCHMARKING REPORT
N-TMP-10010-R006X
(f) Emphasis on accountability
(1) Personnel are prepared to be accountable and capable of completing (2) Tasks are on time and accurately (3) Pre issued material is in the hands of the end user when they execute work.
Cost/Performance Measures
Cost and Performance measures are as follows:
• Inventory accuracy is very high resulting in less parts staging • Daily inventory tracking report shows incremental changes • Continuous cycle count of all inventory within a two year period • Reduce cycle time including QL3 inspections and QL1,2,3 returns • Resource sharing and shifting (Flexibility across sites) • Reduce surprises to stakeholders on parts delivery • Reduce counter walkups with staging in trailers • Improved service levels (parts on hand when requested as per schedule) • Increase efficiency and productivity • Material is located at close proximity increase wrench time.
Filed: 2008-06-06 EB-2007-0905 J5.1 Attachment
Internal Use Only Document Number:
Report N-REP-08130-10003 Sheet Number: Revision: Page:
N/A R001 70 of 96 Title:
ONTARIO POWER GENERATION NUCLEAR SUPPLY CHAIN - 2006 BENCHMARKING REPORT
N-TMP-10010-R006X
Appendix G: Challenge Process
Site: Indian Point – Entergy Northeast
Process Map Linkage: MS001 Provide Inventory Management
Description
There is a strategy to optimize inventory and to reduce the cost of materials. This process empowers materials personnel to challenge the basis for requests to purchase products. Two groups play a role in the challenge process for holding inventory costs down. Materials group challenges and practices are:
• All new CAT ID requests are challenged as to need
• Materials used only once or twice a year are not stocked
• ROP/TMAX are recommendations only and Materials group is empowered to change to the level to “0 / 1” which means only to buy when there is demand
• Review of what is in the staging area prior to buying new
• Achieve a target of no more than 2% inventory creep per year
• Challenged all items over a specific unit cost threshold through a Site Inventory Review Committee (SIRC). This team also reviews direction for obsolescence, authorizes returns and large buys.
There is a Material Review Board with members from Supply, Component Engineering and Design Engineering This board operates under an Inventory Reductions Charter and is responsible for reviewing obsolete material not used, based on history, inventory reduction and they also review the identification of new items into inventory as well as what is being removed.
A Major Projects Review Committee was developed to review major projects and expenditures. Members are plant manager, site vice-president and directors. Supply would get involved to discuss any requests for material that was removed from inventory during an inventory reduction initiative in May 2006. The initiative reduced the inventory where India Point reclassified $26,039,907 worth of inventory due to the accounting department interpretation of FAS 151.The May reduction of inventory looked at:
(a) any material that was greater value of $10,000 (b) not issued for at least two years and (c) less than or equal to 5 in stock
To block the item from future purchase, the average unit price was removed and the material was blocked in the comport system being issued or purchased. The material can be used and
Filed: 2008-06-06 EB-2007-0905 J5.1 Attachment

Internal Use Only Document Number:
Report N-REP-08130-10003 Sheet Number: Revision: Page:
N/A R001 71 of 96 Title:
ONTARIO POWER GENERATION NUCLEAR SUPPLY CHAIN - 2006 BENCHMARKING REPORT
N-TMP-10010-R006X
replenished if necessary but needs to be treated as capital project and not OM&A money. Oversight is provided by the Entergy Headquarters office.
Enablers/Drivers
Entergy’s challenge process is a tool to assist in the managing of inventory levels and as a means to ensure costs are a primary consideration in identification of the work, related materials support requests and maintenance of stocking levels.
Enablers to the success of the challenge process are:
• Implemented an Inventory Reductions Charter, along with strong direction and support from executives
• Agreement in regards to inventory growth/reduction from a cross-functional Material Review Board
• Training/knowledge and understanding of the challenge process across the site
• Incentives (payouts/goal sharing) are also site-wide and all staff receive bonuses based on outage performance and safety performance.
Cost/Performance Measures
The Material Review Board and challenge process for new / material returns is a cost savings as shown comparison of Key Performance Indicators against other utilities.
Indian Point Units 2 & 3;
• Inventory Creep $5.2M • Inventory Value $82M • Return Ratio by Item 13% • Non-outage material available 97%
Additional improvements at Indian Point are likely since they are still in the process of combining Unit 1, 2 and 3 warehouse functions that were established by prior owners.
Filed: 2008-06-06 EB-2007-0905 J5.1 Attachment
Internal Use Only Document Number:
Report N-REP-08130-10003 Sheet Number: Revision: Page:
N/A R001 72 of 96 Title:
ONTARIO POWER GENERATION NUCLEAR SUPPLY CHAIN - 2006 BENCHMARKING REPORT
N-TMP-10010-R006X
Appendix H: Strategic Maintenance Approach
Site: Madras MAPS
Process Map Linkage: MS001 Provide Inventory Management
Description
Engineering provides technical leadership to Maintenance for establishing overall maintenance strategy. This determines the types and frequency of maintenance functions as well as the determination for what critical parts and capital spares are maintained in inventory. With this completed, Maintenance is empowered to be the inventory owner and planner for specific maintenance activities. Their goal to “Plan for what you need and stock what you use”:
Enablers/Drivers
It is important to identify strategic inventory needs because in India the utility has an additional role for identification of and support for the supply chain that supports all inventory requirements.
All plant staff are highly trained technically. They also thoroughly understand their business model. Professional advancements are managed by a committee of experts that is independent of that person’s normal supervisor.
Understanding the technical needs of the plant is “A way of Life”.
Cost/Performance Measures
Labor cots for plant operation are very low due to the high degree of cross-training and individual expertise
Inventory accuracy is very high.
Maintenance backlogs are low and only a short T-week cycle plan is required to maintain the plant material condition.
Planned outages are short and occur once every 24 months. About 22 years after initial construction, a complete refurbishment is conducted over a 15-month period. The company nuclear 2005 capacity factor was 90.6% and for Madras MAPS#2 was 85% (MAPS 1 was under refurbishment).
Filed: 2008-06-06 EB-2007-0905 J5.1 Attachment

Internal Use Only Document Number:
Report N-REP-08130-10003 Sheet Number: Revision: Page:
N/A R001 73 of 96 Title:
ONTARIO POWER GENERATION NUCLEAR SUPPLY CHAIN - 2006 BENCHMARKING REPORT
N-TMP-10010-R006X
Appendix I: Surplussing of Unneeded Materials
Site: Sequoyah – TVA
Process Map Linkage: MS006 Disposition of Unneeded Materials
Description
Workable Supplussing Process: TVA has a program to identify, reuse, sell or otherwise dispose of idle assets with the objectives to improve cash flow, recover part of cost of idle assets, eliminate environmental hazards, and lower total ownership costs.
Surplussing is a viable option for recouping worth from items no longer needed by the plant, instead of scrapping. There is a articulate process for identifying items as surplus, coupled with a process for letting the market place know that an item is surplus. This process allows surplus material to be visible (surplus material is managed and tracked in same data system as active inventory) and centrally located (all surplus material resides at one warehousing facility). The surplus material is determined to be no longer needed by a facility or material that is stocked in excessive quantities. Excess quantities are defined as quantity on hand in excess of an estimated five years supply for all TVA users.
The Site Procurement Manager (SPM) coordinates the review for surplus material, including Site Inventory Review Committee (SIRC) review as appropriate. Authorization must be obtained from the Plant Manager/designee who serves to identify and declare specific material as surplus. The SPM must confirm through documentation and signature that the Business Unit Management authorization has been obtained and ensure that these authorizations are maintained as permanent records.
Surplus material is marketed by RAPID, Internet Web site, E-bay. The preferred methods of dispositioning surplus material are in the order of highest return rate:
• Re-deployment: 100% return and avoid new buy • Negotiated Sales: 80% return and • Auctions: 2% return.
Enablers and Drivers
Enablers and drivers are:
• Having a culture that effectively integrates plant departments with engineering, purchasing and Inventory. This facilitates identifying surplus material.
• Cultural bias to work together as a team
• Having clear and established relationships facilitates making decisions on what to surplus
Filed: 2008-06-06 EB-2007-0905 J5.1 Attachment
Internal Use Only Document Number:
Report N-REP-08130-10003 Sheet Number: Revision: Page:
N/A R001 74 of 96 Title:
ONTARIO POWER GENERATION NUCLEAR SUPPLY CHAIN - 2006 BENCHMARKING REPORT
N-TMP-10010-R006X
• Flat organizational structure makes it easy to reach people
• Dispositions material as soon as it is known to be surplus to get it off the books
• Have an inventory recovery process map that takes declared surplus material and tries to sell it and or recover the value and therefore lower the total cost of ownership.
• Employs staff in investment recovery that coordinates the surplus material review.
Cost and Performance Measures
• Performance is measured by the re-deployment of surplus material to avoid new procurements of the material and to lower total ownership costs.
• Amount of dollars written off for materials rendered obsolete as a result of the Design Change process.
• Rate of return.
• Revenue stream.
• Frees warehouse space.
Filed: 2008-06-06 EB-2007-0905 J5.1 Attachment
Internal Use Only Document Number:
Report N-REP-08130-10003 Sheet Number: Revision: Page:
N/A R001 75 of 96 Title:
ONTARIO POWER GENERATION NUCLEAR SUPPLY CHAIN - 2006 BENCHMARKING REPORT
N-TMP-10010-R006X
Appendix J: Inventory Challenge Process
Site: Sequoyah - TVA
Process Map Linkage: MS001 Provide Inventory Management
Description
TVA has a strategy to optimize inventory and to reduce the cost of materials. This process empowers Sequoyah materials personnel to challenge the basis for requests to purchase products. Challenges are based on “Best Buy is no Buy”:
• Reorders are not immediately processed, but rather held for a period of time in case issued material is returned
• New items are placed in inventory only if there is an existing item that can be surplussed / scrapped or if no item exists to satisfy the need.
• Prior to the procurement of inventory, other TVA sites are searched for the potential transfer of the required material in lieu of purchasing
• A structured decision process determines stocking levels based on item type, material usage, and an approval hierarchy
• Items are reviewed and challenged over a certain unit cost, through a Site Inventory Review Committee (SIRC), this team also reviews direction for obsolescence, authorize returns and large material buys.
Material management strategies and procedures are the overall responsibility of the general manager/materials management. In addition, site responsibilities fall under the site procurement manager and material analyst with input from plant management.
There is a formal challenge process on proposals for new items, stock levels, and obsolescence of spares and critical spares. These are presented to the SIRC who meets every month. Membership includes plant manager, department managers of maintenance, modifications, engineering, operations, site material analyst and the site financial manager. The primary strength of this process is that it includes input from all parties to ensure that agreed upon stocking levels are established. The main drawback is that it is a time consuming process and has to be worked around in some cases to meet critical or emergency situations.
As part of the design change process, the responsible organization is accountable for identifying any inventory rendered obsolete by the Design Change Notice (DCN). This is communicated to the material analyst who will then initiate the process for disposition of the obsolete material. Other TVA sites are checked to determine if they need the material. If it is determined that the material is obsolete, the site procurement manager must obtain authorization from the plant manager prior to removing the material.
Filed: 2008-06-06 EB-2007-0905 J5.1 Attachment

Internal Use Only Document Number:
Report N-REP-08130-10003 Sheet Number: Revision: Page:
N/A R001 76 of 96 Title:
ONTARIO POWER GENERATION NUCLEAR SUPPLY CHAIN - 2006 BENCHMARKING REPORT
N-TMP-10010-R006X
Additions and changes to the material catalog are limited to a finite set of individuals through password security. Stocking levels for consumable and bulk items are determined by the material analyst using an inventory management system which includes an automated stocking algorithm that takes into account average unit prices, lead-time, usage history, outstanding demand and schedules. This is used only as a guideline with the final determination made by the material analyst with input and/or approval of the appropriate manager. Stocking levels for spare parts and critical spares are determined by the end user and plant management. Proposals are reviewed by the SIRC.
Enablers/Drivers
TVA’s challenge process is a tool to assist in the managing of inventory levels and as a means to ensure costs are a primary consideration in processing from the identification of the work and related materials to the stocking levels and processing requests.
Enablers to the success of the challenge process:
• Support from senior managements, and encouragement for keeping inventory/purchasing costs down
• Agreement in regarding inventory growth/reduction from a cross-functional Site Inventory Review Committee
• Training/knowledge and understanding of the challenge process is a site-wide policy and
• Incentives (payouts/goal sharing) are applied site-wide.
Cost/Performance Measures
The SIRC and challenge process for new / material returns is a cost savings and shown comparison of Key Performance Indicators against other utilities;
Sequoyah Units 1 & 2
Inventory Creep $2M Inventory Value $40M Return Ratio by Item 13% Non-outage material availability 98%
Filed: 2008-06-06 EB-2007-0905 J5.1 Attachment
Internal Use Only Document Number:
Report N-REP-08130-10003 Sheet Number: Revision: Page:
N/A R001 77 of 96 Title:
ONTARIO POWER GENERATION NUCLEAR SUPPLY CHAIN - 2006 BENCHMARKING REPORT
N-TMP-10010-R006X
Appendix K: Warehouse Multi-Function Job
Site: Sequoyah - TVA
Process Map Linkage: MS-004 Provide Warehousing
Description
Sequoyah combines the receiving and receiving inspection and the receipt process have been combined into one broad job role. This sets a challenging and flexible set of job responsibilities for the individual. Implementation of cross training of staff personnel increase knowledge, skills and provide operating efficiencies in the area of receiving. Simple document discrepancies are resolved on the spot, reducing OSD&Ds (quarantines).
Enablers/Drivers
Employees are powered to make decisions on their own, while still being held accountable for the decisions they make.
A “QC to the line” approach enablers the success of this job role.
Cost/Performance Measures
This strategy provides a single point of contact that is multi-skilled to deal with receiving issues along with any inspection concerns.
• More streamlined and efficient process with no hand-offs (“one-stop-shop) • Increase understanding of the overall materials process
This method results in quick resolution of high priority receiving and inspection work.
Filed: 2008-06-06 EB-2007-0905 J5.1 Attachment

Internal Use Only Document Number:
Report N-REP-08130-10003 Sheet Number: Revision: Page:
N/A R001 78 of 96 Title:
ONTARIO POWER GENERATION NUCLEAR SUPPLY CHAIN - 2006 BENCHMARKING REPORT
N-TMP-10010-R006X
Appendix L: Inventory as an Asset
Site: Quad Cities - Exelon Process Map Linkage: MS001 Provide Inventory Management
Description
Optimization of inventory levels and added value in support of supply chain customers is accomplished by the following:
• Understanding demand patterns and challenging purchases • Sharing inventory across company sites and other nuclear sites and • Exercising management controls (Appendix N)
Enablers and Drivers
Senior management support exists for sharing inventory across the enterprise. For example a “Milk Run” delivery system connecting all sites within an operation region makes movement of the shared inventory a dependable function.
The availability of a comprehensive IT tool (Scientech RapidPartSmart) makes the search for shared items fast and reliable. When a part is sold to another site, the buyer pays original purchase price plus shipping. This technique can be used to reduce inventory without a “write-down”.
Figure K-1 Scientech RapidPartSmart “EZ Search” Example
Selective outsourcing of some safety supplies such as fasteners reduces the on-site inventory management burden and provides additional flexibility.
Yourplant
OtherPlants
YourSurplus
Your Alliances
UtilitySurplus
Suppliers
1) Stock Code2) Mfr Part No
exactstrippedall fields
1) Stock Code2) Mfr Part No
exactstrippedall fields
1) Stock Code2) Mfr Part No
exactstrippedall fields
1) Stock Code2) Mfr Part No
exactstrippedall fields
3) Keywords
UtilityInventories
OIRD
1) Stock Code2) Mfr Part No
exactstrippedall fields
3) Keywords
1) Stock Code2) Mfr Part No
exactstrippedall fields
3) Keywords
1) Stock Code2) Mfr Part No
exactstrippedall fields
3) Keywords
EZSearch…
Filed: 2008-06-06 EB-2007-0905 J5.1 Attachment

Internal Use Only Document Number:
Report N-REP-08130-10003 Sheet Number: Revision: Page:
N/A R001 79 of 96 Title:
ONTARIO POWER GENERATION NUCLEAR SUPPLY CHAIN - 2006 BENCHMARKING REPORT
N-TMP-10010-R006X
Cost and Performance Measures
A daily reporting system provides changes in all key supply chain information for all
This includes overnight changes in inventory and a list of parts needed the next day that are available via the “EZ Search”.
The relevant Exelon KPIs are as follows:
• Fleet capacity factor is 94% • Inventory value per plant is about $27M per site • Inventory creep is about $3M per site and • Material availability is about 98.7%
Achieving these measures enables Exelon to be an ongoing attractive investment for its shareholders.
Filed: 2008-06-06 EB-2007-0905 J5.1 Attachment

Internal Use Only Document Number:
Report N-REP-08130-10003 Sheet Number: Revision: Page:
N/A R001 80 of 96 Title:
ONTARIO POWER GENERATION NUCLEAR SUPPLY CHAIN - 2006 BENCHMARKING REPORT
N-TMP-10010-R006X
Appendix M: Category Managers
Site: Quad Cities - Exelon
Process Map Linkage: MS002, MS003 Procure Materials and Services
Description
Category managers establish, monitor and manage through incentives, a leveraged collection of strategic supplier areas (categories. Managers are assigned for both material categories and for services categories. The length of a typical strategic contract with a supplier is about three years.
Category managers write blanket purchase orders and the sites execute releases against them.
All category managers meet as a group with corporate management for accountability, team building, recovery planning and forward planning activities. Consistent application of the category strategy results in effective feedback to the supplier for both issue resolution and merit recognition. Sourcing changes and /or improvement programs can occur in the event of poorly performing suppliers. Effective suppliers are in a position to capture increased business. Certain incentives are also given to suppliers for going above and beyond expectations.
Effective implementation of these characteristics helps ensure alignment of category managers and suppliers to key initiatives. This process represents the on-going integration of operation focus and financial goals.
Enablers and Drivers
All category managers are degreed and possess a broad range of experience such as in plant experience, have strong operations backgrounds, engineering, supply chain and maintenance in many cases.
Exelon operates a large number of units, making their total category spend attractive to suppliers. This size also allows maintenance of the category manager infrastructure in an efficient way.
Category managers study their assigned market areas and they are accountable for performance through specific measures. Exelon can then efficiently delegate the routine buying to site procurement staff.
A daily reporting system provides changes in all key supply chain information for all.
This includes overnight changes in inventory and a list of parts needed the next day that are available via the Scientech RapidPartSmart IT EZ Search system.
Alliances include relationships with four large nuclear suppliers.
Filed: 2008-06-06 EB-2007-0905 J5.1 Attachment

Internal Use Only Document Number:
Report N-REP-08130-10003 Sheet Number: Revision: Page:
N/A R001 81 of 96 Title:
ONTARIO POWER GENERATION NUCLEAR SUPPLY CHAIN - 2006 BENCHMARKING REPORT
N-TMP-10010-R006X
A system of at least two bidding “Engineers of Choice” is available for engineering work.
Cost and Performance Measures
Performance data is published by category each quarter. Corporate support is provided to sites on a daily basis.
Dollars spent per purchase order is about $8.00, which ranks among the top nuclear fleets for purchasing efficiency.
Over 70% of material orders are handled using blanket purchase orders.
About 90% of material purchases are automated.
About 60% of all service purchases are automated.
Filed: 2008-06-06 EB-2007-0905 J5.1 Attachment

Internal Use Only Document Number:
Report N-REP-08130-10003 Sheet Number: Revision: Page:
N/A R001 82 of 96 Title:
ONTARIO POWER GENERATION NUCLEAR SUPPLY CHAIN - 2006 BENCHMARKING REPORT
N-TMP-10010-R006X
Appendix N: Management Controls
Site: Quad Cities
Process Map Linkage: All MS Processes
Description
Exelon employs a comprehensive supply chain performance measures standard across their fleet of ten nuclear sites to promote efficient and effective supply chain services. All site managers meet monthly for two days to foster teamwork, help respond to challenges and reinforce personnel and organizational accountability. Additionally this serves to keep stakeholders and customers accountable for providing complete and accurate supply chain needs in a timely fashion as an enabler for excellent supply chain performance.
The following information is included in the overall measurement system (November 2006).
(a) Weekly dollars spend by site
(b) Inventory value
(1) Top growth items (2) Material returns (3) Max/Min changes (4) Purchase orders with no work orders (5) Amount of “delayable buys” (6) Top issue items (7) Work orders 60 days past
(c) Two-Day Site Supply Operations Management topics
(1) Fundamentals /Safety Review (2) Financial/Budget Performance (3) Monthly Metrics Review (4) Goal Reviews (5) Power Labs Information (6) Supply FASA Discussion (7) Process Improvement Topics (over 100 items on list) (8) Site Issues and Topics (9) Procurement Engineering (10) Fulfillment Management (11) Strategic Update (12) Director Briefing (13) Round Table Discussion (14) Special initiatives (Example-Customer outreach called “Help Me Help You”
Filed: 2008-06-06 EB-2007-0905 J5.1 Attachment

Internal Use Only Document Number:
Report N-REP-08130-10003 Sheet Number: Revision: Page:
N/A R001 83 of 96 Title:
ONTARIO POWER GENERATION NUCLEAR SUPPLY CHAIN - 2006 BENCHMARKING REPORT
N-TMP-10010-R006X
(d) Site Dashboard “Annunciator-type”Items (number of measures)
(1) Safety (3) (2) Customer Support (6) (3) Inventory Growth (3) (4) Human Performance (5) (5) Parts Quality (4) (6) Recovery are attached for items needing improvement
Effective implementation of these characteristics helps ensure alignment of supply chain personnel with key initiatives. This process represents the on-going integration of operation focus and financial goals.
Enablers and Drivers
Key enablers are:
• Executives sponsor the management controls approach.
• Supply Chain is operated as a business with incentives for meeting and exceeding target goals.
Cost and Performance Measures
Cost and Performance Measures are:
• Capacity factor for the fleet is 94% • Inventory accuracy is 98.7% • Inventory turns is 4.0 %
Filed: 2008-06-06 EB-2007-0905 J5.1 Attachment

Internal Use Only Document Number:
Report N-REP-08130-10003 Sheet Number: Revision: Page:
N/A R001 84 of 96 Title:
ONTARIO POWER GENERATION NUCLEAR SUPPLY CHAIN - 2006 BENCHMARKING REPORT
N-TMP-10010-R006X
Appendix O: Glossary of Terms
AAA message: Action/Awareness/Alert is a PassPort email designed to alert employee to any condition, information, or situation that requires their review or specific action.
ABC Analysis: Application of Pareto's Law, or the 80/20 rule. ABC analysis, as related to inventory, is simply a determination of the relative ratios between the number of items and the dollar value of items purchased repetitively for stock. Typically 5 to 10 percent of the items (A items) account for 75 to 80 percent of the investment, 20 to 25 percent of the items (B items) account for 15 to 20 percent of the investment, and 70 to 75 percent of the items (C items) account for 5 to 10 percent of the investment. Inventories should be managed accordingly, with more emphasis placed on the strategic management of the “A” items.
Acceptance Sampling: A statistical quality control technique used to evaluate the overall condition of a given lot by inspecting only a portion or sample of the lot.
Acquisition Cost: In the context of Economic Order Quantity (E.O.Q.) analysis, the acquisition cost includes all costs associated with generating and processing an order and its related paperwork. In a broader management sense, the acquisition cost is the sum of the ordering, transporting, handling, and all inventory-holding costs associated with the acquisition of a material.
Acquisition Cost: The cost of ordering, transporting, handling and all inventory-holding costs associated with the purchase of a material.
Activity Based Costing: A method for allocating indirect costs, based on the activities that drive cost. This approach is in contrast to traditional accounting methods, which pool and arbitrarily allocate indirect costs.
Agent: An agent is a person authorized to act for the company in dealings with a third party.
Approved Vendor List: A formal list of those suppliers that have been evaluated and deemed to be capable of satisfactory performance. Back Order: Items ordered that could not be shipped due to a stock out.
Bar Code: A pattern of alternating parallel bars and spaces, representing numbers and other characters that are machine-readable. Major advantages of using bar coding technology in receiving and stores operation are the reductions in error rate and improved entry speed and count accuracy.
Base-Stock System: An inventory system where replenishment orders are issued each time a withdrawal is made and the order quantity is equal to amount of withdrawal.
Benchmark: A standard or point of reference used in measuring or judging quality, value, performance, price, etc. Benchmarks of purchasing performance, such as purchasing operating expense as a percent of company sales dollars, gives purchasing professionals a reference point that can be used to evaluate their own firm's performance.
Benchmarking: The process of identifying beneficial practices, comparing performance standards and discovering innovative thinking or approaches; a process of comparing products, processes and practices against the toughest competitors or those companies recognized as
Filed: 2008-06-06 EB-2007-0905 J5.1 Attachment
Internal Use Only Document Number:
Report N-REP-08130-10003 Sheet Number: Revision: Page:
N/A R001 85 of 96 Title:
ONTARIO POWER GENERATION NUCLEAR SUPPLY CHAIN - 2006 BENCHMARKING REPORT
N-TMP-10010-R006X
industry leaders. Comparisons include process performance (cycle time and efficiency) and cost measures as well as other indirect measures of performance. Benchmarking strives to improve one’s own practices by implementing change to become more like those of top performers.
Bid Analysis: Comparing the strengths and weaknesses of the various bids received.
Bid: In purchasing a bid is an offer to sell or an offer to buy. Can be referred to as a “proposal” or a “quotation”.
Bill of Lading (B/L): A carrier's contract and receipt for goods it agrees to transport from one place to another and to deliver to a designated person.
Bill of Materials (BOM): A list containing the quantity and description of all materials required constructing a component.
Blanket Order: A term commitment (usually one year or more) to a supplier for certain goods or services over a predetermined time. This practice is aimed at reducing the number of small orders.
Business plan: A document linking overall company strategic goals and objectives to everyday work processes, including major steps about how to achieve them.
Buyer: A professional buying specialist. Typically specialized in a given group of materials or commodities, responsible for market analysis, purchase planning, coordination with key users, supplier qualification and selection, order placement and follow-up activities.
Buying Team: The practice of using teams for strategic sourcing is a method in which several individuals from different departments (maintenance, engineering, operations, finance, etc.) pool their expertise to jointly make sourcing investigations and decisions.
Carrying Cost: See Inventory Holding Cost CAT ID: Catalogue identification number: The PassPort term for Stock Code Number.
Centralized Purchasing: In centralized purchasing, a separate individual or department is established within the organization and given authority to make the majority of purchases.
Certified Purchasing Manager (CPM): In 1974 the National Association of Purchasing Management, Inc. (NAPM) initiated the Certified Purchasing Manager Program. Upon fulfillment of specified requirements (a four-part examination, along with various education, experience and service requirements) a purchasing professional is awarded the CPM designation. Re-certification is required every five years.
Change Order: A purchaser’s written authorization to the supplier to modify or change an existing purchase order.
Common Carrier: A common carrier serves all customers, but carries only the types of freight for which it is certified. The most accepted characteristics of a common transportation carrier are the publication of rates; the provision of service on a schedule; service to designated points or within a designated area; and service for a given class of movement and commodities. All common carriers are regulated to some extent by federal agencies.
Filed: 2008-06-06 EB-2007-0905 J5.1 Attachment

Internal Use Only Document Number:
Report N-REP-08130-10003 Sheet Number: Revision: Page:
N/A R001 86 of 96 Title:
ONTARIO POWER GENERATION NUCLEAR SUPPLY CHAIN - 2006 BENCHMARKING REPORT
N-TMP-10010-R006X
Competitive Bidding: A common method of source selection; the offer of prices and specified elements of performance by firms competing for a contract.
Consignment Buying: A method of procurement in which a supplier maintains inventory on the premises of the purchaser. The purchaser's obligation to pay for the goods begins when goods are drawn from the stock for use. Commercial Grade Dedication: An acceptance process undertaken to provide reasonable assurance that a commercial grade item to be used as a basic component will perform its intended safety function and, in this respect, is deemed equivalent to an item designed and manufactured under a 10 CFR Part 50, Appendix B, quality assurance program.
Contract Administration: Those activities and actions taken by the buyer and supplier during the time from contract award to contract closeout. They may include follow-up, expediting, and many supplier management functions.
Contract: A written or oral agreement between two or more competent parties that expresses, for a consideration, a job or service to be performed that is legally enforceable under its terms and provisions.
COG: CANDU Owners Group Inc. is a not-for-profit corporation that is dedicated to providing programs for co-operation, mutual assistance and exchange of information for the successful support, development, operation, maintenance and economics of CANDU technology. Corrective maintenance (CM): Actions that restore (by repair, overhaul, or replacement) the capability of a failed SSC to function within acceptance criteria.
Cost Analysis: A review and an evaluation of actual or anticipated cost date (material, labor, overhead, etc.). This analysis involves applying experience, knowledge, and judgment to date in an attempt to project reasonable estimated contract costs. Estimated costs serve as the basis for buyer-seller negotiation to arrive at mutually agreeable contract prices.
Cost Avoidance: A purchasing action by means of certain material/supplier increases is not incurred by the purchasing firm. Since it is not always possible to reduce existing cost, cost “avoidance” is often reported as savings when measuring or evaluating purchasing performance.
Critical components: A set of plant equipment deemed vital to the safe, reliable, and profitable operation of the plant. Identification of critical components is a key step in the INPO AP-913, Revision 1 process.
Cross-Functional Teams: Groups of people from various organizational functions who are brought together to achieve clear, worthwhile and compelling goals that could not be reached without a team. Teaming leverages organizational resources while utilizing the expertise of team members. Purchasers typically participate on teams dealing with sourcing, commodities, quality, or product/service development.
Cycle Count: A physical count on inventory stock items. This provides the means to adjust inventory balance to the physical balance.
Decentralized Purchasing: This generally applies to multi-site organizations where each site has its own purchasing department.
Filed: 2008-06-06 EB-2007-0905 J5.1 Attachment

Internal Use Only Document Number:
Report N-REP-08130-10003 Sheet Number: Revision: Page:
N/A R001 87 of 96 Title:
ONTARIO POWER GENERATION NUCLEAR SUPPLY CHAIN - 2006 BENCHMARKING REPORT
N-TMP-10010-R006X
Demurrage: A fee charged by a carrier against a consignee for the detention of the carrier’s equipment in excess of allowable free time. The term is also used by suppliers of material that delivered product in a variety of returnable containers, such as gas cylinders.
Design Specification: A complete description of an item, including the composition of materials to be used in making the product, as well as size, shape, capacity, dimensions, tolerances, and sometimes method of treatment or manufacture.
Early Supplier Involvement (ESI): A practice that involves one or more selected suppliers with a buyer’s product design team early in the specification development process. The objective is to utilize the supplier’s expertise and experience in developing a product specification that is designed for effective and efficient manufacturing techniques.
Economic Order Quantity (EOQ): An order quantity model that can be used to determine the quantity of an item to be ordered or manufactured that tends to minimize total acquisition and inventory carrying costs. Its most common use today is for independent demand items managed in an order-point inventory management system.
Electronic Data Interchange (EDI): The direct computer-to-computer exchange of business information in a standard format. Transaction documents, such as purchase orders, invoices and shipping notices are transmitted electronically and entered directly into a supplier’s (or buyer’s) computer or into a third-party network for processing. Electronic funds transfer is a form of EDI whereby funds (or payments) are electronically exchanged from one party to another.
EOL: End-of-Life based upon the expiration of a nuclear plant’s operating license.
EPRI AP-908: A final draft process description developed by NSCSL in March 2006 and maintained by them with EPRI support. When issued, this document will replace NEI AP-908, Rev. 2. EUCG: Electric Utility Cost Group, a non-profit corporation of utility members that collects, analyzes and publishes cost and performance data on behalf of it’s membership.
Equipment Reliability (ER) process: The integration and coordination of a broad range of equipment reliability activities into one process for plant personnel to evaluate important station equipment, develop and implement long-term equipment health plans, monitor equipment performance and conditions, and make continuing adjustments to preventive maintenance tasks and frequencies based on equipment operating experience. This process includes activities normally associated with such programs as reliability-centered maintenance (RCM), preventive maintenance (periodic, predictive, and planned), maintenance rule, surveillance and testing, life cycle management (LCM) planning, and equipment performance and condition monitoring. The ER process is a core process within the SNPM.
Expedite: The act of contracting a supplier or carrier with the goal of speeding up the delivery date of an inbound shipment.
Fill Rate: The proportion of all stock requisitions that are filled from stock that is present on the shelf. The inverse of this is stock-out rate, which is the percentage of orders for which there is no stock on the shelves and therefore the order cannot be filled (resulting in a back order). These measurements can be calculated for any time period; in some retail or distribution firms it might be computed daily or weekly.
Filed: 2008-06-06 EB-2007-0905 J5.1 Attachment
Internal Use Only Document Number:
Report N-REP-08130-10003 Sheet Number: Revision: Page:
N/A R001 88 of 96 Title:
ONTARIO POWER GENERATION NUCLEAR SUPPLY CHAIN - 2006 BENCHMARKING REPORT
N-TMP-10010-R006X
Free On Board (F.O.B.): In domestic trade, and when the term is used with no further explanation, it means delivery of the goods with all charges paid aboard the carrier's equipment without cost to the buyer. However, the F.O.B. terms go far beyond this concept and establish a contractual arrangement in which title is transferred between supplier and purchaser at the F.O.B. point.
F.O.B. Destination, Freight Collect: Title passes from the supplier to the buyer at the destination point, and the freight charges are the responsibility of the purchaser. (The supplier owns the goods in transit and is responsible for filing loss and damage claims against the carrier, but the purchaser pays and bears the freight charges and files any overcharge claims.)
F.O.B. Destination, Freight Prepaid and Charged: Title passes at the destination point, and that the freight charges are paid by the supplier and added to the invoice. (The supplier pays the freight charges, owns the goods in transit, and files all claims for overcharges, loss and damages. The purchaser bears the freight charges.)
F.O.B. Destination, Freight Prepaid: Title passes from the supplier to the buyer at the destination point, and the supplier pays the freight charges. (The supplier pays and bears the freight charges, owns the goods in transit, and may file claims for overcharges, loss, and damage, etc.)
F.O.B. Origin, Freight Allowed: Purchaser obtains title where the shipment originates and is responsible for all claims against the carrier, but the supplier pays for the freight charges.
F.O.B. Origin, Freight Collect: Title passes to the buyer at the point of origin, and the buyer must pay the freight charges. (The buyer owns the goods in transit, and files all claims against the carrier.)
F.O.B. Origin, Freight Prepaid and Charged: Title passes to the buyer at the point of origin, and the freight charges are paid by the supplier and then collected from the purchaser by adding the amount of the freight charges to the invoice. (The supplier pays the freight charges and files claims for overcharges. The purchaser bears the freight charges, owns the goods in transit, and files claims for loss and damage with the carrier.)
Freight Bill Audit: A critical review of freight bills to determine classification, rating, or extension either by a third party or an inside auditor.
Freight Bill: The carrier's invoice for transportation charges applicable to a shipment.
Hazardous Materials: Materials that have been determined by the Department of Transportation (DOT) to be a risk to health, safety, and property; including such items as explosives, flammables, poisons, corrosives, and radioactive materials. These materials must be packaged, labeled, handled, and transported according to stringent regulation from several agencies (current U.S. regulations appear in the Code of Federal Regulations, Title 49, Parts 171-178). International shipments must comply with docket HM-181, where the term dangerous goods is often used interchangeably with hazardous materials.
Filed: 2008-06-06 EB-2007-0905 J5.1 Attachment

Internal Use Only Document Number:
Report N-REP-08130-10003 Sheet Number: Revision: Page:
N/A R001 89 of 96 Title:
ONTARIO POWER GENERATION NUCLEAR SUPPLY CHAIN - 2006 BENCHMARKING REPORT
N-TMP-10010-R006X
INPO AP-913: Equipment Reliability Process Description - A process description for the equipment reliability process offered to assist member utilities in maintaining high levels of safe and reliable plant operation in an efficient manner.
INPO AP-928: Work Management Process Description - A process description for the work management process offered to assist member utilities in identifying, planning, scheduling, and completing corrective maintenance, preventive maintenance, elective maintenance and fix-it-now/minor maintenance items while maintaining high levels of safe and reliable plant operation in an efficient manner.
In-Storage Maintenance: Describes those activities associated with periodic maintenance, adjustment or monitoring of items to prevent or detect deterioration while in storage.
Integrated Supply: A special type of partnering arrangement usually developed between a purchaser and a distributor on an intermediate to long-term basis. The objective of an integrated supply relationship is to minimize, for both buyer and supplier, the labor and expense involved in the acquisition and possession of MRO products items that are repetitive, generic, high transaction, and have a low unit cost.
Inventory Control: The effective management of inventories, including decisions about which items to stock at each location, how much stock to keep on hand at various levels of operation, when to buy, how much to buy, controlling pilferage and damage and managing shortages and backorders.
Inventory Holding (Carrying) Cost: The cost of keeping inventory on hand, including the opportunity cost of invested funds; storage and handling costs; taxes, insurance, shrinkage, and obsolescence-risk costs. Firms usually state an item's holding cost per time period as a percentage of the item's value, typically between 20 and 40 percent per year. Inventory Position: A measure of an inventory item's ability to satisfy future demand, considering scheduled receipts and on-hand inventory.
Inventory Turnover: A measure of the velocity of total inventory movement through the firm, found by dividing annual sales (at cost) by the average aggregate inventory value maintained during the year. Many firms calculate production inventory turnover rate as the annual inventory purchase value divided by the average production inventory value.
Investment Recovery: A systematic, centralized organizational effort to manage the surplus equipment/material and scrap recovery/marketing/disposition activities in a manner that recovers as much of the original capital investment as possible.
Invoice: A bill for goods or services being purchased that includes pertinent information with respect to the quantity, price, terms and nature of delivery.
ISO 9000: A comprehensive set of process and procedure quality management standards developed by the Internationals Standards Organization.
Just-In-Time (JIT) System: The basic JIT concept is an operation management philosophy whose dual objectives are to reduce waste and to increase productivity. Operationally, JIT minimizes inventory at all levels; materials purchased, transported, and processed “just in time” for their use in a subsequent stage of the operational process.
Filed: 2008-06-06 EB-2007-0905 J5.1 Attachment
Internal Use Only Document Number:
Report N-REP-08130-10003 Sheet Number: Revision: Page:
N/A R001 90 of 96 Title:
ONTARIO POWER GENERATION NUCLEAR SUPPLY CHAIN - 2006 BENCHMARKING REPORT
N-TMP-10010-R006X
Lead-time: The period of time from the date of a purchase order to the date of delivery of the order.
Lease-or-Buy Decisions: The decision concerning whether to contract for the possession and use of an asset owned by another party for a period of time, in return for lease payments, as opposed to purchasing the asset.
Letter of Intent: A preliminary contractual arrangement used to enter into preliminary agreements where further negotiation is required, pending a definitive contract.
Level I Receipt Inspector: Individual Level I receipt inspector shall be capable of performing, and recording data for inspections and tests required in accordance with documented procedures and/or industry practices. The individual shall be familiar with the tools and equipment to be used and shall have demonstrated proficiency in their use. The individual shall also be capable of determining that the calibration status of inspection and measuring equipment is current, that the measuring and test equipment is in proper condition and that the inspection and test procedures are approved.
Level II Receipt Inspector: A level II receipt inspector shall have all of the capabilities of a Level I inspector for the inspection or test category in question. Additionally, a Level II inspector shall have demonstrated capabilities of planning inspections and tests; in setting up tests, including preparation and set-up of related equipment, as appropriate; and in maintaining surveillance of the inspections or tests; in reporting inspection and test results and in evaluating the validity and acceptance of inspections and test results.
Life Cycle Costing: A cost-analysis tool which incorporates not only the purchase price of a piece of equipment, but all operating and related costs over the life of the item, including maintenance, down time and energy costs, as well as salvage value.
Life Cycle Management (LCM): Equivalent to ER sub-process ER001 of the Standard Nuclear Performance Model, Revision 3, dated April 2003 (SNPM). The integration of aging management and economic planning to optimize the operation, maintenance, and service life of SSCs; maintain an acceptable level of performance and safety and maximize return of investment over the service life of the plant. LCM plans feed the NAM process.
Logistics: The process of planning, implementing, and controlling the efficient, cost-effective flow and storage of materials and related information from point of origin to point of consumption.
Long Range Planning (LRP): Documentation of activities related to anticipated management, cultural, organizational and other resource-related changes required in response to business conditions as measured on a time horizon between five years and the end of plant life.
Maintenance Assessing: Maintenance Planning work performed in the work management process in sub-process WM001.
Maintenance Rule: A regulation involving the effectiveness of maintenance delineated by Title 10, Part 50.65 of the Code of Federal Regulations (10 CFR 50.65).
Make-Or-Buy Decisions: A determination of what products or services a firm should manufacture or provide in-house, as opposed to purchasing from outside sources.
Filed: 2008-06-06 EB-2007-0905 J5.1 Attachment

Internal Use Only Document Number:
Report N-REP-08130-10003 Sheet Number: Revision: Page:
N/A R001 91 of 96 Title:
ONTARIO POWER GENERATION NUCLEAR SUPPLY CHAIN - 2006 BENCHMARKING REPORT
N-TMP-10010-R006X
Material Analyst: A Supply Chain function for coordination and management of facility catalog (CAT ID).
Materials Management: A managerial and organizational approach used to integrate the supply management function in an organization. It involves planning, acquisition, flow and distribution of product materials from the raw material to the finished product. Activities typically included are procurement, inventory management, receiving, stores and warehousing, in-plant materials handling, production planning and control, traffic and surplus and salvage.
Material Request (MR): A PassPort vehicle that supports the request of material or services. MR provides the means to record the accounting requirements and justification to procure material or services. The MR is an on-line reference of material or service requirements that may be associated with Work Control, Engineering Change Control and Material Management.
Minimum Reorder Point: A predetermined inventory level that triggers a need to place an order. This minimum level (considering safety stock) provides inventory to meet anticipated demand during the time it takes to receive the order.
Minority Business Enterprise (MBE): Any legal entity, organized to engage in commercial transaction, that is at least fifty-one percent owned and controlled by one or more minority persons.
MRO: Maintenance, repair, and operating supplies that are consumed in the operations process, but which do not become part of the product of the operation (e.g., soap, lubricating oil, machine repair parts, office supplies, etc.)
NAPM: National Association of Purchasing Management, Inc. An education and research association dedicated to advancing the field of purchasing domestically and internationally. It had approximately 36,000 members in 1992, active in 172 affiliate organizations across the country.
Negotiation Team: A team constituted for the purpose of conducting a specific negotiation. Team members typically represent the functional areas to be addressed in the negotiation process; the purchasing member usually chairs the team.
Negotiation: In the purchasing context, negotiation is an exploratory and a bargaining process (planning, reviewing, analyzing, compromising) involving a buyer and seller, each with their own viewpoints and objectives, seeking to reach a mutually satisfactory agreement on all phases of a procurement transaction including price, service, specifications, technical and quality requirements, payment terms, etc.
Nuclear Asset Management (NAM): The process for making resource allocation and risk management decisions at all levels of a nuclear generation business to maximize value and profitability for all stakeholders while maintaining other stakeholder interests such as safety and regulatory compliance. The NAM process resides within the Business Services Process, SS002 of the SNPM. Refer to the process maps in Section 4. Obsolescence – Plant: Utility no longer uses the part due to plant modifications.
Obsolescence – Vendor: Manufacturer no longer makes the part.
OEM: Original Equipment Manufacturer.
Filed: 2008-06-06 EB-2007-0905 J5.1 Attachment

Internal Use Only Document Number:
Report N-REP-08130-10003 Sheet Number: Revision: Page:
N/A R001 92 of 96 Title:
ONTARIO POWER GENERATION NUCLEAR SUPPLY CHAIN - 2006 BENCHMARKING REPORT
N-TMP-10010-R006X
Order Cycle: The time that elapses from placement of an order until receipt of the order, including time for order transmittal, processing, preparation and shipping.
Outsourcing: A version of the make-or-buy decision in which a firm elects to purchase an item or service which was previously provided in-house.
Packaging List: An itemized listing of package contents, which is prepared by the shipper.
PassPort: An Enterprise Asset Management (EAM) solution that provides an integrated system for managing the entire life cycle of OPG Nuclear's worldwide assets. PassPort provides the day-to-day working tools to manage, control, and report all aspects of an asset.
Performance Measurement: A management technique for evaluating the performance of a particular function or person.
Performance Specification: Specification that details the functional performance criteria required for a particular material or product, as opposed to a design specification, which prescribes in detail the design characteristics and manufacturing methodology for the material or product.
Periodic Maintenance: A form of preventive maintenance consisting of servicing, parts replacement, surveillance, or testing at predetermined intervals of calendar time, operating time, or number of refueling cycles.
Perpetual Inventory System: An inventory control record system, which requires immediate recording of transactions (receipts and withdrawals) for each item carried in inventory. If posted accurately, the inventory records are up to date and should agree with the actual stock count in the warehouse.
Picking: The process of “picking” items from warehouse stock and assembling the items required to fill an order. Usually performed with the assistance of a picking list.
Planned Maintenance: A form of preventive maintenance consisting of refurbishment or replacement that is scheduled and performed to preclude failure of an SSC (structures, systems, and components).
Planned Order Release (POR): A planned authorization for a supplier to release (to ship) material against an existing contract. As used in materials requirements planning system operation, the POR indicates when a release for a specified quantity of an item is to be issued; the release date is the planned receipt date, minus the lead-time. Predefined Maintenance: Ontario Power Generation term for preventive maintenance.
Preventive Maintenance (PM): Actions that detect, preclude, or mitigate degradation of functional structures, systems, and components (SSC) to sustain or extend its useful life by controlling degradation and failures to an acceptable level. There are three types of preventive maintenance: periodic, predictive, and planned.
Process: A process is a sequence of behaviors or series of steps designed to produce a product or service; tangible structures established to direct the behavior of individuals in a predictable, repeatable fashion as they perform various tasks. A process map is a tool to describe the scope, core activities, conditions and relationships of a particular process. It consists of a process diagram and words describing the process steps.
Filed: 2008-06-06 EB-2007-0905 J5.1 Attachment

Internal Use Only Document Number:
Report N-REP-08130-10003 Sheet Number: Revision: Page:
N/A R001 93 of 96 Title:
ONTARIO POWER GENERATION NUCLEAR SUPPLY CHAIN - 2006 BENCHMARKING REPORT
N-TMP-10010-R006X
Process Owner: The individual that coordinates the various functions and work activities at all levels of a process, regardless of the functional organizations involved. They have the resource control and job skills to evaluate overall process operation and to evaluate potential process improvements. They design and manage the process end-to-end so as to ensure optimal overall performance. The process owner is responsible for ensuring the total process is both effective and efficient, and that appropriate performance measures are in place to measure the process accordingly and ensure performance is continually improved.
Process Performance Indicators (PIs): Measures that have been developed for monitoring and trending of equipment performance process at various stages with the intention of noting places in the process that may be ineffective.
Procurement: The typical activities of specifications development, value analysis, supplier market research, negotiation, buying activities, contract administrations and perhaps inventory control, traffic, receiving and stores.
Public (3rd Party) Warehouse: A place for storage of goods managed by a firm that offers the storage service to the public for a fee.
Purchase Order: A written contractual document prepared by a buyer to describe all terms and conditions of a purchase.
Purchase Plan: Many firms develop an annual purchase plan for each major class of materials purchased. Such a plan involves an analysis of expected demand, analysis of the supply market, analysis of specific suppliers, sometimes value analysis of the item and development of a budget. These activities then culminate in the development of purchasing plan objectives and specific purchasing strategies. Subsequent purchasing actions during the year are based on this plan.
Purchase Requisition: A written or computerized request to the purchasing department for the procurement of good or services from suppliers.
Purchasing: One of the major business functions of any organization. A purchaser typically responsible for the acquisition of required materials, services, and equipment.
Quality Assurance: A management function that includes establishing specifications that can be met by suppliers; utilizing suppliers that have the capability to provide adequate quality within those specifications; utilizing control processes that assure high-quality products and services; and developing the means for measuring the product, service, and cost performance of suppliers and comparing it with requirements.
Quality Control: The quality assurance activity that measures performance and compares it with specification requirements, as a basis for controlling output quality levels.
Receiving Inspection: An inspection at the receiving station to determine that the correct quantity and type of material was shipped, and to ascertain the general condition of the material with respect to damage. This inspection is different from that of a technical inspection.
Receiving: The function of receiving and processing incoming materials.
Reorder Point System: A continuous-review inventory control system in which an order is placed whenever a withdrawal brings the inventory position to a predetermined reorder point level.
Filed: 2008-06-06 EB-2007-0905 J5.1 Attachment

Internal Use Only Document Number:
Report N-REP-08130-10003 Sheet Number: Revision: Page:
N/A R001 94 of 96 Title:
ONTARIO POWER GENERATION NUCLEAR SUPPLY CHAIN - 2006 BENCHMARKING REPORT
N-TMP-10010-R006X
Request for Proposal (RFP): A solicitation document used to obtain offers to be used either in a firm-bid purchasing process or in a negotiated purchasing process.
Request for Quotation (RFQ): A request used to obtain approximate information for planning purposes; in such cases, the fact should be clearly stated in the request.
Reverse Engineering: Process by which the end user of a product elects to make rather than buy the product using required original specifications and equivalent standards of quality. This strategy is commonly employed as a cost savings measure for critical components or in the event the product is no longer available from the original supplier.
Risk Management: Control and monitoring of the likelihood and consequences of events which could challenge the enterprise relative to safety, cost, and performance.
Safety Stock: Additional inventory held as a buffer against uncertainties in demand or in the supply chain.
Salvage: Surplus material or equipment that has a market value and can be sold.
Scrap Material: Residue from operations and production items that cannot be reworked or used for the original intended purpose.
Shrinkage: Occurs when inventory is lost, stolen or otherwise misplaced.
Sourcing: The process of identifying potential firms that could provide needed products or services for the acquiring organization.
Standard Nuclear Performance Model (SNPM): The Standard Nuclear Performance Model, Revision 4, July 2005, is an industry-guiding document that is the result of a six year effort by NEI, INPO and the EUCG to publish and maintain a comprehensive model that includes all INPO and NEI process descriptions, an aligned set of activity-based costing definitions for use in submission of cost data and an aligned set of key business performance measures.
Standard: A uniform identification for definite characteristics of quality, design, performance, quantity, or service.
Standardization: The process of developing standards in of which a large variety of similar items are reduced to a minimal variety that meets all usage requirements. Inventory costs and investment costs usually are reduced in the process.
Station Condition Record: Ontario Power Generation method used to document, evaluate, and correct an adverse condition related to personnel performance, procedure, or programs, and an adverse condition causing or identified as a result of an event.
Stock Level: The desired quantity of stock to be carried.
Stock Out: Occurs when items normally carried in stock are depleted.
Supplier Development: A systematic organizational effort to create and maintain a network of competent suppliers, and to improve various supplier capabilities are necessary for the purchasing organization to meet increasing competitive challenges.
Supplier Evaluation: Objective analysis of existing suppliers by evaluating past performance, or a preliminary assessment of potential suppliers. Suppliers typically are evaluated on the basis of their technical quality, delivery, service, cost and management capabilities.
Filed: 2008-06-06 EB-2007-0905 J5.1 Attachment

Internal Use Only Document Number:
Report N-REP-08130-10003 Sheet Number: Revision: Page:
N/A R001 95 of 96 Title:
ONTARIO POWER GENERATION NUCLEAR SUPPLY CHAIN - 2006 BENCHMARKING REPORT
N-TMP-10010-R006X
Supplier Partnership: A partnership between a purchasing and supply firm involves mutual commitment over an extended time period to work toward to the mutual benefit of both parties, by sharing relevant information and the risks and rewards of the relationship. These relationships require a clear understanding of expectations, open communication and information exchange, mutual trust and a common direction for the future. Such an arrangement is a collaborative business activity that does not involve the formation of a legal partnership.
Supply Chain Management: A systems management concept designed to optimize material costs, quality, and service. This is accomplished by consolidating the following operating activities: purchasing, transportation, warehousing and quality assurance for incoming materials inventory management and their internal distribution. These activities normally are combined in a single department, similar to the arrangement under a materials management organization.
Surplus and Scrap Disposal (Investment Recovery): The function of disposing of or reclaiming scrap and surplus goods. Common methods are reclamation for use in operations, use elsewhere in the firm, selling to another firm, returning to suppliers, utilizing scrap dealers and brokers, sale of surplus items to employees, donations to institutions, and discarding or destroying the goods.
Systems Contract: A contract generated by the purchasing department that authorizes designated employees of the buying firm, using a predetermined release system, to place orders directly with the supplier for specified materials during a given contract period. In the public sector, this type of contract is often called an indefinite-delivery type or term contract. A systems contract typically is an extension and a more sophisticated form of a blanket order.
Time and Materials Contracts: Such contracts typically provide for the acquisition of services on the basis of: (1) direct labor hours at specified fixed hourly rates that include wages, overhead, general and administrative expenses, and profit; and (2) materials, generally at cost, including, if appropriate, material handling costs.
Total Cost of Ownership: Cost of investment over the lifetime employed. See Life Cycle Costing.
Total Cost: Sometimes called all-in costs. In purchasing, total cost generally includes the price of the purchase and transportation, plus indirect handling, inspection, quality, rework, maintenance, incremental operations, and all other follow-on costs associated with the purchase.
T-X: The number (X) of weeks before the “implementation week” in the work management process for each work item. Nuclear plants typically manage work in a rolling, periodic e.g., 12 or 13-week) schedule. “T-8” would mean the work week occurring eight weeks prior to implementation. In the work management processes, standard activities and milestones should occur in the “T-x” countdown to maintain the scheduled item “on track.” If problems occur affecting the milestones, then the item could be rescheduled for a later implementation week. Unit of Issue: A unit of measurement in which an item is issued from stock.
Value Added: The value added to a product or service at each stage of its production and distribution, based on its increased value at that stage.
Filed: 2008-06-06 EB-2007-0905 J5.1 Attachment
Internal Use Only Document Number:
Report N-REP-08130-10003 Sheet Number: Revision: Page:
N/A R001 96 of 96 Title:
ONTARIO POWER GENERATION NUCLEAR SUPPLY CHAIN - 2006 BENCHMARKING REPORT
N-TMP-10010-R006X
Value Engineering: A value analysis conducted at the design engineering stage of the product development process.
Zero-Base Pricing: A form of cost analysis based on reviewing all cost elements and working with internal customers and suppliers to reduce the total combined cost of purchased materials, equipment, labor and services
Filed: 2008-06-06 EB-2007-0905 J5.1 Attachment