Chemical and Physical Properties of the Fryeburg, Lovewell ...
date post
19-Dec-2015Category
view
219download
10
1
Understanding Economics
3rd editionby Mark Lovewell, Khoa Nguyen and Brennan Thompson
Chapter 4Costs of Production
Copyright © 2005 by McGraw-Hill Ryerson Limited. All rights reserved.

2Copyright © 2005 by McGraw-Hill Ryerson Limited. All rights reserved.
Learning Objectives
In this chapter you will:1. learn about economic costs (explicit and
implicit) of production and economic profit2. analyze short-run (total, average, and
marginal) products, and the law of diminishing marginal returns
3. derive short-run (total, average, and marginal) costs
4. examine long-run results of production (increasing returns to scale, constant to scale, and decreasing to scale) and long-run costs

3Copyright © 2005 by McGraw-Hill Ryerson Limited. All rights reserved.
T 1, Production,costs, and profit
Define:”business”,”production”,”inputs”,”output”, See page 85.
Types of Production There are three main sectors in the economy
• the primary sector consists of industries that extract or cultivate natural resources
• the secondary sector consists of industries that fabricate or process goods
• the service sector consists of trade and information industries

4Copyright © 2005 by McGraw-Hill Ryerson Limited. All rights reserved.
Productive Efficiency
Productive efficiency: making a given quantity of output at the lowest cost
Businesses choose from different production processes• a labour-intensive process employs more
labour and less capital• a capital-intensive process employs more
capital and less labour

5Copyright © 2005 by McGraw-Hill Ryerson Limited. All rights reserved.
Economic Costs & Economic profit
Economic costs include• explicit costs: payments made by a
business to business or people outside of it• implicit costs:the owner’s opportunity costs
of being involved with a business.• Economic costs = explicit costs + implicit
costs Economic profit: the excess of a business’s
total revenue over its economic costs• Accounting profit: the excess of a business’s
total revenue over its explicit costs• Economic profit = total revenue – economic
costs

6Copyright © 2005 by McGraw-Hill Ryerson Limited. All rights reserved.
Accounting Vs. Economic Profit
Accounting profit is total revenue minus explicit costs
Because accountants only consider explicit costs, accounting profit always exceeds economic profit by the amount of the business’s implicit costs.

7Copyright © 2005 by McGraw-Hill Ryerson Limited. All rights reserved.
T 2, Production in the Short Run (a)
In the short run• some inputs (such as capital) are fixed• other inputs (such as labour) are variable
Inputs are combined to make a business’s total product• Total product: the overall quantity of
output produced with a given workforce• average product is total product divided
by the number of workers• marginal product is the extra total
product with an additional worker

8Copyright © 2005 by McGraw-Hill Ryerson Limited. All rights reserved.
Average product = total product (q)
number of workers (L)
Marginal product = change in total product (Δ q) change in workforce (Δ L)

9Copyright © 2005 by McGraw-Hill Ryerson Limited. All rights reserved.
The Law of Diminishing Marginal Returns
Short-run production is determined by the law of diminishing marginal returns
the law of diminishing marginal returns:• At some point, as more units of a variable
input are added to a fixed input, the marginal product will start to decrease
average product also falls after some point

10Copyright © 2005 by McGraw-Hill Ryerson Limited. All rights reserved.
Relating Average and Marginal Values
Average and marginal values are related using three rules• if an average value rises then the marginal
value must be above the average value• if an average value falls then the marginal
value must be below the average value• if an average value stays constant then the
marginal value must equal the average value

11Copyright © 2005 by McGraw-Hill Ryerson Limited. All rights reserved.
0 1 2 3 4 5 6
Number of Workers Employed per Day
T-S
hir
ts P
rod
uced
per
Day
50
100
150
200
250
300
Total, Marginal, and Average ProductsFigure 4.2, Page 89 and Figure 4.3, Page 91
0
1 2 3 4 5 6
Number of Workers Employed per DayT-S
hir
ts P
rod
uced
per
Day
40
60
80
100
120
-20
20
Labour(L)
(workersper day)
Total Product
(q)(T-shirtsper day)
MarginalProduct(Δq/ΔL)(T-shirtsper day)
Average Product
(q/L)(T-shirts per day)
0
1
2
3
4
5
6
0
80
200
250
270
280
270
--
80
100
83.3
67.5
56
45
80
120
50
20
10
-10
TP
MP
AP
Diminishingreturns set in

12Copyright © 2005 by McGraw-Hill Ryerson Limited. All rights reserved.
T 3, Costs in the Short Run
Short-run costs include• fixed costs (costs of all fixed inputs)• variable costs (costs of all variable inputs)• total cost (fixed costs + variable costs)
Marginal Cost (a) Marginal cost is the extra cost of producing an
extra unit of output• it equals the change in total cost divided by the
change in total product The marginal cost curve is shaped like a “J”
because of the law of diminishing marginal returns

13Copyright © 2005 by McGraw-Hill Ryerson Limited. All rights reserved.
Marginal Cost (b)Figure 4.6, Page 93
0 50 100 150 200 250 300
Quantity of T-Shirts Produced Per Day
$ p
er
T-S
hir
t
2
4
6
8
10
12
MC
Diminishingreturns set in

14Copyright © 2005 by McGraw-Hill Ryerson Limited. All rights reserved.
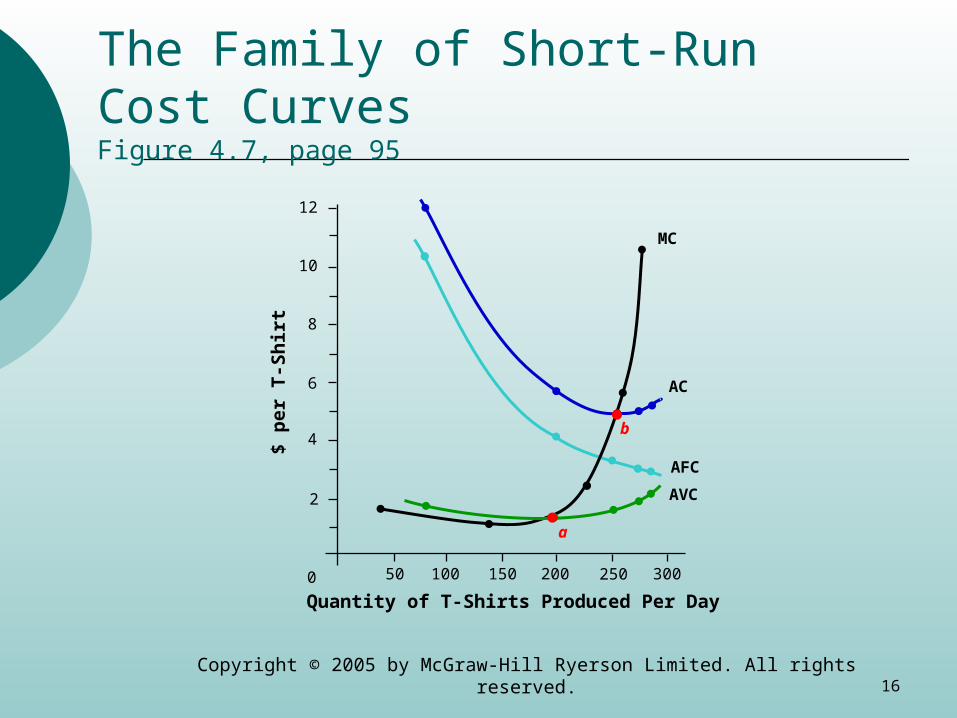
Per-Unit Costs
Per-unit costs include• average fixed cost (fixed costs divided by total
product) AFC = FC/Q
• average variable cost (variable costs divided by total product) AVC = VC/Q
• average cost either total cost divided by total product or average fixed cost + average variable
cost AC= AFC + AVC

15Copyright © 2005 by McGraw-Hill Ryerson Limited. All rights reserved.
Short-Run Costs for Pure ‘n’ Simple T-Shirts Figure 4.5, Page 93
Labour
(L)
TotalProduct
(q)
FixedCosts(FC)
VariableCosts(VC)
TotalCost(TC)
(FC + VC)
MarginalCost(MC)
(ΔTC/Δq)
AverageFixed Costs
(AFV)(FC/q)
AverageVariable
Costs(AVC)(VC/q)
AverageCost(AC)
(AFC + AVC)
0
1
2
3
4
5
0
80
200
250
270
280
$825
825
825
825
825
825
$0
140
300
425
535
640
$825
965
1125
1250
1360
1465
$1.75
1.33
2.50
5.50
10.50
140
160
125
110
105
80
120
50
20
10
$10.31
4.13
3.30
3.06
2.95
$1.75
1.50
1.70
1.98
2.29
$12.06
5.63
5.00
5.04
5.24
Marginal Product
(MP)
16Copyright © 2005 by McGraw-Hill Ryerson Limited. All rights reserved.
The Family of Short-Run Cost CurvesFigure 4.7, page 95
0 50 100 150 200 250 300
Quantity of T-Shirts Produced Per Day
$ p
er
T-S
hir
t
2
4
6
8
10
12
AVC
AFC
MC
AC
b
a

17Copyright © 2005 by McGraw-Hill Ryerson Limited. All rights reserved.
T 4, Returns to Scale (a)
All inputs can be changed by the same proportion in the long run increasing returns to scale means
the % change in output > the % change in inputs
constant returns to scale means the % change in output = the % change in inputs
decreasing returns to scale means the % change in output < the % change in inputs

18Copyright © 2005 by McGraw-Hill Ryerson Limited. All rights reserved.
Returns to Scale (b)
Increasing returns to scale are caused by the division of labour or specialized capital or specialized management (see page 97)
Constant returns to scale arise whenever making more of a product means repeating exactly the same tasks
Decreasing returns to scale are caused by management difficulties or limited natural resources (see page 98)

19Copyright © 2005 by McGraw-Hill Ryerson Limited. All rights reserved.
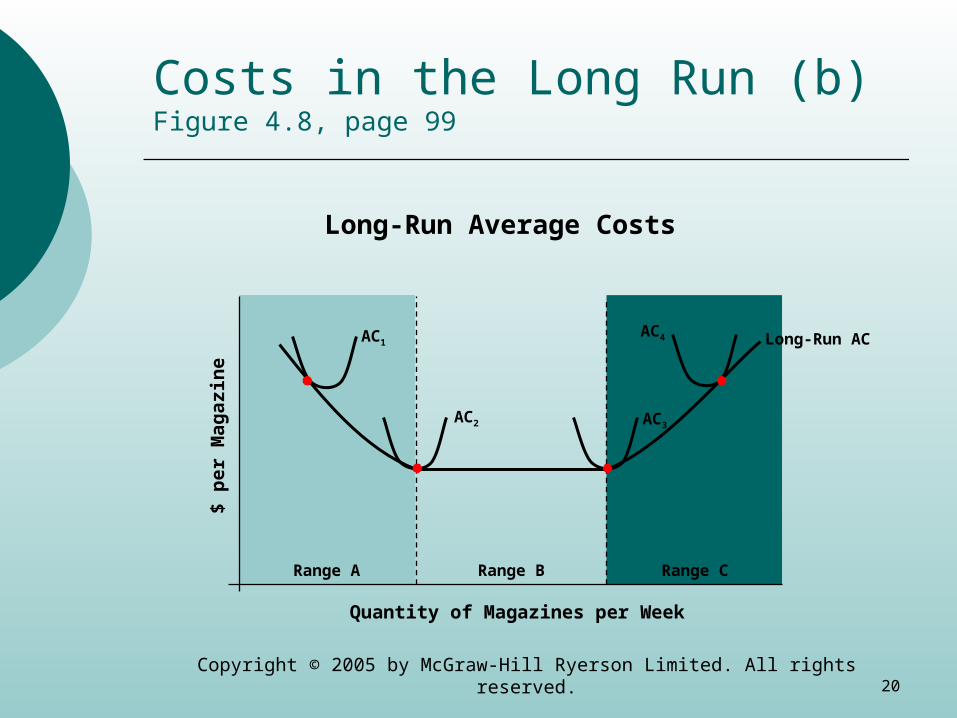
Costs in the Long Run (a)
Long-run average cost is the minimum short-run average cost at every output
The long-run average cost curve is saucer-shaped because of various ranges of returns to scale• initial range of increasing returns to scale• middle range of constant returns to scale• final range of decreasing returns to scale
20Copyright © 2005 by McGraw-Hill Ryerson Limited. All rights reserved.
Quantity of Magazines per Week
$ p
er
Mag
azi
ne
Range A Range B Range C
Long-Run Average Costs
Costs in the Long Run (b)Figure 4.8, page 99
AC1
AC2 AC3
AC4 Long-Run AC

21Copyright © 2005 by McGraw-Hill Ryerson Limited. All rights reserved.
Costs in the Long Run (b)Figure 4.9, page 100
Possible Long-Run Average Costs
Quantity of Output
$ p
er
Un
it
Extended Range ofIncreasing Returnsto Scale
Quantity of Output
$ p
er
Un
it
Extended Range ofConstant Returnsto Scale
Quantity of Output
$ p
er
Un
it
Extended Range ofDecrease Returnsto Scale