1. The Crop Sector in Ethiopia-Current and Future ...
31
The Crop Sector in Ethiopia- Current and Future Prospects 6 th March 2018 Eyasu Abraha (PhD), Minister, FDRE-MoANR
Transcript of 1. The Crop Sector in Ethiopia-Current and Future ...
The Crop Sector in Ethiopia-Current and Future Prospects
6th March 2018
Eyasu Abraha (PhD), Minister, FDRE-MoANR
• Background
• Ethiopia's Strategic Development Plan and Directions
• Agricultural Commercialization Cluster (ACC)
• Major Efforts
• Major Drivers of Agriculture Transformation
• Agro-ecology and crop distribution of Ethiopia
• Crop Production, Productivity and Input use status
• Natural Resource Management and Climate Resilient Green Economy(CRGE)
• Ethiopian Soil Fertility Status, Acidic Soil and Vertisol Management
• Irrigation, Agricultural Mechanization, Extension service & Research
• Agri-business and Marketing
• Cross-Cutting Areas
• Implementation and Partnership capacity (collaborators)
• Focus area on future intervention
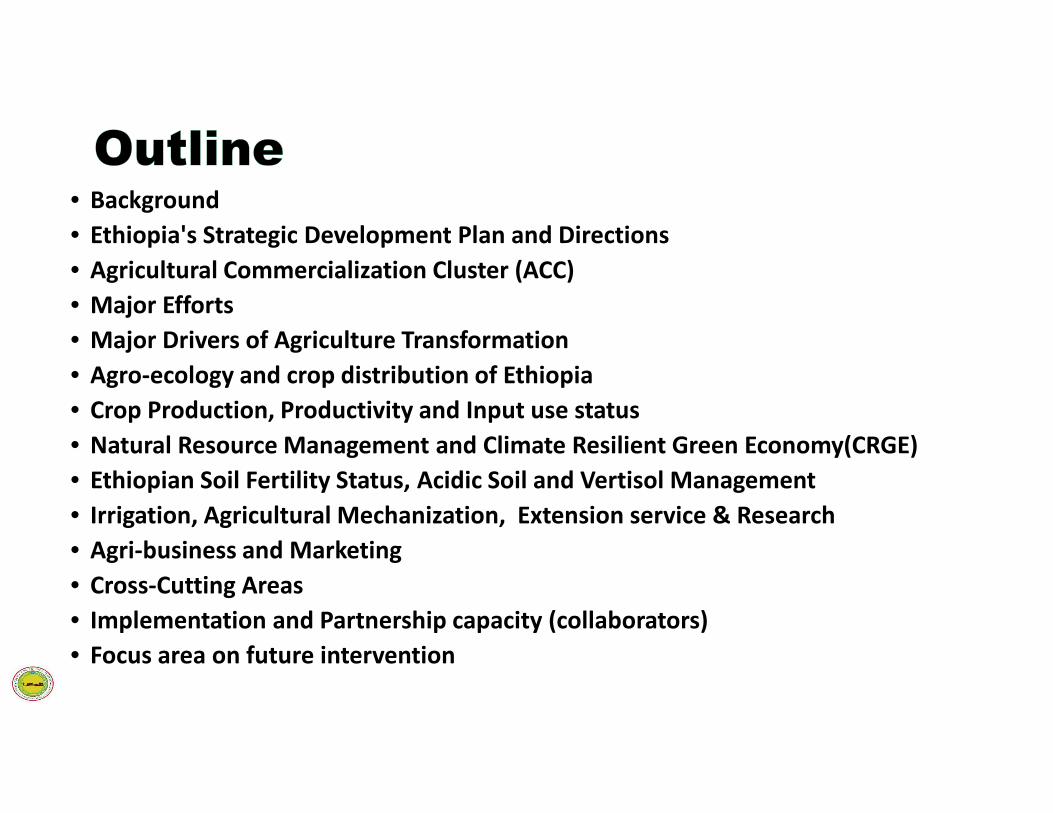
• Agriculture is the most important economic sector in Ethiopia
� 41% of GDP,
� 80% of its employment and
� 90% of its export earnings
• Ethiopia has a total land area of 111.5 millions ha.
� Out of which about 74.1 million ha (66%) is arable land
• In 2015/2016, the total cultivated area is about 13 million hectare
Malt Barley (irrigated)
Bread Wheat
Gluten Free TeffCorn/maize
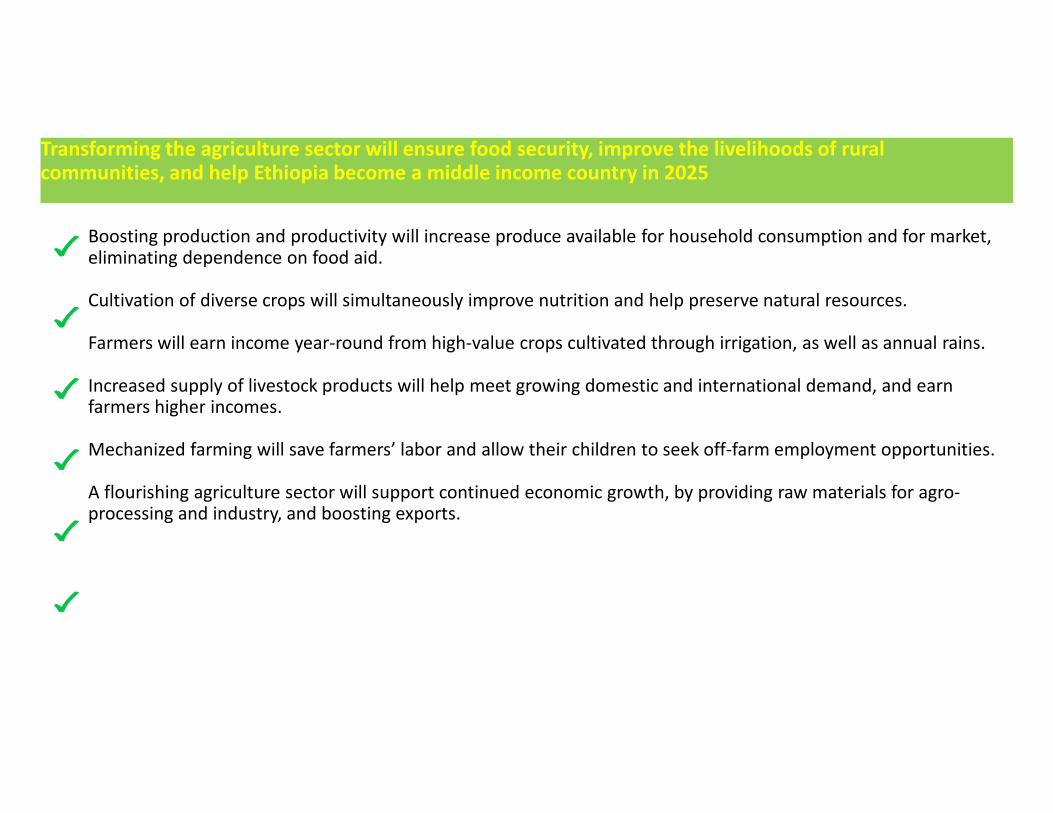
Transforming the agriculture sector will ensure food security, improve the livelihoods of rural communities, and help Ethiopia become a middle income country in 2025
Boosting production and productivity will increase produce available for household consumption and for market, eliminating dependence on food aid.
Cultivation of diverse crops will simultaneously improve nutrition and help preserve natural resources.
Farmers will earn income year-round from high-value crops cultivated through irrigation, as well as annual rains.
Increased supply of livestock products will help meet growing domestic and international demand, and earn farmers higher incomes.
Mechanized farming will save farmers’ labor and allow their children to seek off-farm employment opportunities.
A flourishing agriculture sector will support continued economic growth, by providing raw materials for agro-processing and industry, and boosting exports.
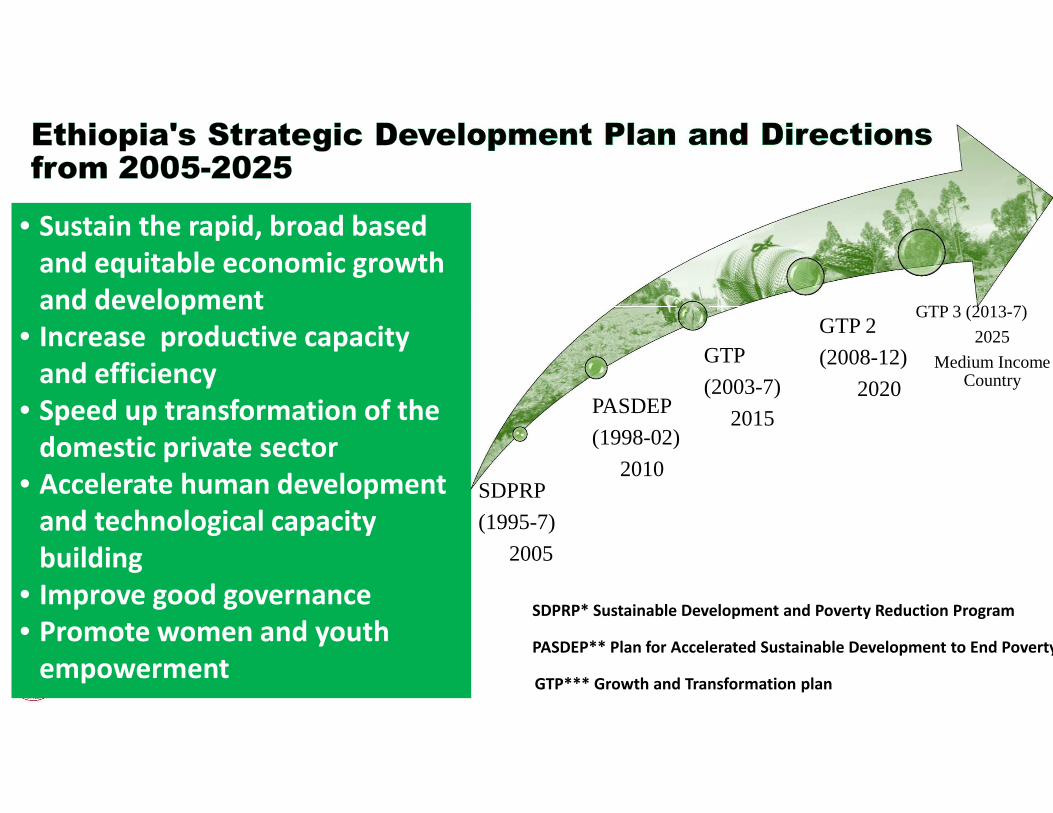
• Sustain the rapid, broad based
and equitable economic growth
and development
• Increase productive capacity
and efficiency
• Speed up transformation of the
domestic private sector
• Accelerate human development
and technological capacity
building
• Improve good governance
• Promote women and youth
empowerment
SDPRP
(1995-7)
2005
PASDEP
(1998-02)
2010
GTP
(2003-7)
2015
GTP 2
(2008-12)
2020
GTP 3 (2013-7)
2025
Medium Income Country
SDPRP* Sustainable Development and Poverty Reduction Program
PASDEP** Plan for Accelerated Sustainable Development to End Poverty
GTP*** Growth and Transformation plan
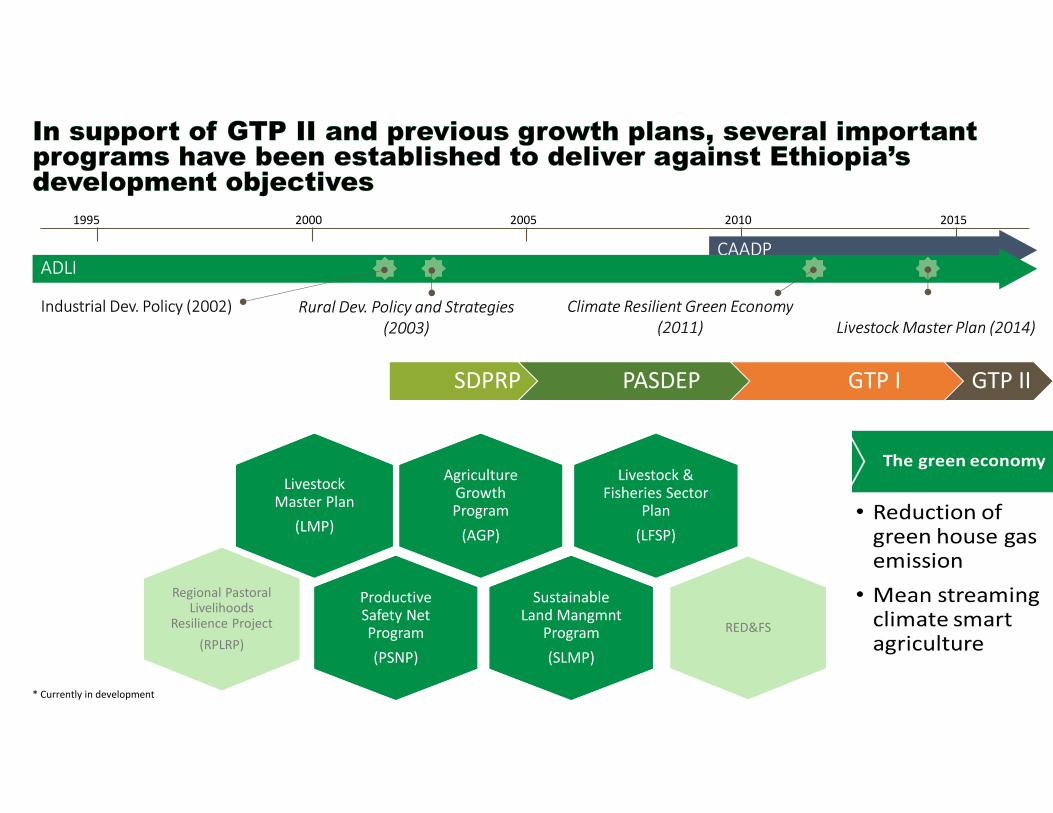
1995 2000 2005 2010 2015
CAADP
Industrial Dev. Policy (2002) Rural Dev. Policy and Strategies
(2003)
ADLI
Climate Resilient Green Economy
(2011) Livestock Master Plan (2014)
SDPRP PASDEP GTP I GTP II
Agriculture Growth Program
(AGP)
Agriculture Growth Program
(AGP)
Livestock Master Plan
(LMP)
Livestock Master Plan
(LMP)
Productive Safety Net Program
(PSNP)
Productive Safety Net Program
(PSNP)
Sustainable Land Mangmnt
Program
(SLMP)
Sustainable Land Mangmnt
Program
(SLMP)
Livestock & Fisheries Sector
Plan
(LFSP)
Livestock & Fisheries Sector
Plan
(LFSP)
RED&FS
Regional Pastoral Livelihoods
Resilience Project
(RPLRP)
* Currently in development
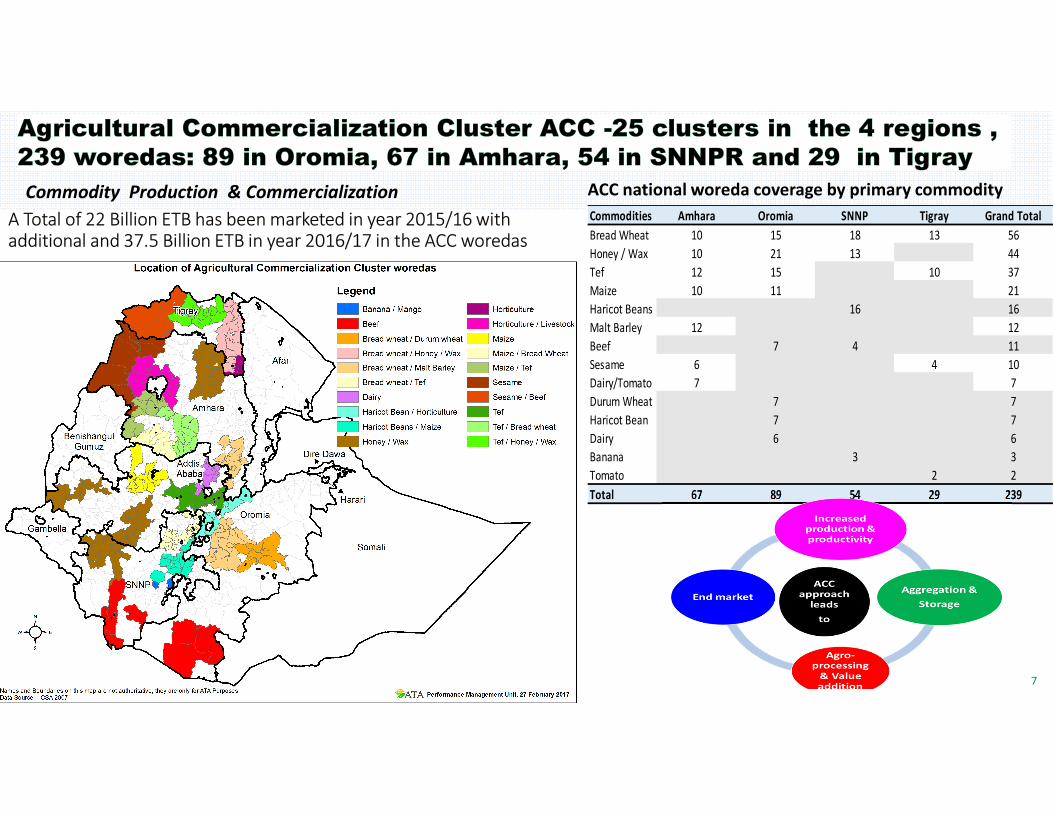
7
Commodities Amhara Oromia SNNP Tigray Grand Total
Bread Wheat 10 15 18 13 56
Honey / Wax 10 21 13 44
Tef 12 15 10 37
Maize 10 11 21
Haricot Beans 16 16
Malt Barley 12 12
Beef 7 4 11
Sesame 6 4 10
Dairy/Tomato 7 7
Durum Wheat 7 7
Haricot Bean 7 7
Dairy 6 6
Banana 3 3
Tomato 2 2
Total 67 89 54 29 239
ACC national woreda coverage by primary commodity Commodity Production & Commercialization
A Total of 22 Billion ETB has been marketed in year 2015/16 with additional and 37.5 Billion ETB in year 2016/17 in the ACC woredas
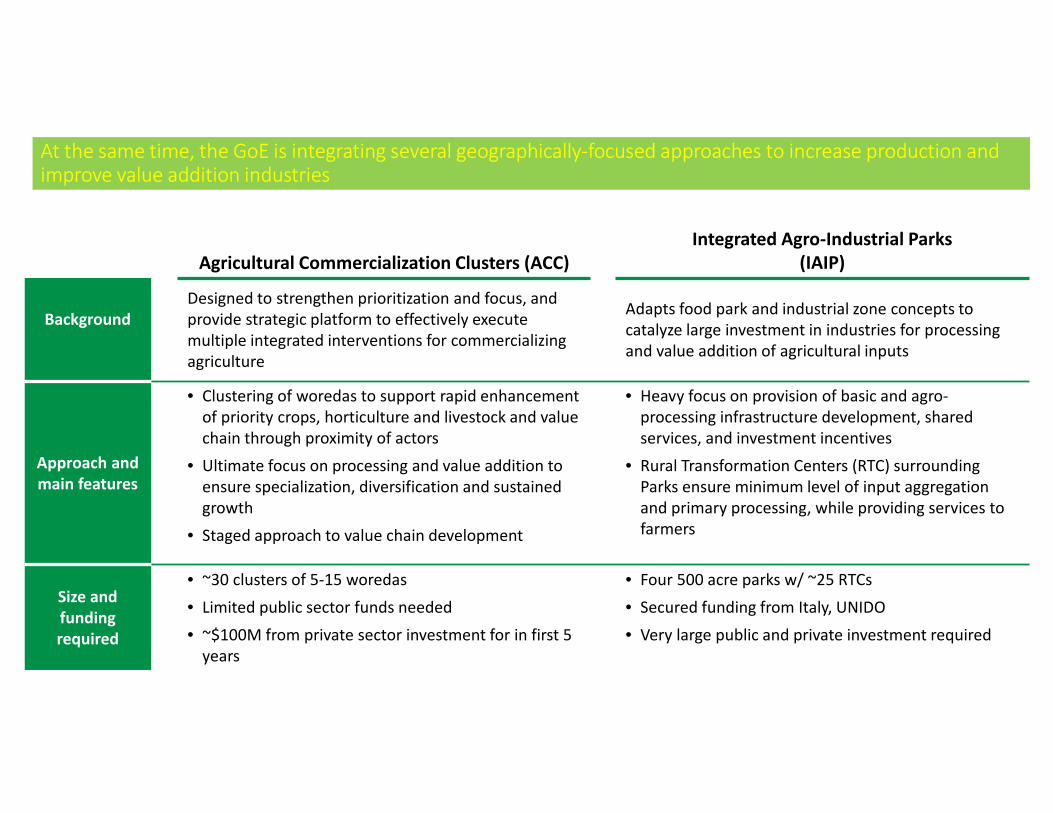
At the same time, the GoE is integrating several geographically-focused approaches to increase production and improve value addition industries
Agricultural Commercialization Clusters (ACC)
Integrated Agro-Industrial Parks
(IAIP)
Background
Designed to strengthen prioritization and focus, and
provide strategic platform to effectively execute
multiple integrated interventions for commercializing
agriculture
Adapts food park and industrial zone concepts to
catalyze large investment in industries for processing
and value addition of agricultural inputs
Approach and
main features
• Clustering of woredas to support rapid enhancement
of priority crops, horticulture and livestock and value
chain through proximity of actors
• Ultimate focus on processing and value addition to
ensure specialization, diversification and sustained
growth
• Staged approach to value chain development
• Heavy focus on provision of basic and agro-
processing infrastructure development, shared
services, and investment incentives
• Rural Transformation Centers (RTC) surrounding
Parks ensure minimum level of input aggregation
and primary processing, while providing services to
farmers
Size and
funding
required
• ~30 clusters of 5-15 woredas
• Limited public sector funds needed
• ~$100M from private sector investment for in first 5
years
• Four 500 acre parks w/ ~25 RTCs
• Secured funding from Italy, UNIDO
• Very large public and private investment required
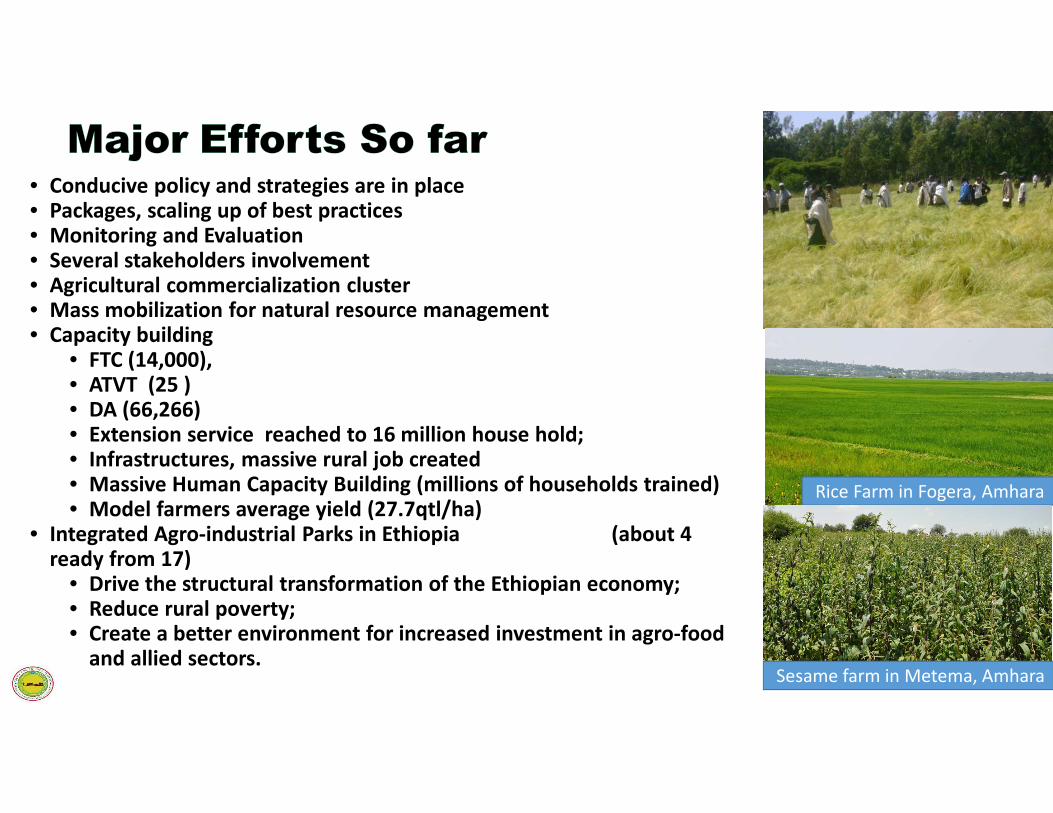
• Conducive policy and strategies are in place• Packages, scaling up of best practices• Monitoring and Evaluation • Several stakeholders involvement • Agricultural commercialization cluster• Mass mobilization for natural resource management• Capacity building
• FTC (14,000), • ATVT (25 )• DA (66,266)• Extension service reached to 16 million house hold; • Infrastructures, massive rural job created • Massive Human Capacity Building (millions of households trained)• Model farmers average yield (27.7qtl/ha)
• Integrated Agro-industrial Parks in Ethiopia (about 4 ready from 17)
• Drive the structural transformation of the Ethiopian economy; • Reduce rural poverty; • Create a better environment for increased investment in agro-food
and allied sectors.
Rice Farm in Fogera, Amhara
Sesame farm in Metema, Amhara
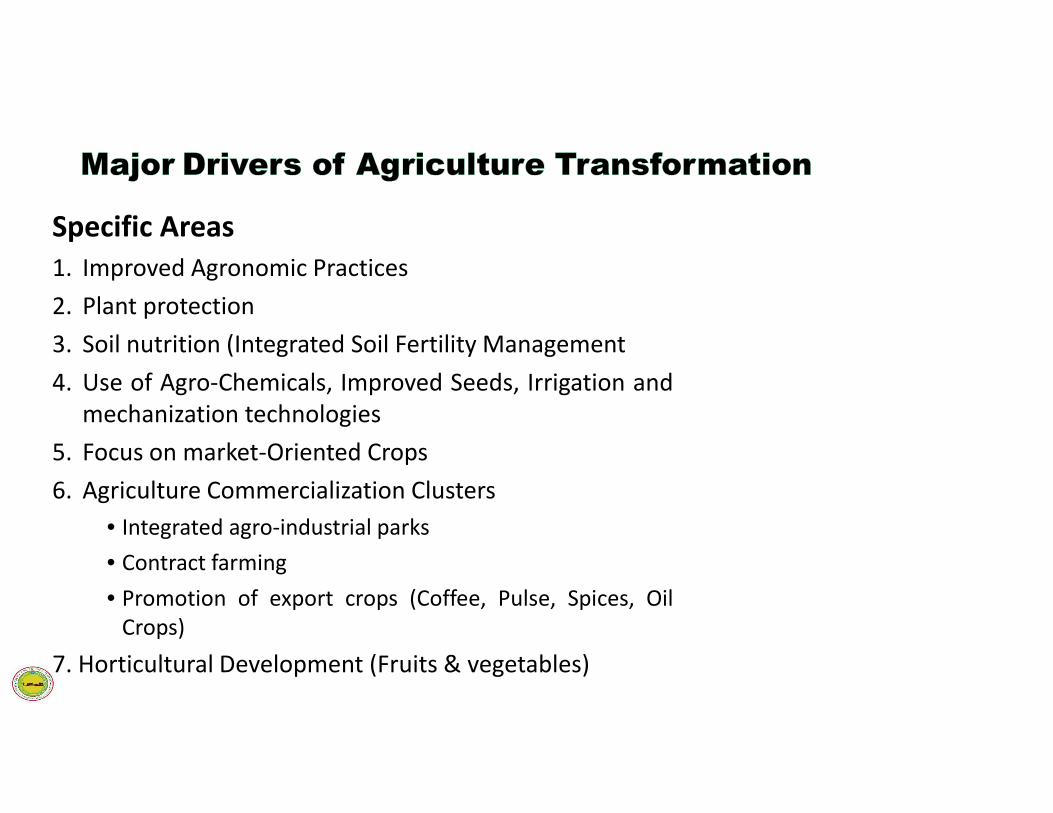
Specific Areas
1. Improved Agronomic Practices
2. Plant protection
3. Soil nutrition (Integrated Soil Fertility Management
4. Use of Agro-Chemicals, Improved Seeds, Irrigation and
mechanization technologies
5. Focus on market-Oriented Crops
6. Agriculture Commercialization Clusters
• Integrated agro-industrial parks
• Contract farming
• Promotion of export crops (Coffee, Pulse, Spices, Oil
Crops)
7. Horticultural Development (Fruits & vegetables)
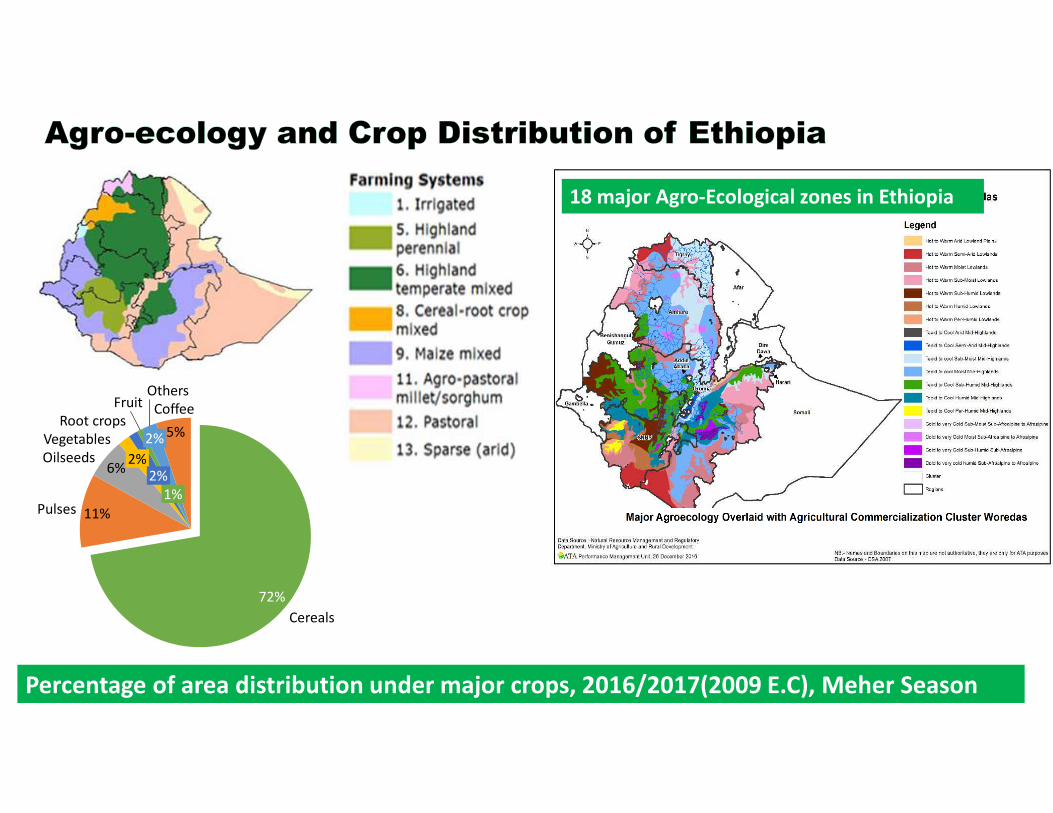
Vegetables
6%
Pulses
2%2%
Coffee
Oilseeds
11%
2%
72%
1%
Others
5%
Cereals
Fruit
Root crops
Percentage of area distribution under major crops, 2016/2017(2009 E.C), Meher Season
18 major Agro-Ecological zones in Ethiopia
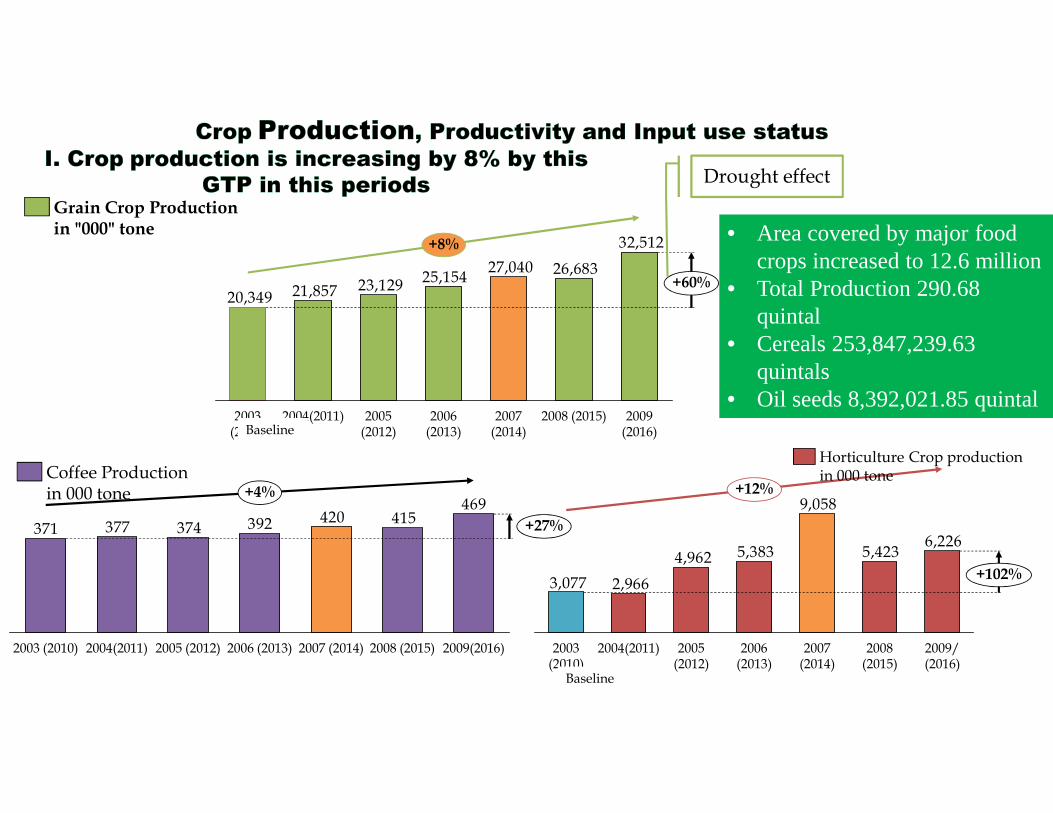
6,2265,423
9,058
5,3834,962
2,9663,077
+12%
2005 (2012)
2008 (2015)
2006 (2013)
+102%
2009/ (2016)
2007 (2014)
2004(2011)2003 (2010)
469415420392374377371 +27%
2009(2016)2003 (2010) 2007 (2014)2006 (2013)2005 (2012) 2008 (2015)2004(2011)
+4%
32,512
26,68327,04025,154
23,12921,85720,349
2006 (2013)
2004(2011)2003 (2010)
2005 (2012)
+8%
2008 (2015)
+60%
2009 (2016)
2007 (2014)
Grain Crop Production in "000" tone
Baseline
Drought effect
Horticulture Crop productionin 000 tone
Baseline
Coffee Productionin 000 tone
• Area covered by major food crops increased to 12.6 million
• Total Production 290.68 quintal
• Cereals 253,847,239.63 quintals
• Oil seeds 8,392,021.85 quintal
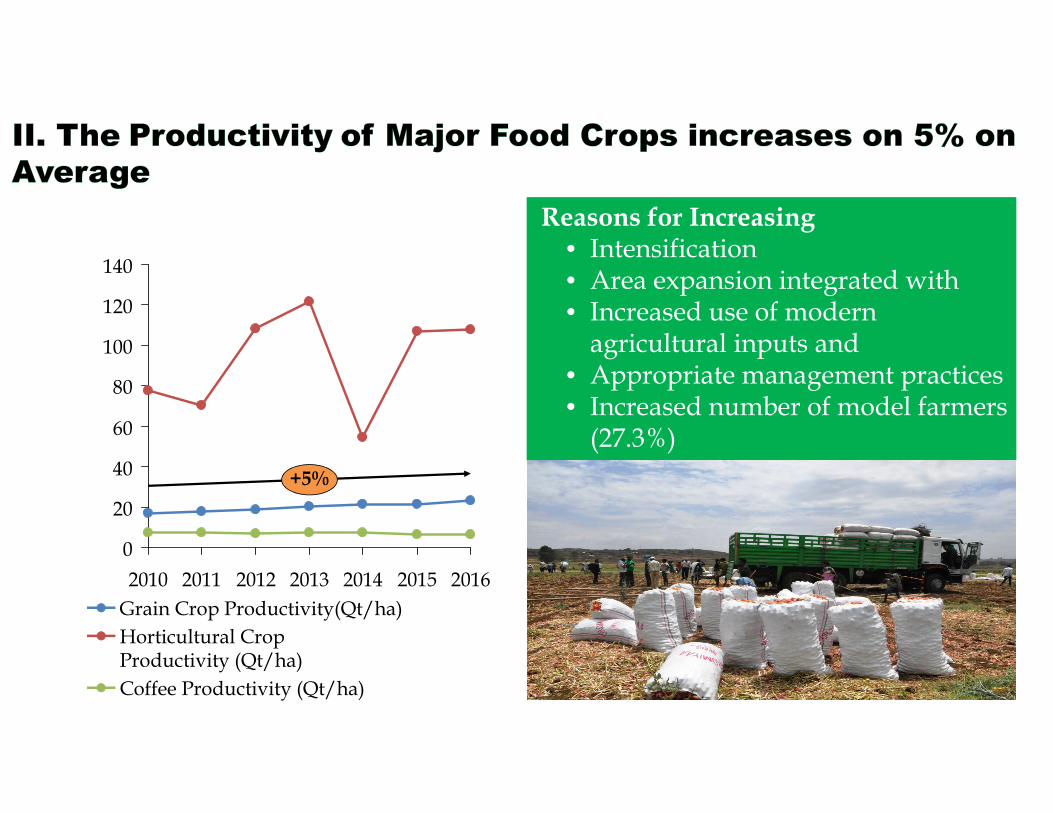
0
20
40
60
80
100
120
140
2010 2011 2012 2013 2014 2015 2016
+5%
Reasons for Increasing • Intensification• Area expansion integrated with• Increased use of modern
agricultural inputs and• Appropriate management practices • Increased number of model farmers
(27.3%)
Grain Crop Productivity(Qt/ha)
Coffee Productivity (Qt/ha)
Horticultural Crop Productivity (Qt/ha)
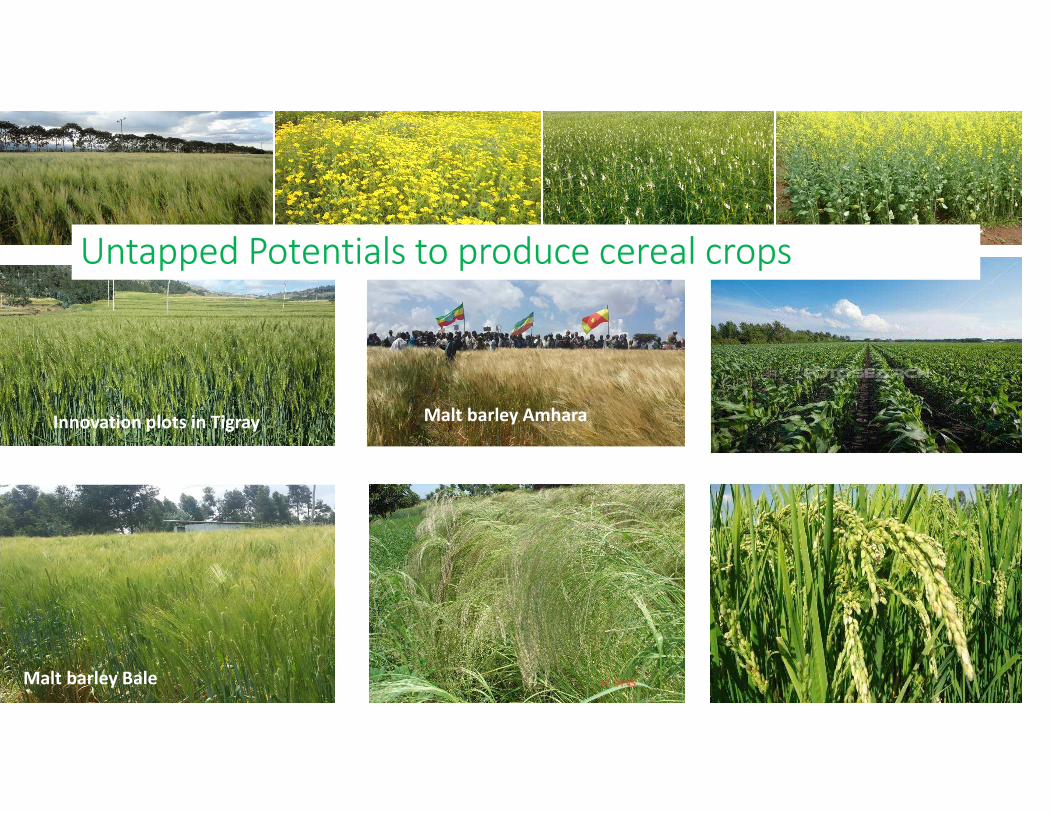
Innovation plots in Tigray
Malt barley Bale
Malt barley Amhara
Untapped Potentials to produce cereal crops
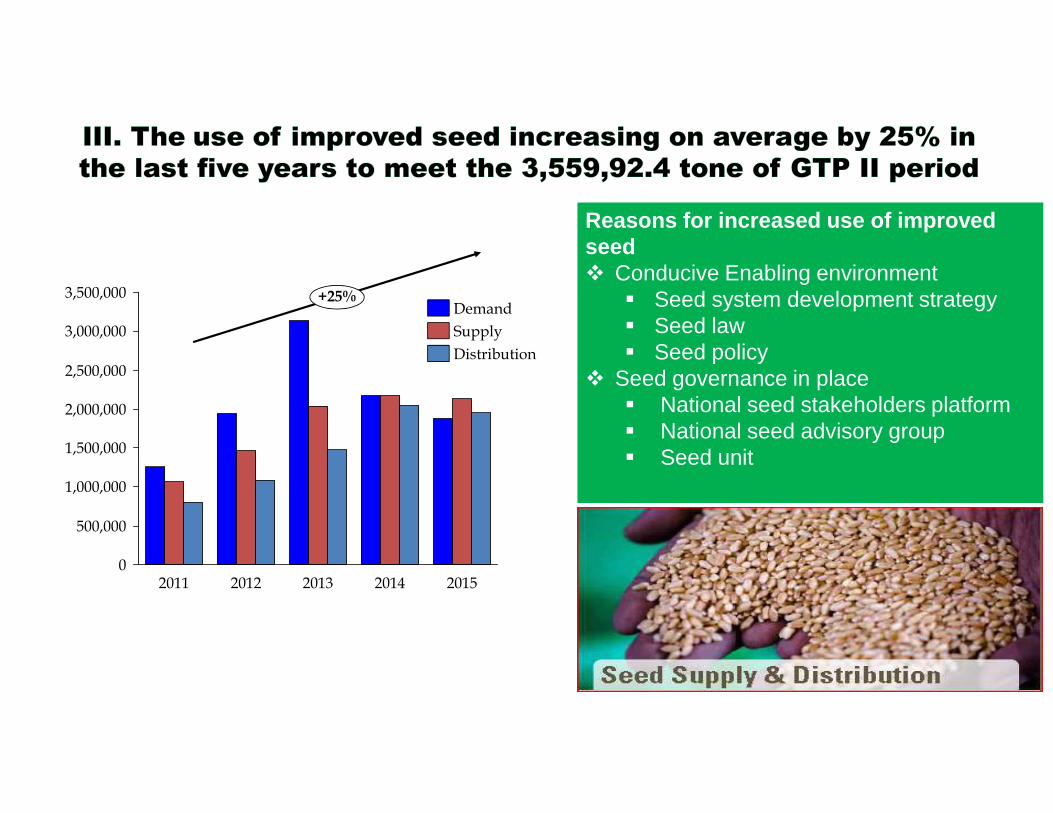
1,500,000
0
3,500,000
3,000,000
2,000,000
2,500,000
1,000,000
500,000
2013
+25%
2011 2012 2014 2015
Demand
Supply
Distribution
Reasons for increased use of improved seed � Conducive Enabling environment
� Seed system development strategy� Seed law � Seed policy
� Seed governance in place� National seed stakeholders platform� National seed advisory group� Seed unit
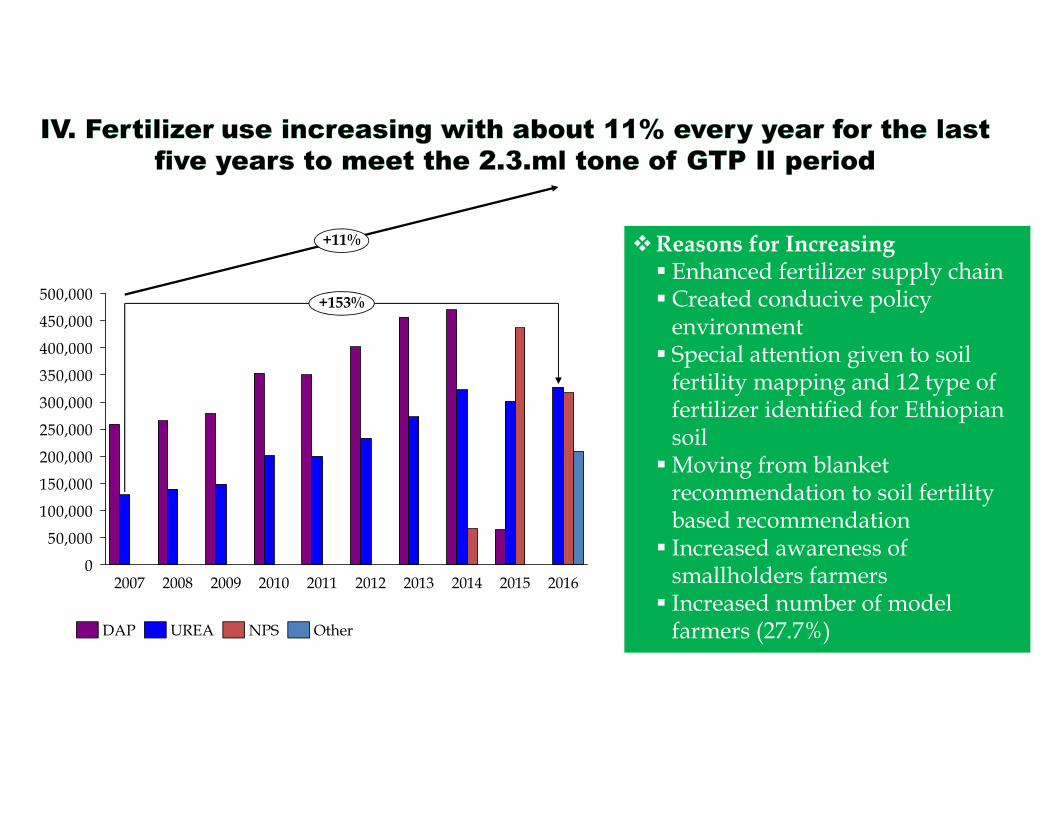
0
50,000
100,000
150,000
200,000
250,000
300,000
350,000
400,000
450,000
500,000
20082007 2009
+153%
20132011 20122010 2014 2015 2016
+11%
DAP NPSUREA Other
�Reasons for Increasing � Enhanced fertilizer supply chain � Created conducive policy
environment� Special attention given to soil
fertility mapping and 12 type of fertilizer identified for Ethiopian soil
� Moving from blanket recommendation to soil fertility based recommendation
� Increased awareness of smallholders farmers
� Increased number of model farmers (27.7%)
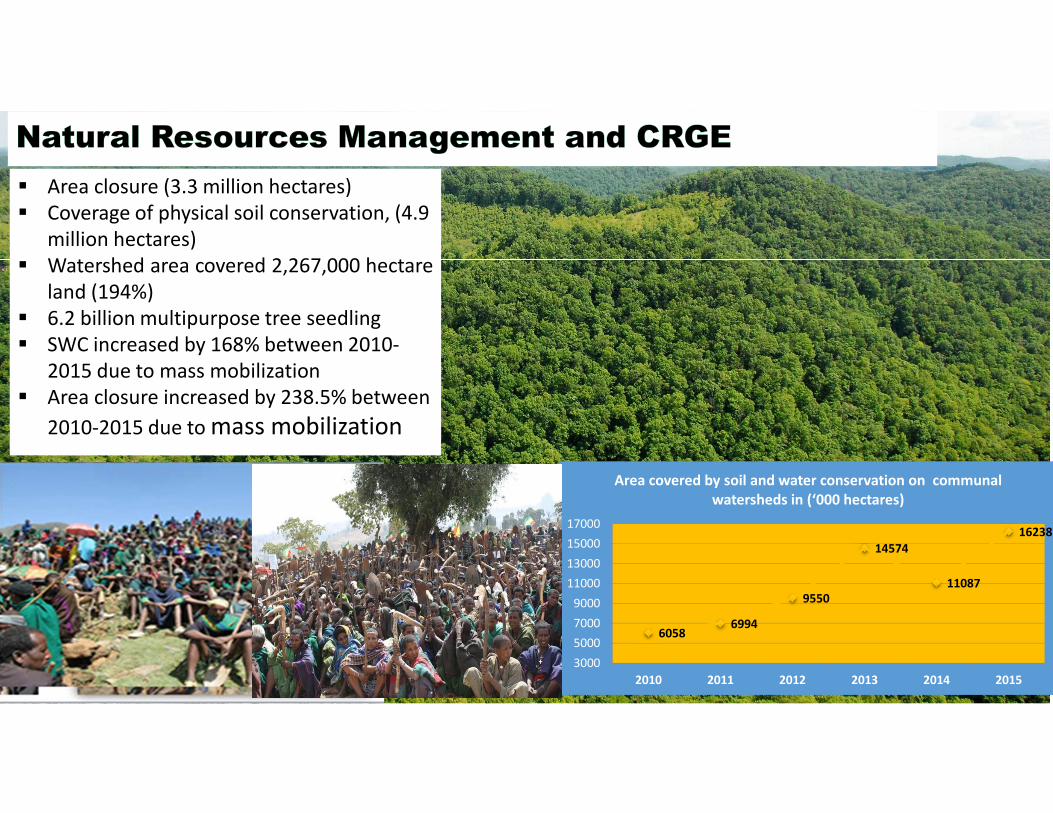
� Area closure (3.3 million hectares)
� Coverage of physical soil conservation, (4.9
million hectares)
� Watershed area covered 2,267,000 hectare
land (194%)
� 6.2 billion multipurpose tree seedling
� SWC increased by 168% between 2010-
2015 due to mass mobilization
� Area closure increased by 238.5% between
2010-2015 due to mass mobilization
60586994
9550
14574
11087
16238
3000
5000
7000
9000
11000
13000
15000
17000
2010 2011 2012 2013 2014 2015
Area covered by soil and water conservation on communal
watersheds in (‘000 hectares)
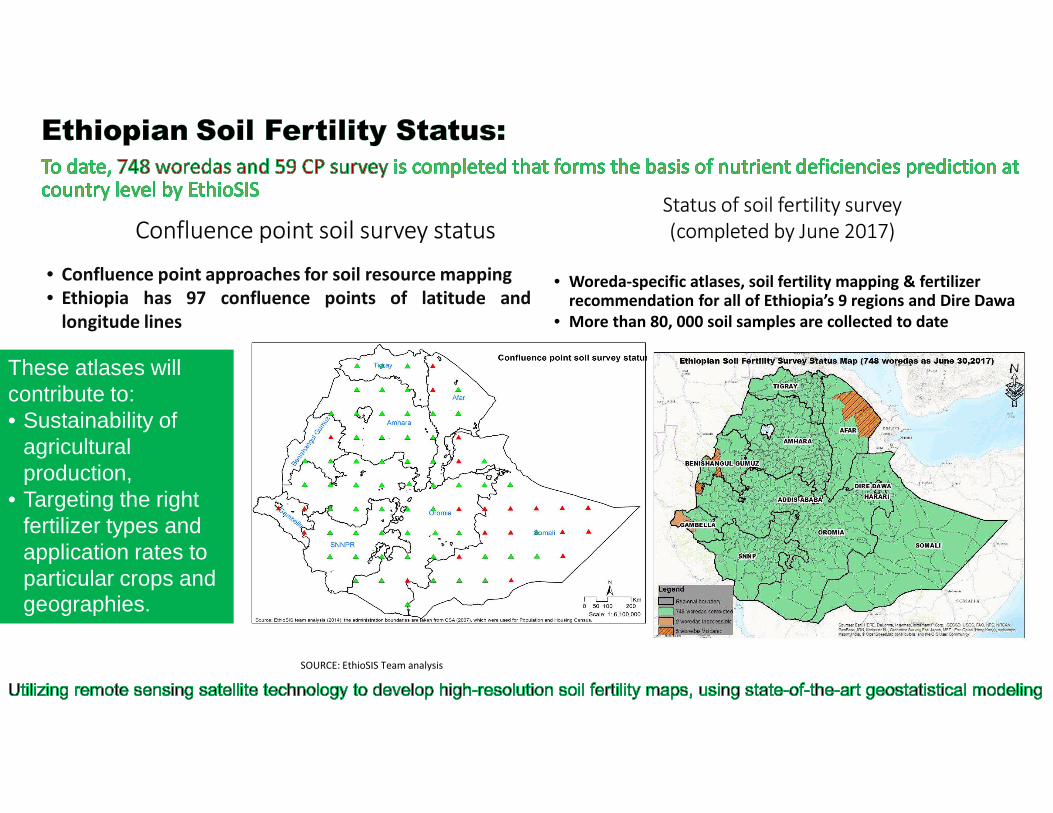
Confluence point soil survey statusStatus of soil fertility survey
(completed by June 2017)
• Confluence point approaches for soil resource mapping
• Ethiopia has 97 confluence points of latitude and
longitude lines
• Woreda-specific atlases, soil fertility mapping & fertilizer recommendation for all of Ethiopia’s 9 regions and Dire Dawa
• More than 80, 000 soil samples are collected to date
SOURCE: EthioSIS Team analysis
These atlases will contribute to:• Sustainability of
agricultural production,
• Targeting the right fertilizer types and application rates to particular crops and geographies.
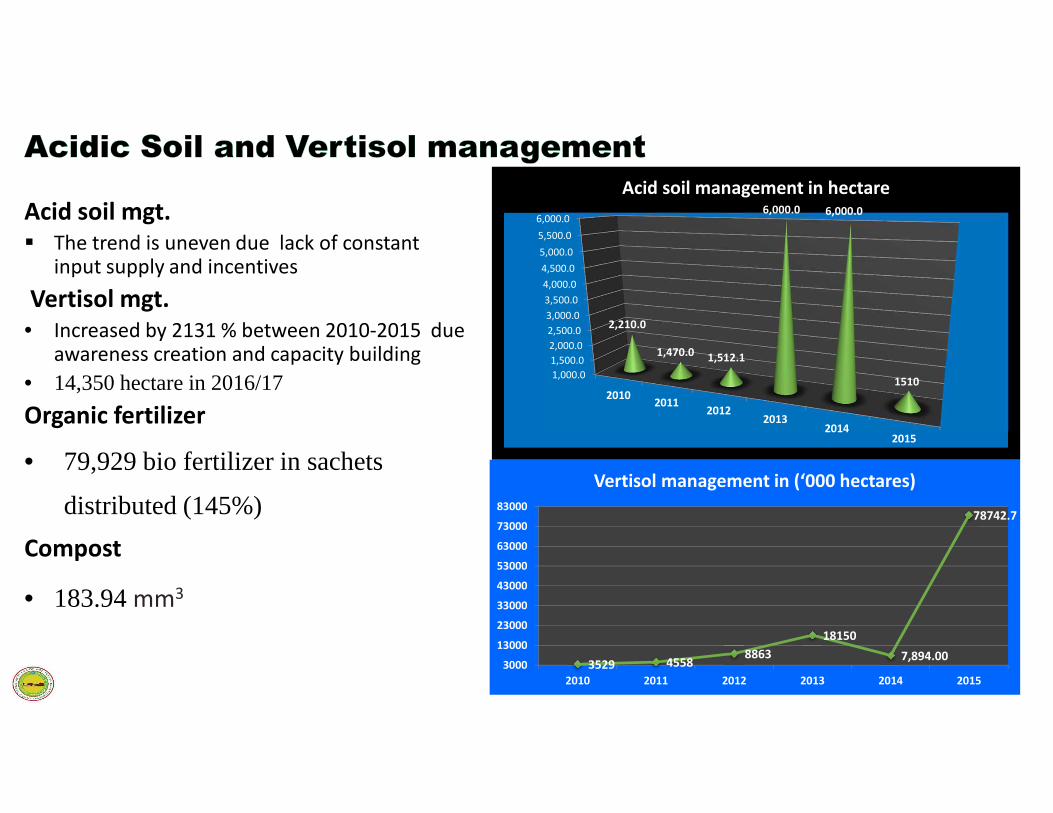
1,000.0
1,500.0
2,000.0
2,500.0
3,000.0
3,500.0
4,000.0
4,500.0
5,000.0
5,500.0
6,000.0
20102011
20122013
20142015
2,210.0
1,470.0 1,512.1
6,000.0 6,000.0
1510
Acid soil management in hectare
Acid soil mgt.
� The trend is uneven due lack of constant input supply and incentives
Vertisol mgt.
• Increased by 2131 % between 2010-2015 due awareness creation and capacity building
• 14,350 hectare in 2016/17
Organic fertilizer
• 79,929 bio fertilizer in sachets
distributed (145%)
Compost
• 183.94 mm3
3529 45588863
18150
7,894.00
78742.7
3000
13000
23000
33000
43000
53000
63000
73000
83000
2010 2011 2012 2013 2014 2015
Vertisol management in (‘000 hectares)
:
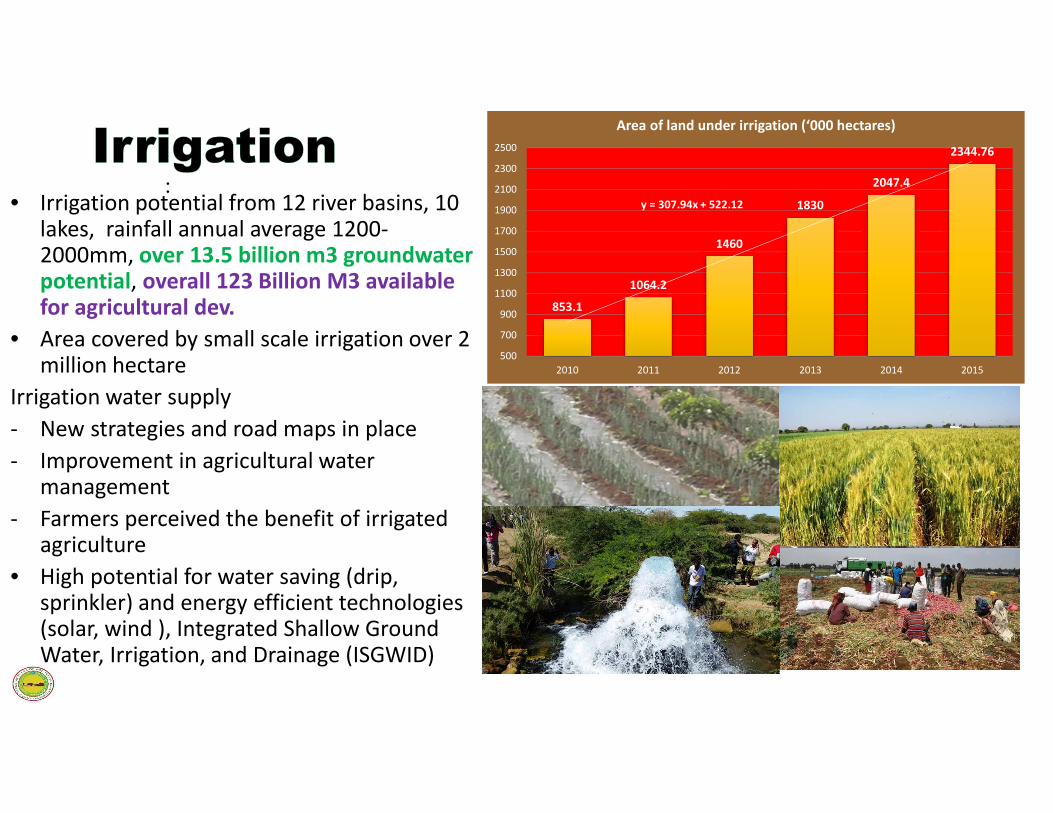
853.1
1064.2
1460
1830
2047.4
2344.76
y = 307.94x + 522.12
500
700
900
1100
1300
1500
1700
1900
2100
2300
2500
2010 2011 2012 2013 2014 2015
Area of land under irrigation (‘000 hectares)
• Irrigation potential from 12 river basins, 10 lakes, rainfall annual average 1200-2000mm, over 13.5 billion m3 groundwater potential, overall 123 Billion M3 available for agricultural dev.
• Area covered by small scale irrigation over 2 million hectare
Irrigation water supply
- New strategies and road maps in place
- Improvement in agricultural water management
- Farmers perceived the benefit of irrigated agriculture
• High potential for water saving (drip, sprinkler) and energy efficient technologies (solar, wind ), Integrated Shallow Ground Water, Irrigation, and Drainage (ISGWID)
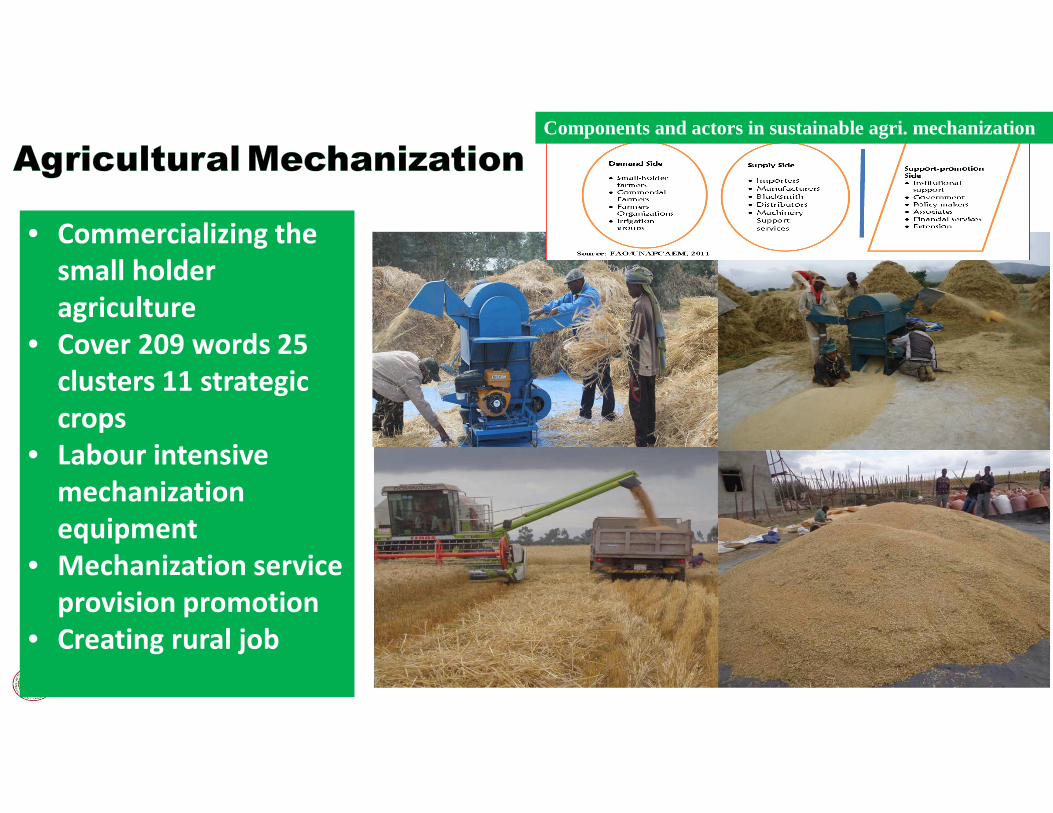
• Commercializing the
small holder
agriculture
• Cover 209 words 25
clusters 11 strategic
crops
• Labour intensive
mechanization
equipment
• Mechanization service
provision promotion
• Creating rural job
Components and actors in sustainable agri. mechanization
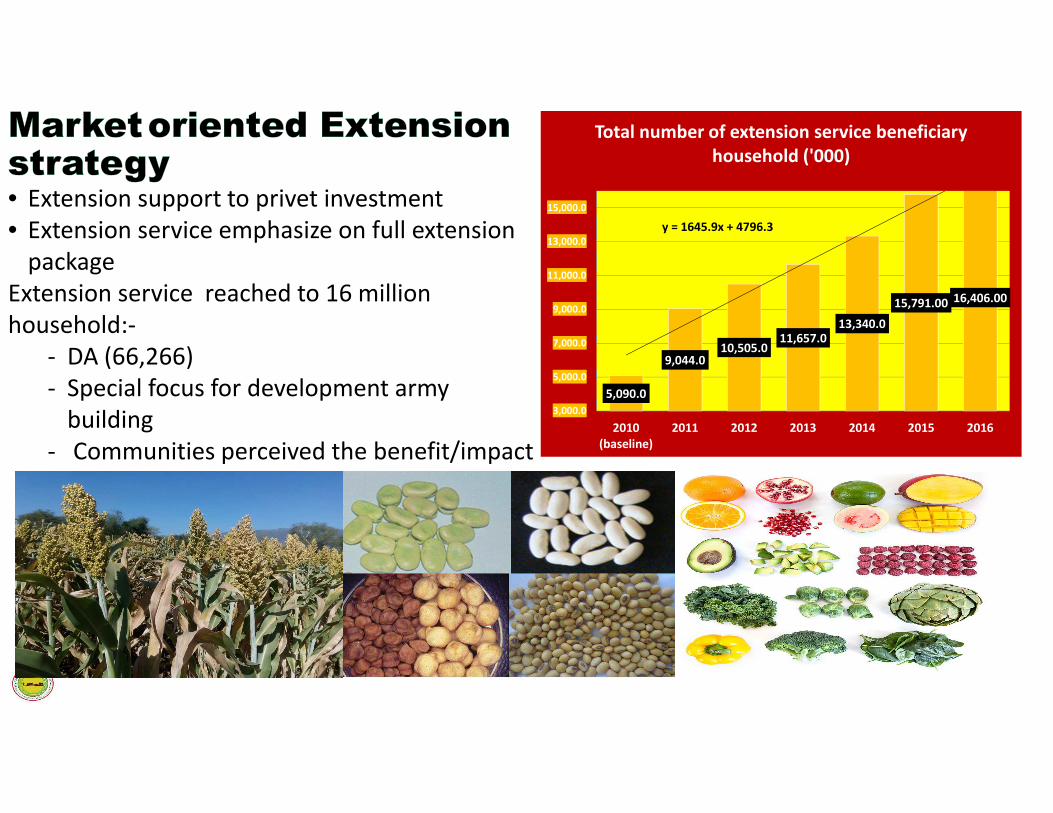
• Extension support to privet investment
• Extension service emphasize on full extension
package
Extension service reached to 16 million
household:-
- DA (66,266)
- Special focus for development army
building
- Communities perceived the benefit/impact
5,090.0
9,044.010,505.0
11,657.013,340.0
15,791.00 16,406.00
y = 1645.9x + 4796.3
3,000.0
5,000.0
7,000.0
9,000.0
11,000.0
13,000.0
15,000.0
2010
(baseline)
2011 2012 2013 2014 2015 2016
Total number of extension service beneficiary
household ('000)
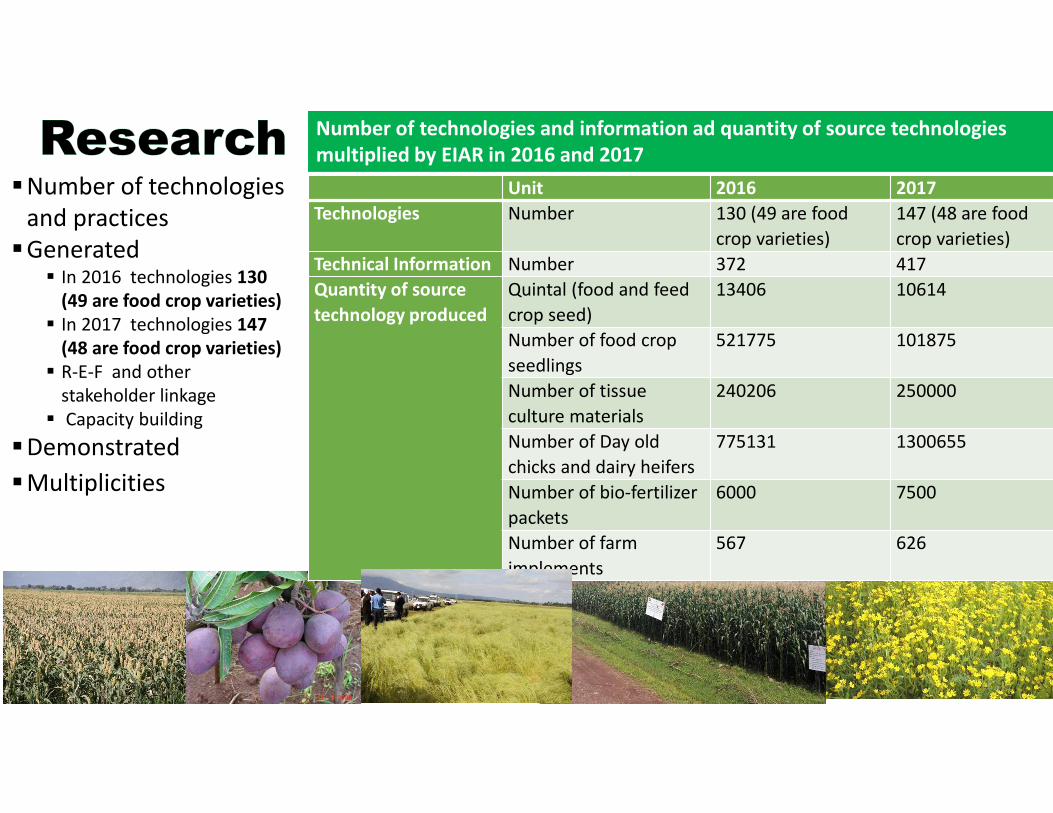
�Number of technologies
and practices
�Generated � In 2016 technologies 130
(49 are food crop varieties)
� In 2017 technologies 147
(48 are food crop varieties)
� R-E-F and other
stakeholder linkage
� Capacity building
�Demonstrated
�Multiplicities
Unit 2016 2017
Technologies Number 130 (49 are food
crop varieties)
147 (48 are food
crop varieties)
Technical Information Number 372 417
Quantity of source
technology produced
Quintal (food and feed
crop seed)
13406 10614
Number of food crop
seedlings
521775 101875
Number of tissue
culture materials
240206 250000
Number of Day old
chicks and dairy heifers
775131 1300655
Number of bio-fertilizer
packets
6000 7500
Number of farm
implements
567 626
Number of technologies and information ad quantity of source technologies
multiplied by EIAR in 2016 and 2017
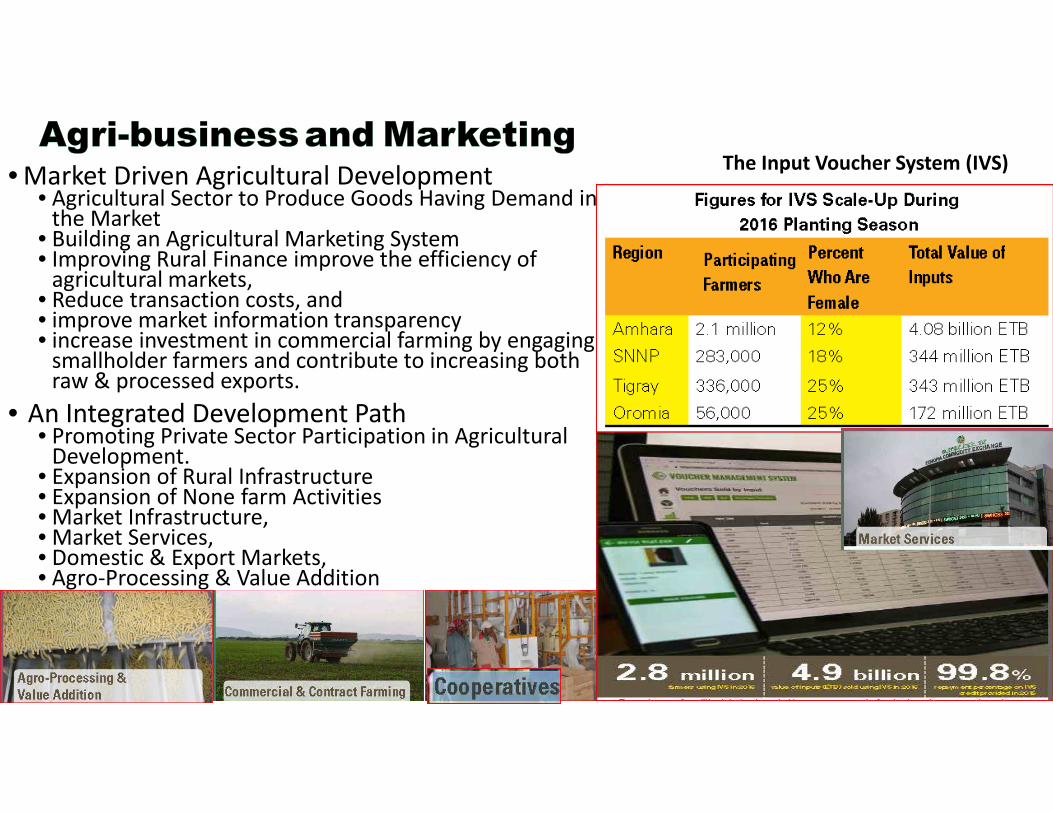
• Market Driven Agricultural Development • Agricultural Sector to Produce Goods Having Demand in
the Market • Building an Agricultural Marketing System• Improving Rural Finance improve the efficiency of
agricultural markets, • Reduce transaction costs, and• improve market information transparency• increase investment in commercial farming by engaging
smallholder farmers and contribute to increasing both raw & processed exports.
• An Integrated Development Path• Promoting Private Sector Participation in Agricultural
Development. • Expansion of Rural Infrastructure• Expansion of None farm Activities • Market Infrastructure, • Market Services, • Domestic & Export Markets, • Agro-Processing & Value Addition
The Input Voucher System (IVS)
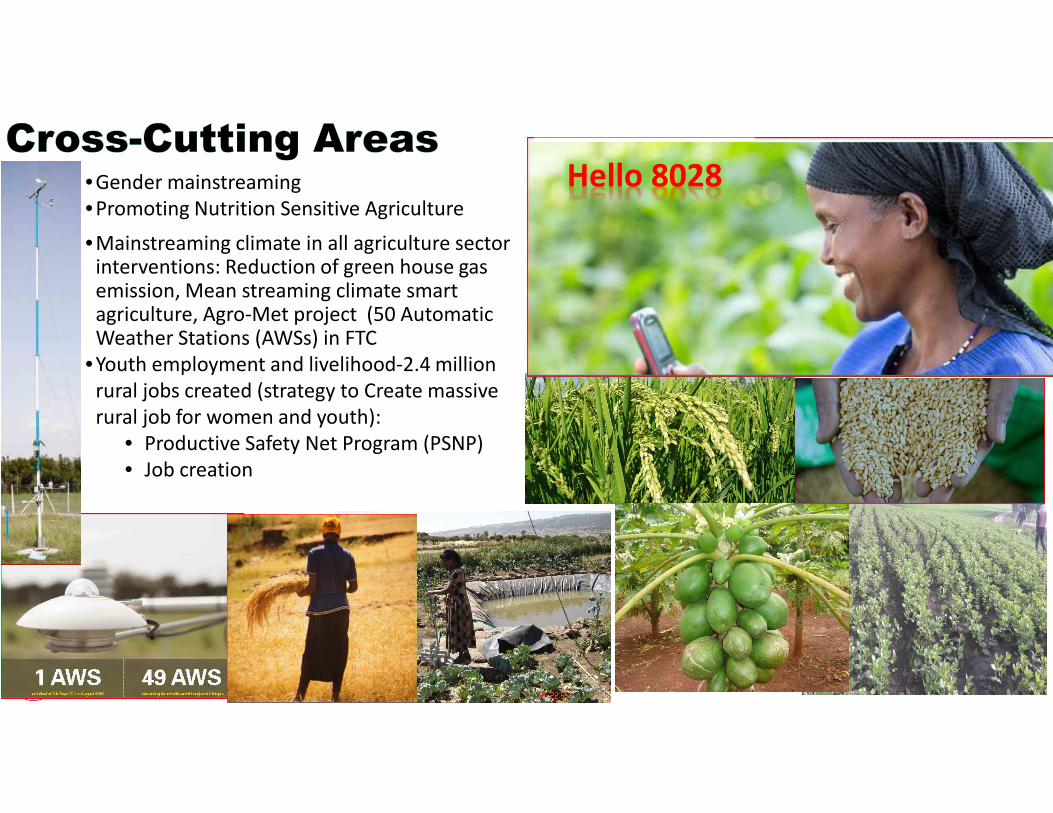
•Gender mainstreaming
•Promoting Nutrition Sensitive Agriculture
•Mainstreaming climate in all agriculture sector interventions: Reduction of green house gas emission, Mean streaming climate smart agriculture, Agro-Met project (50 Automatic Weather Stations (AWSs) in FTC
•Youth employment and livelihood-2.4 million
rural jobs created (strategy to Create massive
rural job for women and youth):
• Productive Safety Net Program (PSNP)
• Job creation
Hello 8028
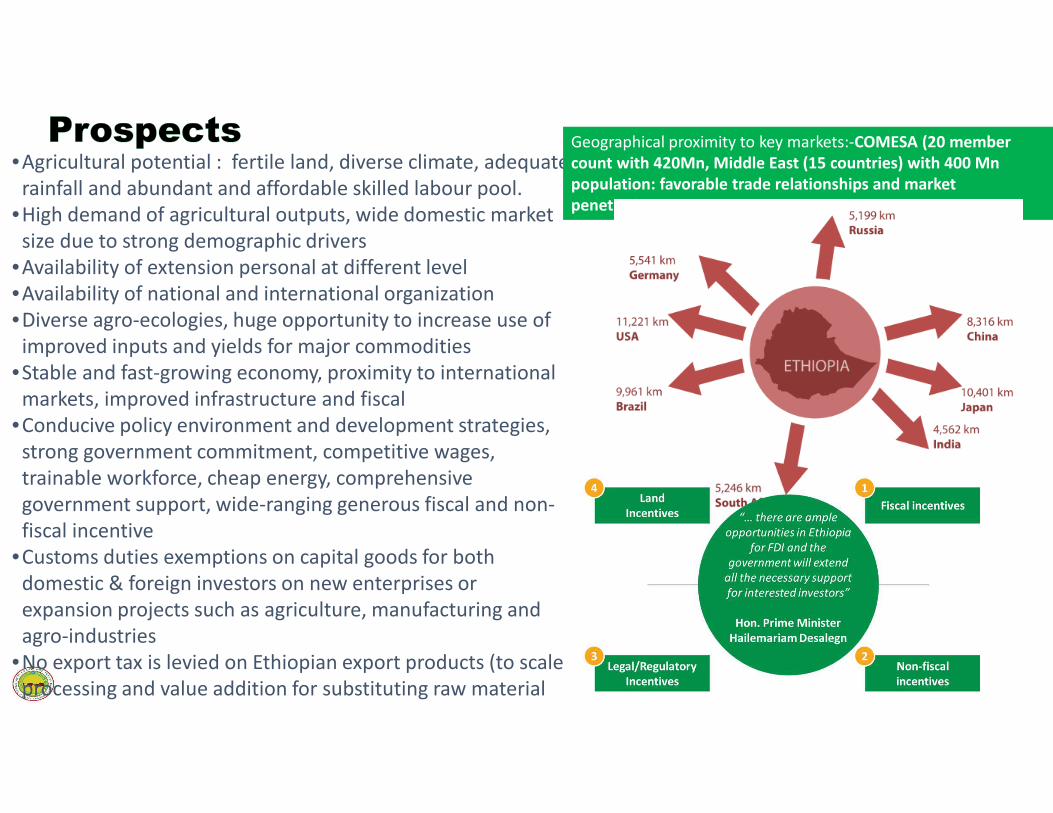
•Agricultural potential : fertile land, diverse climate, adequate
rainfall and abundant and affordable skilled labour pool.
•High demand of agricultural outputs, wide domestic market
size due to strong demographic drivers
•Availability of extension personal at different level
•Availability of national and international organization
•Diverse agro-ecologies, huge opportunity to increase use of
improved inputs and yields for major commodities
•Stable and fast-growing economy, proximity to international
markets, improved infrastructure and fiscal
•Conducive policy environment and development strategies,
strong government commitment, competitive wages,
trainable workforce, cheap energy, comprehensive
government support, wide-ranging generous fiscal and non-
fiscal incentive
•Customs duties exemptions on capital goods for both
domestic & foreign investors on new enterprises or
expansion projects such as agriculture, manufacturing and
agro-industries
•No export tax is levied on Ethiopian export products (to scale
processing and value addition for substituting raw material
and processed agricultural imports)
Geographical proximity to key markets:-COMESA (20 member
count with 420Mn, Middle East (15 countries) with 400 Mn
population: favorable trade relationships and market
penetration
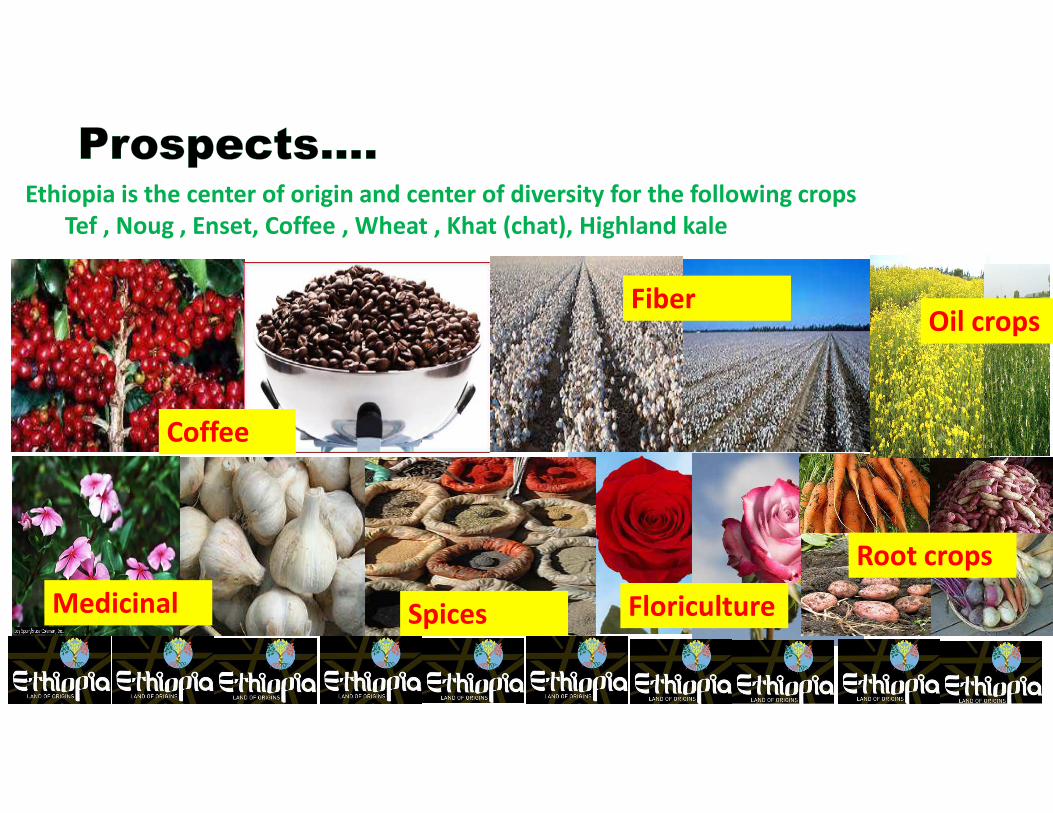
FloricultureMedicinal
Fiber
Spices
Root crops
Oil crops
Coffee
Ethiopia is the center of origin and center of diversity for the following crops
Tef , Noug , Enset, Coffee , Wheat , Khat (chat), Highland kale
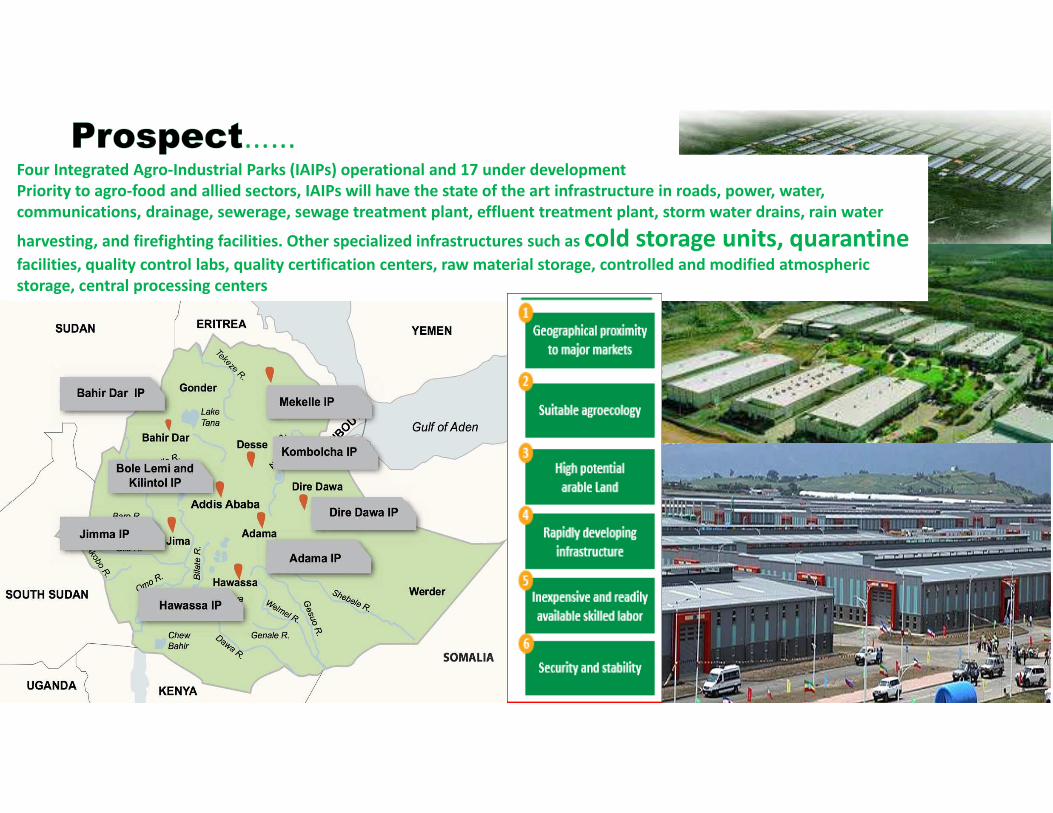
……Four Integrated Agro-Industrial Parks (IAIPs) operational and 17 under development
Priority to agro-food and allied sectors, IAIPs will have the state of the art infrastructure in roads, power, water,
communications, drainage, sewerage, sewage treatment plant, effluent treatment plant, storm water drains, rain water
harvesting, and firefighting facilities. Other specialized infrastructures such as cold storage units, quarantine facilities, quality control labs, quality certification centers, raw material storage, controlled and modified atmospheric
storage, central processing centers
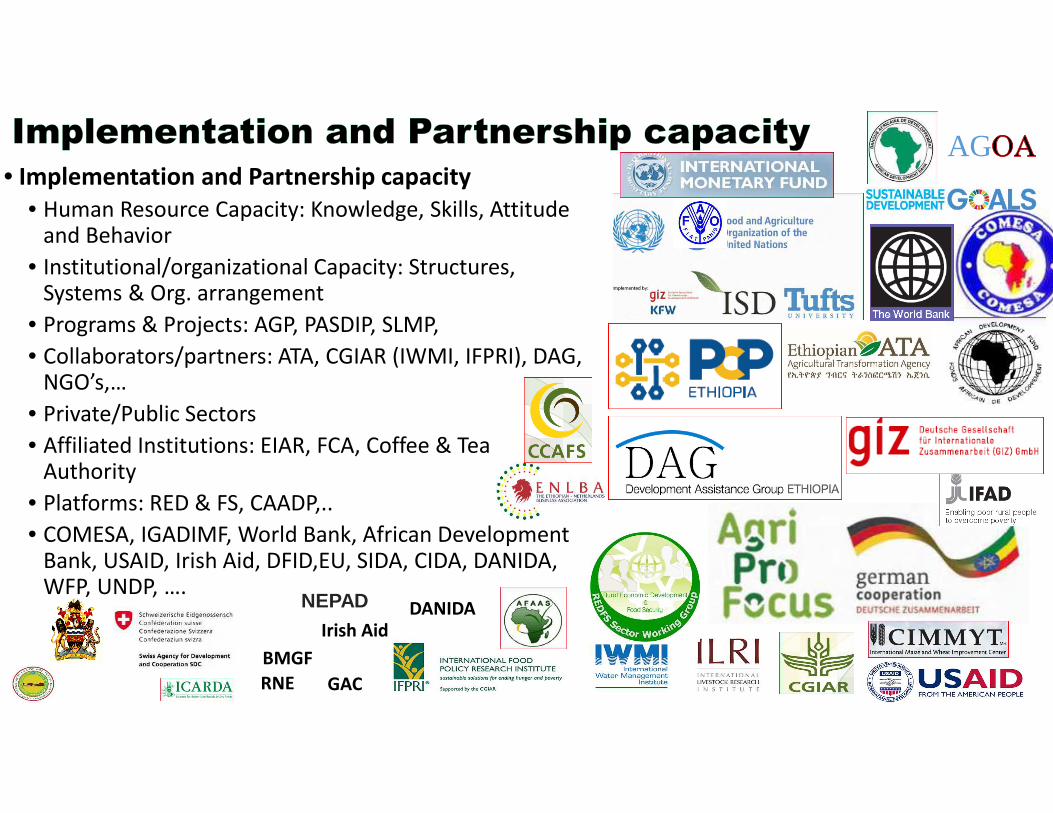
• Implementation and Partnership capacity
• Human Resource Capacity: Knowledge, Skills, Attitude and Behavior
• Institutional/organizational Capacity: Structures, Systems & Org. arrangement
• Programs & Projects: AGP, PASDIP, SLMP,
• Collaborators/partners: ATA, CGIAR (IWMI, IFPRI), DAG, NGO’s,…
• Private/Public Sectors
• Affiliated Institutions: EIAR, FCA, Coffee & Tea Authority
• Platforms: RED & FS, CAADP,..
• COMESA, IGADIMF, World Bank, African Development Bank, USAID, Irish Aid, DFID,EU, SIDA, CIDA, DANIDA, WFP, UNDP, ….
BMGF
DANIDA
GACRNE
Irish Aid
NEPAD
AG
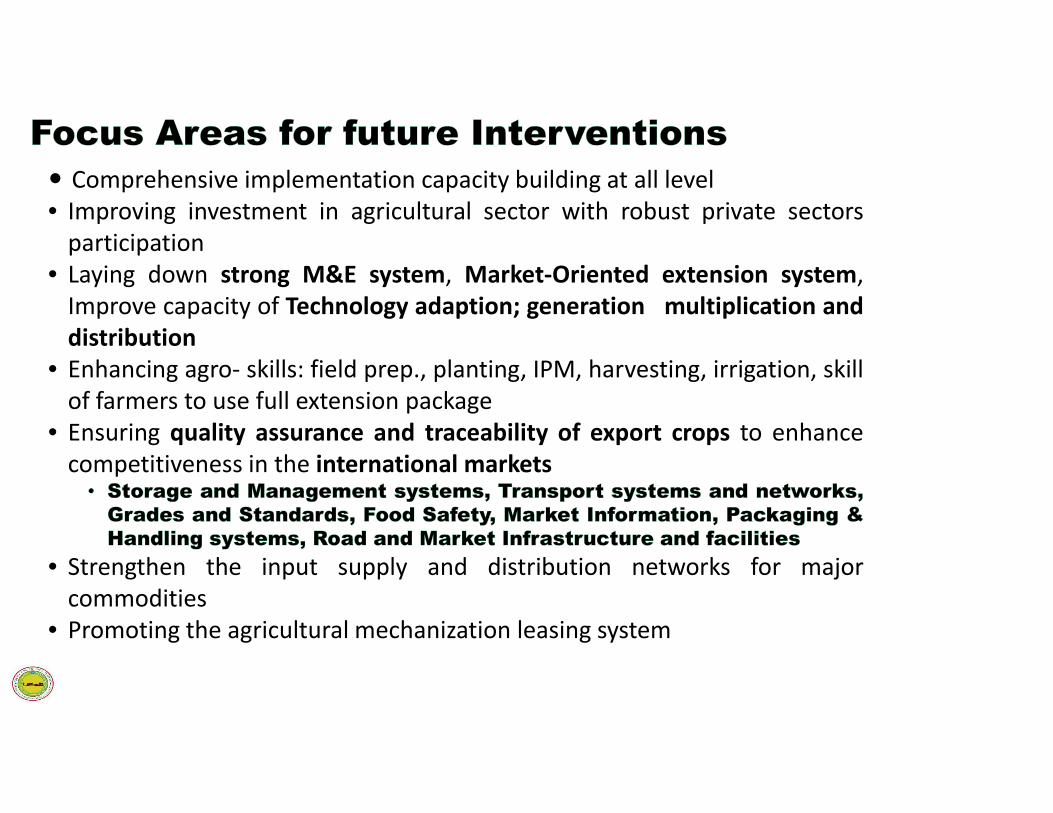
� Comprehensive implementation capacity building at all level
• Improving investment in agricultural sector with robust private sectors
participation
• Laying down strong M&E system, Market-Oriented extension system,
Improve capacity of Technology adaption; generation multiplication and
distribution
• Enhancing agro- skills: field prep., planting, IPM, harvesting, irrigation, skill
of farmers to use full extension package
• Ensuring quality assurance and traceability of export crops to enhance
competitiveness in the international markets
• Strengthen the input supply and distribution networks for major
commodities
• Promoting the agricultural mechanization leasing system
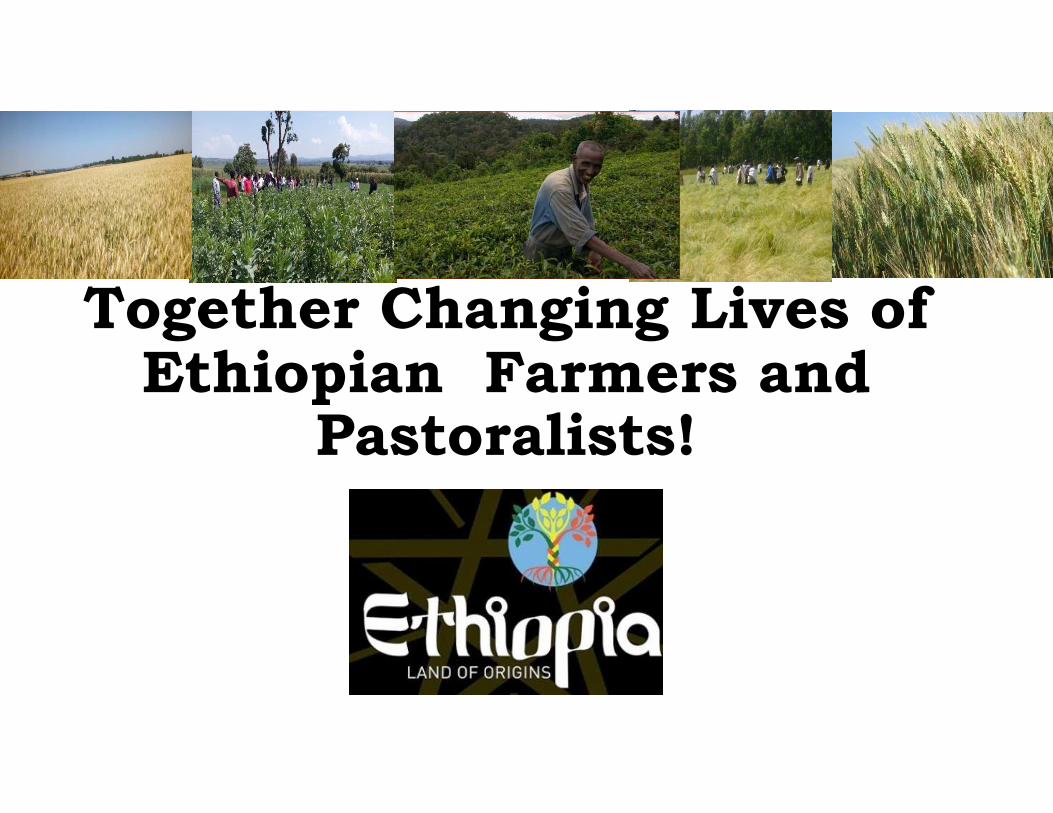
Together Changing Lives of Ethiopian Farmers and
Pastoralists!