1 Stolbovoy Vladimir, Nicola Filippi and Luca Montanarella Land Management and Natural Hazards Unit,...
12
1 Stolbovoy Vladimir, Nicola Filippi and Luca Montanarella Land Management and Natural Hazards Unit, Joint Research Center EC, Ispra, Italy Verification of the changes of carbon stock in mineral soils of the European Union Ispra, November, 2006
-
Upload
jason-haley -
Category
Documents
-
view
214 -
download
0
Transcript of 1 Stolbovoy Vladimir, Nicola Filippi and Luca Montanarella Land Management and Natural Hazards Unit,...

1
Stolbovoy Vladimir, Nicola Filippi and Luca Montanarella Land Management and Natural Hazards Unit, Joint Research Center EC, Ispra,
Italy
Verification of the changes of carbon stock in mineral soils of the European
Union
Ispra, November, 2006

2
• European policies urgently request to monitor the content of organic carbon in soil;
• To support this policy the soil survey needs to provide transparent, measurable, verifiable and economically sound information;
• This information is based:– method to detect the changes of organic carbon in
soil;– System of parameters describing current status of
organic carbon content and indicating potential for carbon management.
Introduction
November 2006

3
• Introduce new Area-Frame Randomized Soil Sampling;
• Demonstrate results of the method testing.
Objectives
November 2006
4
B. Composite sampling
(A) Advantage - statistically sound; Disadvantage – resources demanding, high cost, impractical.
1
10
100
1000
10000
0 10 20 30 40 50 60
Variability (CV), %
Num
ber
of s
ampl
es
50 tC/ha
75 tC/ha
100 tC/ha
SOC content (0-30 cm)
Number of samples (P0.05)
Why do we need a method for soil sampling?
(B) Advantage – simple, low cost, practical; Disadvantage – unknown accuracy.
A. Simple point sampling
Random layout
Systematic layout
November 2006

5
(The average C sequestration is 6tC for the control (4ha) plot; the laboratory cost of the C detection 6-16 EURO for sample)
Land cover
Conventional (IPCC, 2003)
Variability, %
Number of samples
Cost per tC
Cropland9 243 243-
643
Pasture15 675 675-
1800
Cost of carbon detection in soil by point sampling
November 2006

6
669.0
326.0
5917 62605951.3
5985.6
6019.09
6054.26088.5
6122.86157.1
6191.46225.7
634.7
600.4
566.1
531.8
497.5
463.2
428.9
394.6
360.3
79 40
100
44 93 16 67 54
64 32 47 95 24 58
51
53
56 1 72 43 97
8
91 1825
68 94 22 85 17
70
34
31 73
42
84 50
61
33
87
27
48
10
28
66
88
Sampling site (m)
4 69 75 12 90 76 23 41 99 2
60 29 7 92 19 45 57
20 80 78 21 83
98
719
38
7459 14
30 39 35 49 82 3
9646
89 6 66 77 13 81
65
1537
11
3626
63
52
55
5
62
Max
Axi
s
5.6
17.1
5
34.3
5.6
17.15
34.3
Selected sampling site (first
sampling)
Selected sampling site (second sampling)
Area-Frame Randomized Soil Sampling (AFRSS) takes advantages
November 2006

7
Sam
plin
g de
pths
Sub
soil
hor
izon
Pasture
Plo
ugh
hori
zon
Sub
soil
hor
izon
cm010
20
30
40
506070
80S
ubso
il h
oriz
on
Cropland Forest
Min
eral
ho
rizo
nO
rgan
ic
laye
r
Source: Stolbovoy et al., 2005
Minimization of sampling depths
November 2006

8
Programming of sampling strategy
November 2006

9
(The average C sequestration is 6tC for the control (4ha) plot; the laboratory cost of the C detection 6-16 EURO for sample)
Land cover
Conventional (IPCC, 2003) Area-Frame Randomized Soil Sampling
Variability, %
Number of samples
Cost per tC
Variability, %
Number of samples
Cost per tC
Cropland9 243 243-
643 n.a. 3 3-8
Pasture15 675 675-
1800n.a 9 3-8
n.a. = not applicable Source: Stolbovoy et al., 2006
Economic effectiveness of AFRSSg
November 2006
10
0
10
20
30
40
50
60
1 2 3 4 5
0.00
5.00
10.00
15.00
20.00
25.00
30.00
35.00
Plot area, ha Euro/tC
Eu
ro
0
10
20
30
40
50
60
1 2 3 4 5
0.00
5.00
10.00
15.00
20.00
25.00
30.00
35.00
Plot area, ha Euro/tC
0
10
20
30
40
50
60
1 2 3 4 5
0
5
10
15
20
25
30
35
Plot area, ha Euro/tC
Eu
ro
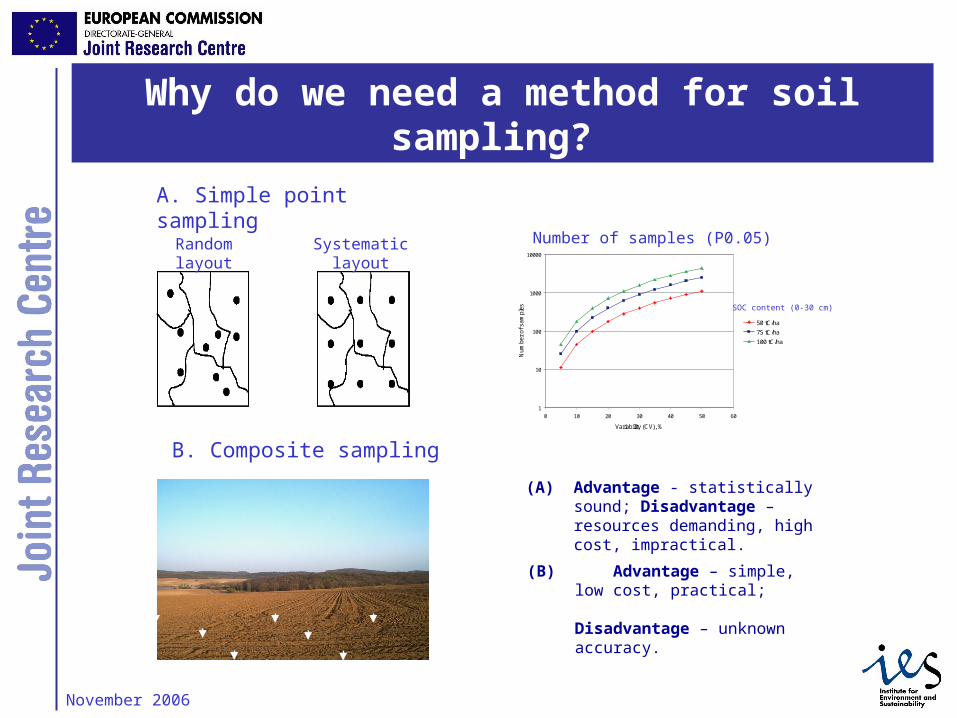
( average carbon sink is 1.5 tC/ha; the cost of lab determination is 16 EURO per sample)
Source: Stolbovoy et al., 2006
Lower cost for larger fields
ha
November 2006

11
(cropland (Piemonte), first and second samplings)
Profile, N
Depth,cm
C, % Bulk density,g/cm3
Soil carbon density, kgC/m3
Carbon content for profile, tC/ha
Soil carbon stock,tC (area 4 ha)
Average soil carbon stock, tC(area 4 ha)
Reproducibility, %
Cropland Skeletic Cambisol, first sampling
C1S 0-25 2.43 1.29 7.86 n.a.*314.4
C22S 2.16 1.43 7.72 n.a.308.8
301.1
C8S 2.04 1.37 7.00 n.a280.0
Cropland Skeletic Cambisol, second sampling 3
C1Ss 0-25 1.99 1.52 7.60 n.a.304.0
C22Ss 2.00 1.40 7.00 n.a.280.0
292.0
C8Ss 1.55 1.25 4.85 n.an.a.
Source: Stolbovoy et al., 2006
Practical precision/reproducibility
November 2006

12
• The suggested Area-Frame Randomized Soil Sampling (AFRSS) combines advantages of composite sampling with randomized positioning of the sampling sites.
• The field test shows that the AFRSS assures practical precision/reproducibility within 3% of initial carbon stock, simplicity, transparency and low cost.
• The AFRSS allows easy programming/computation of the sampling strategy.
Conclusions
November 2006