1 Science is …
30
1 Science is … The word science comes from the Latin word scientia, meaning knowledge. For some people it’s an occupation; for others it’s used to design and build things. But everybody uses scientific knowledge, or devices made using scientific knowledge — every day. Think about science • What do scientists do? • Do people other than scientists use science in their work or leisure activities? • How is a science laboratory different from other rooms? • Is the science laboratory a dangerous place? • Am I a good observer? • How are substances heated safely in the science laboratory? In this chapter: 1.1 SCIENCE AS A HUMAN ENDEAVOUR Science is … everywhere! 4 1.2 The science laboratory 7 1.3 Detective skills 14 1.4 Keeping things under control 16 1.5 Analysing data 19 1.6 Reporting on investigations 23 Study checklist/Digital resources 29 Looking back 30 ICT ACTIVITY Bigger, better beans 33 ONLINE PAGE PROOFS
Transcript of 1 Science is …

1 Science is …
The word science comes from the Latin word scientia, meaning knowledge. For some people it’s an occupation; for others it’s used to design and build things. But everybody uses scientific knowledge, or devices made using scientific knowledge — every day.
Think about science• Whatdoscientistsdo?• Dopeopleotherthanscientistsuse
scienceintheirworkorleisureactivities?• Howisasciencelaboratorydifferentfrom
otherrooms?• Isthesciencelaboratorya
dangerousplace?• AmIagoodobserver?• Howaresubstancesheatedsafelyinthe
sciencelaboratory?
In this chapter:1.1 SCIENCE AS A HUMAN ENDEAVOUR
Scienceis…everywhere! 41.2 Thesciencelaboratory 71.3 Detectiveskills 141.4 Keepingthingsundercontrol 161.5 Analysingdata 191.6 Reportingoninvestigations 23
Study checklist/Digital resources 29Looking back 30
ICT ACTIVITy
Bigger, better beans 33
ON
LIN
E P
AG
E P
RO
OFS

YOUR QUESTWhere’s the science?Work in a small team for this activity. For each of the photographs on this page, work together to write a paragraph about how scientists might be involved in the activity. Select a spokesperson to read the paragraph to the class.
THINK
1 Draw a picture of your own ‘image’ of a scientist on A4 paper.
2 Make a list of the differences between real scientists and the scientist you have drawn. Think about the way they look as well as what they do.
3 Get together in a group and compare your lists and drawings. Together, compile a group list and draw a group image or description of a scientist.
4 As a group, suggest one single word that describes what all scientists do.
5 Use the Australian Academy of Science weblink in your eBookPLUS to find out more about the work of the Academy.
31 Science is …
ON
LIN
E P
AG
E P
RO
OFS

Science is … everywhere!
1.1 S C I E N C E A S A H U M A N E N D E A V O U R
Science is … biology… the study of living things. There are many branches of biology. Zoology is concerned with animals and botany with plants. Entomology is the study of insects while microbiology is the study of living things that are too small to see without the help of a microscope.
Science is … physics… the study of the behaviour of natural and manufactured things and reasons for their behaviour. Physics is concerned with movement and different forms of energy such as light, heat, electricity and nuclear energy. Branches of physics include acoustics, the study of sound, and biomechanics, the study of the forces involved in human and other animal movement.
Scientific knowledge is all around you. Whenever you turn on a light, eat food, watch television or flush the toilet you are using the products of
scientific knowledge. Nurses, police, dietitians, teachers, doctors, vets, mechanics, gardeners, stage designers and artists
use scientific knowledge. In fact you could easily add to this list yourself. For example, engineers use scientific knowledge to design bridges,
computers, factories, artificial limbs, sewerage systems and buildings.
eLessonCareer spotlight: scientistMeet marine biologist Jodie Haig and learn about this exciting career in marine science. eles-0053
4 Science Quest 7
ON
LIN
E P
AG
E P
RO
OFS

Science is … chemistry… the study of substances, what they are made of, how they are formed, how they change and what happens when they are combined. Branches of chemistry include radiochemistry, the study of
radioactive substances, and pharmacology, the study of the effect of drugs
on living things.
WHAT DOES IT MEAN?psyche
Science is … geology… the study of the Earth and how it changes. A geologist might, for example, be concerned with how mountains are formed or with using rocks to trace the Earth’s history. Vulcanology, the study of volcanoes, seismology, the study of earthquakes, and palaeontology, the study of fossils, are some of the branches of geology.
Science is … astronomy… the study of the stars, the sun, the planets, their moons and other heavenly bodies such as comets and asteroids.
Science is … psychology… the study of the mind and behaviour. Most psychologists are concerned with human thought and emotion, but some work with other animals. Branches of psychology include sports psychology, which deals with the motivation of athletes, and forensic psychology, which deals with psychology and the law.
51 Science is …
ON
LIN
E P
AG
E P
RO
OFS

The people of scienceScientists can be found just about anywhere. They could be on a riverbank taking water samples, on a boat fitting dolphins with radio transmitters to track their movements, searching for fossils in outback cliffs, in a laboratory searching for the cause of a disease, beside a freeway measuring the effects of sound barriers — even in space investigating the effects of weightlessness.
Some scientists work in more than one branch. For example, a biochemist works in biology and chemistry, studying the substances in living things. A biophysicist might study the small electrical signals that travel from your ear to your brain, which enable you to hear.
Science and technologySince prehistoric times, people have been making scientific discoveries that have improved the quality of life. The use of scientific ideas to design devices that make life easier is called technology. The invention of the wheel is a good example of early technology. The scientific idea behind the wheel is that objects roll over surfaces more easily than they slide across them. The interaction of science and technology has been the driving force behind our modern technological world.
UNDERSTANDING AND INQUIRINGTHINK
1
2
3
IMAGINE
4
5
INVESTIGATE
6
7
8
HOW ABOUT THAT!
6 Science Quest 7
ON
LIN
E P
AG
E P
RO
OFS

Equipment Use
Retort stand Used with a clamp and bosshead to hold equipment at the required height
Safety glasses Protect eyes
Spatula Used to pick up small amounts of solid substances
Stirring rod Used to stir mixtures
Test tube Container for holding, heating or mixing small amounts of substances
Test-tube holder Holds a test tube while it is being heated
Test-tube rack Holds test tubes upright
Thermometer Measures temperature
Tongs Used to hold small objects while they are heated or to pick up hot glassware
Tripod Supports a gauze mat over a Bunsen burner
Watchglass Holds small quantities of solids
Equipment Use
Beaker Container for mixing or heating liquids and other substances
Bosshead Holds the clamp to a retort stand
Bunsen burner Heats substances
Clamp Holds objects at the required height on a retort stand
Conical flask Container for mixing substances or collecting filtered substances
Evaporating dish Container for heating small amounts of substances over a Bunsen burner
Filter funnel Used with filter paper to filter substances
Gauze mat Supports a container over a Bunsen burner while it is heated
Heatproof mat Protects benches from damage
Measuring cylinder Used to measure the volume of a liquid accurately
The science laboratory
1.2
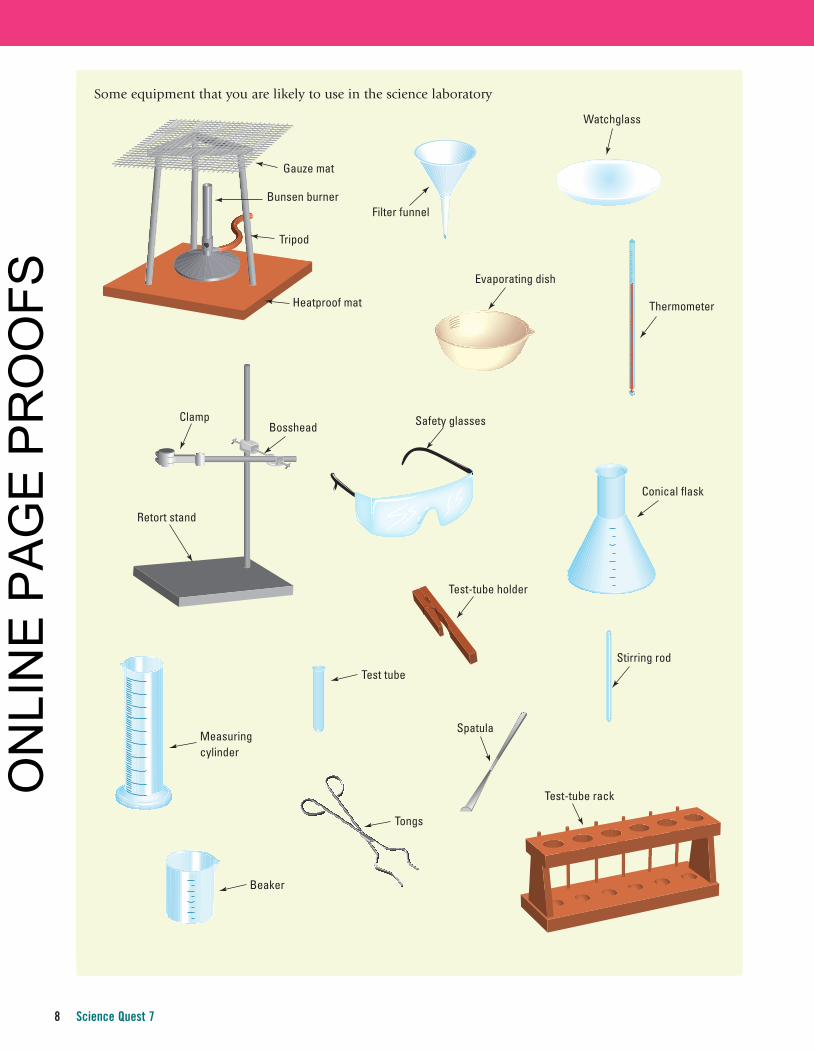
Laboratory equipmentSome of the equipment that you are likely to use in the science laboratory is illustrated on the next page.• Use the illustrations to find each item of equipment in the checklist
below. On a copy of the checklist, place a tick beside each item when you have found it.
Getting to know the science lab
71 Science is …
ON
LIN
E P
AG
E P
RO
OFS
Gauze mat
Tripod
Bunsen burner
Heatproof mat
Conical �ask
BossheadClamp
Measuringcylinder
Beaker
Tongs
Test tube
Spatula
Evaporating dish
Safety glasses
Filter funnel
Retort stand
Test-tube holder
Test-tube rack
Stirring rod
Thermometer
Watchglass
Some equipment that you are likely to use in the science laboratory
8 Science Quest 7
ON
LIN
E P
AG
E P
RO
OFS

Parallax errorMeasurements should always be made with your eye in line with the reading you are taking. When scales are read from a different angle, the reading is not accurate. This type of reading error is called parallax error.
Measuring volumeLiquids in containers such as measuring cylinders are often curved at the top edge. The curve is called a meniscus. The edges of the meniscus may curve up or down. We always measure the volume of liquids from the middle flat section of the meniscus.
Measuring temperatureA thermometer is used to measure temperature. The unit of measurement commonly used is degrees Celsius (°C). The thermometers used in schools are filled with alcohol, dyed red so that they are easier to read. When using thermometers, remember these points.• Never rest the bulb of the thermometer on the
bottom of a container being heated as the bottom may be hotter than the rest of its contents.
• Ensure that the liquid for which you are measuring the temperature fully covers the thermometer bulb.
• Read the thermometer with your eye level with the top of the alcohol column.
Reading scalesIn science, a scale or set of numbered markings generally accompanies each measuring device. For example, your ruler measures length, and its scale has markings enabling you to measure with an accuracy of 0.1 cm. A laboratory thermometer has a scale that measures temperature with an accuracy of 0.5 °C.
When reading a scale, it is important to determine what each of the markings on the scale represents. Practise reading the scales below.
60 mL
Reading = 57 mL Reading = 56 mL
55
50
45
40
60 mL
55
50
45
40
Measuringcorrectly
Measuringincorrectlyresults in aparallax error.
The temperatures measured by thermometers A and B are 39 °C and 23.6 °C, respectively. What are the temperatures measured by thermometers C to J?
F25
24
23
G
70
80
H
70
80
I
40
50
30
J
40
50
30
A 50
40
30
B
24
23
22
C 50
40
30
D
24
23
22
E 25
24
23
91 Science is …
ON
LIN
E P
AG
E P
RO
OFS

Playing it safeDoing experiments in science can be exciting, but accidents can happen if investigations are not carried out carefully. There are certain rules that must be followed for your own safety and the safety of others.
Handy hints• Use a filter funnel when pouring from a bottle or
container without a lip.• Never put wooden test-tube holders near a flame.• Always turn the tap on before putting a beaker,
test tube or measuring cylinder under the stream of water.
• Remember that most objects get very hot when exposed to heat or a naked flame.
• Do not use tongs to lift or move beakers.
Working with dangerous chemicalsYour teacher will tell you how to handle the chemicals in each experiment. At times, you may come across warning labels on the substances you are using.
Always wear gloves and safety glasses when using chemicals with this symbol. Corrosive substances can cause severe damage to skin and eyes. Acid is an example of a corrosive substance.
These substances are easily set on fire so keep them away from flames. Methylated spirits is flammable.
Chemicals with this label can cause death or serious injury if swallowed or breathed in. They are also dangerous when touched without gloves because they can be absorbed by the skin. Mercury is a toxic substance.
CORROSIVE
8
FLAMMABLEGAS2
ALWAYS …
◗
◗
◗
◗
◗
◗
◗
◗
◗
NEVER …
◗
◗
◗
◗
◗
◗
◗
◗
◗
10 Science Quest 7
ON
LIN
E P
AG
E P
RO
OFS

Heating substancesMany experiments that you will conduct in the laboratory require heating. In school laboratories, heating is usually done with a Bunsen burner. A Bunsen burner provides heat when a mixture of air and gas is lit.
Bunsen burners heat objects or liquids with a naked flame. Always tie hair back and wear safety glasses and a laboratory coat or apron when using a Bunsen burner.
Heating containersBeakers and evaporating dishes can be placed straight onto a gauze mat for heating. Never look directly into a container while it is being heated. Wait until the equipment has cooled properly before handling it.
A GUIDE TO USING THE BUNSEN BURNER
1
2
3
4
5
6
7
8
Base
Barrel
Collar
Airhole(gas jet inside)
Gas hose
Beaker
Bunsen burner
Heatproof mat
Gauze mat
Tripod
Evaporating dish
Use a gauze matover a tripod to hold containers over a Bunsen burner �ame.
INVESTIGATION 1.1
Which flame is hotter? AIM To determine which is the hotter part of a Bunsen burner flame: blue or yellow
METHOD AND RESULTS ◗
◗
◗
1
◗
◗
◗
2
3
4
5
6
111 Science is …
ON
LIN
E P
AG
E P
RO
OFS

INVESTIGATION 1.2
Where is the hottest part of the flame? AIM To locate the hottest part of a Bunsen burner flame
METHOD AND RESULTS
◗
◗
◗
◗
◗
◗
◗
1
2
3
4
DISCUSS AND EXPLAIN
5
6
Unburnt match
Pin
INVESTIGATION 1.3
Heating a substance in a test tube AIM To safely heat a substance in a test tube
METHOD AND RESULTS
◗
◗
◗
DISCUSS AND EXPLAIN
1
2
Pouring a liquid into a test tube
Heating a test tube
12 Science Quest 7
ON
LIN
E P
AG
E P
RO
OFS

UNDERSTANDING AND INQUIRINGREMEMBER
1
2
3
4
5
6
THINK
7
8
9
CREATE
10
11
12
Danger in the laboratory
1.1 The science laboratory1.2 Playing it safe
worksheets
131 Science is …
ON
LIN
E P
AG
E P
RO
OFS

1.3
Detective skillsCrime scene investigators make observations at the scene of the crime. A footprint, the smell of perfume, an unusual sound or a warm log in a fireplace could provide clues to a crime.
The investigators also collect evidence so that they can make more observations in the laboratory. They use their observations to make an inference about what happened. An inference is a suggested explanation of what took place. But inferences are not always right. Further investigation is usually needed. The investigators often form a hypothesis about what happened. A hypothesis is an educated guess that can be tested by an experiment, further observations or measurement. After testing a hypothesis you might be able to form a conclusion about what happened. A conclusion is a final explanation of what took place. Sometimes the investigator has to return to the scene of the crime to gather more evidence to make further observations and start the process all over again before a conclusion can be formed.
The process used by crime scene investigators is used in almost all scientific investigations. Sometimes scientists form a hypothesis without making an inference first and sometimes no hypothesis is formed before an experiment.
Who or what did this?To solve the mystery shown in the scene below, careful observations have to be made. Normally you are able to use all five senses to make observations. However, in this case you can use only your sense of sight.1. Look carefully at the drawing and write down as
many observations as you can that might help solve the mystery.
2. Make an inference about what happened.3. Form a hypothesis about the mystery that can be
tested by closer observation, measurement or an experiment. Explain how your hypothesis could be tested by a real crime scene investigator.
4. Why is it not possible to form a conclusion about who or what caused the mess using the drawing alone?
Furt
her o
bser
vatio
ns a
re m
ade
if ne
cess
ary.
Observationsare made.
Data are collected in experiments.
A hypothesis is made.
Conclusions are made.
An inference is based onthese observations.
This flowchart summarises the process of many scientific investigations.
HOW ABOUT THAT!
Who or what did it?
14 Science Quest 7
ON
LIN
E P
AG
E P
RO
OFS
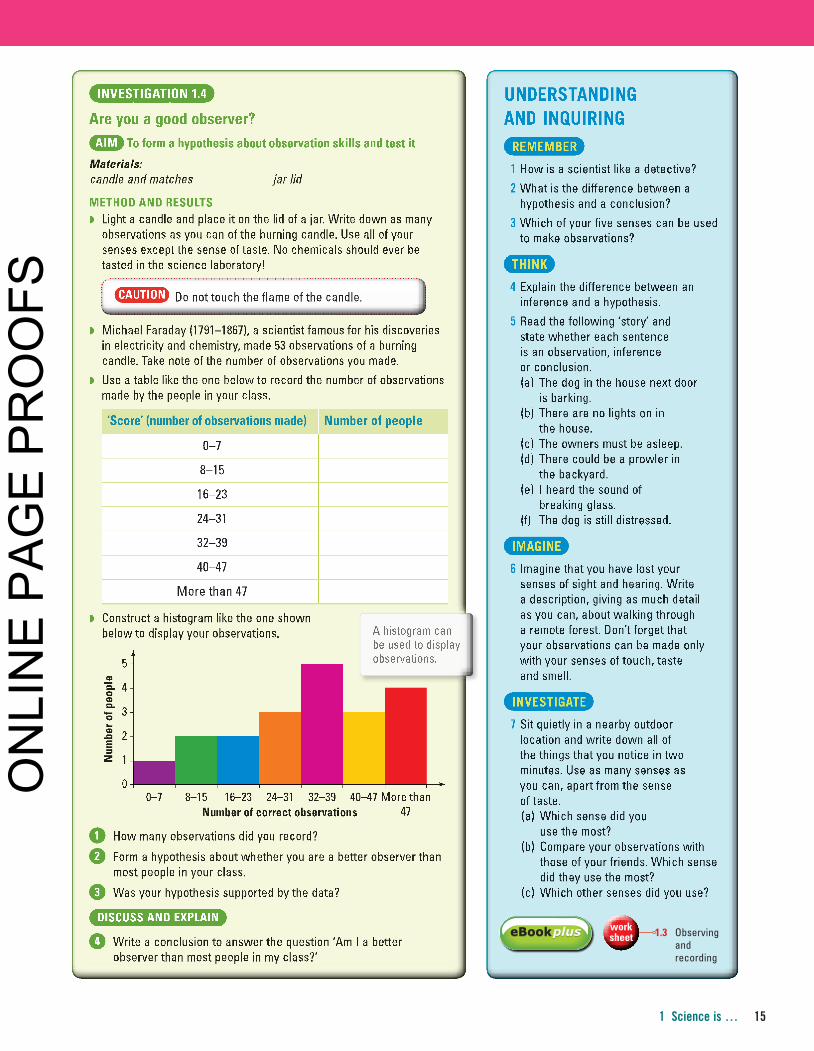
INVESTIGATION 1.4
Are you a good observer? AIM To form a hypothesis about observation skills and test it
METHOD AND RESULTS ◗
◗
◗
‘Score’ (number of observations made) Number of people
◗
1
2
3
DISCUSS AND EXPLAIN
4
A histogram can be used to display observations.
UNDERSTANDING AND INQUIRING
REMEMBER
1
2
3
THINK
4
5
IMAGINE
6
INVESTIGATE
7
1.3 Observing and recording
worksheet
caution
151 Science is …
ON
LIN
E P
AG
E P
RO
OFS

In order to answer a question scientifically, a controlled investigation needs to be performed. The investigation must also be reliable. The simple investigation of bouncing balls described below illustrates how experiments can be both controlled and reliable.
VariablesThere are many factors that affect how high a ball bounces after being dropped. They include:• the height from which the ball is dropped• the type of ball• the type of surface the ball is dropped onto• how much the ball has been used• the method of dropping• the technique used to measure the
bounce height.These factors are called variables. The variable that you are investigating is called the independent variable. In this investigation the independent variable is the type of ball. You are comparing balls of similar sizes made from different materials. The variable that you are measuring (the height of the bounce) is called the dependent variable.
Fair testingScientific investigations must be fair tests. In a fair test only one variable is changed at a time — the independent variable. In this investigation about the tennis ball bounce, that is the type of ball. All variables other than the dependent variable must be controlled; that is, they must be kept the same. If they were not, you couldn’t tell which variable was affecting the height of the bounce. You might find it helpful when designing your own investigations to use a table like the one above right to identify all the variables.
Investigation: Which type of ball bounces the highest after being dropped on the ground?
Independent variable • The type of ball
Dependent variable • The height of the bounce
Controlled variables • The type of surface the ball is dropped onto
• How much the ball has been used (use brand-new balls)
• The method of dropping• The technique used
to measure the bounce height
Keeping things under control
1.4
INVESTIGATION 1.5
Bouncing balls AIM To plan, conduct and report on a scientific investigation in which variables are controlled
METHOD AND RESULTS ◗
1
◗
◗
◗
2
InteractivityReading scalesTest your skill in identifying temperatures on a number of different thermometers by completing this interactivity in your eBookPLUS. int-0201
16 Science Quest 7
ON
LIN
E P
AG
E P
RO
OFS

Out of controlSometimes it is not possible to control all of the variables that need to be controlled. These variables are called uncontrolled variables. These ‘out of control’ variables can make your data unreliable. In the bouncing ball investigation the size of the ball is uncontrolled. However, the effect of size is minimised by testing balls of approximately the same diameter.
Repetition and reliabilityIf you measured the bounce height of each ball only once, your result may not be reliable. Errors often occur in measurements due to carelessness, a minor change in method (for example in the way the ball was dropped) or inaccuracies in reading a scale. To reduce the effect of these errors, measurements should be repeated a number of times and an average calculated. The table above right shows an example in which the bounce height of a wet tennis ball is compared with the bounce height of a dry tennis ball.
Comparing the bounce height of wet and dry tennis balls
Trial
Height of bounce (cm)
Wet tennis ball Dry tennis ball
1 47 47
2 45 48
3 42 50
4 42 48
5 44 52
Average 44 49
The average of these measurements suggests that a dry tennis ball will bounce higher than a wet one. If you recorded only trial 1, you would form a different — and incorrect — conclusion.
Including a controlSome investigations require a control or a control group. For example, you might be investigating the effects of watering plants with salty water. You could use three different containers of water, each with a different amount of salt in the water. The independent variable is the amount of salt dissolved in the water. The dependent variable might be the height of the plant after ten days of watering. For reliability you observe at least three plants for each amount of salt. To fully investigate the effect of the salt in the water you need a control group of plants, to which you give water without any added salt. In a control group the independent variable (the salt) is not applied.
WHAT DOES IT MEAN?
Include a control (above) to test whether wetting a ball (right) affects how high it bounces.
50 g/L100 g/L
150 g/LCONTROL:NO SALT
Some investigations require a control group.
50 g/L100 g/L
150 g/LCONTROL:NO SALT
171 Science is …
ON
LIN
E P
AG
E P
RO
OFS

UNDERSTANDING AND INQUIRINGREMEMBER
1
2
3
THINK
4
5
6
ANALYSE AND EVALUATE
Time (min)
Temperature (°C)
Simon’s cup Jessie’s cup
7 8
9
10
BRAINSTORM
11
INVESTIGATE
12
•••
••
13
Amy and Nguyen’s experiment in progress
1.4 Developing a fair testworksheet
18 Science Quest 7
ON
LIN
E P
AG
E P
RO
OFS
1.5
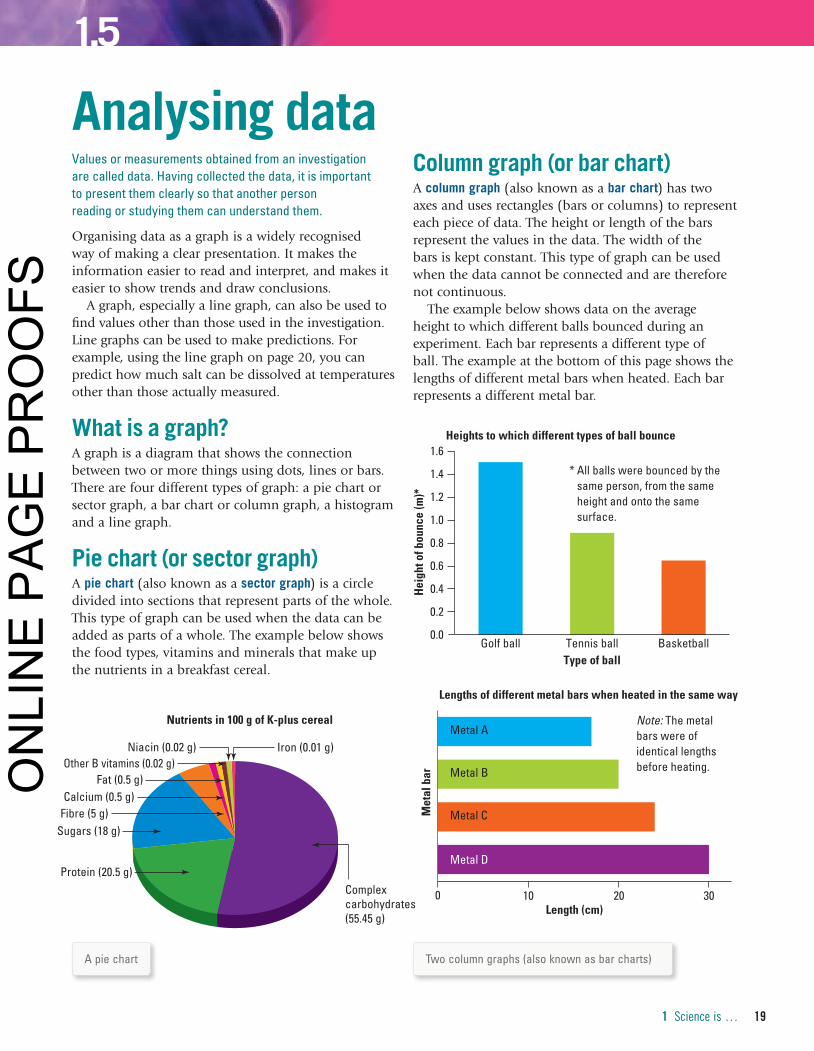
Analysing dataValues or measurements obtained from an investigation are called data. Having collected the data, it is important to present them clearly so that another person reading or studying them can understand them.
Organising data as a graph is a widely recognised way of making a clear presentation. It makes the information easier to read and interpret, and makes it easier to show trends and draw conclusions.
A graph, especially a line graph, can also be used to find values other than those used in the investigation. Line graphs can be used to make predictions. For example, using the line graph on page 20, you can predict how much salt can be dissolved at temperatures other than those actually measured.
What is a graph?A graph is a diagram that shows the connection between two or more things using dots, lines or bars. There are four different types of graph: a pie chart or sector graph, a bar chart or column graph, a histogram and a line graph.
Pie chart (or sector graph)A pie chart (also known as a sector graph) is a circle divided into sections that represent parts of the whole. This type of graph can be used when the data can be added as parts of a whole. The example below shows the food types, vitamins and minerals that make up the nutrients in a breakfast cereal.
Column graph (or bar chart)A column graph (also known as a bar chart) has two axes and uses rectangles (bars or columns) to represent each piece of data. The height or length of the bars represent the values in the data. The width of the bars is kept constant. This type of graph can be used when the data cannot be connected and are therefore not continuous.
The example below shows data on the average height to which different balls bounced during an experiment. Each bar represents a different type of ball. The example at the bottom of this page shows the lengths of different metal bars when heated. Each bar represents a different metal bar.
Complexcarbohydrates(55.45 g)
Nutrients in 100 g of K-plus cereal
Protein (20.5 g)
Fat (0.5 g)
Niacin (0.02 g) Iron (0.01 g)Other B vitamins (0.02 g)
Sugars (18 g)
Calcium (0.5 g)Fibre (5 g)
A pie chart
0.0
0.2
0.4
0.6
0.8
1.0
1.2
1.4
1.6Heights to which different types of ball bounce
Golf ball Tennis ball BasketballType of ball
Hei
ght o
f bou
nce
(m)*
* All balls were bounced by the same person, from the same height and onto the same surface.
0 10 20 30
Lengths of different metal bars when heated in the same way
Met
al b
ar
Note: The metal bars were of identical lengths before heating.
Metal A
Metal B
Metal C
Metal D
Length (cm)
Two column graphs (also known as bar charts)
191 Science is …
ON
LIN
E P
AG
E P
RO
OFS

UNDERSTANDING AND INQUIRINGANALYSE THIS
1
Nutrient Amount (g)
2
Food Energy (calories)
3
Salt Percentage (%)
HistogramHistograms are similar to column graphs except that the columns touch each other because the data are continuous. They are often used to present the results of surveys. In the histogram on the right, each column represents the number of students that reach a particular height.
Line graphA line graph has two axes — a horizontal axis and a vertical axis. The horizontal axis is known as the x-axis, and the vertical axis is known as the y-axis. The line graph is formed by joining a series of points or drawing a line of ‘best fit’ through the points. Each point represents a set of data for two variables, such as height and time. Two or more lines may be drawn on the same graph.
Line graphs are used to show continuous data — that is, data in which the values follow on from each other. For example, the line graph on the right shows the change in the solubility of a salt in water as the temperature of the water increases. (Solubility is a measure of the mass of a substance that can be dissolved in a liquid.)
Heights of a group of students in a class
Height (cm)
Num
ber o
f stu
dent
s
0
5
10
15
20
142 143 144 145141140 146
A histogram
Change in solubility of a salt in 100 mL of water with increasing temperature
Temperature (°C)
Mas
s of
dis
solv
ed s
alt (
g)
150
100
50
0302520151050
A line graph
20 Science Quest 7
ON
LIN
E P
AG
E P
RO
OFS

Salt Percentage (%)
4
Use Percentage (%)
5
Activity Number of hours
Activity Number of hours
Activity
Energy used per hour
by average female — 58 kg (kj)
Energy used per hour
by average male —
70 kg (kj)
1.5 Drawing a line graphworksheet
211 Science is …
ON
LIN
E P
AG
E P
RO
OFS

1.6
Reporting on investigationsWhen scientists conduct investigations, they need to write reports to tell other people about their work. When you conduct experiments, you need to write reports that allow others to understand what you did and to read about what you found out.
Your reports should include the following sections.
AimA statement about why you did the experiment
MaterialsA list of the equipment and chemicals that were used
MethodAn account of what was done. This will usually include a diagram showing how your equipment was set up. There should be enough details included to allow the reader to repeat your experiment.
ResultsA presentation of your data. This might include a list of observations, or tables and graphs.
DiscussionAn explanation of your results and a description of any difficulties you had with the experiment. This section might also include suggestions for improvements to the experiment.
ConclusionA brief account of what you found out and how your findings relate to your aim. It is a good idea to read your aim again before you write your conclusion.
Drawing science equipmentWhen reporting your experiments, a good, simple diagram can make it much easier for the reader to understand what was done. There are some rules to remember:1. Diagrams in scientific reports should be drawn
in pencil.2. Straight lines should be drawn with a ruler.3. Each item of equipment should be labelled.
The following diagram shows how some commonly used items of equipment should be drawn.
Tripod and gauze mat
Bunsen burner and heatproof mat
Beaker
Conical �ask
Test tube
Retort stand, bosshead and clamp
Filter funnel and �lter paper
Diagrams in scientific reports should be simple. In each case above, the apparatus is shown on the left and the diagram of this apparatus on the right.
Organising observations and dataWhen making a lot of observations, it is often helpful to organise them in a table. Observations and measurements that are organised in tables are easier to read. Tables also make it easier for you to draw graphs.
22 Science Quest 7
ON
LIN
E P
AG
E P
RO
OFS

INVESTIGATION 1.6
Recording observations in a table AIM To record method and observations of simple experiments in a table
METHOD AND RESULTS
1
ActivitySummary of what
was done Observations
◗
◗
◗
◗
◗
DISCUSS AND EXPLAIN
2
3
4
5
6
caution
caution
231 Science is …
ON
LIN
E P
AG
E P
RO
OFS

INVESTIGATION 1.7
Graphing temperature
AIM To observe how the temperature of water changes while it is heated over a Bunsen burner
METHOD AND RESULTS ◗
◗
◗
◗
1
Time (min) Temp (°C) Time (min) Temp (°C)
◗
◗
◗
2
◗
3
4
DISCUSS AND EXPLAIN
5
6
7
8
24 Science Quest 7
ON
LIN
E P
AG
E P
RO
OFS

Using technology: spreadsheetsA spreadsheet is a document that stores data in columns and rows. Spreadsheets used to be written on paper by hand. Shopkeepers and bank tellers needed to keep neat handwritten ledgers to record all transactions. Today, computers and software such as Microsoft Excel are used to create and edit spreadsheets. Spreadsheets can also be used to create graphs and charts at the click of a button.
Some spreadsheet terminologyIn a spreadsheet, the data are organised in rows and columns. The columns are named using letters (such as column B) and the rows are named using numbers (such as row 3). Cells are the boxes in the spreadsheet. The cell reference tells us which column and row the cell is in. For example, cell B3 is in column B and row 3. The active cell is the cell you will type the data in. In Excel, it has a dark border around it. This is shown in the diagram below.
Cell B3 is the active cell.
A good quality report of an experiment
Working with Excel spreadsheetsWhen you create a spreadsheet, you need to decide how many columns and rows you will need and enter a suitable heading for each column. This is similar to designing a table. Make sure that you include units where relevant. When using Excel, you can format cells in a variety of ways by using the Format tool.
Entering formulae in Excel If you want to do calculations on the data in a spreadsheet, you need to enter a formula. In Excel, a formula always starts with an equals sign (=). If you want the total of cell A2 and cell B2 to appear in cell C2, you would type the formula ‘=A2+B2’ in cell C2, and then press the Enter key. You can also use one of the many functions available in Excel.
251 Science is …
ON
LIN
E P
AG
E P
RO
OFS

For example, it is much quicker to use the Average function to calculate the average of 50 numbers than to type in a formula to add the 50 cells and divide the total by 50. The Insert function button, fx, can be used to view the format required for particular functions.
Drawing graphs and chartsDrawing a graph using Excel is easy. Just highlight the data you want to graph, click on the Insert tab, select the type of graph you want to draw and then follow the prompts. Remember that a scatter graph (XY chart) is used to plot one set of values against another in Excel.
UNDERSTANDING AND INQUIRINGREMEMBER
1 Explain why scientists write reports about their experiments.
2 Under which heading of your report of an experiment should the following information be included?(a) Suggestions for improvements to your experiment(b) A reason for doing the experiment(c) Graphs and tables(d) A description of what you did(e) A statement saying what you found out by doing
the experiment
3 Draw a neat, labelled scientific diagram of the following equipment. Water in a conical flask is being heated with
a Bunsen burner. The conical flask is supported by a gauze mat on a tripod. The Bunsen burner is standing on a heatproof mat.
UNDERSTAND
4 In the screenshot below, identify the letter pointing to:(a) cell C2(b) cell E5(c) the active cell(d) a formula(e) the Insert scatter graph button(f) the Insert function button(g) a column(h) a row.
5 List two advantages and two disadvantages of using a computer spreadsheet program to store data rather than keeping handwritten records in a book.
B G
H
A
F
E
C
D
26 Science Quest 7
ON
LIN
E P
AG
E P
RO
OFS

Tem
pera
ture
(°C)
Time (min)
Heating 100 mL of water
100
80
60
40
20
00 2 4 6 8 10 12
120
Temperature
THINK
6 Write a full scientific report on Investigation 1.7.7 Draw a neat, labelled scientific diagram of the two
sets of equipment that would be needed to safely perform the following activity.Part 1:Muddy salt water is being poured from a beaker into a filter funnel (with filter paper). The filter funnel is resting in the opening of a conical flask.Part 2:The filtered salt water, now in an evaporating dish, is being heated by a Bunsen burner. The evaporating dish is supported by a gauze mat on a tripod.
8 A hypothesis is often included in a scientific report — usually under the ‘aim’ heading, immediately after the reason for carrying out the experiment. What is a ‘hypothesis’?
INVESTIGATE
9 Design an experiment to investigate whether adding salt to water changes how the temperature rises when the water is heated. Write a scientific report outlining the design of your experiment.
ANALYSING DATA
10 (a) Create a spreadsheet with the column headings ‘Time (min)’ and ‘Temperature (°C)’. Enter your data from Investigation 1.7. You should end up with a table similar to the one below.
(°C)’. You should obtain a graph similar to the one above.
11 Use the graph from question 10 to answer the following questions.(a) For how long did the experiment run?(b) What was the temperature of the water when the
experiment began?(c) How long did it take for the water to boil?(d) How many readings were taken?(e) What would you expect the graph to look like after
10 minutes?(f) How would you expect the graph to change if only
50 mL of water was heated?(g) Sketch a graph of what the predicted
results would be for a 200 mL beaker of water. Perform the experiment to check your predictions.
CREATE
12 (a) Collect the following data for each student in your class.
(i) First name(ii) Gender
(iii) Foot length (cm)(iv) Height (cm)(v) Favourite subject
(vi) Country where mother was born(b) Enter the data you collected into
a spreadsheet.(c) Click on the Insert tab, then use the Chart
function button to construct a scatter graph (without joining points) showing foot length on the x-axis and height on the y-axis.
(d) Use your graph to decide whether there is a relationship between foot length and height.
(b) Use your data to create a scatter graph with the points joined by straight lines.
(c) Create a title for your graph. Label the x-axis ‘Time (min)’ and the y-axis ‘Temperature
271 Science is …
ON
LIN
E P
AG
E P
RO
OFS

Answers for this chapter can be found online in your eBookPLUS.
Individual pathways
STUDY CHECKLISTSCIENCE AS A HUMAN ENDEAVOUR
■ describe how science is used in a range of occupations ■ outline some of the branches of science and how they
affect everyday life ■ distinguish between science and technology
INTRODUCING THE LABORATORY
■ identify and safely use a range of equipment to perform scientific investigations and collect data
■ describe ways to reduce the risk to yourself and others in the laboratory
PLANNING AND CONDUCTING INVESTIGATIONS
■ make inferences and testable hypotheses in the light of observations and measurements
■ describe a logical procedure for undertaking a controlled experiment
■ use repetition of measurement to increase the reliability of data
■ form conclusions based on experimental results ■ reflect on your methods and make suggestions for
improvements to your investigations ■ use a scientific report with clear diagrams where
necessary to describe your investigations and their findings
PROCESSING AND ANALYSING DATA AND INFORMATION
■ make and accurately record observations and measurements using the appropriate equipment
■ organise data clearly using tables ■ construct an appropriate type of graph (e.g. column
graph, pie chart, line graph) to present your data ■ use tables and graphs to identify trends and patterns,
and assist in the formation of conclusions ■ identify data that support or discount a hypothesis
Activity 1.1Investigatingdoc-6075
Activity 1.2Analysing investigationsdoc-6076
Activity 1.3Designing investigationsdoc-6077
eLESSONS
eLessons
Career spotlight: scientistIn this video lesson, you will meet marine biologist Jodie Haig and learn what it takes to be a scientist working in the marine environment. With insight into her work in the lab and in the
field, you will get some useful advice to help you decide if this could be an attractive career for you.searchlight ID: eles-0053
Interactivities
Using equipmentIn this interactivity, you are given a number of scientific processes and you must indicate which equipment from a selection of items commonly found within a laboratory you would use to complete the processes. Instant feedback is provided.searchlight ID: int-0200
reading scalesThis interactivity challenges your knowledge of scales by testing your skill in identifying temperatures on a number of different thermometers. Instant feedback is provided.searchlight ID: int-0201
FOCUS activityAccess more details about focus activities for this chapter in your eBookPLUs. doc-10528
Science Quest 728
ON
LIN
E P
AG
E P
RO
OFS

Link to assessON for questions to test your readiness FOr learning, your progress As you learn and your levels OF achievement.www.assesson.com.au
(c) When heating a test tube, hold the test tube using tongs/a test-tube holder at the top/middle of the test tube and keep it steady/move it back and forth over the flame.
8 The steps used to light a Bunsen burner can be displayed as a flowchart, as shown below. Use the information in the flowchart to construct a storyboard with six scenes to show how a Bunsen burner is lit correctly and safely.
9 Name each of the items of equipment below.
(a) (b) (c)
(d) (e) (f)
LOOKING BACK
Lighting a Bunsen burner
Place the Bunsen burner on a heatproof mat.
Light the match.
Ensure that the airhole is closed.
Open the gas tap.
Hold the burning match just above the top of the barrel.
Check that the rubber tubing is connected properly to the gas tap.
1 Match the following scientists with their work.
scientist work
(a) Physicist (A) Investigates how rocks and mountains form
(b) Chemist (B) Studies living things
(c) Biologist (C) Explains things like movement, heat and light
(d) Astronomer (D) Studies how substances react with others
(e) Earth scientist (E) Studies the sky
2 What does each of the following scientists study?(a) Seismologist(b) Biochemist(c) Entomologist(d) Botanist(e) Zoologist(f) Vulcanologist
3 Which of the scientists listed in question 2 could be correctly described as geologists?
4 Indicate whether each of the following actions is a ‘do’ or a ‘don’t’ in the science laboratory.• Wear safety glasses while mixing chemicals.• Pour all substances down the sink when finished
with them.• Run in the science laboratory.• Drink water from the taps in the science laboratory.• Tie long hair back before using a Bunsen burner.• Wait until the end of the lesson to tell your teacher that
you have burnt yourself.
5 Write a list of all of the equipment that you would need to boil water in a beaker in your science laboratory. Draw a labelled scientific diagram to show the equipment in use.
6 Copy this diagram of a Bunsen burner and complete all of the missing labels.
7 Rewrite the following sentences correctly by selecting the appropriate words in italics.(a) When lighting a Bunsen burner, light the match
before/immediately after turning on the gas.(b) When using a thermometer to measure the
temperature of a liquid as it is heated, place the bulb of the thermometer on the bottom/near the centre of the beaker.
291 Science is …
ON
LIN
E P
AG
E P
RO
OFS

10 Kimberley and Glenn were walking past their neighbour’s house when they noticed that a front window was broken. Glenn told Kimberley that somebody had probably thrown a ball through the window. They had a closer look and noticed clothes scattered all over the floor and drawers open. Kimberley noticed some blood on the broken glass. She told Glenn that the house had been burgled. Glenn agreed and they called the police.(a) List the observations that were made.(b) Who made an inference?(c) What was the inference and why was it suggested?(d) What conclusion was reached by Kimberley
and Glenn?(e) Suggest a different conclusion based on the
observations that were made.
11 What item of equipment would you use to measure:(a) the temperature of hot water(b) the mass of a small beaker of water(c) the volume of a small quantity of water?
12 Identify the temperature measured by each of the thermometers shown below.
13 The following graph shows how far from the starting point a snail moves in an experiment.
(a) Calculate how far from the starting point the snail was 7 minutes after timing began.
(b) During what times did the snail not move at all?(c) What does the graph tell us about the snail’s movement
between 7 and 8 minutes after timing began?(d) Propose why a smooth line was not drawn in
this graph.
14 Identify which of the following is an important safety rule in science.A When smelling chemicals, place your nose carefully
over the container.B Dispose of all materials in the rubbish bin.C When reading the volume of a liquid, always read the
bottom of the meniscus.D Point test tubes away from your eyes and away from
your fellow students.
15 Equipment used for measuring the volume of liquids includes:A conical flask, beaker, measuring cylinder.B measuring cylinder, crucible, beaker.C watchglass, filter funnel, conical flask.D evaporating basin, test tube, beaker.
16 Luke was sick and tired of being bitten by mosquitoes. He counted several bites each evening when he sat outside to have dinner. He had heard that a burning citronella candle was a good way to keep mosquitoes away. Design an experiment to test Luke’s idea. Identify the independent and dependent variables and the controlled variables needed to make this a fair test. Suggest a control for your experiment.
17 Huang and Tina conducted an investigation to find out whether radish plants grow better in the shade. They placed three seedlings under a verandah at the back of the house and another three in a sunny place in the front yard. All plants were planted in the same soil and were watered equally each day. Huang and Tina measured the height of each plant and the number of healthy leaves at the same time every second day.(a) What was the independent variable in the investigation?(b) What were the dependent variables?(c) List the variables that should have been controlled.(d) How could Huang and Tina improve the design
of their experiment? List as many improvements as possible.
(e) In your opinion, did Huang and Tina conduct a fair test? Give reasons for your opinion.
18 Now that you’ve spent some time working on this chapter, think about the best way to describe a scientist.(a) Draw a picture of your own image of a
‘typical’ scientist.(b) Write your own description of a ‘typical’ scientist.(c) Write a comment about how your image of a
scientist has changed since you started working on this chapter.
90
80
70
18
17
16
(a) (b)
1.6 Designing an experiment1.7 Checklist
worksheets
00
5
10
15
20
25
30
Dis
tanc
e fr
om s
tart
ing
poin
t (cm
)
Time (min)1 2 3 4 5 6 7 8
30 Science Quest 7
ON
LIN
E P
AG
E P
RO
OFS

Bigger, better beansSEARCHLIGHT ID: PRO-0091
ScenarioThe local agricultural show will be running its annual competition to find the biggest bean plant and you are determined that this year you are going to win. In previous years, you have just planted your seeds in their pots, added some fertiliser, put them in the sun and watered them every day but, while the plants did grow, they didn’t grow big enough to have a chance at the prize. As a good science student, you know that the growth of plants depends upon the process of photosynthesis, whereby light energy from the sun causes water and nutrients and carbon dioxide to be combined by the plant to produce oxygen and starch (which is a form of chemical potential energy). The plant then uses this starch to grow. So, if the growth of the plants depends upon how much starch is produced, maybe there’s something you could do to the plants that would make them produce more starch and grow faster and bigger?
ICT ACTIVITY
eLesson Growing plants in AustraliaThis video lesson is presented by a top Australian horticulturalist and provides you with tips for successfully growing plants in Australia. Watch this video as an introduction to your experiments with plants. searchlight ID: eles-0055
Your taskYou will design and carry out an investigation that will test a number of different growth conditions (for example, different amounts of sunlight or different substances added to the soil) to determine which will give the greatest rate of growth over a three-week period of time. Your findings will be presented in the form of a scientific report.
Process • Open the ProjectsPLUS application for this chapter
located in your eBookPLUS. Watch the introductory video lesson and then click the ‘Start Project’ button to set up your project group. You can complete this project individually or invite other members of your class to form a group. Save your settings and the project will be launched.
311 Science is …
ON
LIN
E P
AG
E P
RO
OFS