
1-s2.0-S0008622312010494-main
29
Accepted Manuscript Characteristics of an advanced carbon sorbent for CO 2 capture Marc D. Hornbostel, Jianer Bao, Gopala Krishnan, Anoop Nagar, Indira Jayaweera, Takao Kobayashi, Angel Sanjurjo PII: S0008-6223(12)01049-4 DOI: http://dx.doi.org/10.1016/j.carbon.2012.12.082 Reference: CARBON 7742 To appear in: Carbon Received Date: 18 September 2012 Accepted Date: 22 December 2012 Please cite this article as: Hornbostel, M.D., Bao, J., Krishnan, G., Nagar, A., Jayaweera, I., Kobayashi, T., Sanjurjo, A., Characteristics of an advanced carbon sorbent for CO 2 capture, Carbon (2013), doi: http://dx.doi.org/10.1016/ j.carbon.2012.12.082 This is a PDF file of an unedited manuscript that has been accepted for publication. As a service to our customers we are providing this early version of the manuscript. The manuscript will undergo copyediting, typesetting, and review of the resulting proof before it is published in its final form. Please note that during the production process errors may be discovered which could affect the content, and all legal disclaimers that apply to the journal pertain.
-
Upload
alek-krotki -
Category
Documents
-
view
10 -
download
1
Transcript of 1-s2.0-S0008622312010494-main

Accepted Manuscript
Characteristics of an advanced carbon sorbent for CO2 capture
Marc D. Hornbostel, Jianer Bao, Gopala Krishnan, Anoop Nagar, Indira
Jayaweera, Takao Kobayashi, Angel Sanjurjo
PII: S0008-6223(12)01049-4
DOI: http://dx.doi.org/10.1016/j.carbon.2012.12.082
Reference: CARBON 7742
To appear in: Carbon
Received Date: 18 September 2012
Accepted Date: 22 December 2012
Please cite this article as: Hornbostel, M.D., Bao, J., Krishnan, G., Nagar, A., Jayaweera, I., Kobayashi, T., Sanjurjo,
A., Characteristics of an advanced carbon sorbent for CO2 capture, Carbon (2013), doi: http://dx.doi.org/10.1016/
j.carbon.2012.12.082
This is a PDF file of an unedited manuscript that has been accepted for publication. As a service to our customers
we are providing this early version of the manuscript. The manuscript will undergo copyediting, typesetting, and
review of the resulting proof before it is published in its final form. Please note that during the production process
errors may be discovered which could affect the content, and all legal disclaimers that apply to the journal pertain.

Characteristics of an advanced carbon sorbent for CO2 capture
Marc D. Hornbostel, Jianer Bao*1, Gopala Krishnan, Anoop Nagar, Indira Jayaweera, Takao
Kobayashi, Angel Sanjurjo
SRI International, Menlo Park, CA 94025
And
Josh Sweeney, Donald Carruthers, Melissa A. Petruska, Lawrence Dubois
ATMI, Inc., Danbury, Connecticut, 06810
Abstract
The adsorption and desorption characteristics on an advanced carbon sorbent for gases present
in the flue gas stream, including CO2, N2, O2, Ar, H2O vapor, and impurities NO and SO2 are
discussed. At 5 oC and 1atm CO2 pressure, this carbon sorbent can uptake 20 wt% (or 4.5
mmol/g) of CO2, with high Henry’s law selectivity over N2, O2, and Ar. The heat of adsorption
for CO2 decreases from ~28 kJ/mol (290 meV) to ~25.7 kJ/mol (260 meV) as the coverage of
CO2 increases; whereas the heat of adsorption for N2, O2, and Ar is in the range of 16 to 17
kJ/mol. The carbon sorbent has a high surface area of 1270 m2/g, high thermal conductivity (0.8
W/m-K), low heat capacity (1 J/g-K), high mechanical strength, and high attrition resistance. It
is an ideal candidate for post-combustion CO2 capture using rapid pressure swing and rapid
temperature swing methods.
* Corresponding author. Tel: 650-859-2166, Fax: 650-859-2111, email: [email protected]

1. Introduction
Public concerns over the climate change due to green-house gas emissions and accelerated
increasing of CO2 concentration in the atmosphere lead to an increased need for low-cost and
efficient technologies to capture and sequester CO2 emissions. Fossil-fueled power plants are
responsible for roughly 33-40 % of total carbon emission with coal-fired power plants being the
main contributor [1,2]. A typical 500MW power plant emits 2 to 3 million tons of CO2 per year.
CO2 capture from these large, stationery point sources of CO2 emission gives the potential for a
deep reduction in green-house gas emissions. For these stationary power plants, three
technological CO2 capture concepts are currently being pursued: post-combustion capture, pre-
combustion capture, and oxy-fuel capture systems.
Post-combustion technology could be used for the existing power plants after retrofitting, and
could have an immediate impact on reducing the emission of GHG. The flue gas from
conventional coal-fired power plants, downstream of a flue gas desulfurization (FGD) system, is
typically at atmospheric pressure, water saturated, acidic, and at temperatures between 50 and 60
oC. The CO2 concentration in the flue gas ranges from 10 to 15 % by volume. A number of
technologies could be used for post-combustion capture. In terms of the mechanism, they could
be divided into these categories [3]: (1) adsorption; (2) physical absorption; (3) chemical
absorption; (4) cryogenic; (5) membrane. Commercially available post-combustion CO2 capture
technologies are typically amine-based chemical absorption processes and mostly use the
monoethanolamine (MEA) process, which is capable of achieving high efficiency CO2 capture
and generating a concentrated CO2 stream for sequestration. However, the process has some
drawbacks, including (1) the MEA reagent is expensive and degrades in the flue gas environment;
(2) the MEA-CO2 system is corrosive in concentrated form; (3) the reaction of CO2 with MEA is

highly exothermic; thus (4) the regeneration of the CO2 absorbed MEA is energy intensive and
therefore, the process is a large consumer of auxiliary power. Using technologies based on this
system would result in an 80 % increase in the leveraged cost of electricity [4], which would
significantly impact the U.S. economy. New capture technologies and sorbents are continuously
being explored, such as zeolites, metal organic framework, membranes, calcium oxide, amines,
etc. These reviews provide through discussions on the prospect of various sorbents and related
technologies [3, 5-8]. Currently, for post-combustion capture in particular, no ideal sorbent is
available yet due to various limitations related with either low capture capacity under realistic
pressure conditions, or high cost, slow kinetics, sensitivity to moisture, fast self-degradation, etc.
SRI International and Advanced Technology Materials, Inc. (ATMI) have developed a
process for an innovative, low-cost, and low energy-consuming post-combustion CO2 capture
technology based on an advanced carbon sorbent and a new reactor design. This CO2 capture
process uses a circulating system consisting of falling microbeads of an advanced carbon sorbent
(ACS) that separates an incoming stream of flue gas into two streams: a CO2-lean flue gas stream
from which >90 % of the CO2 has been removed and a pure stream of CO2 that is ready for
compression and sequestration. The system is based on two unique components: spherical carbon
sorbent microbeads made by ATMI (BrightBlackTM
) and a novel reactor design developed by
SRI. The high CO2 loading capacity and low-cost BrightBlackTM
carbon sorbent, which has pore
sizes less than 10 Ǻ, is prepared from poly(vinylidene chloride) (PVDC) pyrolysis with its
porosity tuned to maximize CO2 capture at ambient temperature and pressure.
It was shown to be able to capture as much as 0.2 kg CO2/kg of sorbent at 5 oC in 1 atm CO2
(20 wt%), equivalent to 4.5 mmol of CO2 per gram of sorbent, which is one of the highest
loadings on a solid sorbent. A comparison of many solid sorbents capacity under operating

temperature range could be found in the figures of references [5, 9]. In the present paper, the
adsorption isotherms of various gases (CO2, N2, O2, Ar, H2O vapor, and impurities NO and SO2)
present in a flue gas stream on this advanced carbon sorbent, as well as the rapid CO2
adsorption/desorption characteristics are discussed, which explain how the BrightBlackTM
’s
unique set of properties make it well suited for post-combustion CO2 capture. The processes of
using this sorbent to capture CO2 from flue gas: adsorbing CO2, stripping CO2 from the sorbent,
and sorbent regeneration will be discussed in a second paper. A field test result that has
achieved >95 % product purity and >90 % capture efficiency (at Toledo, OH) will be discussed
in a third paper.
2. Experimental
The advanced carbon sorbent (BrightBlackTM
), with a diameter in the range of 150 to 300 µm,
were prepared from the pyrolysis of commercial PVDC-methyl acrylate copolymers, and then
activated in N2 at 1073 K by ATMI, Inc. Details of the porosity characterization using various
size gas vapor adsorption method are published by ATMI, Inc. [10]. The surface area of this
advanced carbon sorbent and its gas adsorption isotherms in the temperature range of 5 oC to 30
oC were obtained using a Micromeritics ASAP 2020 Surface Area and Pore Size Analyzer. The
desorption characteristics were determined using a Perkin Elmer temperature programmed TGA
thermalgravimetric analyzer. The sample was loaded in a platinum pan with 0.6 cm-diameter
and 0.2 cm-deep. The type (acidic or basic) and quantity of the functional sites on the surface of
the sorbent were determined by classic Boehm titration with various acids and bases. Thermal
conductivity and heat capacity are calculated from the thermal diffusivity results obtained from
the standard flash test method (ASTM E1461) at 25 oC and 100
oC.
The compressive strength of the carbon microbeads was measured using a sensitive MTS
servo-hydraulic testing machine (Model MTS 858 Mini Bionix II) with load up to 200 kg.
Each carbon sorbent microbead was loaded in a polished tungsten carbide disk on the bottom,
and the load was applied by lowering the top tungsten rod (with polished tip) that was connected
to the piston via the load cell. The attrition resistance was measured using the standard ASTM
D5757 air jet test procedure, which is designed to test catalysts that are used in fluidized bed
reactors. A batch of 50 g of microbeads was placed inside a conical vessel on top of a disc that
had three 0.04 cm diameter holes. High velocity air (~500 m/s) was passed through the disc to
fluidize the microbeads. Any solid powder (dust) that separates from the microbeads from
attrition was carried away by the flowing air. The entrained powder was collected in a filter and
measured for its weight.
The type and quantity of the functional sites on the surface of the sorbent were determined by
titration with various acids and bases, and the pH was measured using a water extraction method.
Prior to analysis the sorbent samples were dried in vacuum at 120 °C overnight to remove the
adsorbed gases. One gram of the carbon sorbent was added to 10 mLof deionized water and
stirred for 3 h. The pH of the resulting solution was 6.7. The oxygenated surface groups were
determined according to the classical Boehm titration [11]. Three samples, each with known
amount of carbon sorbent (0.2 g), were placed in 10 mL of the following 0.05 M solutions
respectively: sodium hydroxide (NaOH), sodium carbonate (Na2CO3), and hydrochloric acid
(HCl). The vials were sealed and agitated for 24 h. The excess of base or acid present in the
solution was determined by titrating with HCl and NaOH, respectively.

3. Results and Discussion
3.1 Physical and mechanical properties
The pore size distribution of this carbon sorbent, characterized with various size gas vapors
as well as its micropore volume and BET surface area with N2 are discussed in a previous paper
by ATMI, Inc. [10]. Table 1 summarizes a list of the important physical properties for this
carbon sorbent. Note, the carbon sorbent used in our work corresponds to ACS-1 in the
reference. The Flash method for thermal diffusivity measurement was carried out at 25 oC and
100 oC. It was found that the heat capacity was almost constant in this range, but the thermal
conductivity increased from 0.82 to 0.90 W/m-K. The high thermal conductivity and low heat
capacity provides fast heat transfer rate and allows the sorbent to be heated and cooled efficiently.
Table 1. Physical Properties of the Carbon Sorbent
Parameter Value
Density (g/cm3) 1.10
Diameter (µm) 150-300
Heat Capacity (J/g-K) 1.0
Thermal Conductivity (298K), W/m-K 0.82
aMicropore volume N2 (cm
3/g) 0.41
aMicropore volume CO2 (cm
3/g) 0.45
aThe micropore volume is obtained from Dubinin-Radushkevich method.
The compressive strength of this carbon sorbent could be calculated from the load and
displacement curves obtained (not shown here for space reason). It was found that the
microbeads were strong but brittle, as they broke abruptly. However, the break point is actually
up to a pressure of ~12,000 psi (equivalent to ~84 MPa), which is a very high value for such a

porous material, and significantly higher than for standard activated carbon. For comparison, the
crush strength varies with the size and geometry of the activated carbon, and the range could
vary from sub MPa up to a few tens of MPa [12].
The amount of sorbent material lost after the ASTM D5757 air jet test was found to be only
0.01 and 0.05 g after 1 h and 5 h of testing, respectively. The attrition resistance of 99 %/hr, is
significantly better than other typical activated carbon materials which are not better than 97-
98 %/min. The results demonstrate that our advanced carbon sorbent will have a high durability
in a practical CO2 capture system.
3.2 CO2 adsorption isotherms and heat of adsorption and desorption
The CO2 adsorption isotherms of the advanced carbon sorbent were determined in the
temperature range of 5 to 30 C using a Micromeritics analyzer. The sorbent was first heated in
vacuum at 110 C to remove any adsorbed gas on the sample. After that, the sorbent was cooled
to the adsorption temperature and was exposed to CO2 gas at a pressure about 0.01 atm. The
equilibrium pressure and volume of CO2 adsorbed on the sample were measured. The sample
was then exposed to a higher pressure of CO2 stepwise up to a pressure of 1 atm. Desorption
characteristics were also obtained while reducing the CO2 pressures from 1 atm to 0.3 atm to
desorb the gas from the sorbent.
Fig. 1 illustrates the CO2 adsorption isotherm on the sorbent at 5 C. It shows that the
quantity of CO2 adsorbed increases with the pressure of CO2, though the incremental amount of
CO2 adsorbed decreases with increasing pressure, so that it would approach saturation finally at a
certain pressure. At 1 atm pressure, more than 100 cm3 [STP – standard temperature (0 C) and
pressure (1 atm)] of CO2 is adsorbed per gram of the sorbent. This quantity of the CO2 adsorbed
corresponds to a 20 wt% CO2 loading, which is among the highest measured capacities of all

solid sorbents at ambient temperature so far. At a pressure of 0.15 atm (typical for a flue gas
stream), the adsorption capacity is still high at around 7.8 wt%. Fig. 1 also includes the
desorption isotherm at 5 C. The desorption isotherm is nearly identical to the adsorption
isotherm, indicating that the adsorption of CO2 on the sorbent is highly reversible even at this
low temperature.
Fig. 1. The adsorption (blue) and desorption (pink) isotherms of CO2 on novella BrightBlackTM
carbon sorbent at 5C. Note, 100 cm3 is equivalent to 4.5 mmol and 19.6 wt%.
Similar adsorption isotherms were also obtained at 10, 15, 20, and 30 C, as shown in Fig. 2,
and they all exhibit the same trend. Desorption isotherms were also nearly identical to the
adsorption isotherms (not shown in Fig. 2 for clarity purposes). The data from adsorption
isotherms demonstrate that the quantity of CO2 adsorbed increases with increasing pressure, but
it decreases as the temperature increases.
0.0
20.0
40.0
60.0
80.0
100.0
120.0
0.00 0.20 0.40 0.60 0.80 1.00 1.20
CO 2 Pressure (atm)
CO
2 A
dso
rbed
(cm
3 /g
)
Adsorption
Desorption
Temperature: 5oC >20 wt% CO 2

Fig. 2. Adsorption isotherms of CO2 on the carbon sorbent at a series of temperatures.
The surface area of the carbon sorbent was determined from the CO2 adsorption isotherm at
20 C. Walker and Patel [13] showed that the Dubinin-Polanyi equation can be used to calculate
the surface area of coals from a CO2 adsorption isotherm at ambient temperature. The
monolayer volume Vo obtained from the Dubinin-Polanyi plot of the CO2 adsorption isotherm at
20 oC is 194 cm
3/g. The molecular area for CO2 at 293 K was taken as 0.253 nm
2 [13]. The
density of CO2 gas at 0 oC and 1 atm is 1.977 kg/m
3. We calculated the equivalent microporous
surface area of this novel carbon sorbent to be approximately 1270 m2/g. This number is slightly
larger than that calculated from BET method using N2 at 77K, which is 1030 m2/g [10]. From
Fig. 2, it is seen that about 80 cm3/g of CO2 was adsorbed on the sorbent at 20C at 1 atm CO2
pressure. This quantity of adsorbate will cover less than 50 % of the sorbent.
0.0
20.0
40.0
60.0
80.0
100.0
120.0
0.0 0.2 0.4 0.6 0.8 1.0 1.2 CO 2 Pressure (atm)
CO
2 A
ds
orb
ed
(c
m
3 /g
) Temperature: 5 C
10°C 15°C
20°C 30°C

The equilibrium CO2 loading as a function of temperature and CO2 partial pressure was also
measured using CO2 and Ar gas mixtures using a TGA analyzer, and the result is plotted in Fig.
3. Note, the weight of the initial carbon sorbent was measured in a pure Ar environment at 25 oC
and a small amount of Ar is also adsorbed on this sorbent (as will be discussed later). However,
the y-axis is not corrected for the amount of Ar adsorbed at each composition, since the
adsorption isotherm of Ar on this sorbent was not carried out in this temperature range. This plot
is intended to study the relative percentage variation of the CO2 adsorbed as temperature
increases. As expected, the loading capacity decreases almost exponentially with increasing
temperature, at all gas compositions. With 15 % CO2 composition, the CO2 loading decreases by
around 5 % when the temperature is raised from 25 oC to 30
oC, and the variation is even greater
at lower temperature. This implies that to reduce the amount of sorbent needed to capture CO2
from flue gas streams, it is important to keep the flue gas temperature as low as possible (yet
kinetically feasible) so that the capturing capacity of the sorbent may be optimized.
Fig. 3. CO2 loading on the sorbent as a function of temperature and gas composition.
0
2
4
6
8
10
12
0 20 40 60 80 100 120
Temperature (C)
Wt%
CO
2 o
n t
he
So
rbe
nt
%CO2 in CO2-Ar Gas Mixture
100
75
50
25
15

3.3 Kinetics of adsorption and desorption
Another critical factor determining the practical process development for efficient CO2
capture under realistic conditions is the kinetics of adsorption and desorption. Rapid kinetics
enable fast turnover rate of sorbent, reducing the amount of sorbent needed and the equipment
required for handling.
It is observed that both the adsorption and desorption processes take place rapidly on this
carbon sorbent. In this study, several milligrams of the sorbent were contained in a platinum pan
in a Perkin Elmer TGA 7 thermogravimatric analyzer, and were heated in a stream of Ar (at a
rate of 20 cc/min) to 110 C to remove the adsorbed gases. It was then cooled in Ar to 30 C and
exposed to a gas stream containing various levels of CO2 with balancing Ar. After reaching a
steady state, the sample was heated stepwise to 40, 50, 70, 90, and 110 C and held at each
temperature for 60 min. The mass of the sorbent plus adsorbate was measured at each steady
state. Fig. 4 illustrates the change in the mass of the sorbent when exposed to 1 atm pure CO2
with the above protocol. The mass of the loaded sorbent is represented relative to the initial mass
of the sorbent. The change in the mass was due to the CO2 adsorption and desorption from the
sorbent. Note, the sorbent has some adsorption capacity for Ar, so the initial weight was slightly
higher than 100 %. After the introduction of CO2 gas, a fast weight rise to 107.5 % was
observed. After that, there was a gradual change in the slope, and the increase of weight became
slower and slower, until finally approached a steady state at ~111.5 wt%.
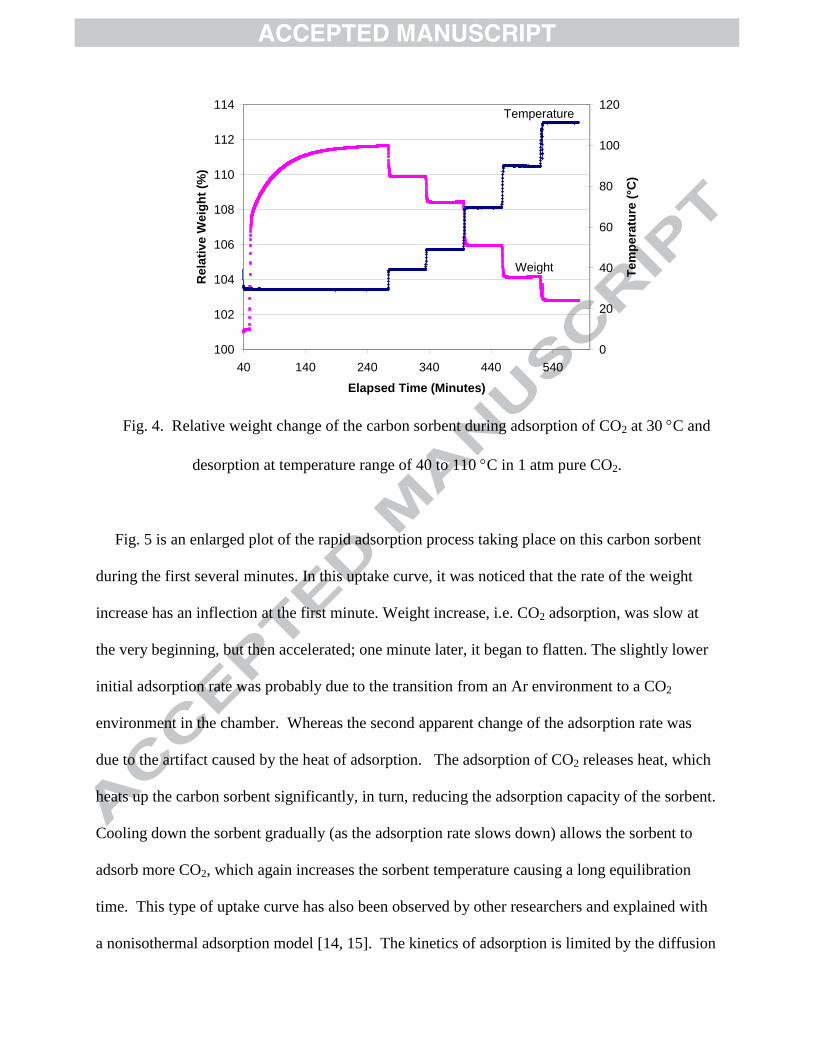
Fig. 4. Relative weight change of the carbon sorbent during adsorption of CO2 at 30 C and
desorption at temperature range of 40 to 110 C in 1 atm pure CO2.
Fig. 5 is an enlarged plot of the rapid adsorption process taking place on this carbon sorbent
during the first several minutes. In this uptake curve, it was noticed that the rate of the weight
increase has an inflection at the first minute. Weight increase, i.e. CO2 adsorption, was slow at
the very beginning, but then accelerated; one minute later, it began to flatten. The slightly lower
initial adsorption rate was probably due to the transition from an Ar environment to a CO2
environment in the chamber. Whereas the second apparent change of the adsorption rate was
due to the artifact caused by the heat of adsorption. The adsorption of CO2 releases heat, which
heats up the carbon sorbent significantly, in turn, reducing the adsorption capacity of the sorbent.
Cooling down the sorbent gradually (as the adsorption rate slows down) allows the sorbent to
adsorb more CO2, which again increases the sorbent temperature causing a long equilibration
time. This type of uptake curve has also been observed by other researchers and explained with
a nonisothermal adsorption model [14, 15]. The kinetics of adsorption is limited by the diffusion
100
102
104
106
108
110
112
114
40 140 240 340 440 540
Elapsed Time (Minutes)
Rela
tive W
eig
ht
(%)
0
20
40
60
80
100
120
Tem
pera
ture
(°C
)
Temperature
Weight

rate of the gas into the pores of the sorbent. The second slope of the curve gives a rough
adsorption rate of ~4.1wt%/min. The kinetics is similar to that of activated carbons [16], and
slightly slower than that of zeolites [17]. However, due to the nonisothermal nature of the
adsorption process, the actual adsorption rate could not be identified with this type of analysis. It
was found that the carbon sorbent became almost saturated within seconds, as will be manifested
in a future paper.
Fig. 5. Relative weight change of the carbon sorbent during the initial several minutes of CO2
adsorption at 30 oC in 1 atm pure CO2.
Fig. 6 shows an enlarged profile of CO2 desorption from the carbon sorbent when the
temperature of the sorbent was stepped up (plotted with the starting point of each temperature
raise at time 0 s). The open symbols represent the loading wt % change, and the filled symbols of
the same color represent the corresponding temperature step. Temperature raise was programmed
in TGA to be at 10 oC/min. The desorption profile looked identical at each temperature step, and

followed closely with the corresponding temperature profile, and quickly reached equilibrium as
the temperature stabilized.
Fig. 6. Desorption of CO2 from the sorbent in pure CO2 at 1 atm as the temperature rises.
It indicates that desorption at this temperature range is rapid and controlled by the temperature
of the sorbent. Thus, controlling the sorbent temperature can easily control the adsorbate loading
on this sorbent in this temperature range, which offers exceptional advantages for the desorption
of the adsorbed CO2 by a rapid temperature swing method. By raising the temperature to 110 oC,
only less than 3 wt% of CO2 remained on the sorbent, even in a pure CO2 stream at 1 atm.
Because of its high thermal conductivity at 0.8 W/K-m, the microbeads can be assumed to be
isothermal at any stage. Moreover, because of its low heat capacity at around 1 J/g-K, the
104
105
106
107
108
109
110
111
112
20
30
40
50
60
70
80
90
100
0 20 40 60 80 100 120 140 160
Data 2
Weight % 30-40oC
Weight % 40-50oC
Weight % 70-90oC
30-40oC
40-50oC
70-90oC
Re
lative W
eig
ht %
Tem
pera
ture
(oC
)
Time (s)

temperature of the sorbent can be efficiently altered by an external heat supply or removal (i.e.
raising the temperature from 30 oC to 110
oC only needs 80 J/g).
Similar experiments with CO2 partial pressures from 15 % to 75 % with balancing Ar were
also carried out on this sorbent, and similar behavior were observed. At a temperature of 112 oC,
only less than 1 wt% and 0.5 wt% CO2 remained on the sorbent at 25 % and 15 % CO2 partial
pressures, respectively. Therefore, by swinging the temperature of the sorbent rapidly, CO2
could be captured and stripped away easily, even in a pure CO2 stream as demonstrated above.
3.4 Heats of adsorption and desorption
Heats of adsorption and desorption are determined by the strength of the attractive force
between the adsorbent and the adsorbate. Since the major cost in CO2 capture is regeneration of
the sorbent by removing the adsorbate, the choice of a potential adsorbent for CO2 capture
should avoid chemical bonding between each other so that the adsorbed CO2 molecules could be
easily removed with lower desorption energy.
For systems involving weak interaction and reversible adsorption and desorption processes,
the heat of adsorption could be effectively calculated from the slopes of isosteres (constant
adsorbate coverage as a function of temperature and partial pressure) at various gas coverages
according to Clausius-Clapeyron equation [18]:
D(lnP)/d(1/T) = -ΔHads/R (1)
where ΔHads is the isosteric heat of adsorption, R is the gas constant, T is the temperature, and P
is the equilibrium partial pressure of CO2 adsorbed. The isosteres were calculated at various
coverages from the adsorption isotherms shown in Fig. 2, and were straight lines at each

adsorption extent (not shown here), suggesting that the adsorption of CO2 molecules on this
carbon sorbent can be represented by the Langmuir equation, which implies that there is no
interaction between adsorbate molecules within this coverage range.
Fig. 7. The heat of adsorption of CO2 on carbon sorbent as a function of CO2 loading.
The heat of adsorption, calculated from the slopes of the isosteres, is shown in Fig. 7 as a
function of the extent of CO2 coverage. The data implies that the heat of adsorption was higher at
low coverage (around 28 kJ/mol, or 290 meV for bond energy, indicative of a physisorption ),
but it decreased with increasing coverage and finally approached the reported latent heat of
vaporization of CO2 at high coverages (around 25.7 kJ/mol). The binding energy is in the lower
end of that for zeolites and metal organic framework sorbents, suggesting that the binding is not
as strong as in the latter cases, and the energy penalty to break the attraction bond (for
regeneration) will be much less (despite a similar loading capacity). The reason that the heat of
adsorption decreased with increasing coverage is due to the progressive covering of the
20
21
22
23
24
25
26
27
28
29
30
0 10 20 30 40 50 60 70
Quantity of CO2 Adsorbed (cm3/g)
Heat
of
Ad
so
rpti
on
(kJ/m
ol)
Latent Heat of Vaporization of CO2

thermodynamically favorable sites, such that the most favorable sites are filled first, followed by
the remaining sites. Comparing to the current bench mark technology, the obtained heat of
adsorption is significantly less than the heats of adsorption of CO2 on primary amines such as
monoethanolamine (MEA), which is around 80 kJ/mol (or ~830 meV for bond energy),
indicative of a chemical bond.
For reversible adsorption and desorption processes involving a weak system, the use of
Clausius-Clapeyron law is efficient and accurate for determining the heat of adsorption, and the
heat of desorption (or desorption activation energy) is considered roughly equal to the heat of
adsorption. This is also confirmed by the temperature programmed desorption experiments at a
series of CO2 partial pressures discussed previously. The heat of desorption, calculated from the
slopes of isosteres of CO2 desorption at various coverages, varied from 24.2 to 28.7 kJ/mol, with
an average of 27 kJ/mol. The data is somewhat scattered with no clear trend such as that
observed for the heat of adsorption, possibly due to the fact that the TGA technique is not as
precise as the BET technique and the temperature is not directly measured at the carbon sorbent.
However, the near similar values obtained with both techniques indicates that the adsorption and
desorption heats are roughly the same, as representative of a reversible and weak system.
3.5 Adsorption of other gases on the carbon sorbent
Flue gas emitted from pulverized-coal-fired boilers typically contains O2, N2, Ar, H2O vapor,
SOx and NOx. The last two acidic gases are usually removed by the flue gas desulfurization
(FGD) process and only trace amounts are left. However, they may still degrade the sorbent
performance over the long term, thus the adsorption characteristics of all of these gases on this
novel carbon sorbent also needed to be determined. The equilibrium amount of O2, N2, Ar, and
H2O vapor adsorbed on the sorbent as a function of temperature and partial pressure is an

important process parameter that provides information regarding CO2 uptake by the sorbent as a
function of process variables. Similarly, the adsorption isotherms of these gases were
determined in the targeted capture temperature range of 5 to 25 C. The isosteric heats of
adsorption were then calculated from these adsorption isotherms.
Fig. 8. The adsorption isotherms of N2 on the carbon sorbent at temperatures from 5 to 25 oC.
Fig. 8 illustrates the N2 adsorption isotherm from 5 to 25 C. It was observed that the quantity
of N2 adsorbed increased with the pressure of N2 in a trend similar to but slower than CO2
adsorption in this pressure range. Note that the quantity of N2 adsorbed is less than 1/6 of the
amount of CO2 adsorbed at the same temperature and pressure.
Similar results were also obtained with O2. The isotherms looked almost identical to that of
N2, and the loading capacity was also very close. In a flue gas stream, the amount of O2 that
will be adsorbed on the sorbent will be relatively small because the O2 partial pressure in the flue
gas is only 0.05 atm [19].
0
2
4
6
8
10
12
14
16
18
0 0.2 0.4 0.6 0.8 1 1.2
Pressure (atm)
Vo
lum
e o
f N
2 a
ds
orb
ed
(c
m3/g
)
5°C
15°C
20°C
25°C
10°C
Although Ar gas is present in the flue gas at a partial pressure less than 0.01 atm, it is
interesting to find that a noble gas like Ar also has a loading capacity similar to N2 and O2
between 5 and 25 oC. This similarity may be due to the fact that the adsorption isotherms of
these nonpolar gases were obtained at a temperature far greater than their boiling points or triple
points. The boiling point of Ar is -186 C, which is only 10 C higher than that of N2. At near
ambient conditions, N2, O2, and Ar appear to physisorb on the micropores of the carbon sorbent
by a similar mechanism.
Extrapolating the isotherm curve to the Henry’s Law region allows us to get the Henry’s Law
constant, and the Henry’s Law selectivity of this carbon sorbent for CO2 over other gases could
also be calculated. At a typical capture temperature of 20 oC, this carbon sorbent has a
selectivity of 18.9, 22.2, and 21.8 over N2, O2, and Ar, respectively. A typical flue gas stream
contains 15 % CO2, and the partial pressure of N2 is around 0.66 atm [19].
The significantly lower adsorption capacity of this carbon sorbent for N2, O2, and Ar
tcompared to CO2 is not unexpected because CO2 has much higher boiling point and triple point
(-56.6 oC, more than 100
oC higher than for the other gases), which implies that it is much easier
to freeze one degree of freedom (translational) with CO2 molecules at the surface (physisorption
bond). It is also true that CO2 molecules adsorb more strongly than N2 or O2 molecules on
carbon sorbents, possibly due to its polar groups (although they are all nonpolar gases, each CO2
molecule has two large non-shared (sp2) orbitals at the two terminal O atoms with their dipole
moments canceling each other so the net dipole is zero). This also implies that the heats of
adsorption/desorption for these gases will be much smaller than that of CO2, as the heat of
adsorption/desorption is a measure of the strength of attraction between the adsorbate and
adsorbent, as shown in Fig. 9. As expected, the heats of adsorption for these gases are much

smaller than that for CO2 (roughly half of the heat of adsorption for CO2), and relatively constant
in the coverage range tested. These results would serve as important information for CO2
capture system design and modeling.
Fig. 9. Heats of adsorption of N2, O2, and Ar on the carbon sorbent as a function of coverage.
Another important gas, H2O vapor is present in the flue gas at near saturation as the flue gas
leaves the wet flue gas desulfurization unit (near 100 % humidity). Unlike the nonpolar gases
discussed above, water molecules are polar and have a net dipole moment of 1.84 Debye, thus,
their interaction with the carbon sorbent may be substantially different than the interaction of the
other gases with the carbon. Furthermore, if a process uses steam as a stripping gas to strip CO2
away from the sorbent (such as the MEA process), it is vital to have the knowledge of the heat of
adsorption and desorption for H2O vapor, so that the interaction between CO2 molecules and
H2O molecules as well as its effect on the performance of carbon sorbent could be better
understood. Fig. 10 illustrates the adsorption isotherms of H2O vapor on the sorbent in the
10
11
12
13
14
15
16
17
18
19
20
0 2 4 6 8 10 12
Volume of Gas Adsorbed (cm3/g)
Heat
of
Ad
so
rpti
on
(kJ/m
ole
)
N2
O2
Ar

temperature range of 5 to 25 °C, plotted as the volume of moisture adsorbed as a function of
relative pressure, P/Po, where Po is the saturation water vapor pressure at that temperature. The
ratio P/P0 is also referred to as relative humidity (RH). The quantity of moisture adsorbed
increases with the relative pressure at a constant temperature, but it decreases with increasing
temperature at a constant absolute pressure. Note, when plotted against relative pressure, the
data point at low relative pressures overlaps. However, the saturated water vapor pressure
increases exponentially with temperature (at 0 oC, it is 0.6 kPa, and at 100
oC, it is 101.3 kPa).
At RH greater than ~0.3, liquid condensation occurs, and the amount of water adsorbed on the
sorbent quickly increases. The walls of the <10 Ǻ micropores inside the sorbent provides a
suitable surface for condensation at a lower temperature than the boiling point of water.
The flue gas is usually saturated with H2O vapor. If the high humidity flue gas stream
entering the adsorption system has a high temperature, then the amount of water vapor in the gas
stream is also relatively high, this could decrease the CO2 loading capacity for this sorbent.
Therefore, it is suggested that the temperature of the flue gas be kept low so that the CO2 loading
is higher, and also the effect of water vapor is much less. In a separate study using a fixed bed
reactor, it was found that the CO2 loading capacity of the carbon sorbent at 25 oC and 15 % CO2
decreased from 23 cc/g at 0 % RH to 20.6 cc/g at 40 % RH, and further down to 19 cc/g at 80 %
RH. Yet, this performance is significantly better than the hydrostability of other types of solid
sorbents whose adsorption/absorption capacity rapidly deteriorate with the presence of even
small amount of moisture [5]. The reason for the relatively low sensitivity of this carbon sorbent
to humidity may be related to the low heat of adsorption for H2O vapor, as shown in Fig. 11
(calculated from the adsorption isotherms).

Fig. 10. The quantity of H2O vapor adsorbed on the carbon sorbent as a function of the
relative pressure at various temperatures.
Fig. 11. The heat of adsorption of water vapor on carbon sorbent as a function of its loading.
Interestingly, the heat of adsorption was relatively low at low coverages (~35 kJ/mol) and it
increased as the coverage or the amount of water vapor adsorbed increased. At moisture
0
50
100
150
200
250
300
0 0.1 0.2 0.3 0.4 0.5 0.6
Relative Pressure (P/P0)
Vo
lum
e o
f H
2O
Vap
or
Ad
so
rbed
(cm
3/g
)
5°C
10°C
15°C
20°C
30°C
0
5
10
15
20
25
30
35
40
45
50
0 50 100 150 200 250
Volume of H2O Vapor Adsorbed (cm3/g)
He
at
of
Ad
so
rpti
on
(k
J/m
ole
)

loadings greater than 40 cm3/g, the heat of adsorption reached a constant value close to the heat
of vaporization of water (~45 kJ/mole). The decrease in the value of the heat of adsorption at
low coverages indicates that the surface is likely to be hydrophobic, whereas at higher coverages,
liquid condensation occurs in the micropores. The similarity in the heats of adsorption and
vaporization indicates that water vapor is adsorbing on the liquid surface that is condensed inside
the micropores.
The flue gas stream exiting from a pulverized-coal-fired boiler usually contains impurities
such as SO2 and NO. After passing through a desulfurization unit, the concentration of the SO2
in the flue gas is expected to drop to less than 10 ppm (<0.01 torr). The SO2 adsorption
characteristics of this carbon sorbent were also studied using the BET surface and density
analyzer, but at partial pressures much higher than the practical concentration in a flue gas
stream, due to the limitations with the pressure gauge. The result suggests that SO2 is captured
on this carbon sorbent, and the capacity decreases with increasing temperature. However, the
attraction between SO2 and the carbon sorbent was so strong (as it is an acidic polar gas), that the
desorption rate was extremely slow, so that not much desorption occurred when the temperature
of the sorbent was raised until at a certain temperature. Thus, the adsorption data we obtained do
not represent equilibrium loading and are thus not shown here.
Similar behaviors were observed with NO. The strong adsorption of SO2 and NO on the
carbon sorbent indicates that the amount of SO2 and NO adsorbed may accumulate gradually if
the sorbent is not heated to a high enough temperature to completely desorb these impurity gases,
and the sorbent could be potentially poisoned. The desorption characteristics of these two
impurity gases need to be further studied.

3.6 Surface functional groups identification
The presence of basic sites on the surface of the sorbent can facilitate the adsorption of CO2,
because CO2 is considered acidic in nature. The number of surface acid sites of various types
was calculated under the assumption that NaOH neutralizes carboxylic, phenolic, and lactonic
groups, whereas Na2CO3 neutralizes only carboxylic and lactonic groups. The number of surface
base sites was calculated from the amount of HCl that reacted with the carbon sorbent. The
results are tabulated in Table 2 (the number represents the amount of NaOH/HCl used). These
results suggest that the surface of the carbon sorbent contains small amounts of both acidic and
basic functional groups. The observed low heat of adsorption for CO2 on the carbon surface (25-
28 kJ/mol) may be due to the fact that the surface does not contain significant amount of strong
basic sites (thus no strong bonds form with CO2 and not much of an electronic structure change
is induced) and CO2 molecules adsorb primarily as physisorption on neutral sites. Even if all the
basic functional groups are chemisorbed with CO2, the loading would only be 7 cm3/g, much less
than the loading capacity we have obtained previously (at 1 atm and 5 oC, the loading is over 100
cm3/g).
Table 2. Surface Functionalities of the Carbon Sorbent
Parameter Value
Surface pH 6.7
Basic Groups (mmol/g) 0.3
Carboxyl Groups (mmol/g) <0.01
Lactone Groups (mmol/g) 0.3
Phenol Groups (mmol/g) 0.05

4. Conclusions
In this work, the exceptional gas adsorption and desorption characteristics of an advanced
carbon sorbent (BrightBlackTM
) have been discussed. The carbon sorbent was manufactured by
ATMI. Inc. through a proprietary PVDC pyrolysis process, with its porosity tuned to maximize
CO2 capture at ambient temperatures and pressure. It has an adsorption capacity of 20 wt% at a
temperature of 5 oC and a pressure of 1 atm CO2, and a capacity near 7.8 wt% at 0.15 atm
pressure. It also has high selectivity for CO2 over other gases in a flue gas stream, such as N2, O2,
and Ar (around 15 at low pressures). The loading capacity is one of the highest among all solid
sorbent at ambient temperature. The heat of adsorption for CO2 gas decreased from ~28 kJ/mol
at low coverage to ~25.7 kJ/mol at high coverages, whereas the heats of adsorption for N2, O2,
and Ar are very close and in a narrow range –between 16 and 17 kJ/mol. The adsorption
isotherms and heats of adsorption indicate that these gases are physisorbed on this carbon sorbent.
Both adsorption and desorption take place rapidly in the temperature range tested. The
significantly lower heat of adsorption/desorption than that for amines determines that the amount
of steam required to regenerate the carbon sorbent will also be significantly less, which could
substantially reduce the capital and operating costs. H2O vapor adsorption characteristics were
also carried out and it is found that condensation occurred above 30% of the saturated water
vapor pressure at each temperature. BrightBlackTM
advanced carbon sorbent, with its high
thermal conductivity, low heat capacity, high durability, and high physisorption capacity for CO2,
is an excellent material for post-combustion CO2 capture.
Acknowledgement
This material is based upon work supported by the Department of Energy, National Energy
Technology Laboratory under Award Number DE-NT0005578. The authors would like to thank

ATMI, Inc. for the cost share. We also acknowledge the technical directions by Mr. Andrew
O’Palko, the DOE’s program manager.
Disclaimer
This report was prepared as an account of work sponsored by an agency of the United States
Government. Neither the United States Government nor any agency thereof, nor any of their
employees, makes any warranty, express or implied, or assumes any legal liability or
responsibility for the accuracy, completeness, or usefulness of any information, apparatus,
product, or process disclosed, or represents that its use would not infringe privately owned
rights. Reference herein to any specific commercial product, process, or service by trade name,
trademark, manufacturer, or otherwise does not necessarily constitute or imply its endorsement,
recommendation, or favoring by the United States Government or any agency thereof. The
views and opinions of authors expressed herein do not necessarily state or reflect those of the
United States Government or any agency thereof.
References
[1] Carapellucci R, Milazzo A. 2003. Membrane systems for CO2 capture and their integration
with gas turbine plants. Proceedings of the institution of Mechanical Engineers Part A:
Journal of Power and Energy, 2003; 217: 505-517.
[2] Stewart C, Hessami M. A study of methods of carbon dioxide capture and sequestration—
the sustainability of a photosynthetic bioreactor approach. Energy Conversion and
Management 2005; 46: 403-420.

[3] Wang M, Lawal A, Stephenson P, Sidders J, Ramshaw C. Post-combustion CO2 capture
with chemical absorption: A state-of-the-art review. chemical engineering research and
design 2011; 89:1609–1624.
[4] Krishnan G, Hornbostel DM, Bao J. Development Novel Carbon Sorbent for Carbon
Dioxide Capture, Annual technical progress report to DOE, Agreement No: DE-NT0005578,
2011.
[5] Choi S, Drese JH, Jones CW. Adsorbent Materials for Carbon Dioxide Capture from Large
Anthropogenic Point Sources. ChemSusChem 2009; 2: 796-854.
[6] Yang H, Xu Z, Fan M, Gupta R, Slimane RB, Bland AE, Wright I. Progress in carbon
dioxide separatin and capture: A review. J. Environ. Sci. 2008; 20: 14-27.
[7] Figuerioa JD, Fout T, Plasynski S, McIlvried H, Srivastava RD. Advances in CO2 capture
technology –The U.S. Department of Energy’s carbon sequestration program. Intern. J.
Greenhouse Gas Control 2008; 2: 9-20.
[8] Pires JCM, Martins FG, Alvim-Ferraz A, Simoes M. Recent developments on carbon
capture and storage: An overview. Chem. Eng. Res. Design 2011; 89: 1446-1460.[9] Xiong
RT, Ida J, Lin YS. Kinetics of Carbon Dioxide Sorption on Potassium‐doped Lithium
Zirconate. Chem. Eng. Sci. 2003; 58: 4377-4385.
[10] Carruthers JD, Petruska MA, Sturm EA, Wilson SM. Molecular sieve carbons for CO2
capture. Microp. Mesop. Mater. 2012; 154: 62-67.
[11] Boehm HP, Diehl E, Heck W, and Sappok R. Surface Oxides of Carbon. Angew. Chem. Int.
1964; Engl. v3: 669-677.

[12] Jorda-Beneyto M, Lozano-Castello D, Suarez-Garcia F, Cazorla-Amoros D, Linares-Solano
A, Advanced Activated Carbon Monoliths and Activated Carbons for Hydrogen Storage.
Microp. Mesop. Mat. 2008; 112: 235-242.
[13] Walker, Jr. PL, Patel RL. Surface areas of coals from carbon dioxide adsorption at 298 K.
Fuel 1970; 49: 91-94.
[14] Yucel H, Ruthven DM. Diffusion of CO2 in 4A and 5A Zeolite Crystals. J. Colloid
Interface Sci. 1980; 74: 186-195.
[15] Ruthven DM, Lee LK, Yucel H. Kinetics of non-isothermal sorption in Molecular Sieve
Crystals. AlChE J. 1980; 26:16-23.
[16] Ding LP, Bhatia SK, Liu F. Kinetics of Adsorption on Activated Carbon: Application of
Heterogeneous Vacancy Solution Theory. Chem. Eng. Sci. 2002; 57:3909-3928.
[17] Hernandez-Huesca R, Diaz L, Aguilar-Armenta G. Adsorption Equilibria and Kinetics of
CO2, CH4 and N2 in Natural Zeolites. Sep. Purif. Technol. 1999; 15:163-173.
[18] Ruthven DM. Principles of Adsorption and Adsorption Processes; John Wiley & Sons: New
York; 1984.
[19] Klara J. Cost and Performance Baseline for Fossil Energy Plants, Volume 1: Bituminous
Coal and Natural Gas to Electricity Final Report. DOE/NETL-2007/1281, Revision 1, 2007.


