1 Presented by: In association with: ETC Institute Leisure Vision Nationally Recognized….Uniquely...
81
1 Presented by: In association with: ETC Institute Leisure Vision Nationally Recognized….Uniquely Local March 2008
-
Upload
katrina-goodman -
Category
Documents
-
view
214 -
download
0
Transcript of 1 Presented by: In association with: ETC Institute Leisure Vision Nationally Recognized….Uniquely...
1
Presented by: In association with:ETC InstituteLeisure Vision
Nationally Recognized….Uniquely Local
March 2008
2
Connecting people to opportunities and places within Mecklenburg County Parks and Recreation Services Three Key Themes:
▪ Conservation and Stewardship▪ Parks and Greenways▪ Recreation Programs and Facilities
3
Seek community input to guide Department direction
Update Nature Preserves Plan Update Greenways Plan Identify GAPS in parks and recreation facilities
across the County and in Towns Identify remaining pieces of land that could be
acquired for park and nature preserves Establish what to do with “land banked” properties
4
Development of a Program Plan for the Department to implement
Establish park, facility and amenity standards and needs across the County
Establish a Capital Improvement Plan for existing assets, new parks, recreation facilities, and land
Coordinate the needs of Towns in the County with the MCPR Master Plan as one plan
5
Focus groups, stakeholder interviews, household survey
Analysis of existing master planning documents Greenprinting process to identify available land and
gaps based on a weighted criteria built on community values for natural areas, neighborhood parks, community parks, and regional parks

6
7
Mecklenburg County Citizen Survey
Questions on full range of usage, customer satisfaction, needs, unmet needs, and priorities questions
Goal of 1,000 completed surveys.
Actually completed 1033 surveys. Results have 95% level of confidence with margin of error of +/-3%
8
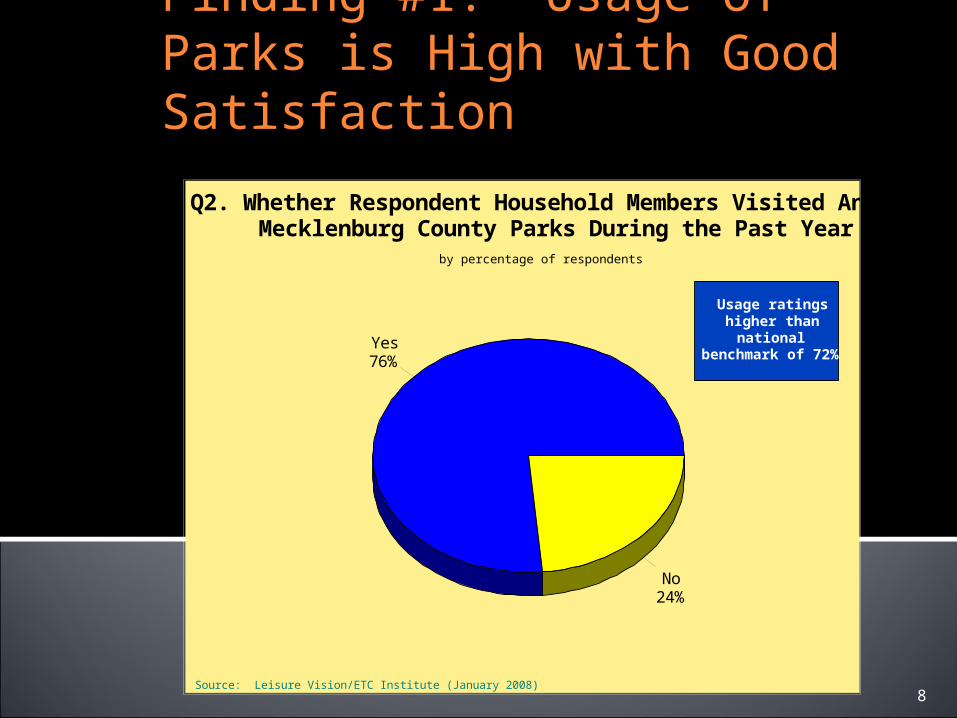
Finding #1: Usage of Parks is High with Good Satisfaction
Yes76%
No24%
Q2. Whether Respondent Household Members Visited Any of Mecklenburg County Parks During the Past Year
by percentage of respondents
Source: Leisure Vision/ETC Institute (January 2008)
Usage ratings higher than
national benchmark of 72%
9
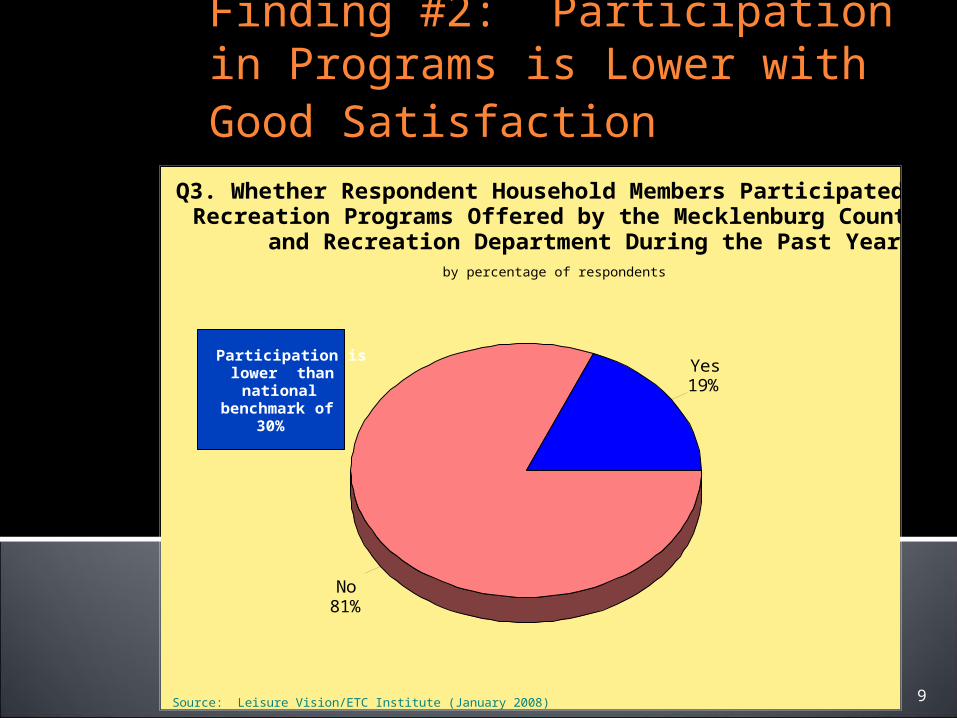
Finding #2: Participation in Programs is Lower with Good Satisfaction
Yes19%
No81%
Q3. Whether Respondent Household Members Participated in any Recreation Programs Offered by the Mecklenburg County Park
and Recreation Department During the Past Yearby percentage of respondents
Source: Leisure Vision/ETC Institute (January 2008)
Participation is lower than
national benchmark of
30%
10
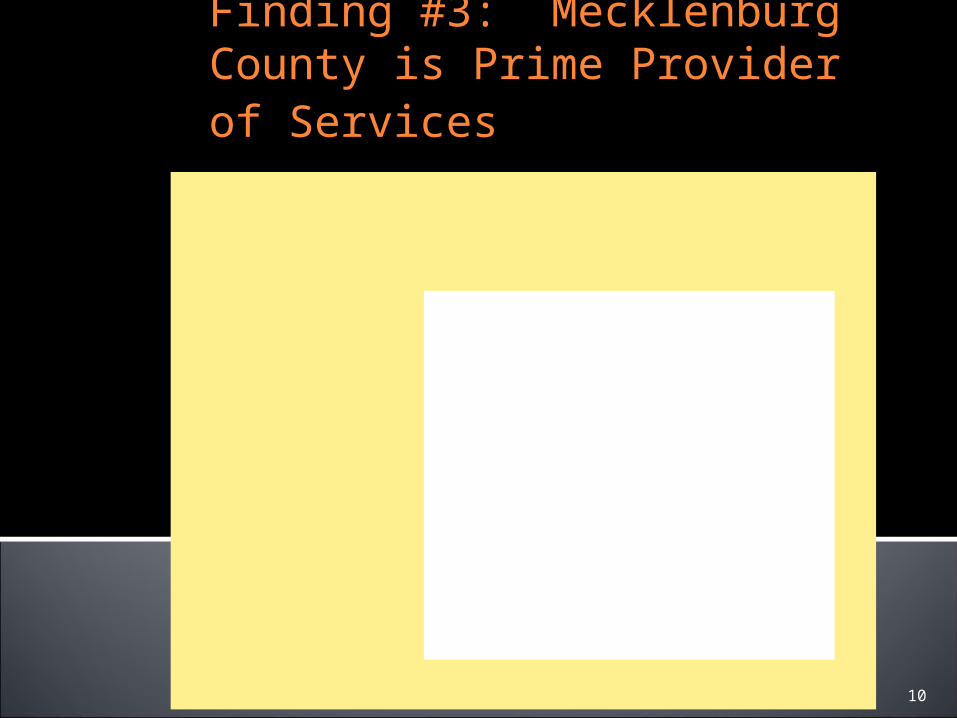
Finding #3: Mecklenburg County is Prime Provider of Services
56%
37%
36%
29%
27%
24%
23%
23%
12%
3%
4%
15%
Mecklenburg County parks
YMCA
Churches
North Carolina State parks
Private clubs
Homeowners assoc/apt. complex
School District facilities
Parks and recreation facilities in class
Private youth sports leagues
Boys and Girls Club
Other
None - don't use any organizations
0% 20% 40% 60%
Q15. Organizations Respondent Households Have Used for Indoor and Outdoor Recreation and Sports Activities
During the Past 12 Monthsby percentage of respondents (multiple choices could be made)
Source: Leisure Vision/ETC Institute (January 2008)
Mecklenburg County highest
priority in households with
children and households
without children
11
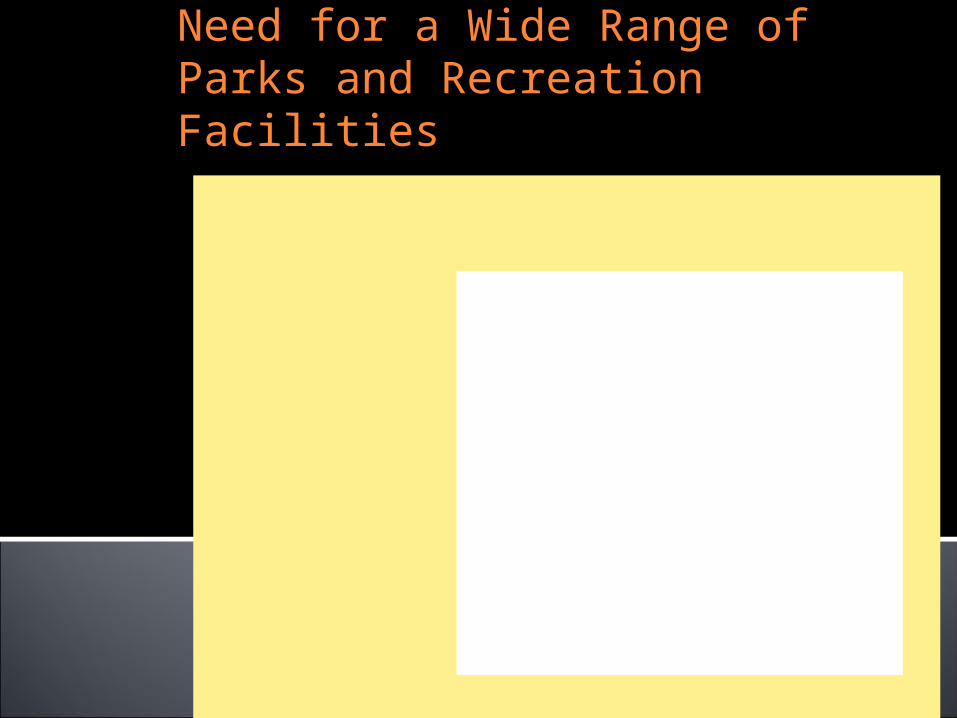
Finding #6: Residents Have a Need for a Wide Range of Parks and Recreation Facilities
76%64%
62%62%
60%50%
44%43%
42%41%
40%40%
39%37%
36%32%32%32%
28%27%26%26%
25%24%24%
16%15%
6%
Walking and biking trailsLarge community parks and district parks
Small (2-10 acres) neighborhood parksNature center and trails
Park shelters and picnic areas Playground equipment and play areas
Indoor fitness and exercise facilitiesOutdoor tennis courts
Outdoor swimming and spraygroundsCommunity gardens
Indoor swimming pools/leisure poolOutdoor amphitheaters
Indoor running/walking trackSmall (less than 2 acres) pocket parks
Mountain bike trailsYouth/teen baseball and softball fields
Youth/teen soccer fieldsOutdoor basketball courts
Indoor sheltersYouth/teen football fields
Golf coursesIndoor basketball/volleyball courts
Off-leash dog park Boating and sailing areas/sailing center
Adult softball fieldsAdult soccer fields
Skateboard ParkSoapbox Derby track
0% 20% 40% 60% 80%
Q10. Respondent Households That Have a Need for Various Parks and Recreation Facilities
by percentage of respondents (multiple choices could be made)
Source: Leisure Vision/ETC Institute (January 2008)
The needs for a number of
facilities is higher than the National
Benchmarking Average
12
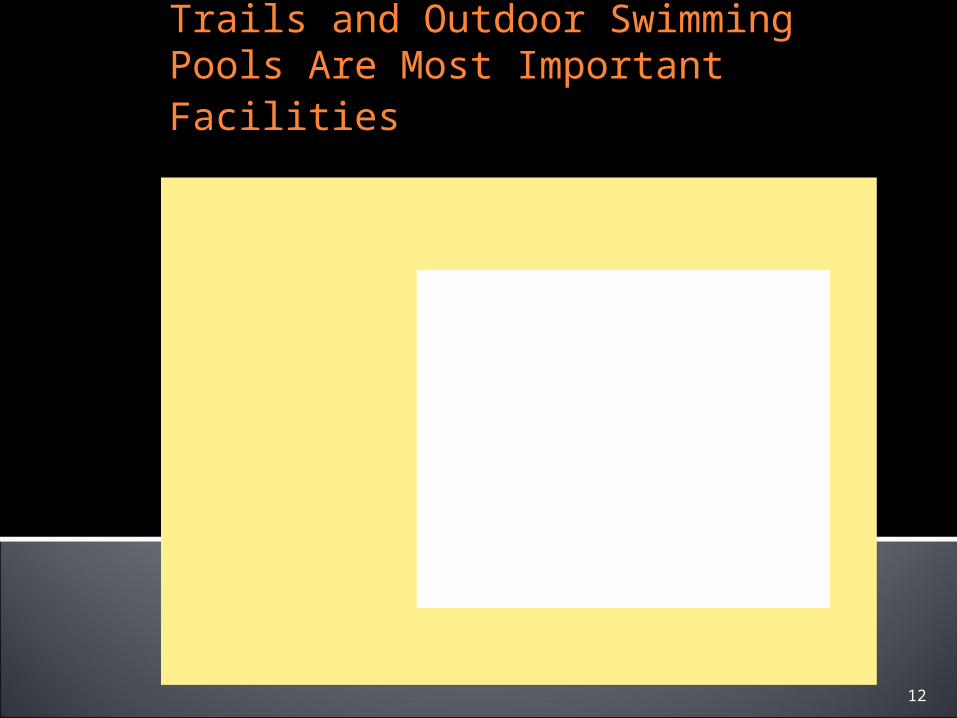
Finding #8: Walking and Biking Trails and Outdoor Swimming Pools Are Most Important Facilities
44%26%
23%18%18%
14%14%
13%12%
11%11%11%
10%10%
9%9%
7%7%
6%6%6%
5%4%
3%3%3%
2%1%
Walking and biking trailsSmall (2-10 acres) neighborhood parks
Large community parks and district parksNature center and trails
Playground equipment and play areas Indoor fitness and exercise facilitiesIndoor swimming pools/leisure pool
Park shelters and picnic areas Off-leash dog park
Outdoor swimming and spraygroundsIndoor running/walking track
Outdoor tennis courtsSmall (less than 2 acres) pocket parks
Community gardensMountain bike trails
Golf coursesOutdoor amphitheaters Youth/teen soccer fields
Youth/teen baseball and softball fieldsBoating and sailing areas/sailing center
Outdoor basketball courtsIndoor basketball/volleyball courts
Indoor sheltersYouth/teen football fields
Adult softball fieldsAdult soccer fields
Skateboard ParkSoapbox Derby track
0% 10% 20% 30% 40% 50%
Most Important 2nd Most Important 3rd Most Important 4th Most Important
Q11. Parks and Recreation Facilities That Are Most Important to Respondent Households
Source: Leisure Vision/ETC Institute (January 2008)
by percentage of respondents who selected the item as one of their top four choices
Blue line represents intensity of importance
Blue line represents intensity of importance
All 4 colors represents depth of
importance

13
Finding #9: Respondents Have a Need for a Wide Range of Programs
Source: Leisure Vision/ETC Institute (January 2008)
50%49%
39%37%
33%31%
30%29%
28%28%
26%25%
25%23%
22%22%
21%20%20%
20%17%17%
Special events/festivals
Adult fitness and wellness programs
Family Recreation/Outdoor Adventure programs
Nature Education programs
Education/Life skills programs
Water fitness programs
Adult sports programs
Tennis lessons, clinics and leagues
Youth/teen sports programs
Youth Learn to Swim programs
Adult art, dance, performing arts
Senior programs
Youth/teen summer camp programs
Adult swim programs
Youth/teen art, dance, performing arts
Youth/teen fitness and wellness programs
Golf lessons
Before and after school programs
Martial arts programs
Pre-School programs
Gymnastics and tumbling programs
Programs for people with disabilities
0% 20% 40% 60%
by percentage of respondents (multiple choices could be made)
Q12. Respondent Households That Have a Need for Various Recreation Programs
Respondent Households Have a Need for a Wide
Range of Programs

14
Finding #13: 50% of Respondents Do Not Feel There Are Sufficient Parks and Green Space Areas Within Walking Distance of Their Residence, With 11% Not Sure
Yes 39%
No50%
Not sure11%
Q5. Whether Respondent Feels That There Are Sufficient Parks and Green Space Areas Within Walking Distance of Their Residence
by percentage of respondents
Source: Leisure Vision/ETC Institute (January 2008)
15
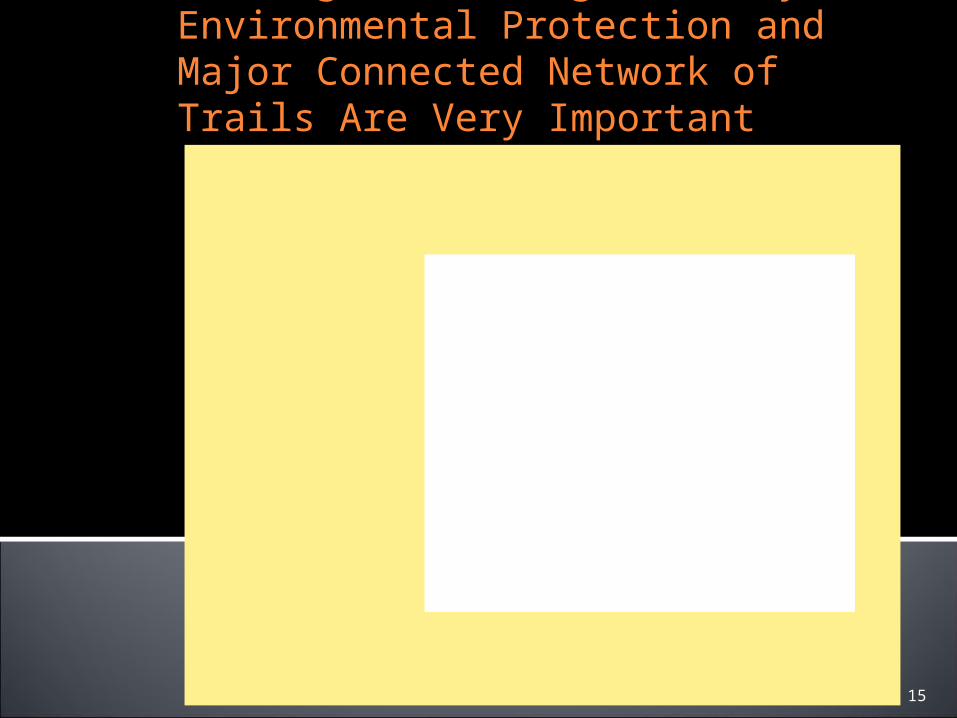
Finding #14: Using Greenways for Environmental Protection and Major Connected Network of Trails Are Very Important
77%
66%
17%
22%
3%
8%
4%
4%
0% 20% 40% 60% 80% 100%
Very Important Somewhat Important Not Important Not Sure
Q7. Importance of Using Mecklenburg County Greenways for Various Purposes
Source: Leisure Vision/ETC Institute (January 2008)
by percentage of respondents
Major connected network of walking, biking and nature trails
Environmental protection
16
Finding #16: Purchase Land to Preserve Open/Green Space, Use Floodplain Greenways to Develop Trails/Facilities, and Develop New &
Connect Existing Walking/Biking Trails Are Most Important Actions
50%
52%
58%
59%
56%
45%
39%
31%
35%
32%
26%
22%
23%
17%
18%
15%
12%
5%
33%
31%
24%
23%
24%
32%
33%
39%
28%
26%
28%
26%
24%
21%
20%
20%
20%
13%
13%
13%
12%
12%
13%
16%
21%
20%
21%
24%
26%
29%
29%
35%
27%
30%
31%
34%
5%
5%
6%
7%
7%
8%
7%
10%
16%
18%
21%
23%
25%
27%
35%
35%
37%
47%
Fix-up/repair older park buildings/recreation ctrs
Upgrade existing neighborhood/community parks
Use floodplain greenways to develop trails/facil
Develop new & connect existing walk/biking trails
Purchase land to preserve open/green space
Develop new nature trails/nature centers
Upgrade existing youth/adult athletic fields
Purchase land to develop athletic fields/rec facil
Develop new indoor recreation centers
Develop special events park for festivals/concerts
Purchase land to protect the environment
Develop new outdoor spray pools
Develop multi-purpose indoor athletic/activity ctr
Develop new fieldhouse at Grandy Cole Center site
Develop new off-leash dog parks
Develop a new 50 meter competitive pool
Develop skate parks
Develop soap box derby
0% 20% 40% 60% 80% 100%
Very Supportive Somewhat Supportive Not Sure Not Supportive
Q16. Level of Support for Various Actions Mecklenburg County Could Take to Improve the Parks,
Recreation and Green Space System
Source: Leisure Vision/ETC Institute (January 2008)
by percentage of respondents

17
Finding #16: Purchase Land to Preserve Open/Green Space, Use Floodplain Greenways to Develop Trails/Facilities, and Develop New &
Connect Existing Walking/Biking Trails Are Most Important Actions
44%34%34%
28%25%
22%18%17%
17%13%
12%10%
9%6%6%5%
4%1%
4%
Purchase land to preserve open/green space
Use floodplain greenways to develop trails/facil
Develop new & connect existing walk/biking trails
Fix-up/repair older park buildings/recreation ctrs
Upgrade existing neighborhood/community parks
Develop new nature trails/nature centers
Develop new indoor recreation centers
Develop special events park for festivals/concerts
Purchase land to protect the environment
Purchase land to develop athletic fields/rec facil
Develop multi-purpose indoor athletic/activity ctr
Upgrade existing youth/adult athletic fields
Develop new off-leash dog parks
Develop new fieldhouse at Grandy Cole Center site
Develop new outdoor spray pools
Develop a new 50 meter competitive pool
Develop skate parks
Develop soap box derby
Other
0% 20% 40% 60%
1st Choice 2nd Choice 3rd Choice 4th Choice
Q17. Actions Respondents Would Be Most Willing to Fund With Their County Tax Dollars
Source: Leisure Vision/ETC Institute (January 2008)
by percentage of respondents who selected it as one of their top four choices
18
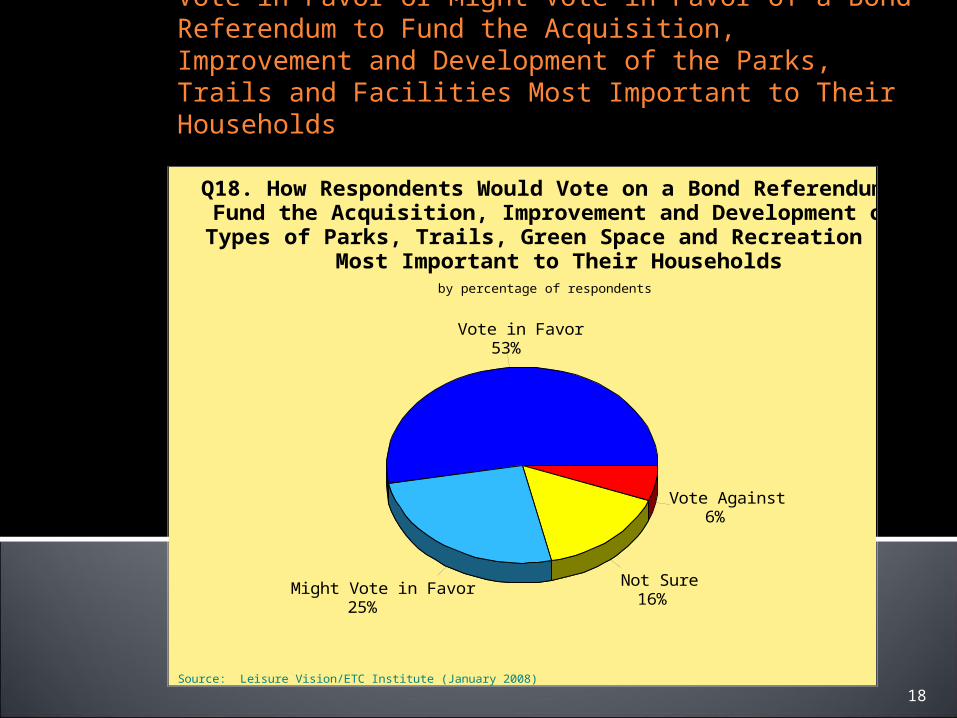
Finding #17: Over 75% of Respondents Would Vote in Favor or Might Vote in Favor of a Bond Referendum to Fund the Acquisition, Improvement and Development of the Parks, Trails and Facilities Most Important to Their Households
Vote in Favor53%
Might Vote in Favor25%
Not Sure16%
Vote Against6%
Q18. How Respondents Would Vote on a Bond Referendum to Fund the Acquisition, Improvement and Development of the
Types of Parks, Trails, Green Space and Recreation Facilities Most Important to Their Households
by percentage of respondents
Source: Leisure Vision/ETC Institute (January 2008)
19
Summary of Overall Findings
Usage of parks is high with good satisfaction Participation in programs is lower with good
satisfaction Mecklenburg County Parks is the prime provider of
services
20
Summary of Overall Findings
Enjoyment of the outdoors and close to our home/residence are prime reasons for usage
Market reach of web site is high with opportunities to improve overall marketing
There is a wide range of needs and unmet needs for outdoor and indoor parks, trails, recreation facilities and programs

21
Summary of Overall Findings
Walking and biking trails are the most important facilities, followed by small neighborhood parks, and large community and regional parks
Special events/festivals and adult fitness and wellness programs are most important programs

22
Summary of Overall Findings
Market opportunities exist to grow programs of high importance at Mecklenburg County facilities
50% of household respondents do not feel there are sufficient parks and green space areas within walking distances of their residence, with 11% not sure
23
Summary of Overall Findings
88% or more of households feel it is important to use Mecklenburg County Greenways for environmental protection and a major connected network of walking, biking and nature trails
24
Summary of Overall Findings
Purchase land to preserve open/green space, use floodplain greenways to develop trails/facilities, and develop new and connect existing walking and biking trails are most important actions respondents would support with tax dollars
25
26
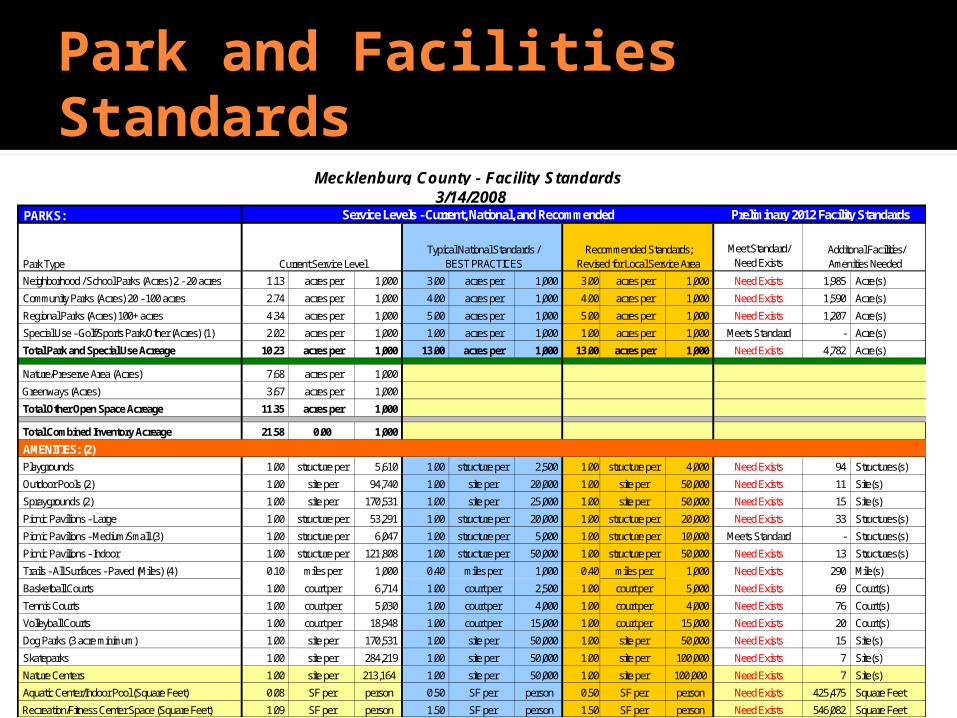
Park and Facilities Standards
PARKS:
Park TypeMeet Standard/
Need Exists
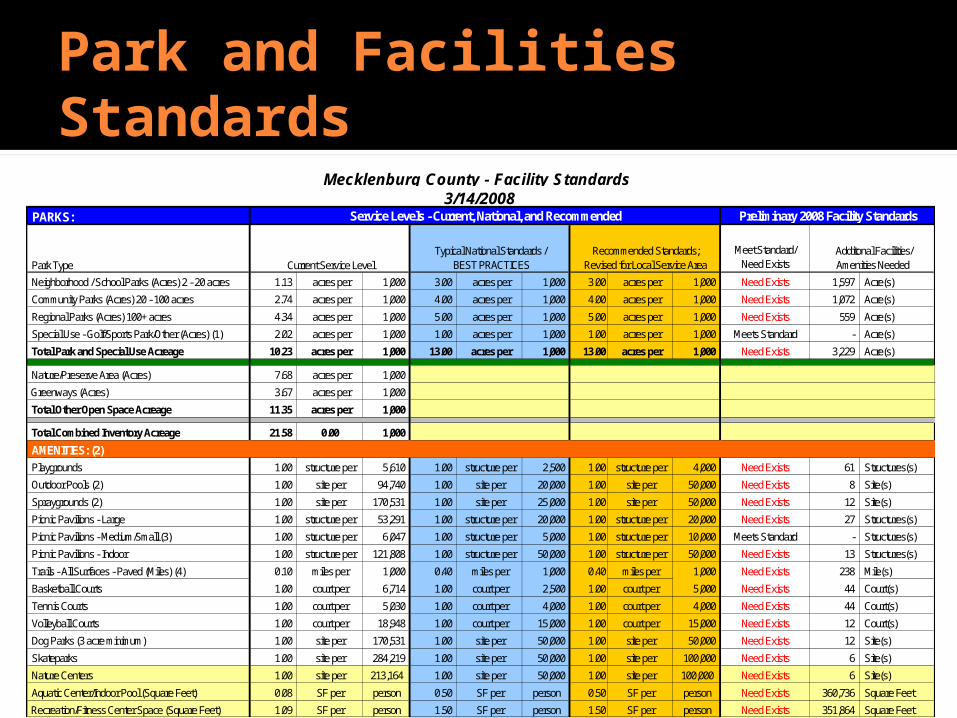
Neighborhood / School Parks (Acres) 2 - 20 acres 1.13 acres per 1,000 3.00 acres per 1,000 3.00 acres per 1,000 Need Exists 1,597 Acre(s)
Community Parks (Acres) 20 - 100 acres 2.74 acres per 1,000 4.00 acres per 1,000 4.00 acres per 1,000 Need Exists 1,072 Acre(s)
Regional Parks (Acres) 100+ acres 4.34 acres per 1,000 5.00 acres per 1,000 5.00 acres per 1,000 Need Exists 559 Acre(s)
Special Use - Golf/Sports Park/Other (Acres) (1) 2.02 acres per 1,000 1.00 acres per 1,000 1.00 acres per 1,000 Meets Standard - Acre(s)
Total Park and Special Use Acreage 10.23 acres per 1,000 13.00 acres per 1,000 13.00 acres per 1,000 Need Exists 3,229 Acre(s)
Nature/Preserve Area (Acres) 7.68 acres per 1,000
Greenways (Acres) 3.67 acres per 1,000
Total Other Open Space Acreage 11.35 acres per 1,000
Total Combined Inventory Acreage 21.58 0.00 1,000
AMENITIES: (2)
Playgrounds 1.00 structure per 5,610 1.00 structure per 2,500 1.00 structure per 4,000 Need Exists 61 Structures(s)
Outdoor Pools (2) 1.00 site per 94,740 1.00 site per 20,000 1.00 site per 50,000 Need Exists 8 Site(s)
Spraygrounds (2) 1.00 site per 170,531 1.00 site per 25,000 1.00 site per 50,000 Need Exists 12 Site(s)
Picnic Pavilions - Large 1.00 structure per 53,291 1.00 structure per 20,000 1.00 structure per 20,000 Need Exists 27 Structures(s)
Picnic Pavilions - Medium/Small (3) 1.00 structure per 6,047 1.00 structure per 5,000 1.00 structure per 10,000 Meets Standard - Structures(s)
Picnic Pavilions - Indoor 1.00 structure per 121,808 1.00 structure per 50,000 1.00 structure per 50,000 Need Exists 13 Structures(s)
Trails - All Surfaces - Paved (Miles) (4) 0.10 miles per 1,000 0.40 miles per 1,000 0.40 miles per 1,000 Need Exists 238 Mile(s)
Basketball Courts 1.00 court per 6,714 1.00 court per 2,500 1.00 court per 5,000 Need Exists 44 Court(s)
Tennis Courts 1.00 court per 5,030 1.00 court per 4,000 1.00 court per 4,000 Need Exists 44 Court(s)
Volleyball Courts 1.00 court per 18,948 1.00 court per 15,000 1.00 court per 15,000 Need Exists 12 Court(s)
Dog Parks (3 acre minimum) 1.00 site per 170,531 1.00 site per 50,000 1.00 site per 50,000 Need Exists 12 Site(s)
Skateparks 1.00 site per 284,219 1.00 site per 50,000 1.00 site per 100,000 Need Exists 6 Site(s)
Nature Centers 1.00 site per 213,164 1.00 site per 50,000 1.00 site per 100,000 Need Exists 6 Site(s)
Aquatic Center/Indoor Pool (Square Feet) 0.08 SF per person 0.50 SF per person 0.50 SF per person Need Exists 360,736 Square Feet
Recreation/Fitness Center Space (Square Feet) 1.09 SF per person 1.50 SF per person 1.50 SF per person Need Exists 351,864 Square Feet
Mecklenburg County - Facility Standards 3/14/2008
Additonal Facilities/Amenities Needed
Service Levels - Current, National, and Recommended Preliminary 2008 Facility Standards
Current Service LevelTypical National Standards /
BEST PRACTICESRecommended Standards;
Revised for Local Service Area
27
Park and Facilities Standards
PARKS:
Park TypeMeet Standard/
Need Exists
Neighborhood / School Parks (Acres) 2 - 20 acres 1.13 acres per 1,000 3.00 acres per 1,000 3.00 acres per 1,000 Need Exists 1,985 Acre(s)
Community Parks (Acres) 20 - 100 acres 2.74 acres per 1,000 4.00 acres per 1,000 4.00 acres per 1,000 Need Exists 1,590 Acre(s)
Regional Parks (Acres) 100+ acres 4.34 acres per 1,000 5.00 acres per 1,000 5.00 acres per 1,000 Need Exists 1,207 Acre(s)
Special Use - Golf/Sports Park/Other (Acres) (1) 2.02 acres per 1,000 1.00 acres per 1,000 1.00 acres per 1,000 Meets Standard - Acre(s)
Total Park and Special Use Acreage 10.23 acres per 1,000 13.00 acres per 1,000 13.00 acres per 1,000 Need Exists 4,782 Acre(s)
Nature/Preserve Area (Acres) 7.68 acres per 1,000
Greenways (Acres) 3.67 acres per 1,000
Total Other Open Space Acreage 11.35 acres per 1,000
Total Combined Inventory Acreage 21.58 0.00 1,000
AMENITIES: (2)
Playgrounds 1.00 structure per 5,610 1.00 structure per 2,500 1.00 structure per 4,000 Need Exists 94 Structures(s)
Outdoor Pools (2) 1.00 site per 94,740 1.00 site per 20,000 1.00 site per 50,000 Need Exists 11 Site(s)
Spraygrounds (2) 1.00 site per 170,531 1.00 site per 25,000 1.00 site per 50,000 Need Exists 15 Site(s)
Picnic Pavilions - Large 1.00 structure per 53,291 1.00 structure per 20,000 1.00 structure per 20,000 Need Exists 33 Structures(s)
Picnic Pavilions - Medium/Small (3) 1.00 structure per 6,047 1.00 structure per 5,000 1.00 structure per 10,000 Meets Standard - Structures(s)
Picnic Pavilions - Indoor 1.00 structure per 121,808 1.00 structure per 50,000 1.00 structure per 50,000 Need Exists 13 Structures(s)
Trails - All Surfaces - Paved (Miles) (4) 0.10 miles per 1,000 0.40 miles per 1,000 0.40 miles per 1,000 Need Exists 290 Mile(s)
Basketball Courts 1.00 court per 6,714 1.00 court per 2,500 1.00 court per 5,000 Need Exists 69 Court(s)
Tennis Courts 1.00 court per 5,030 1.00 court per 4,000 1.00 court per 4,000 Need Exists 76 Court(s)
Volleyball Courts 1.00 court per 18,948 1.00 court per 15,000 1.00 court per 15,000 Need Exists 20 Court(s)
Dog Parks (3 acre minimum) 1.00 site per 170,531 1.00 site per 50,000 1.00 site per 50,000 Need Exists 15 Site(s)
Skateparks 1.00 site per 284,219 1.00 site per 50,000 1.00 site per 100,000 Need Exists 7 Site(s)
Nature Centers 1.00 site per 213,164 1.00 site per 50,000 1.00 site per 100,000 Need Exists 7 Site(s)
Aquatic Center/Indoor Pool (Square Feet) 0.08 SF per person 0.50 SF per person 0.50 SF per person Need Exists 425,475 Square Feet
Recreation/Fitness Center Space (Square Feet) 1.09 SF per person 1.50 SF per person 1.50 SF per person Need Exists 546,082 Square Feet
Preliminary 2012 Facility Standards
Current Service LevelTypical National Standards /
BEST PRACTICESRecommended Standards;
Revised for Local Service Area
Mecklenburg County - Facility Standards 3/14/2008
Service Levels - Current, National, and Recommended
Additonal Facilities/Amenities Needed

28
Park and Facilities Standards
PARKS:
Park TypeMeet Standard/
Need Exists
Neighborhood / School Parks (Acres) 2 - 20 acres 1.13 acres per 1,000 3.00 acres per 1,000 3.00 acres per 1,000 Need Exists 2,332 Acre(s)
Community Parks (Acres) 20 - 100 acres 2.74 acres per 1,000 4.00 acres per 1,000 4.00 acres per 1,000 Need Exists 2,053 Acre(s)
Regional Parks (Acres) 100+ acres 4.34 acres per 1,000 5.00 acres per 1,000 5.00 acres per 1,000 Need Exists 1,785 Acre(s)
Special Use - Golf/Sports Park/Other (Acres) (1) 2.02 acres per 1,000 1.00 acres per 1,000 1.00 acres per 1,000 Meets Standard - Acre(s)
Total Park and Special Use Acreage 10.23 acres per 1,000 13.00 acres per 1,000 13.00 acres per 1,000 Need Exists 6,169 Acre(s)
Nature/Preserve Area (Acres) 7.68 acres per 1,000
Greenways (Acres) 3.67 acres per 1,000
Total Other Open Space Acreage 11.35 acres per 1,000
Total Combined Inventory Acreage 21.58 0.00 1,000
AMENITIES: (2)
Playgrounds 1.00 structure per 5,610 1.00 structure per 2,500 1.00 structure per 4,000 Need Exists 122 Structures(s)
Outdoor Pools (2) 1.00 site per 94,740 1.00 site per 20,000 1.00 site per 50,000 Need Exists 13 Site(s)
Spraygrounds (2) 1.00 site per 170,531 1.00 site per 25,000 1.00 site per 50,000 Need Exists 17 Site(s)
Picnic Pavilions - Large 1.00 structure per 53,291 1.00 structure per 20,000 1.00 structure per 20,000 Need Exists 39 Structures(s)
Picnic Pavilions - Medium/Small (3) 1.00 structure per 6,047 1.00 structure per 5,000 1.00 structure per 10,000 Meets Standard - Structures(s)
Picnic Pavilions - Indoor 1.00 structure per 121,808 1.00 structure per 50,000 1.00 structure per 50,000 Need Exists 15 Structures(s)
Trails - All Surfaces - Paved (Miles) (4) 0.10 miles per 1,000 0.40 miles per 1,000 0.40 miles per 1,000 Need Exists 336 Mile(s)
Basketball Courts 1.00 court per 6,714 1.00 court per 2,500 1.00 court per 5,000 Need Exists 93 Court(s)
Tennis Courts 1.00 court per 5,030 1.00 court per 4,000 1.00 court per 4,000 Need Exists 105 Court(s)
Volleyball Courts 1.00 court per 18,948 1.00 court per 15,000 1.00 court per 15,000 Need Exists 28 Court(s)
Dog Parks (3 acre minimum) 1.00 site per 170,531 1.00 site per 50,000 1.00 site per 50,000 Need Exists 17 Site(s)
Skateparks 1.00 site per 284,219 1.00 site per 50,000 1.00 site per 100,000 Need Exists 8 Site(s)
Nature Centers 1.00 site per 213,164 1.00 site per 50,000 1.00 site per 100,000 Need Exists 8 Site(s)
Aquatic Center/Indoor Pool (Square Feet) 0.08 SF per person 0.50 SF per person 0.50 SF per person Need Exists 483,263 Square Feet
Recreation/Fitness Center Space (Square Feet) 1.09 SF per person 1.50 SF per person 1.50 SF per person Need Exists 719,446 Square Feet
Preliminary 2017 Facility Standards
Current Service LevelTypical National Standards /
BEST PRACTICESRecommended Standards;
Revised for Local Service Area
Mecklenburg County - Facility Standards 3/14/2008
Service Levels - Current, National, and Recommended
Additonal Facilities/Amenities Needed

29
Greenprinting: 2-stage process
1. Resource Analysis Top-down conservation assessment
2. Parcel Prioritization Bottom-up acquisition analysis
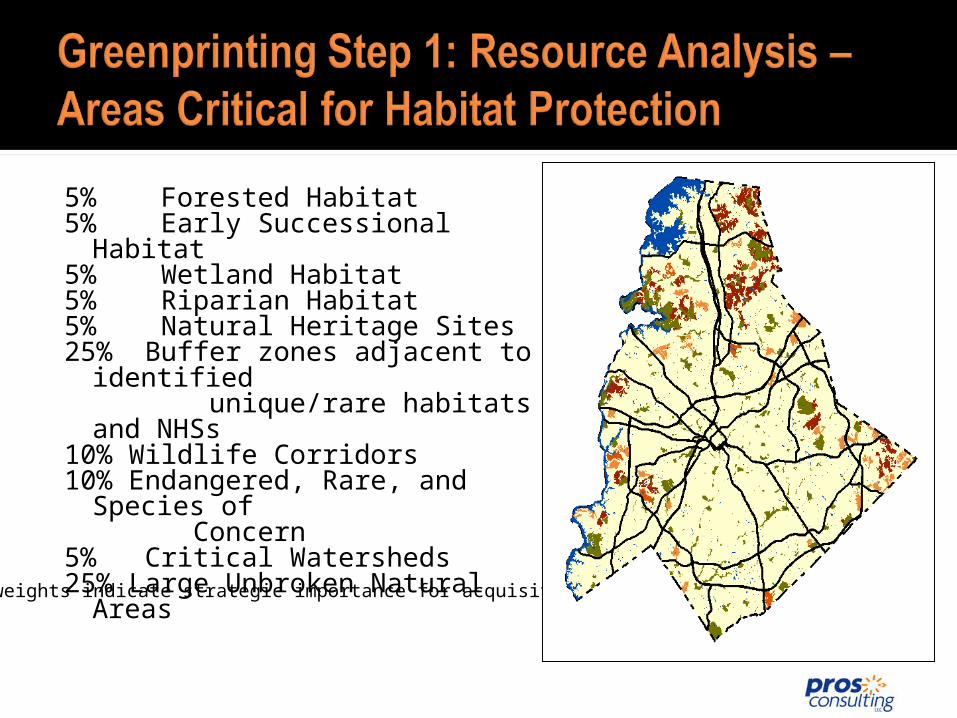
5% Forested Habitat5% Early Successional Habitat5% Wetland Habitat5% Riparian Habitat5% Natural Heritage Sites25% Buffer zones adjacent to identified unique/rare habitats and NHSs10% Wildlife Corridors10% Endangered, Rare, and Species of Concern5% Critical Watersheds25% Large Unbroken Natural Areas
*Relative weights indicate strategic importance for acquisition
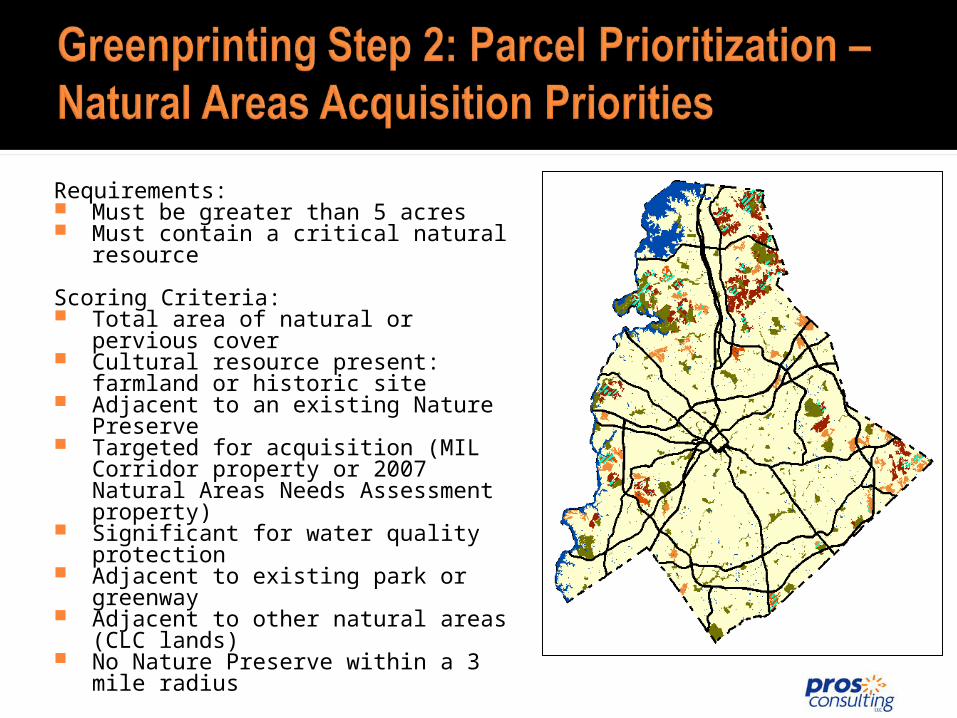
Requirements: Must be greater than 5 acres Must contain a critical natural resource
Scoring Criteria: Total area of natural or pervious cover Cultural resource present: farmland or
historic site Adjacent to an existing Nature Preserve Targeted for acquisition (MIL Corridor
property or 2007 Natural Areas Needs Assessment property)
Significant for water quality protection Adjacent to existing park or greenway Adjacent to other natural areas (CLC
lands) No Nature Preserve within a 3 mile radius
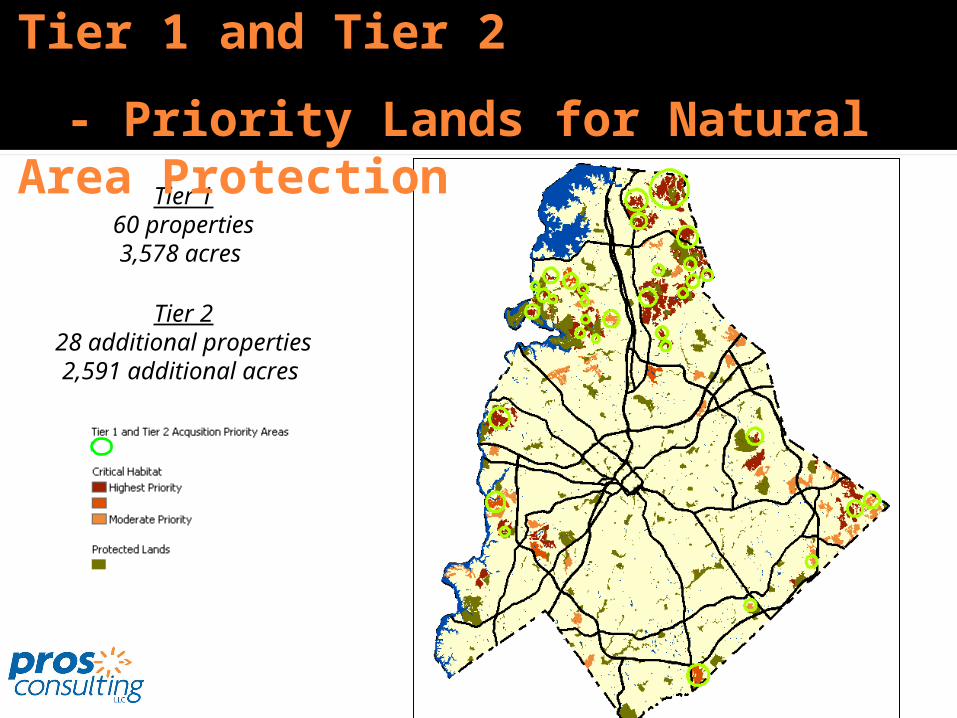
Tier 160 properties 3,578 acres
Tier 228 additional properties 2,591 additional acres
Tier 1 and Tier 2
- Priority Lands for Natural Area Protection
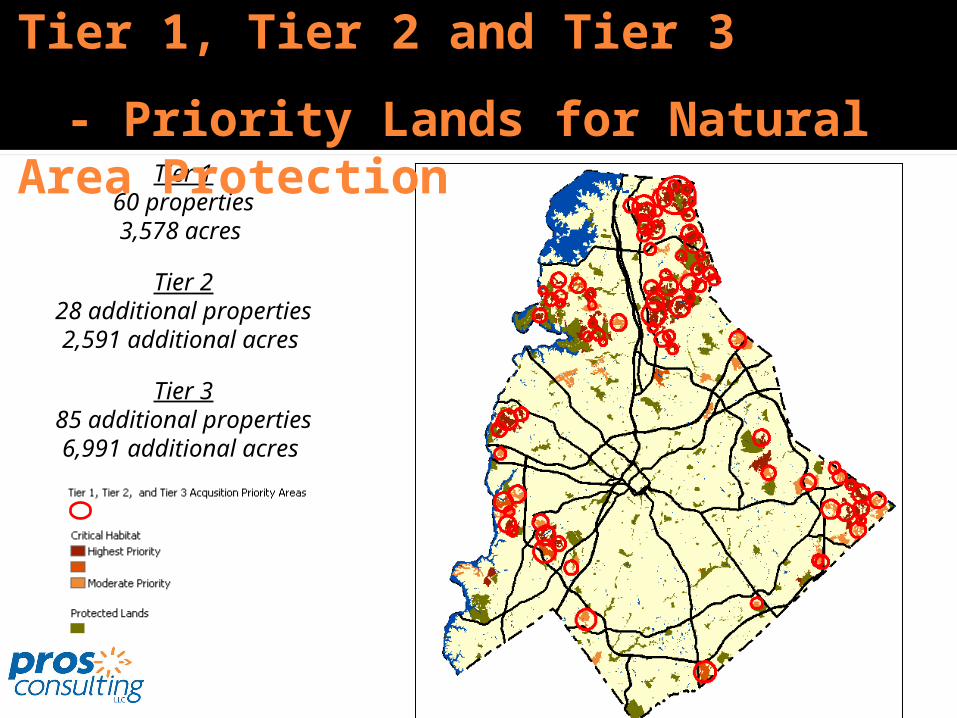
Tier 160 properties 3,578 acres
Tier 228 additional properties 2,591 additional acres
Tier 385 additional properties 6,991 additional acres
Tier 1, Tier 2 and Tier 3
- Priority Lands for Natural Area Protection

Rate of DevelopmentRate of Development

36
Land Banked Properties- Nature Preserves
Stevens Creek Nature Preserve
Berryhill Nature Preserve
Oehler Nature Preserve
Gateway Nature Preserve & Community Park
Davis Farm Nature Preserve (N. side of Hucks Road)
Sherman Branch – to be determined / remain land-banked
37
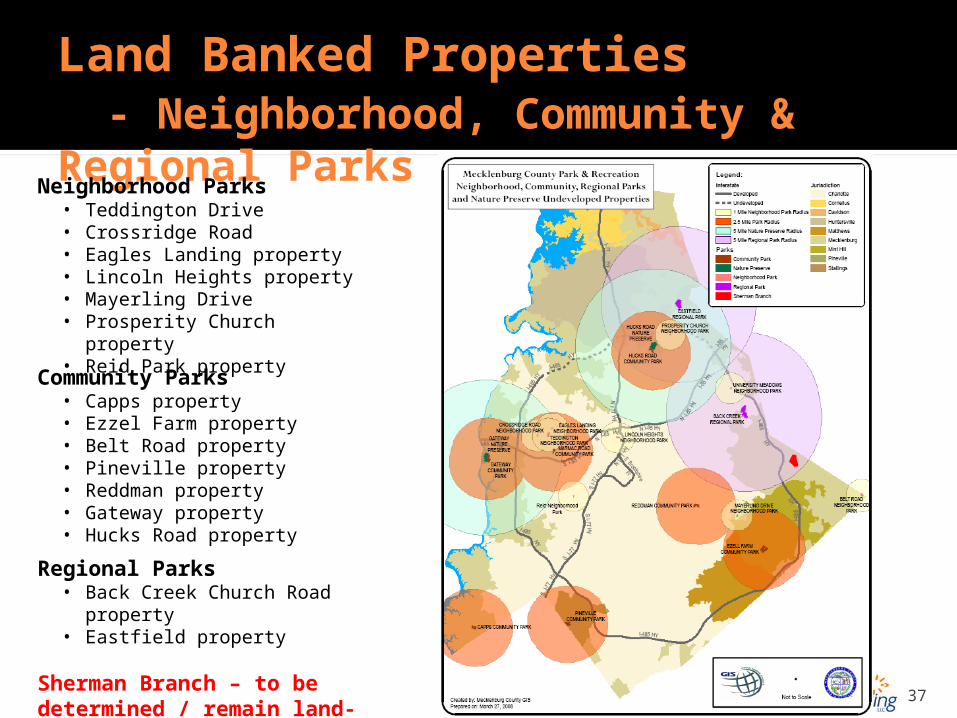
Land Banked Properties- Neighborhood, Community & Regional Parks
Neighborhood Parks• Teddington Drive• Crossridge Road• Eagles Landing property• Lincoln Heights property• Mayerling Drive• Prosperity Church property• Reid Park property
Community Parks• Capps property• Ezzel Farm property• Belt Road property• Pineville property• Reddman property• Gateway property• Hucks Road property
Regional Parks• Back Creek Church Road property• Eastfield property
Sherman Branch – to be determined / remain land-banked

38
7-1. Master Planning: Is the recreation center identified in the 2008 Parks Master Plan? [Y=2, N=0]7-2. Property Ownership: Does the county, or partnering entity, currently own all parcels necessary for recreation center development? [Y=6, N=0]7-3. Service Gap: Are there any developed recreation centers within a 2.5 mile radius? [Y=0, N=3] 7-4. Expansion: Does the project expand the current scope of programming at the recreation center? [Y=1, N=0] 7-5. Partnership Opportunity: Has a school, senior center, church, and / or library partnership opportunity been identified? [Y=5, N=0] Have outside funding sources been identified? [Y=3, N=0] Is the recreation center adjacent to a school, senior center, church, and / or library facility? [Y=1, N=0] 7-6. Linkages: Is the recreation center adjacent to a planned and / or developed greenway? [Y=1, N=0] Is the recreation center adjacent to a planned and / or developed park? [Y=1, N=0] 7-7. Mass Transit: Is the recreation center within a 0.5 mile radius of a public transportation station / depot? [Y=1, N=0]
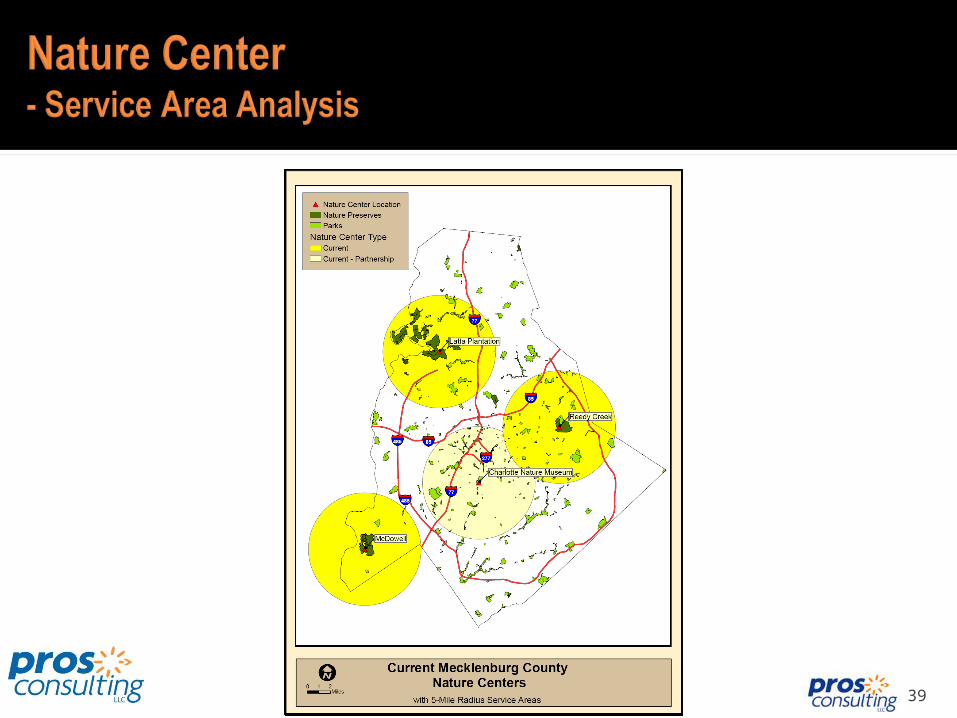
Nature Center Methodology
39
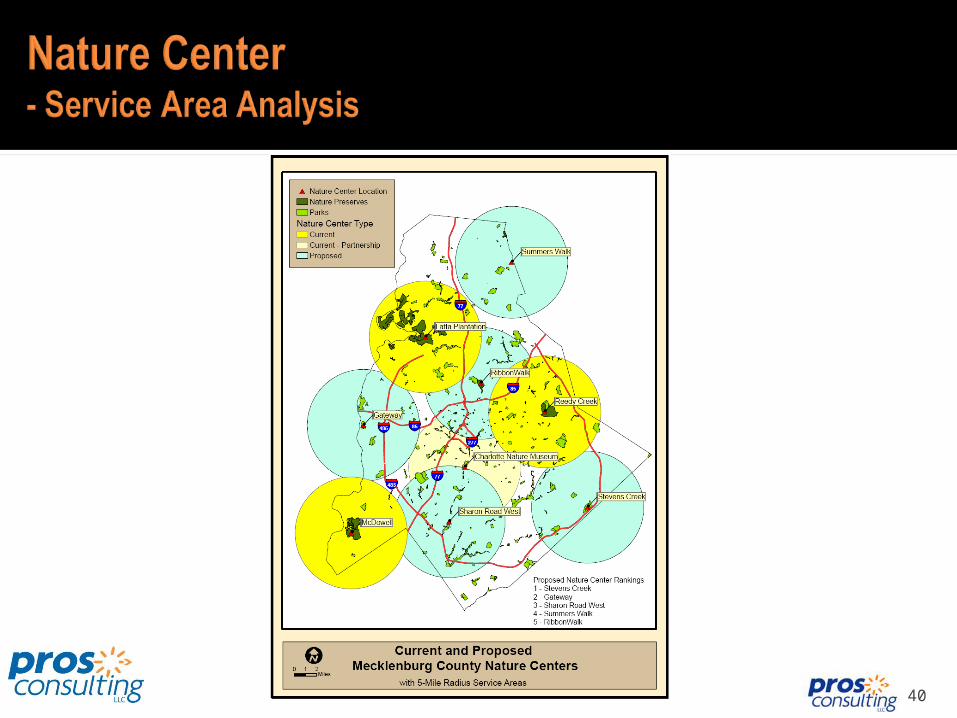
40
41
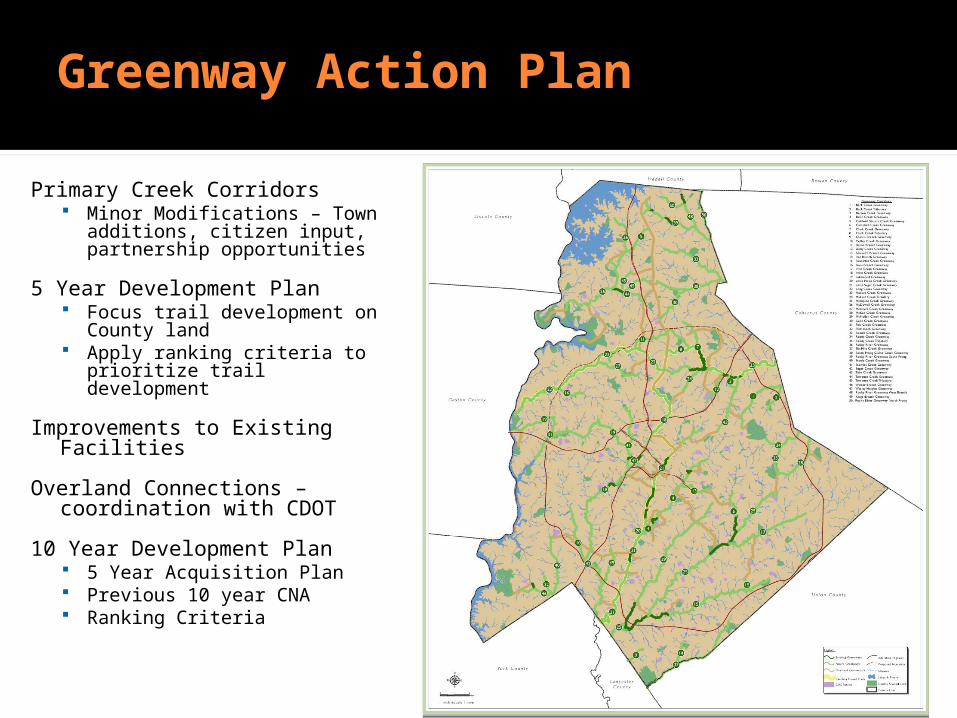
Greenway Action Plan
Primary Creek Corridors Minor Modifications – Town
additions, citizen input, partnership opportunities
5 Year Development Plan Focus trail development on County
land Apply ranking criteria to prioritize
trail development
Improvements to Existing Facilities
Overland Connections – coordination with CDOT
10 Year Development Plan 5 Year Acquisition Plan Previous 10 year CNA Ranking Criteria
42
Primary Greenway Corridors Back Creek Back Creek Tributary Barton Creek Briar Creek Caldwell Station Creek Campbell Creek Cane Creek Clarke Creek, South Prong Clark’s Creek Clark’s Creek Tributary Clem’s Branch Coffey Creek Dixon Branch Doby Creek Edward’s Branch Flat Branch Four Mile Creek Gum Branch Irvins Creek Irwin Creek Kings Branch Little Hope Creek Little Sugar Creek Long Creek
Mallard Creek Mallard Creek Tributary McAlpine Creek McDowell Creek McIntyre Creek McKees Creek McMullen Creek Paw Creek Polk Ditch Ramah Creek Reedy Creek Reedy Creek Tributary Rocky River Rocky River, North Prong Rocky River, South Prong Rocky River, West Branch Six Mile Creek Steele Creek Stewart Creek Stewart Creek – Lakewood Tributary Sugar Creek Toby Creek Torrence Creek Torrence Creek Tributaries Walker Branch

43
Greenways Trail Development Methodology
Trail Development – Ranking Criteria No Significant Barrier to Construction Developed Miles Per Park District
▪ <10% of planned miles, 10 points, >50% 0 points Project Partnerships
▪ 10 points per mile – public or private partnerships. No $ necessarily tied to development
Funding Partnerships▪ 1 point per $10,000
Located in Surrounding Town Listed in Other Adopted Plans or Studies Linkages -- Connectivity
▪ School, park or greenway facility, planned regional trail, destination, college/library, mixed-use development, transit, office or commercial area, neighborhood access
Land Acquisition Multiplier
44
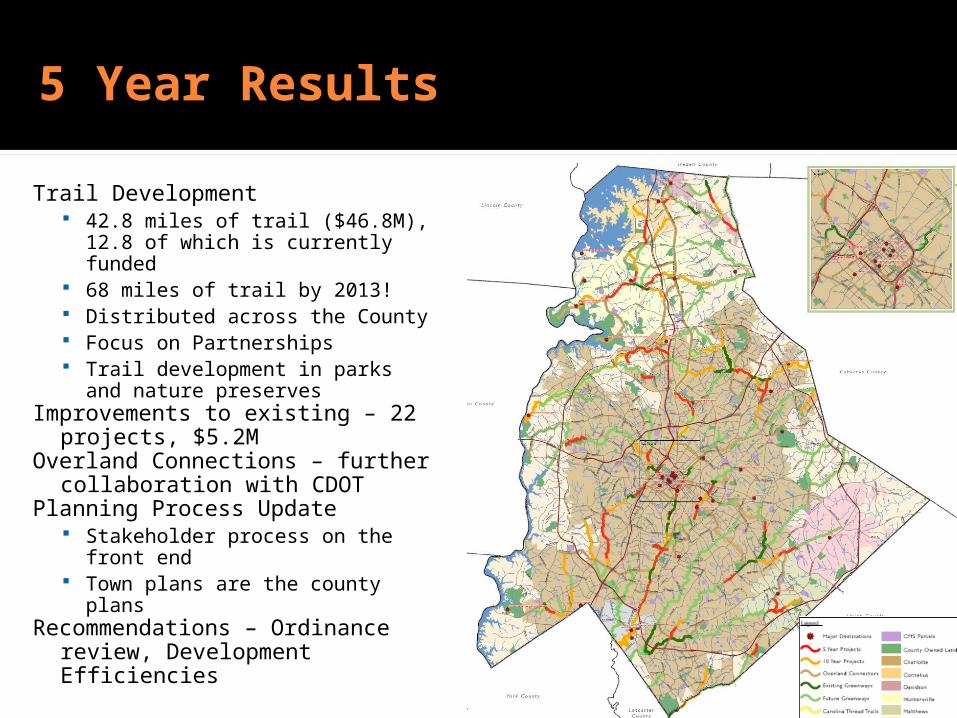
5 Year Results
Trail Development 42.8 miles of trail ($46.8M), 12.8 of
which is currently funded 68 miles of trail by 2013! Distributed across the County Focus on Partnerships Trail development in parks and nature
preservesImprovements to existing – 22 projects,
$5.2MOverland Connections – further
collaboration with CDOTPlanning Process Update
Stakeholder process on the front end Town plans are the county plans
Recommendations – Ordinance review, Development Efficiencies
45
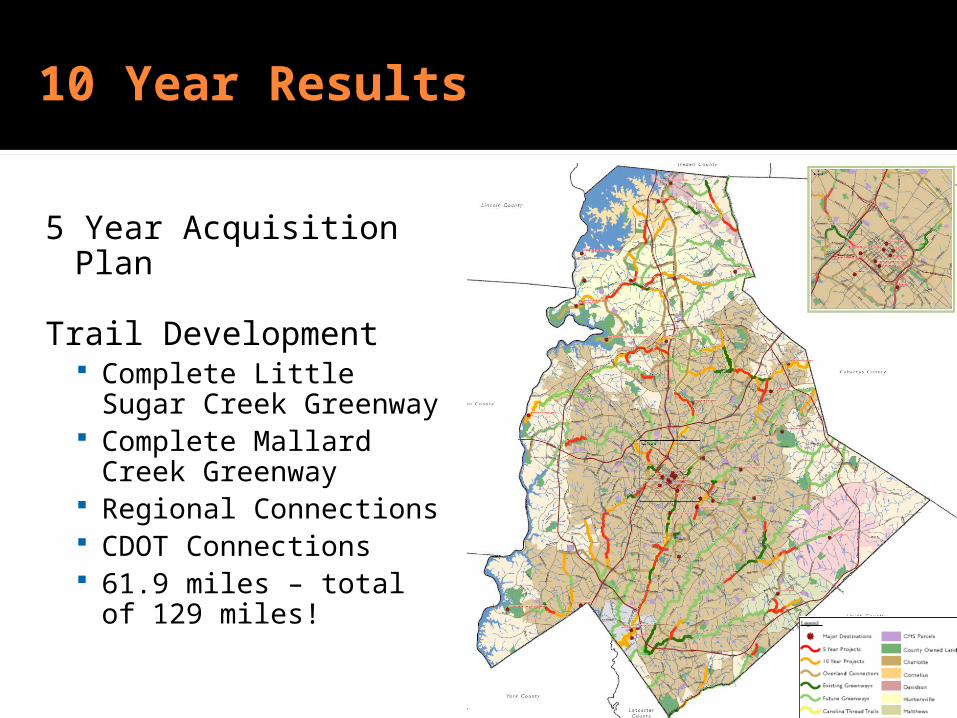
10 Year Results
5 Year Acquisition Plan
Trail Development Complete Little Sugar Creek
Greenway Complete Mallard Creek
Greenway Regional Connections CDOT Connections 61.9 miles – total of 129
miles!

46
47
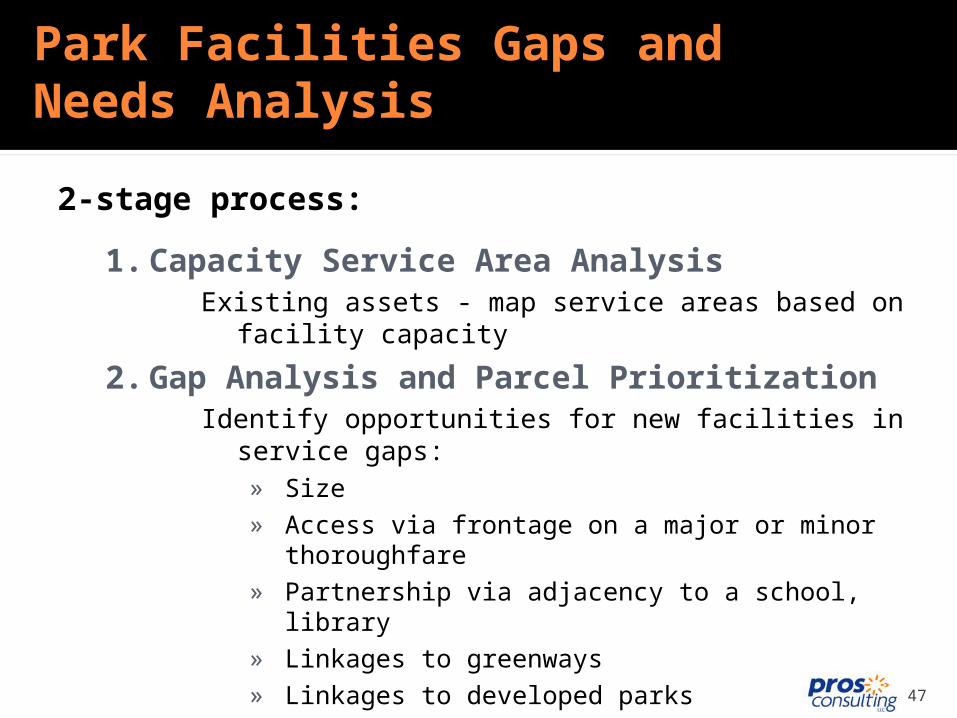
2-stage process:
1. Capacity Service Area Analysis Existing assets - map service areas based on facility capacity
2. Gap Analysis and Parcel Prioritization Identify opportunities for new facilities in service gaps:
» Size» Access via frontage on a major or minor thoroughfare» Partnership via adjacency to a school, library» Linkages to greenways» Linkages to developed parks» Residential population within new service area» Public transit accessibility
Park Facilities Gaps and Needs Analysis
48
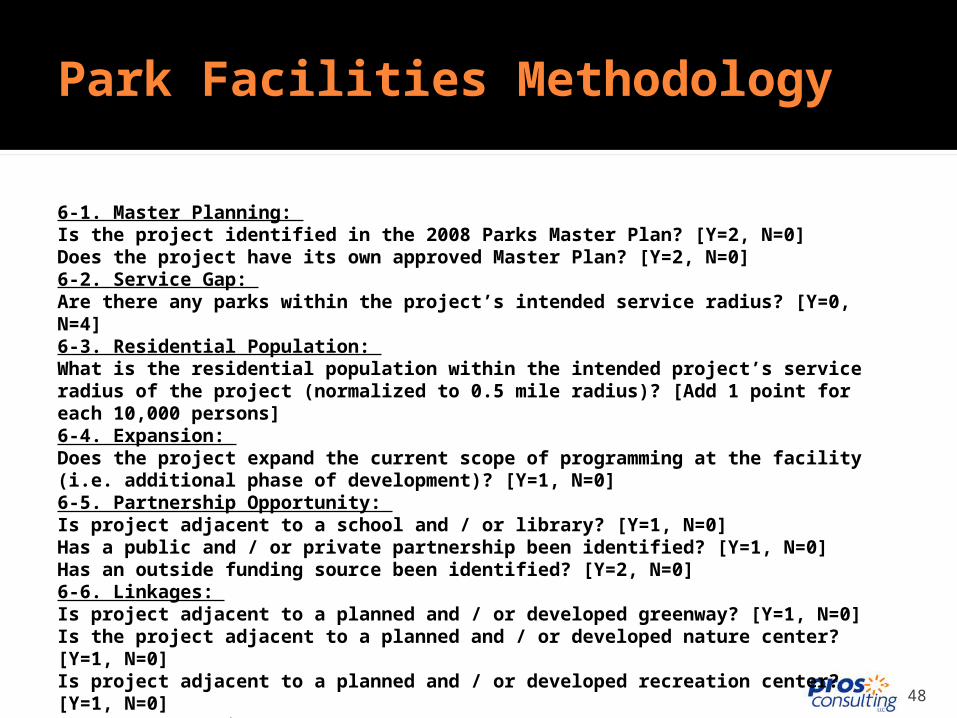
Park Facilities Methodology
6-1. Master Planning: Is the project identified in the 2008 Parks Master Plan? [Y=2, N=0]Does the project have its own approved Master Plan? [Y=2, N=0] 6-2. Service Gap: Are there any parks within the project’s intended service radius? [Y=0, N=4] 6-3. Residential Population: What is the residential population within the intended project’s service radius of the project (normalized to 0.5 mile radius)? [Add 1 point for each 10,000 persons] 6-4. Expansion: Does the project expand the current scope of programming at the facility (i.e. additional phase of development)? [Y=1, N=0] 6-5. Partnership Opportunity: Is project adjacent to a school and / or library? [Y=1, N=0] Has a public and / or private partnership been identified? [Y=1, N=0]Has an outside funding source been identified? [Y=2, N=0] 6-6. Linkages: Is project adjacent to a planned and / or developed greenway? [Y=1, N=0]Is the project adjacent to a planned and / or developed nature center? [Y=1, N=0]Is project adjacent to a planned and / or developed recreation center? [Y=1, N=0] 6-7. Mass Transit: Is the project within a 0.5 mile radius of a public transportation station / depot? [Y=1, N=0]

49
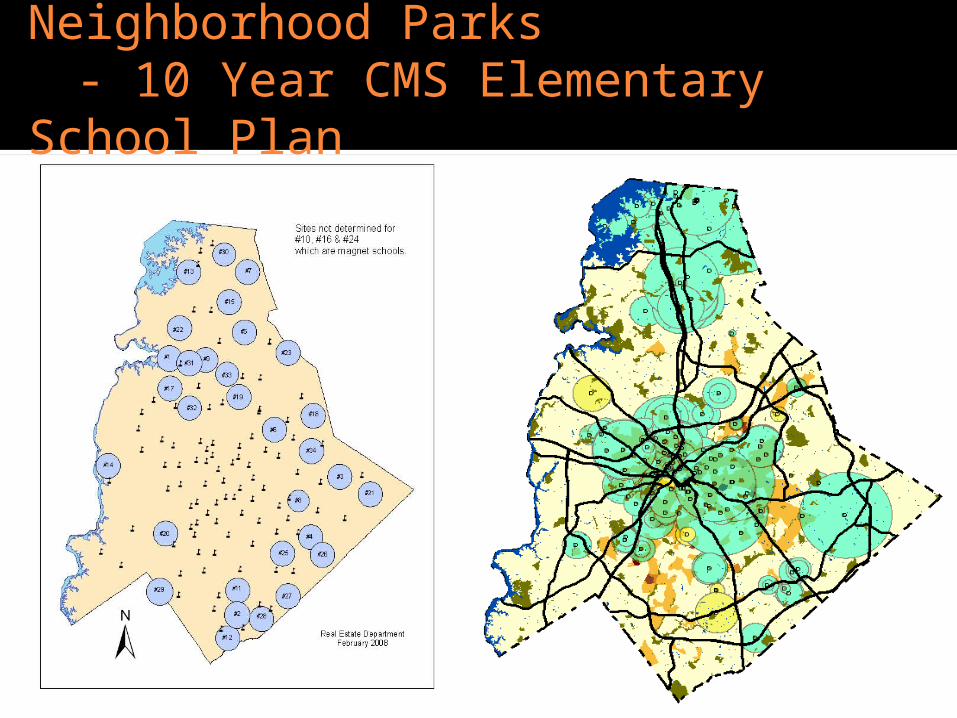
Neighborhood parks are 2 to 20 acres
Neighborhood parks service radius is density based upon 3 acres per 1000 people
50
Neighborhood Parks- 10 Year CMS Elementary School Plan
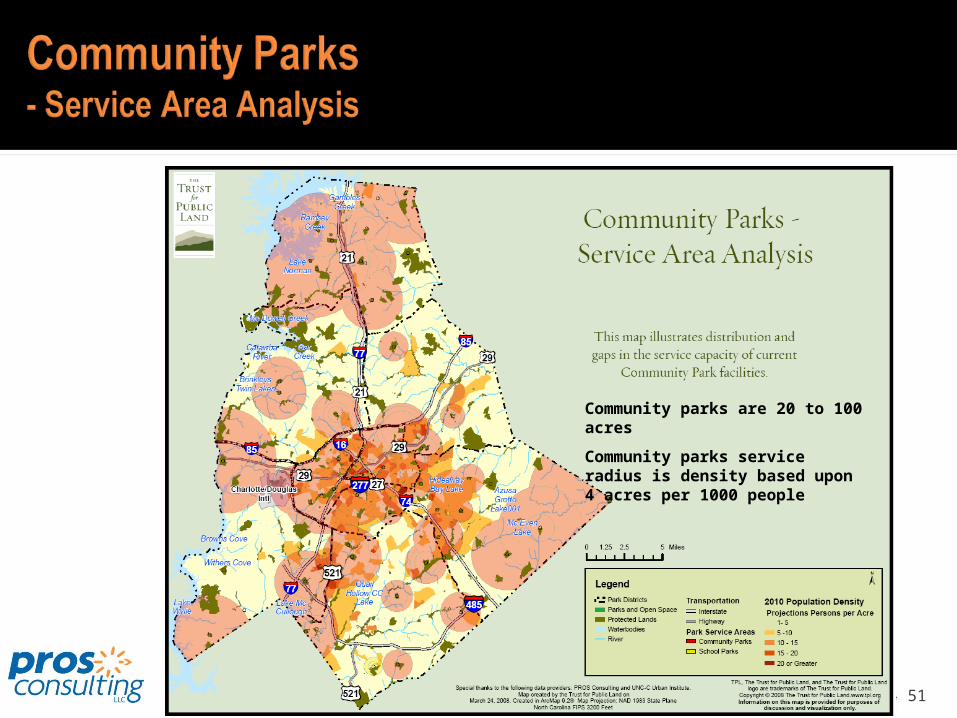
51
Community parks are 20 to 100 acres
Community parks service radius is density based upon 4 acres per 1000 people
52
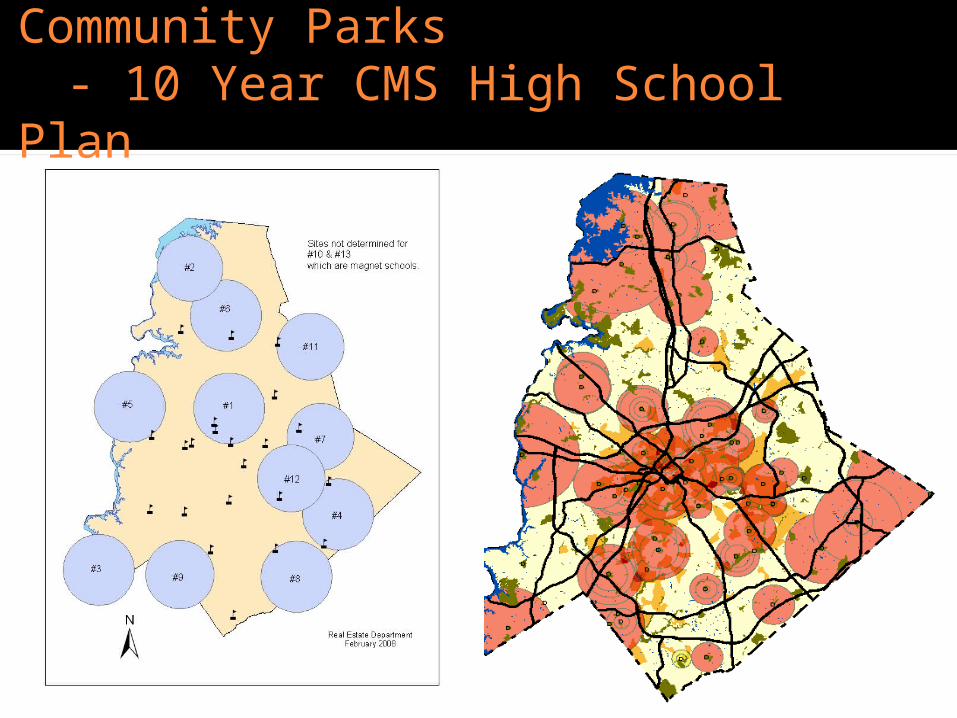
Community Parks - 10 Year CMS High School Plan
53
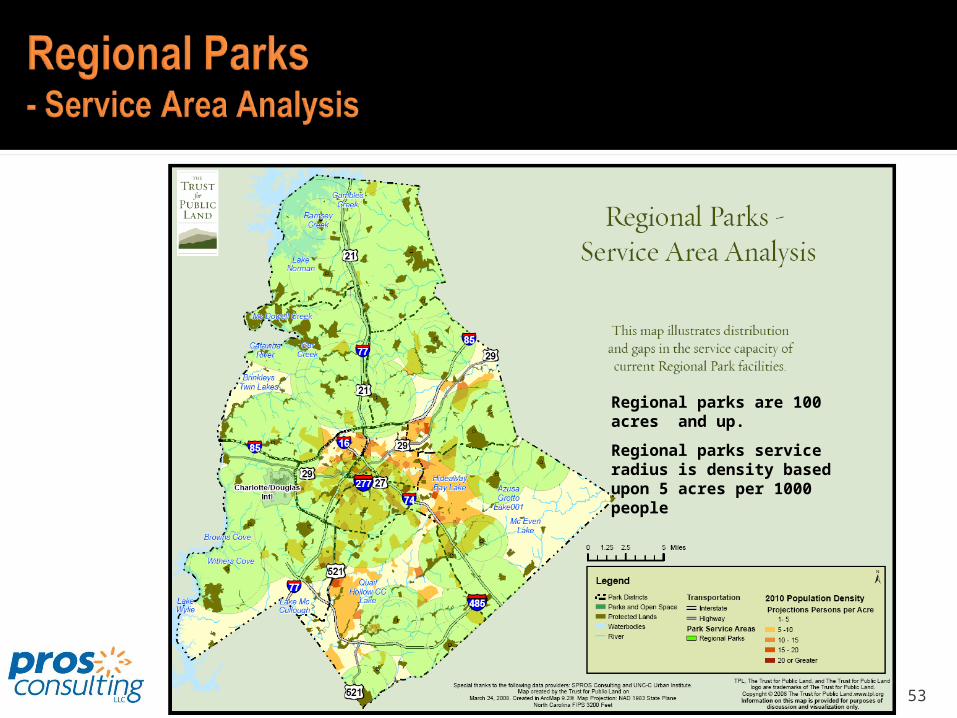
Regional parks are 100 acres and up.
Regional parks service radius is density based upon 5 acres per 1000 people
54
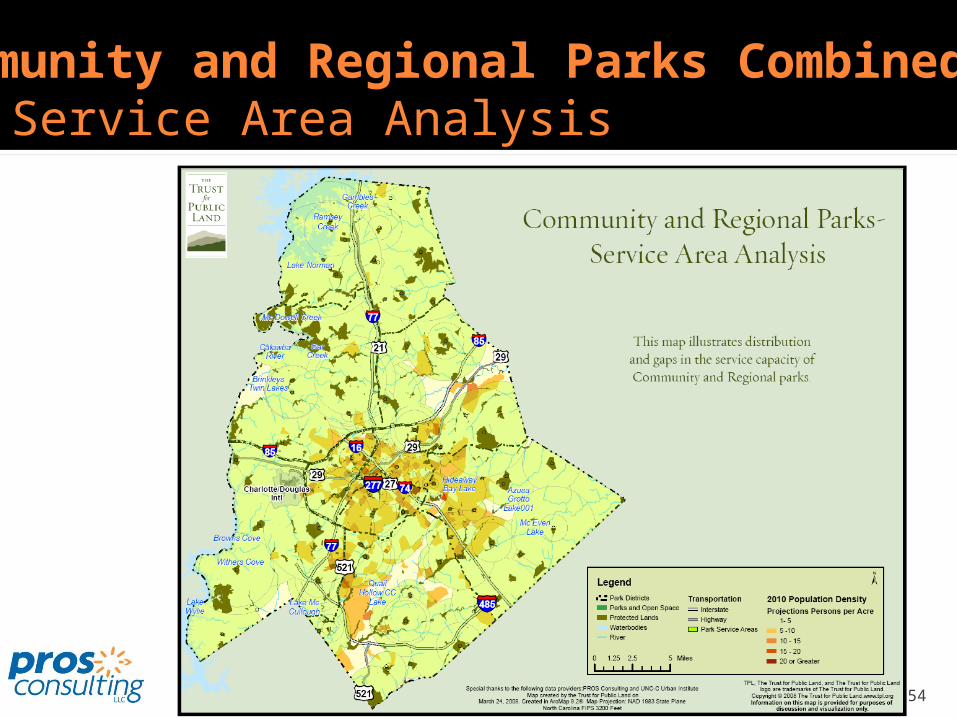
Community and Regional Parks Combined- Service Area Analysis
55
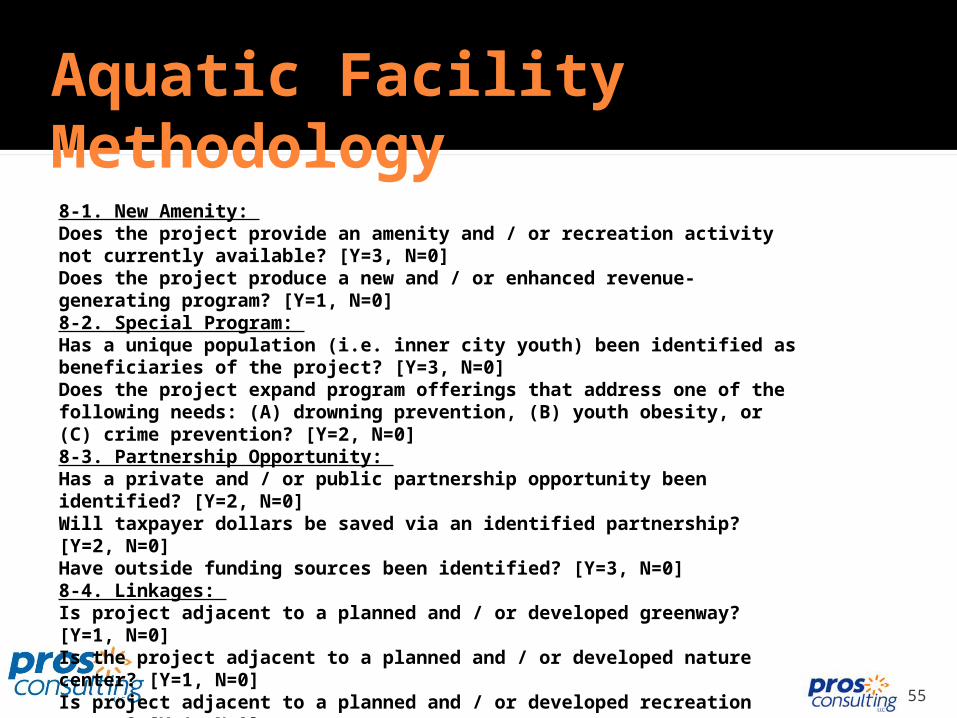
8-1. New Amenity: Does the project provide an amenity and / or recreation activity not currently available? [Y=3, N=0] Does the project produce a new and / or enhanced revenue-generating program? [Y=1, N=0] 8-2. Special Program: Has a unique population (i.e. inner city youth) been identified as beneficiaries of the project? [Y=3, N=0] Does the project expand program offerings that address one of the following needs: (A) drowning prevention, (B) youth obesity, or (C) crime prevention? [Y=2, N=0] 8-3. Partnership Opportunity: Has a private and / or public partnership opportunity been identified? [Y=2, N=0] Will taxpayer dollars be saved via an identified partnership? [Y=2, N=0] Have outside funding sources been identified? [Y=3, N=0] 8-4. Linkages: Is project adjacent to a planned and / or developed greenway? [Y=1, N=0]Is the project adjacent to a planned and / or developed nature center? [Y=1, N=0]Is project adjacent to a planned and / or developed recreation center? [Y=1, N=0] Is the project adjacent to a planned and / or developed park? [Y=1, N=0] 8-5. Mass Transit: Is the recreation center within a 0.5 mile radius of a public transportation station / depot? [Y=1, N=0]
Aquatic Facility Methodology
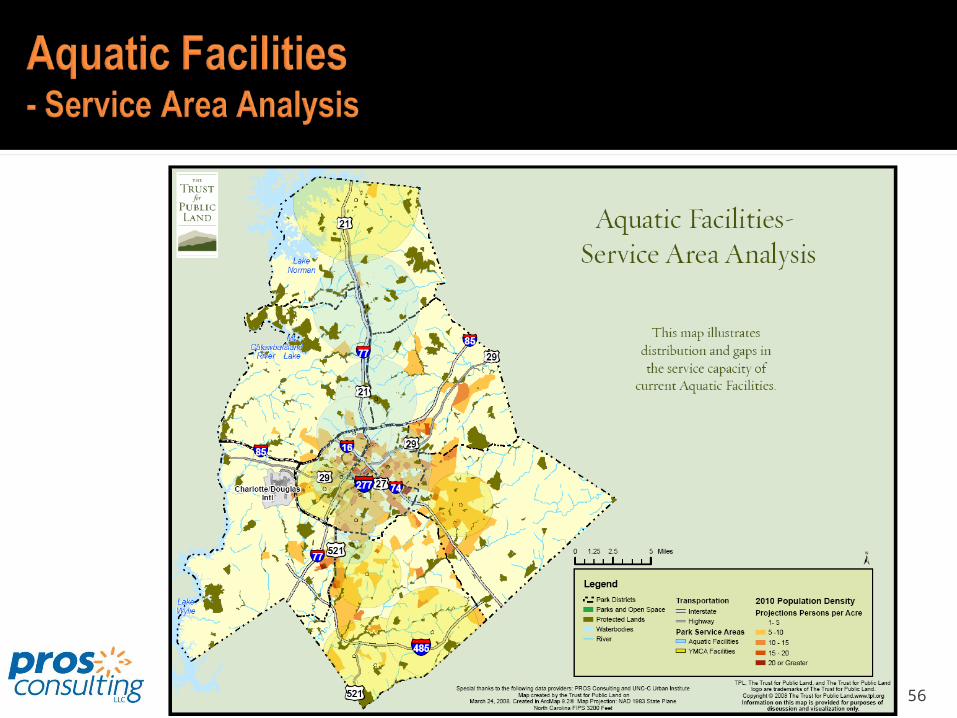
56
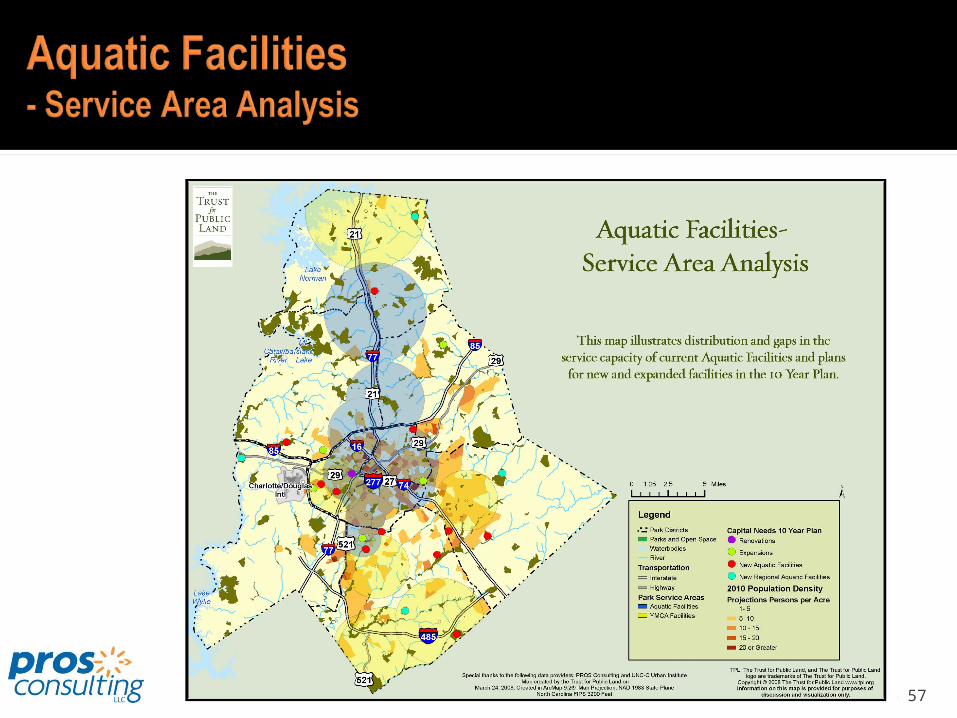
57
58
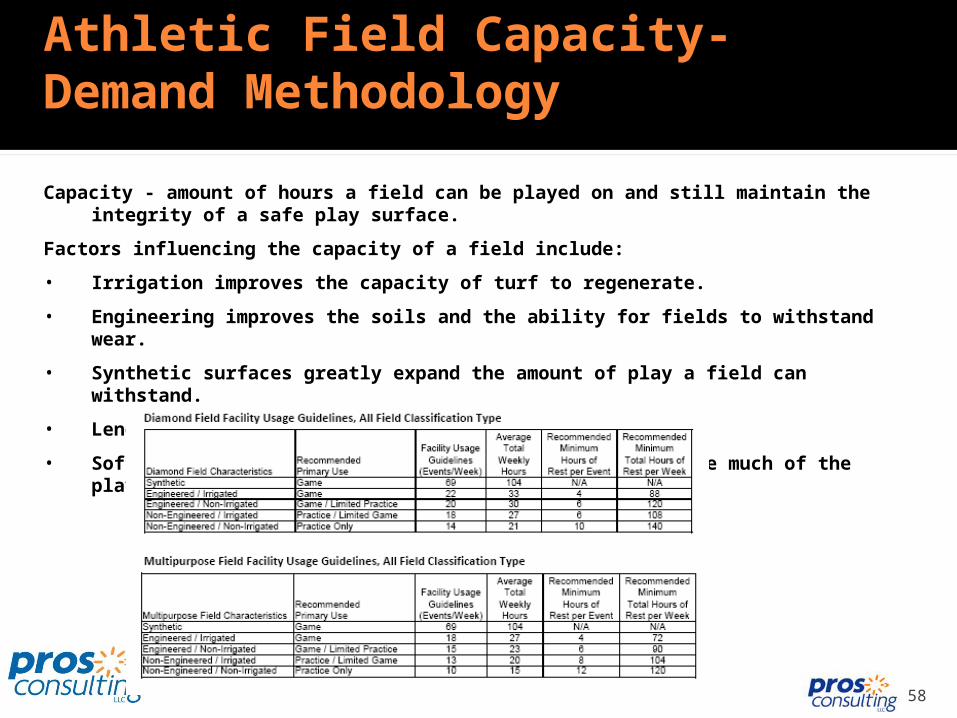
Athletic Field Capacity-Demand Methodology
Capacity - amount of hours a field can be played on and still maintain the integrity of a safe play surface.
Factors influencing the capacity of a field include:
• Irrigation improves the capacity of turf to regenerate.
• Engineering improves the soils and the ability for fields to withstand wear.
• Synthetic surfaces greatly expand the amount of play a field can withstand.
• Length of growing season and when play occurs.
• Softball/baseball fields can withstand more play because much of the play is on a non grass surface.
59
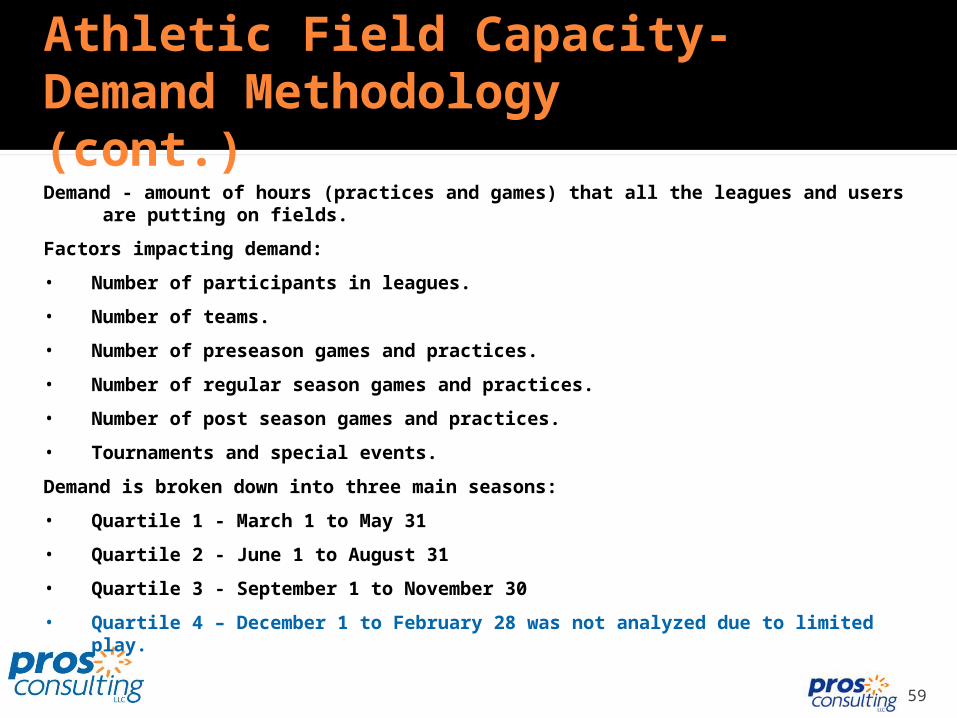
Athletic Field Capacity-Demand Methodology (cont.)
Demand - amount of hours (practices and games) that all the leagues and users are putting on fields.
Factors impacting demand:
• Number of participants in leagues.
• Number of teams.
• Number of preseason games and practices.
• Number of regular season games and practices.
• Number of post season games and practices.
• Tournaments and special events.
Demand is broken down into three main seasons:
• Quartile 1 - March 1 to May 31
• Quartile 2 - June 1 to August 31
• Quartile 3 - September 1 to November 30
• Quartile 4 – December 1 to February 28 was not analyzed due to limited play.
60
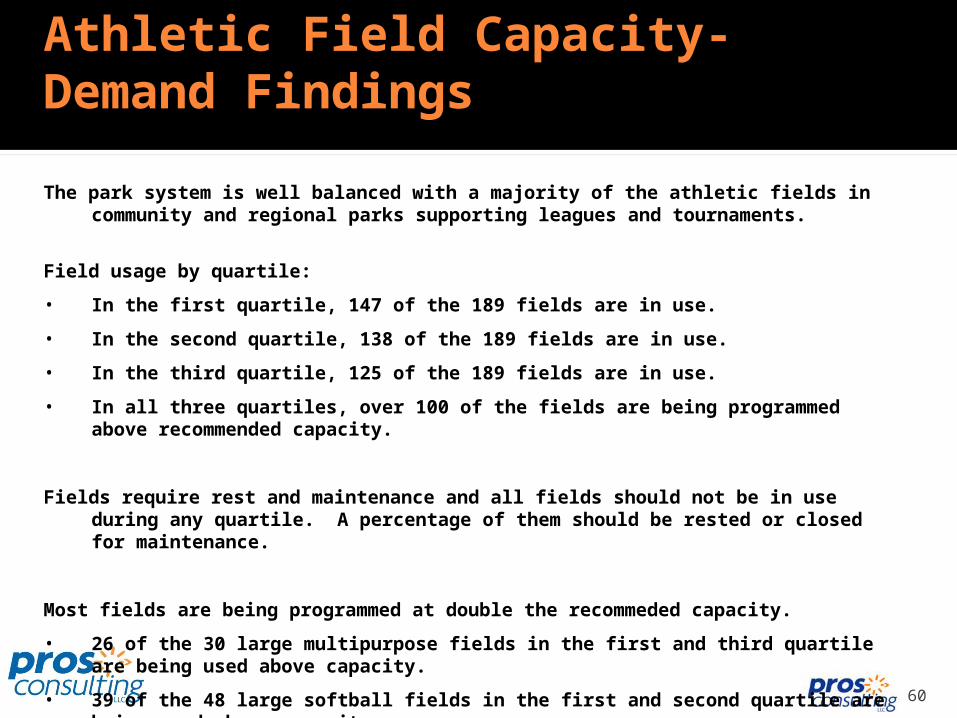
Athletic Field Capacity-Demand Findings
The park system is well balanced with a majority of the athletic fields in community and regional parks supporting leagues and tournaments.
Field usage by quartile:
• In the first quartile, 147 of the 189 fields are in use.
• In the second quartile, 138 of the 189 fields are in use.
• In the third quartile, 125 of the 189 fields are in use.
• In all three quartiles, over 100 of the fields are being programmed above recommended capacity.
Fields require rest and maintenance and all fields should not be in use during any quartile. A percentage of them should be rested or closed for maintenance.
Most fields are being programmed at double the recommeded capacity.
• 26 of the 30 large multipurpose fields in the first and third quartile are being used above capacity.
• 39 of the 48 large softball fields in the first and second quartile are being used above capacity.
61
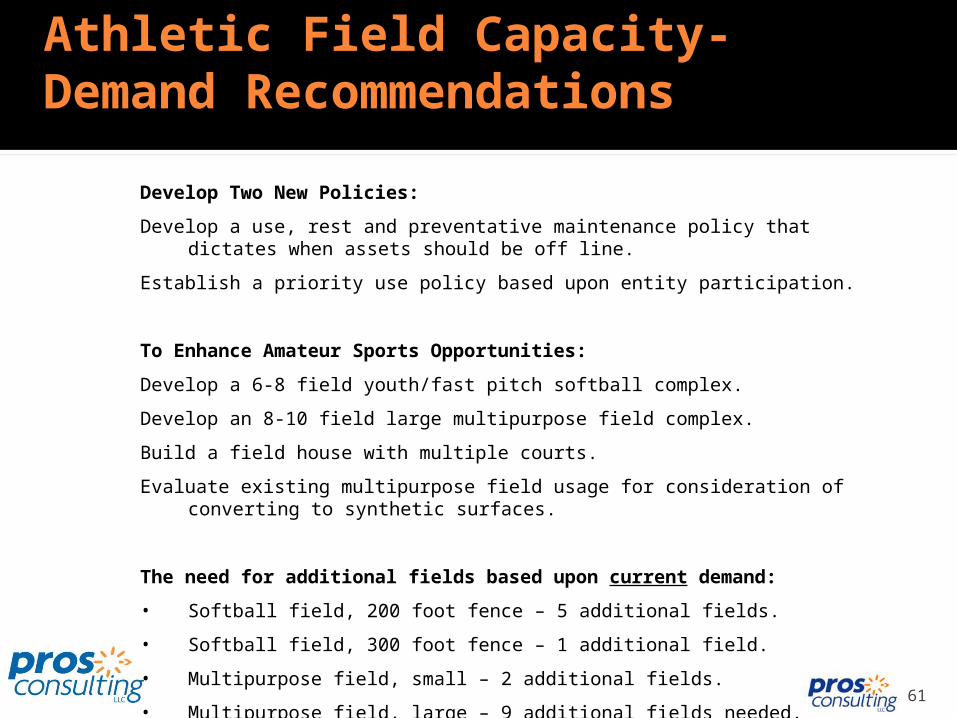
Athletic Field Capacity-Demand Recommendations
Develop Two New Policies:
Develop a use, rest and preventative maintenance policy that dictates when assets should be off line.
Establish a priority use policy based upon entity participation.
To Enhance Amateur Sports Opportunities:
Develop a 6-8 field youth/fast pitch softball complex.
Develop an 8-10 field large multipurpose field complex.
Build a field house with multiple courts.
Evaluate existing multipurpose field usage for consideration of converting to synthetic surfaces.
The need for additional fields based upon current demand:
• Softball field, 200 foot fence – 5 additional fields.
• Softball field, 300 foot fence – 1 additional field.
• Multipurpose field, small – 2 additional fields.
• Multipurpose field, large – 9 additional fields needed.
62
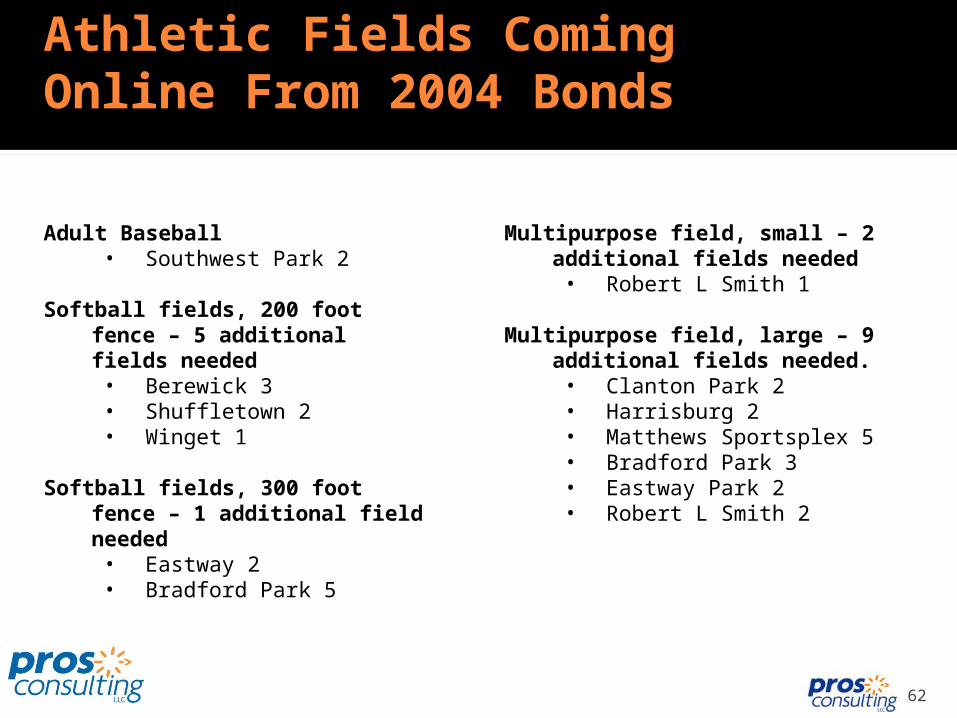
Athletic Fields Coming Online From 2004 Bonds
Adult Baseball• Southwest Park 2
Softball fields, 200 foot fence – 5 additional fields needed
• Berewick 3• Shuffletown 2• Winget 1
Softball fields, 300 foot fence – 1 additional field needed
• Eastway 2• Bradford Park 5
Multipurpose field, small – 2 additional fields needed
• Robert L Smith 1
Multipurpose field, large – 9 additional fields needed.
• Clanton Park 2• Harrisburg 2• Matthews Sportsplex 5• Bradford Park 3• Eastway Park 2• Robert L Smith 2

63
Athletic Fields Planned But Not Funded
Softball field, 200 foot fence• Berewick 6• Col. Beatty 2• Flat Branch 2• Bradford 2• Mallard Creek 4• Balantyne 3• Winget 3
Softball field, 300 foot fence • Col. Beatty 1• Eastway 2• Shuffletown 5• 521 Park 4• Balantyne 4
Multipurpose field, small• Balantyne 3
Multipurpose field, large• Harrisburg 11• Matthews Sportsplex 7• Bradford Park 3• Eastway Park 7• Berewick 7 • 521 Park 8• Flat Branch 1
64
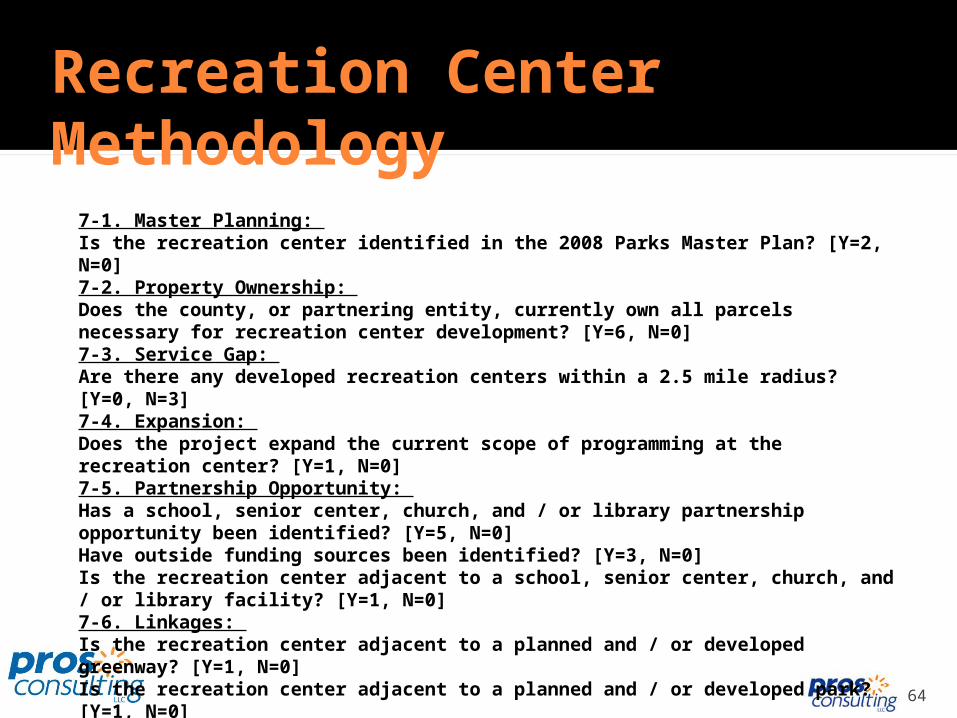
7-1. Master Planning: Is the recreation center identified in the 2008 Parks Master Plan? [Y=2, N=0]7-2. Property Ownership: Does the county, or partnering entity, currently own all parcels necessary for recreation center development? [Y=6, N=0]7-3. Service Gap: Are there any developed recreation centers within a 2.5 mile radius? [Y=0, N=3] 7-4. Expansion: Does the project expand the current scope of programming at the recreation center? [Y=1, N=0] 7-5. Partnership Opportunity: Has a school, senior center, church, and / or library partnership opportunity been identified? [Y=5, N=0] Have outside funding sources been identified? [Y=3, N=0] Is the recreation center adjacent to a school, senior center, church, and / or library facility? [Y=1, N=0] 7-6. Linkages: Is the recreation center adjacent to a planned and / or developed greenway? [Y=1, N=0] Is the recreation center adjacent to a planned and / or developed park? [Y=1, N=0] 7-7. Mass Transit: Is the recreation center within a 0.5 mile radius of a public transportation station / depot? [Y=1, N=0]
Recreation Center Methodology
65
66
Assessment of all program services provided by to the County.
Assessment of other community suppliers including towns and YMCAs that provided information.
Gap analysis of programs not being served adequately in the County with recommendation for enhancing existing services and building new core services.
Program Plan Methodology
67
Offer core programs outlined in the program plan with high cost recovery levels
Utilize training and performance measures to create consistency
Employ partners and volunteers to support program operations and build advocacy for the County recreation program brand
Stronger efforts are necessary in programming existing recreation centers
Theme some centers to attract stronger user participation Better efforts are necessary to market the services provided
68
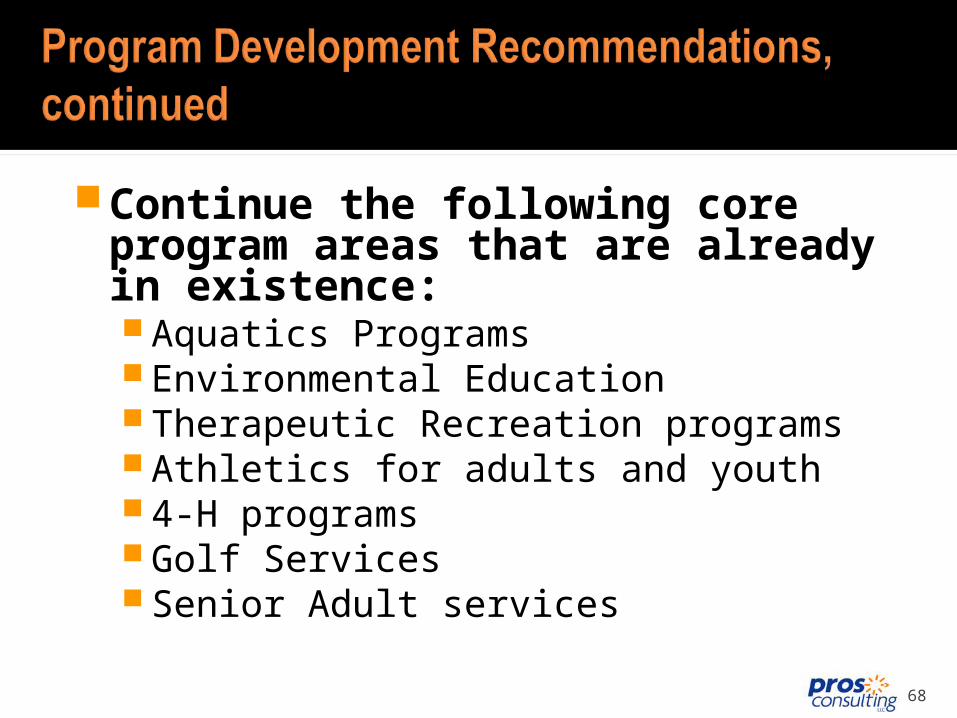
Continue the following core program areas that are already in existence: Aquatics Programs Environmental Education Therapeutic Recreation programs Athletics for adults and youth 4‐H programs Golf Services Senior Adult services
69
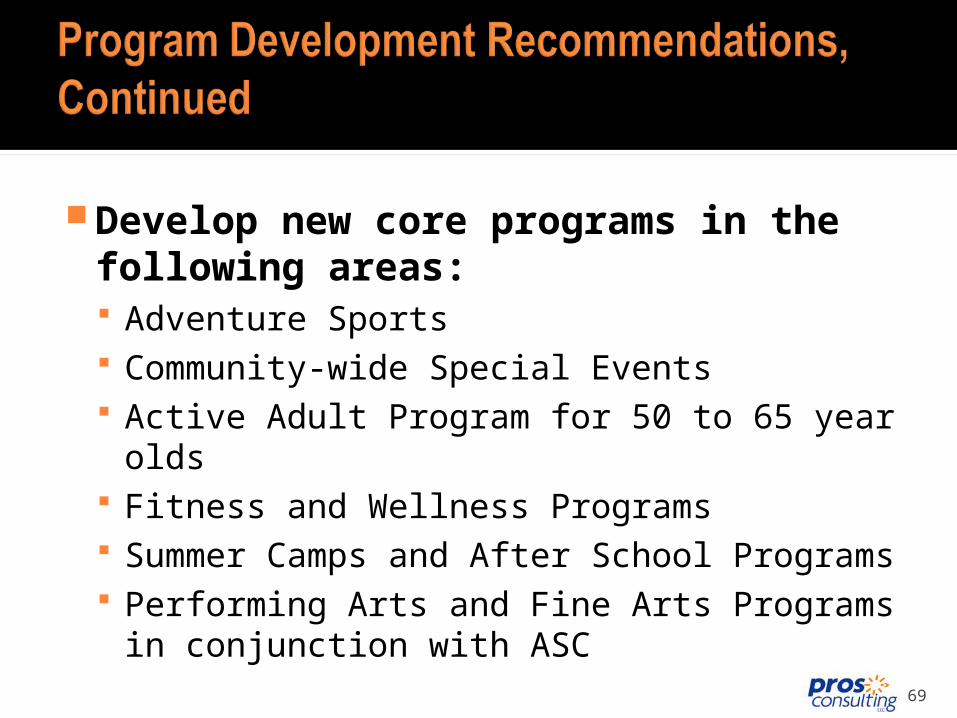
Develop new core programs in the following areas: Adventure Sports Community‐wide Special Events Active Adult Program for 50 to 65 year olds Fitness and Wellness Programs Summer Camps and After School Programs Performing Arts and Fine Arts Programs in conjunction
with ASC
70
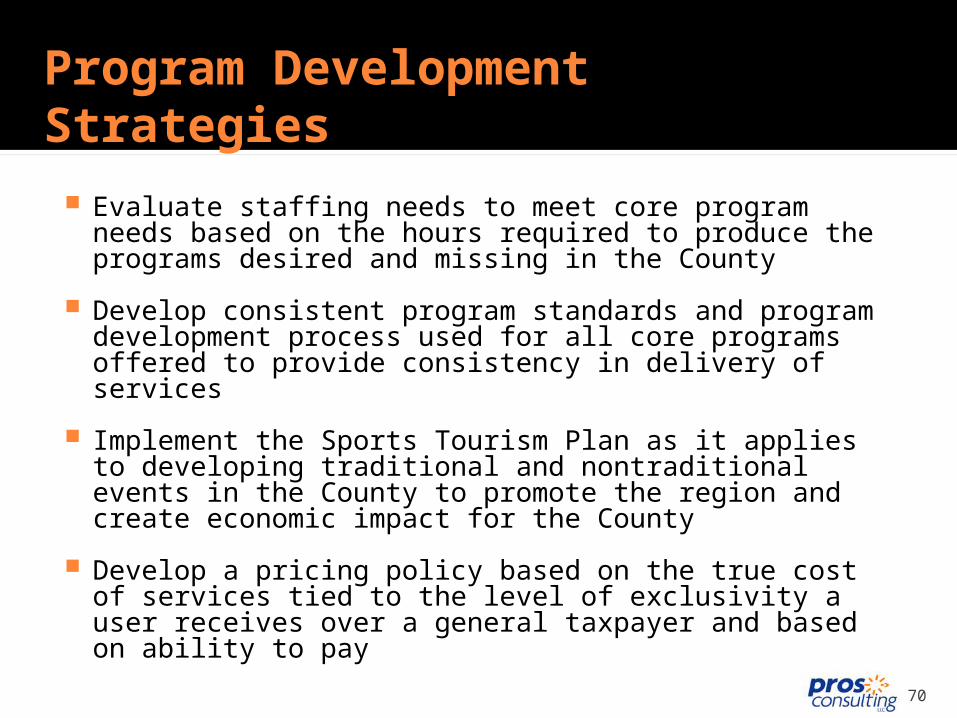
Evaluate staffing needs to meet core program needs based on the hours required to produce the programs desired and missing in the County
Develop consistent program standards and program development process used for all core programs offered to provide consistency in delivery of services
Implement the Sports Tourism Plan as it applies to developing traditional and nontraditional events in the County to promote the region and create economic impact for the County
Develop a pricing policy based on the true cost of services tied to the level of exclusivity a user receives over a general taxpayer and based on ability to pay
Program Development Strategies
71
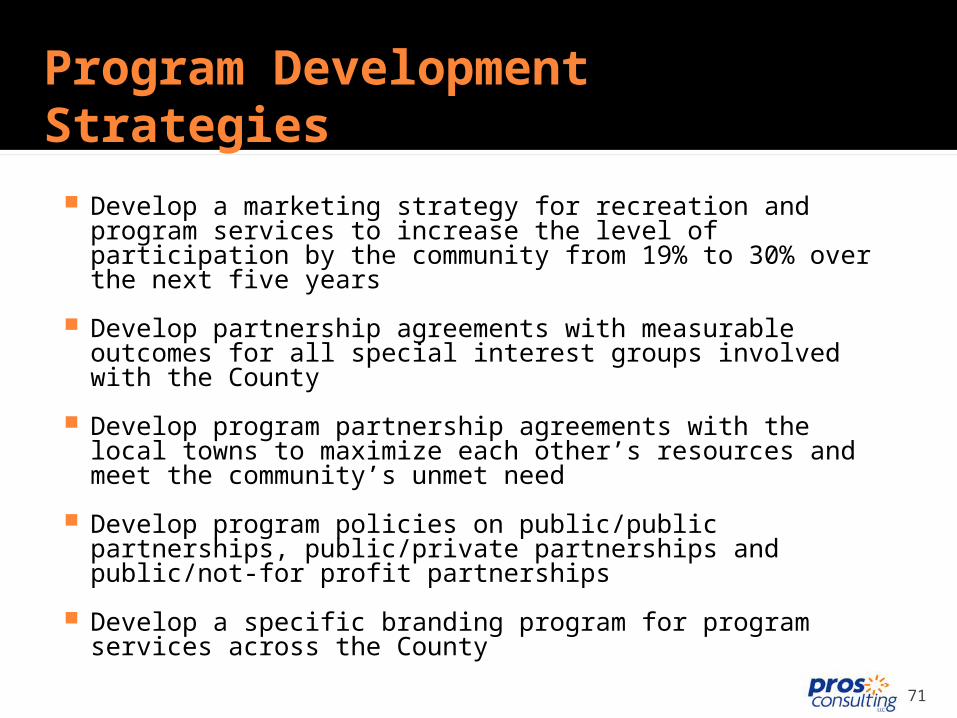
Develop a marketing strategy for recreation and program services to increase the level of participation by the community from 19% to 30% over the next five years
Develop partnership agreements with measurable outcomes for all special interest groups involved with the County
Develop program partnership agreements with the local towns to maximize each other’s resources and meet the community’s unmet need
Develop program policies on public/public partnerships, public/private partnerships and public/not‐for profit partnerships
Develop a specific branding program for program services across the County
Program Development Strategies

72
73
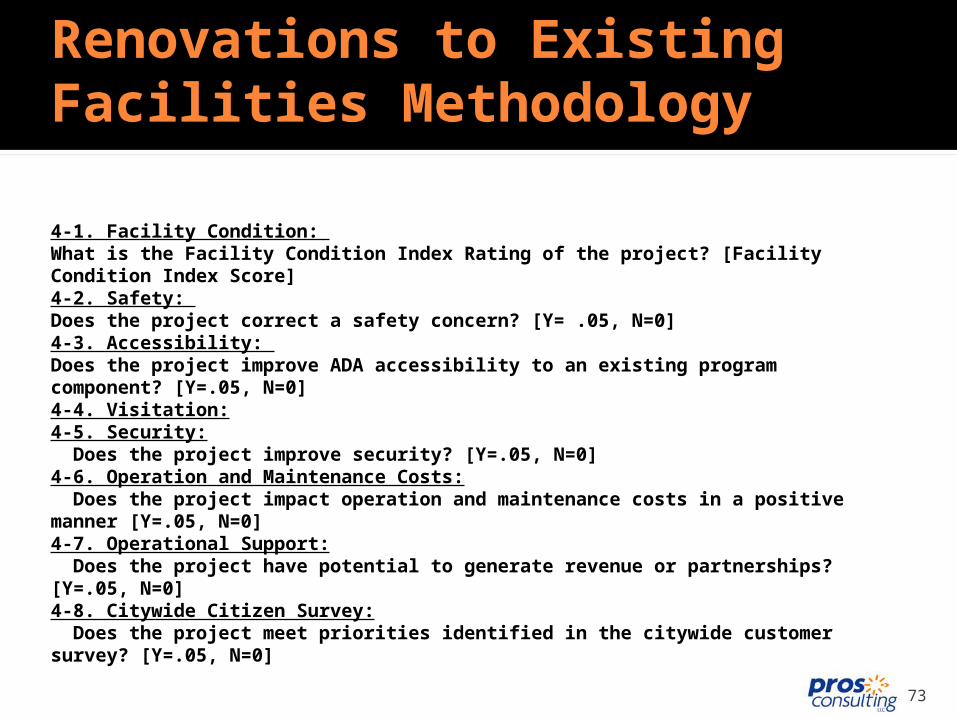
Renovations to Existing Facilities Methodology
4-1. Facility Condition: What is the Facility Condition Index Rating of the project? [Facility Condition Index Score]4-2. Safety: Does the project correct a safety concern? [Y= .05, N=0] 4-3. Accessibility: Does the project improve ADA accessibility to an existing program component? [Y=.05, N=0] 4-4. Visitation:4-5. Security: Does the project improve security? [Y=.05, N=0]4-6. Operation and Maintenance Costs: Does the project impact operation and maintenance costs in a positive manner [Y=.05, N=0]4-7. Operational Support: Does the project have potential to generate revenue or partnerships? [Y=.05, N=0]4-8. Citywide Citizen Survey: Does the project meet priorities identified in the citywide customer survey? [Y=.05, N=0]

74
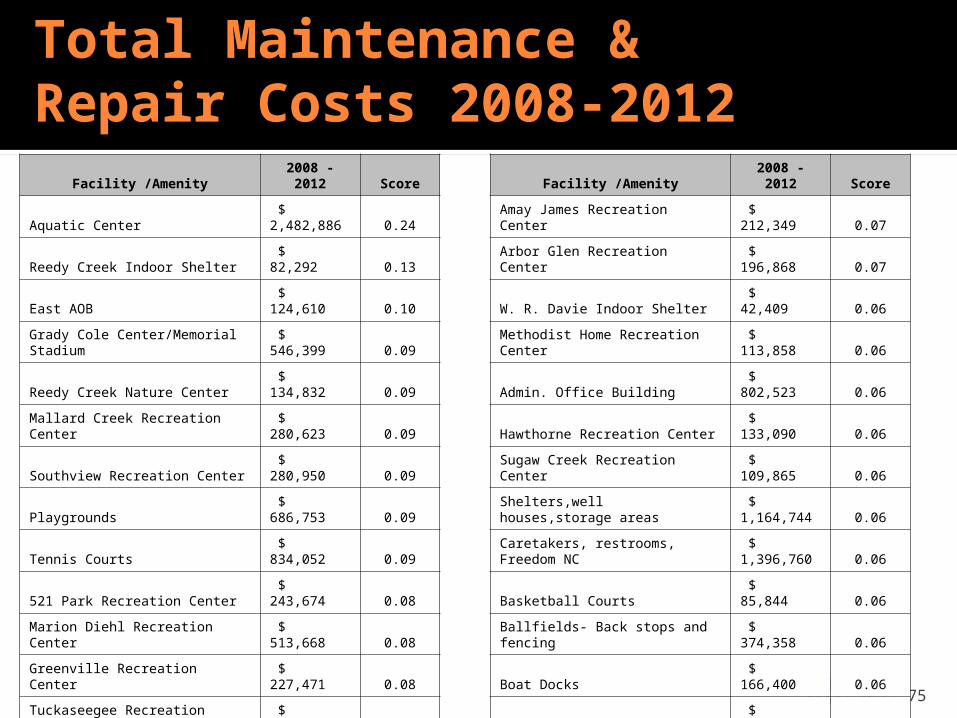
Total Maintenance & Repair Costs
75
Facility /Amenity 2008 - 2012 Score
Aquatic Center $ 2,482,886 0.24
Reedy Creek Indoor Shelter $ 82,292 0.13
East AOB $ 124,610 0.10
Grady Cole Center/Memorial Stadium $ 546,399 0.09
Reedy Creek Nature Center $ 134,832 0.09
Mallard Creek Recreation Center $ 280,623 0.09
Southview Recreation Center $ 280,950 0.09
Playgrounds $ 686,753 0.09
Tennis Courts $ 834,052 0.09
521 Park Recreation Center $ 243,674 0.08
Marion Diehl Recreation Center $ 513,668 0.08
Greenville Recreation Center $ 227,471 0.08
Tuckaseegee Recreation Center $ 149,212 0.08
Jetton Indoor Shelter $ 39,264 0.08
Armory Building $ 171,099 0.08
Veterans Indoor Shelter $ 60,463 0.08
Col. Francis Beatty Indoor Shelter $ 54,293 0.08
Central AOB $ 99,529 0.08
Naomi Drenan Recreation Center $ 147,208 0.08
West Charlotte Recreation Center $ 139,157 0.07
Facility /Amenity 2008 - 2012 Score
Amay James Recreation Center $ 212,349 0.07
Arbor Glen Recreation Center $ 196,868 0.07
W. R. Davie Indoor Shelter $ 42,409 0.06
Methodist Home Recreation Center $ 113,858 0.06
Admin. Office Building $ 802,523 0.06
Hawthorne Recreation Center $ 133,090 0.06
Sugaw Creek Recreation Center $ 109,865 0.06
Shelters,well houses,storage areas $ 1,164,744 0.06
Caretakers, restrooms, Freedom NC $ 1,396,760 0.06
Basketball Courts $ 85,844 0.06
Ballfields- Back stops and fencing $ 374,358 0.06
Boat Docks $ 166,400 0.06
Historic Sites $ 89,902 0.06
Mahlon Adams Pavilion $ 32,729 0.05
Albemarle Recreation Center $ 156,862 0.05
Ray's Splash Planet $ 122,291 0.05
Grady Cole Center/Memorial Stadium $ 281,376 0.05
Latta Nature Center $ 46,512 0.05
W. R. Davie Indoor Shelter $ 30,305 0.05
Waymer Recreation Center $ 70,194 0.04
Total Maintenance & Repair Costs 2008-2012
76
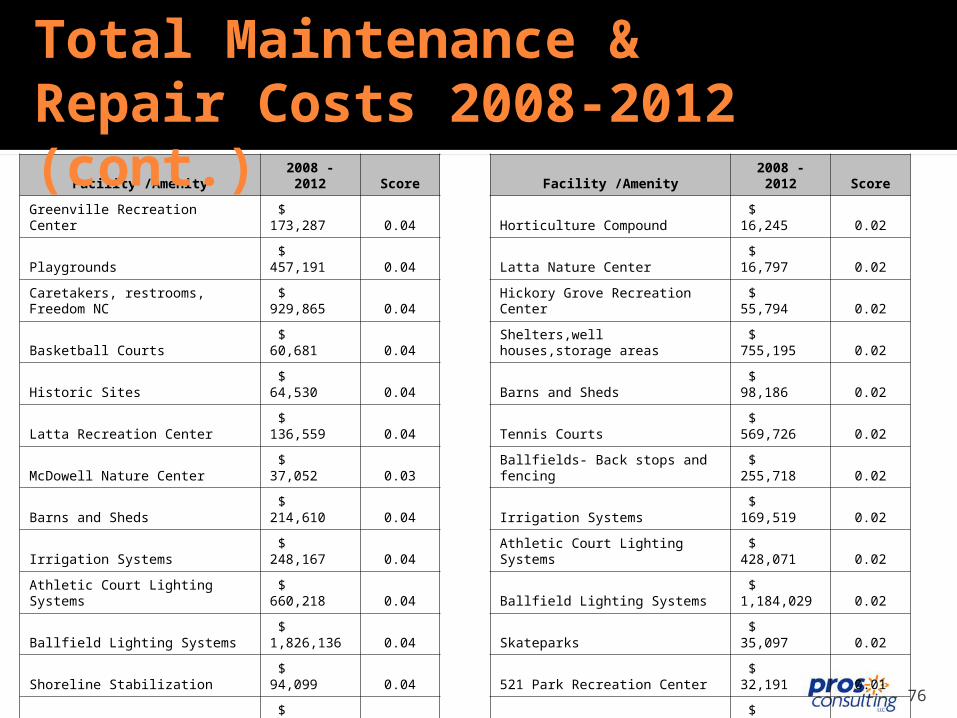
Facility /Amenity 2008 - 2012 Score
Greenville Recreation Center $ 173,287 0.04
Playgrounds $ 457,191 0.04
Caretakers, restrooms, Freedom NC $ 929,865 0.04
Basketball Courts $ 60,681 0.04
Historic Sites $ 64,530 0.04
Latta Recreation Center $ 136,559 0.04
McDowell Nature Center $ 37,052 0.03
Barns and Sheds $ 214,610 0.04
Irrigation Systems $ 248,167 0.04
Athletic Court Lighting Systems $ 660,218 0.04
Ballfield Lighting Systems $ 1,826,136 0.04
Shoreline Stabilization $ 94,099 0.04
Skateparks $ 30,000 0.04
Reedy Creek Nature Center $ 48,576 0.03
Methodist Home Recreation Center $ 86,334 0.03
Hawthorne Recreation Center $ 59,022 0.03
Bette Rae Thomas Recreation Center $ 138,264 0.02
Veterans Indoor Shelter $ 16,543 0.02
Facility /Amenity 2008 - 2012 Score
Horticulture Compound $ 16,245 0.02
Latta Nature Center $ 16,797 0.02
Hickory Grove Recreation Center $ 55,794 0.02
Shelters,well houses,storage areas $ 755,195 0.02
Barns and Sheds $ 98,186 0.02
Tennis Courts $ 569,726 0.02
Ballfields- Back stops and fencing $ 255,718 0.02
Irrigation Systems $ 169,519 0.02
Athletic Court Lighting Systems $ 428,071 0.02
Ballfield Lighting Systems $ 1,184,029 0.02
Skateparks $ 35,097 0.02
521 Park Recreation Center $ 32,191 0.01
Oaklawn Recreation Center $ 50,315 0.01
Tom Sykes Recreation Center $ 32,514 0.01
Latta Recreation Center $ 16,501 0.01
TOTAL $21,924,706 0.14
Total Maintenance & Repair Costs 2008-2012 (cont.)
77
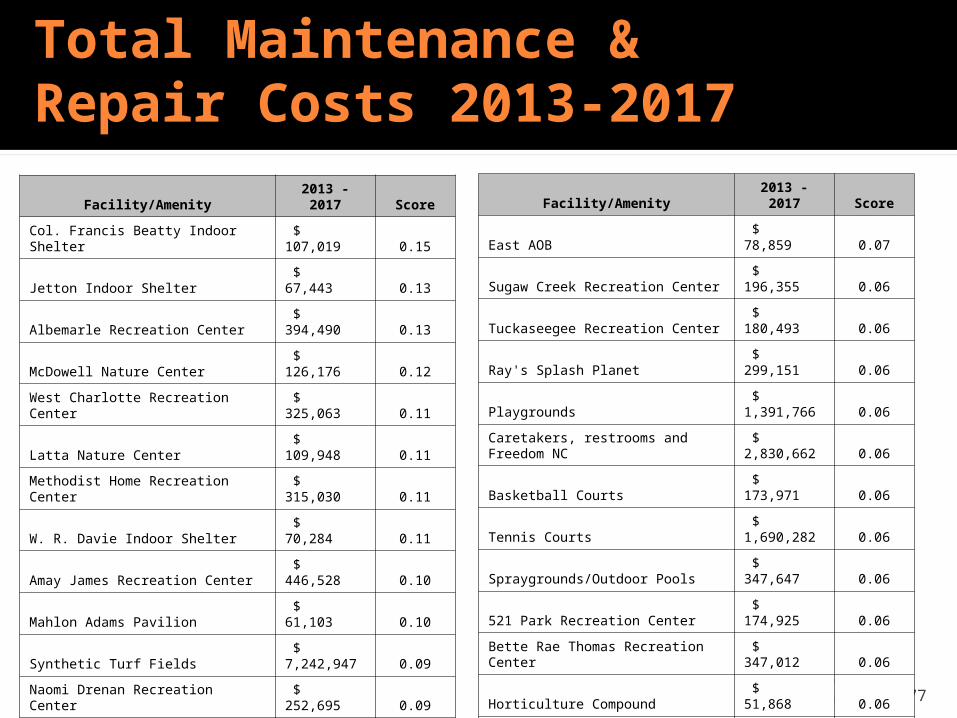
Facility/Amenity 2013 - 2017 Score
Col. Francis Beatty Indoor Shelter $ 107,019 0.15
Jetton Indoor Shelter $ 67,443 0.13
Albemarle Recreation Center $ 394,490 0.13
McDowell Nature Center $ 126,176 0.12
West Charlotte Recreation Center $ 325,063 0.11
Latta Nature Center $ 109,948 0.11
Methodist Home Recreation Center $ 315,030 0.11
W. R. Davie Indoor Shelter $ 70,284 0.11
Amay James Recreation Center $ 446,528 0.10
Mahlon Adams Pavilion $ 61,103 0.10
Synthetic Turf Fields $ 7,242,947 0.09
Naomi Drenan Recreation Center $ 252,695 0.09
Tom Sykes Recreation Center $ 282,211 0.08
Hickory Grove Recreation Center $ 276,999 0.08
Oaklawn Recreation Center $ 399,473 0.08
Admin. Office Building $ 902,648 0.07
Aquatic Center $ 751,997 0.07
Boat Docks $ 202,448 0.07
Armory Building $ 213,944 0.07
Facility/Amenity 2013 - 2017 Score
East AOB $ 78,859 0.07
Sugaw Creek Recreation Center $ 196,355 0.06
Tuckaseegee Recreation Center $ 180,493 0.06
Ray's Splash Planet $ 299,151 0.06
Playgrounds $ 1,391,766 0.06
Caretakers, restrooms and Freedom NC $ 2,830,662 0.06
Basketball Courts $ 173,971 0.06
Tennis Courts $ 1,690,282 0.06
Spraygrounds/Outdoor Pools $ 347,647 0.06
521 Park Recreation Center $ 174,925 0.06
Bette Rae Thomas Recreation Center $ 347,012 0.06
Horticulture Compound $ 51,868 0.06
Reedy Creek Nature Center $ 85,185 0.06
Southview Recreation Center $ 248,757 0.06
Reedy Creek Indoor Shelter $ 32,645 0.05
Hawthorne Recreation Center $ 112,019 0.05
Arbor Glen Recreation Center $ 137,598 0.05
Mallard Creek Recreation Center $ 208,545 0.05
Marion Diehl Recreation Center $ 258,632 0.05
Total Maintenance & Repair Costs 2013-2017

78
Facility/Amenity 2013 - 2017 Score
Shelters, well houses and storage areas $ 2,385,050 0.04
Barns and sheds $ 434,928 0.04
Ballfields - Back stops and fencing $ 766,574 0.04
Irrigation Systems $ 508,172 0.04
Athletic Field Lighting Systems $ 1,324,058 0.04
Ballfield Lighting Systems $ 3,662,283 0.04
Shoreline Stabilization $ 224,921 0.04
Skateparks $ 321,161 0.04
Historic Sites $ 187,887 0.04
Central AOB $ 41,547 0.03
Veterans Indoor Shelter $ 22,317 0.03
Grady Cole Center/Memorial Stadium $ 276,764 0.02
Greenville Recreation Center $ 76,819 0.02
Latta Recreation Center $ 26,093 0.01
Total $31,653,392
Total Maintenance & Repair Costs 2013-2017 (cont.)

79
80
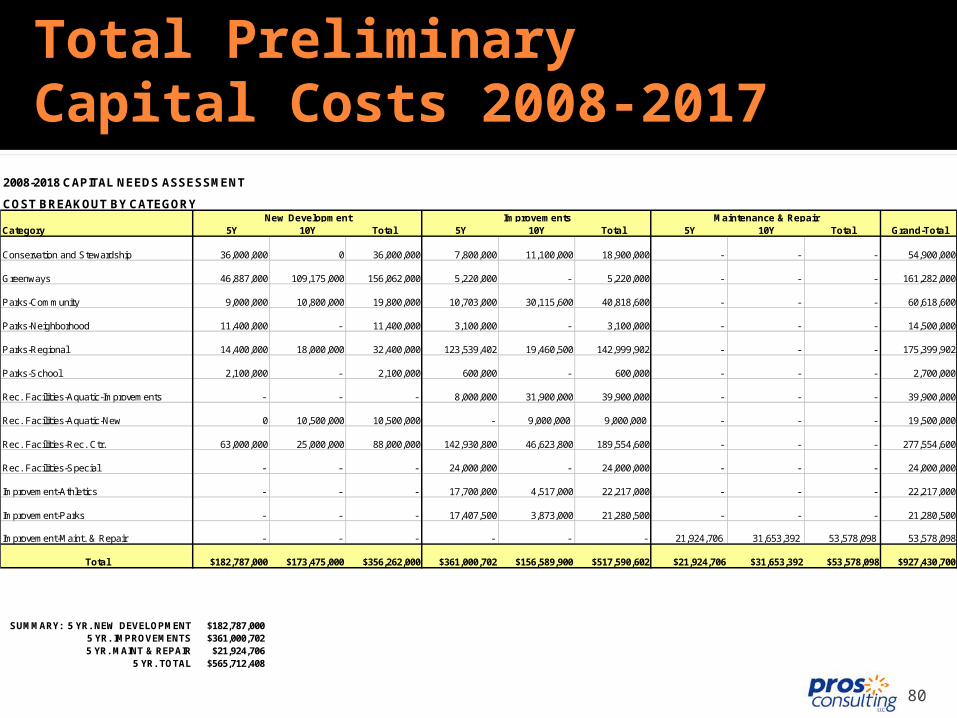
Total Preliminary Capital Costs 2008-2017
2008-2018 CAPITAL NEEDS ASSESSMENT
COST BREAKOUT BY CATEGORY
Category 5Y 10Y Total 5Y 10Y Total 5Y 10Y Total Grand-Total
Conservation and Stewardship 36,000,000 0 36,000,000 7,800,000 11,100,000 18,900,000 - - - 54,900,000
Greenways 46,887,000 109,175,000 156,062,000 5,220,000 - 5,220,000 - - - 161,282,000
Parks-Community 9,000,000 10,800,000 19,800,000 10,703,000 30,115,600 40,818,600 - - - 60,618,600
Parks-Neighborhood 11,400,000 - 11,400,000 3,100,000 - 3,100,000 - - - 14,500,000
Parks-Regional 14,400,000 18,000,000 32,400,000 123,539,402 19,460,500 142,999,902 - - - 175,399,902
Parks-School 2,100,000 - 2,100,000 600,000 - 600,000 - - - 2,700,000
Rec. Facilities-Aquatic-Improvements - - - 8,000,000 31,900,000 39,900,000 - - - 39,900,000
Rec. Facilities-Aquatic-New 0 10,500,000 10,500,000 - 9,000,000 9,000,000 - - - 19,500,000
Rec. Facilities-Rec. Ctr. 63,000,000 25,000,000 88,000,000 142,930,800 46,623,800 189,554,600 - - - 277,554,600
Rec. Facilities-Special - - - 24,000,000 - 24,000,000 - - - 24,000,000
Improvement-Athletics - - - 17,700,000 4,517,000 22,217,000 - - - 22,217,000
Improvement-Parks - - - 17,407,500 3,873,000 21,280,500 - - - 21,280,500
Improvement-Maint. & Repair - - - - - - 21,924,706 31,653,392 53,578,098 53,578,098
Total $182,787,000 $173,475,000 $356,262,000 $361,000,702 $156,589,900 $517,590,602 $21,924,706 $31,653,392 $53,578,098 $927,430,700
SUMMARY: 5 YR. NEW DEVELOPMENT $182,787,000 5 YR. IMPROVEMENTS $361,000,702 5 YR. MAINT & REPAIR $21,924,706
5 YR. TOTAL $565,712,408
New Development Improvements Maintenance & Repair

81
Questions and Comments?