1 Performance Management Conference Conference(ORS/ORF) January 21, 2004 .
42
1 Performance Management Performance Management Conference Conference (ORS/ORF) (ORS/ORF) January 21, 2004 January 21, 2004 http://www.nih.gov/od/ors/od/oqm/pm/index_pm.htm
-
Upload
clarissa-brittney-mcbride -
Category
Documents
-
view
214 -
download
0
Transcript of 1 Performance Management Conference Conference(ORS/ORF) January 21, 2004 .
1
Performance Performance ManagementManagement ConferenceConference(ORS/ORF)(ORS/ORF)
January 21, 2004January 21, 2004
http://www.nih.gov/od/ors/od/oqm/pm/index_pm.htm
2
WelcomeWelcome
Customers ORS Advisory Committee members ORS/ORF PM teams ORS/ORF personnel NIH sponsors/colleagues Visitors

3
Mr. Steve FiccaMr. Steve FiccaAssociate Director for Research ServicesAssociate Director for Research Services
4
Purpose of Performance Purpose of Performance Management (PM)Management (PM) Purpose:
Institutionalize a process to continually improve the performance of the services delivered to the NIH.
Demonstrate the degree to which the ORS/ORF service providers are adding value
Identify new ways to improve service performance even further
President’s Management Agenda – Budget and Performance Integration, and Competitive Sourcing

5
Context: Some FY03-04 Business Context: Some FY03-04 Business RealitiesRealities
Competitive sourcing (A-76) New organization (ORFDO) Reorganization within both ORS and ORF Security Hiring freeze

6
Number of Improvements by TypeNumber of Improvements by Type
OQM developed systematic method to gather and quantify improvements during FY03
24 quantifiable improvements achieved to date: Provide Print and Digital Media Services reduced
their space by several 1,000 sq ft for estimated cost avoidance of $200k
Provide Library Services has maintained the unit cost of an “information unit” while the number of units rose by 35%
Conduct Collaborative Research had a 16% increase in the number of professional presentations delivered
Provide Basic Animal Life support had a 113% increase in animal holding capacity through building renovations and purchasing new cages

7
Number of Improvements by TypeNumber of Improvements by Type
• Provide Animal Research Services had an 18% increase in ICU utilization through improved record keeping
• Provide Administrative Services reduced FOIA cycle time by 35 days through enhancing staff competencies
8
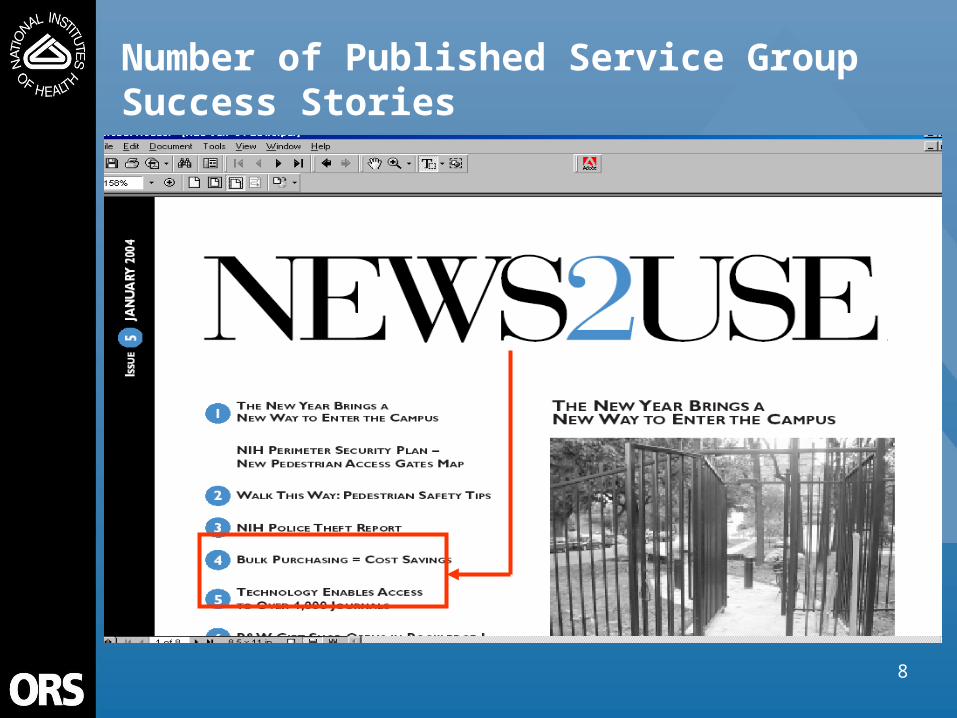
Number of Published Service Group Success Stories

9
Number of Published Service Group Number of Published Service Group Success StoriesSuccess Stories

10
Mr. Antonio R. RodriguezMr. Antonio R. RodriguezAssistant Director for Quality Management Assistant Director for Quality Management Office of Research ServicesOffice of Research Services
11
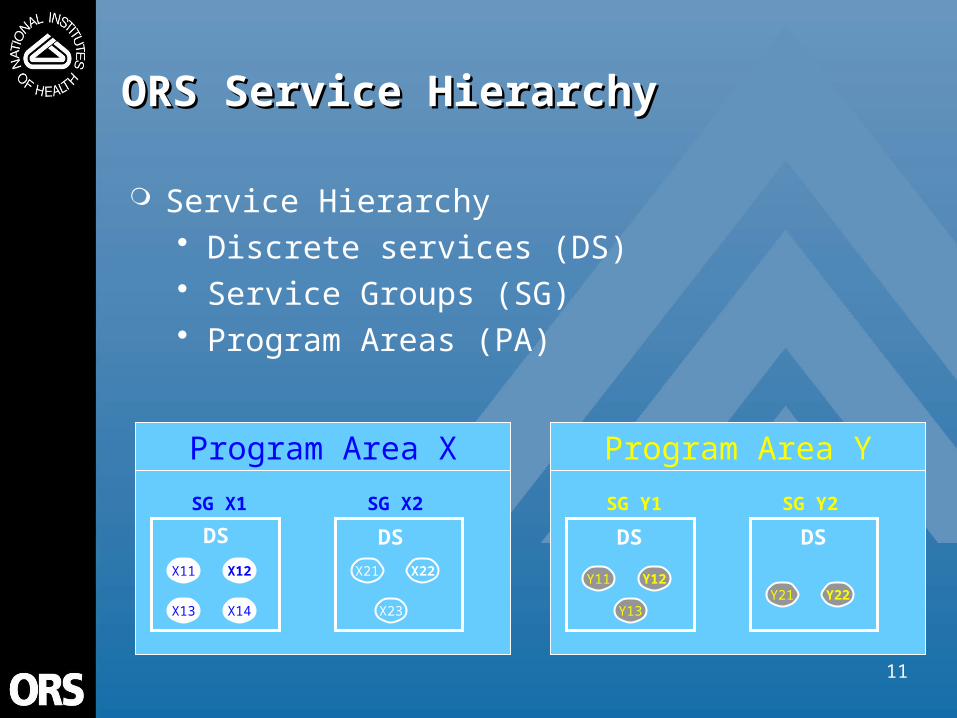
Program Area X
X11 X12
X13 X14
DS
SG X1
ORS Service HierarchyORS Service Hierarchy
Service Hierarchy Discrete services (DS) Service Groups (SG) Program Areas (PA)
Y11 Y12
Y13
SG Y1
Y21 Y22
SG Y2
Program Area Y
DS DS
X21 X22
SG X2
DS
X23

12*Adapted from “Planning Is Dead, Long Live Planning, “ Jos. Fuller, Across the Board, March 1998
Today’s Agencies Are Expected Today’s Agencies Are Expected to Be:to Be:
• Competitive (sourcing)
• Accountable
• Customer-friendly
• Fiscally responsible External world is highly unstable so planning systems must deal
with uncertainty1. Strategy is a Hypothesis
2. Strategy is a Dynamic Process
3. Strategy is Everyone’s Job
4. Organizations are systems that must sense, experiment, learn, and adapt
5. Strategy is an articulation of the direction we want to take an organization
Why do we need to do this? Why do we need to do this?

13
PMPM Overall Process Overall Process
Day-to-day(PM Framework)
Day-to-day(PM Framework)
On-going findings & recommendationsOn-going findings
& recommendations
On-going implementation/
improvement
Business Plans
(Budget/ABM)
Business Function

14
Performance Management Plan (PMP)
DS3: Perform animal model preservation and characterization
DS2: Conduct animal health surveillance
DS1: Conduct animal diagnostic services
Discrete Services
Division Approval/Date: Associate Director Approval/Date:
DS4: Provide clinical animal research services
Provide animal research services
Service Group
Service Strategy
Animal Research Services facilitates the NIH intramural research effort by providing cost-effective, reliable, and specialized research support services delivered by an experienced, responsive, and professional staff with a reputation for high quality work.
Value Proposition
Team Leader
To facilitate the NIH intramural research effort, we conduct diagnostic evaluations, monitor animal health status, perform surgery, provide intensive care, operate a pharmacy, and preserve and evaluate animal models for future research use. We will focu
Strategy Description
Team Members
Dr. James Crowell and Dr. Charmaine Foltz
Dr. John Bacher, Dr. Michael Eckhaus, Dr. Myrna Mandel, Fran Benedetti, Karen Sillers, Thom Spencer, Dr. William Rall, Dr. Carl Hansen, Pat Schmidt, Dr. Tanya Burkholder
Operational Excellence
Customer Intimacy
Product Leadership
Growth
Sustain
Harvest
15
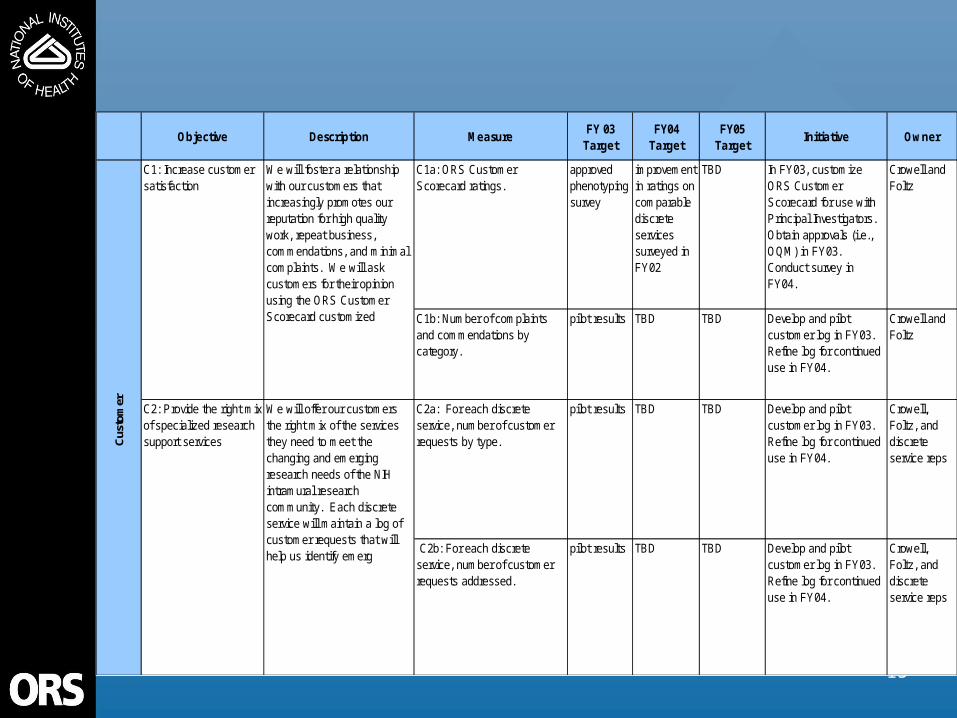
Objective Description MeasureFY 03
TargetFY04
TargetFY05
TargetInitiative Owner
C1a: ORS Customer Scorecard ratings.
approved phenotyping survey
improvement in ratings on comparable discrete services surveyed in FY02
TBD In FY03, customize ORS Customer Scorecard for use with Principal Investigators. Obtain approvals (i.e., OQM) in FY03. Conduct survey in FY04.
Crowell and Foltz
C1b: Number of complaints and commendations by category.
pilot results TBD TBD Develop and pilot customer log in FY03. Refine log for continued use in FY04.
Crowell and Foltz
C2a: For each discrete service, number of customer requests by type.
pilot results TBD TBD Develop and pilot customer log in FY03. Refine log for continued use in FY04.
Crowell, Foltz, and discrete service reps
C2b: For each discrete service, number of customer requests addressed.
pilot results TBD TBD Develop and pilot customer log in FY03. Refine log for continued use in FY04.
Crowell, Foltz, and discrete service reps
Cus
tom
er
C1: Increase customer satisfaction
We will foster a relationship with our customers that increasingly promotes our reputation for high quality work, repeat business, commendations, and minimal complaints. We will ask customers for their opinion using the ORS Customer Scorecard customized
C2: Provide the right mix of specialized research support services
We will offer our customers the right mix of the services they need to meet the changing and emerging research needs of the NIH intramural research community. Each discrete service will maintain a log of customer requests that will help us identify emerg

16
Performance ManagementPerformance ManagementRoles and Responsibilities Roles and Responsibilities
ORS Executive Board (ORSEB)ORS Management Council (ORSMC)PM Team LeaderPM Team MembersOffice of Quality Management (OQM)OQM Sponsored Consultants
17
What Do Our Customers Really What Do Our Customers Really Want?Want?
(Outcome or “End -State”)
What are we really trying to accomplish as a Service Group?
What outcomes are we offering customers with our Service Group /Discrete Service offerings?

18
Customers Needs
Satisfied
Innovation Cycle
“Innovation”
DevelopServices
Identify Customers
/CreateServiceOffering
Operations Cycle
“Operational Excellence”
Communicate the Services
Deliver the Products / Services
Service Cycle
“Service Quality”
Service the
Customer
Customers Needs
Identified
Generic Value Chain ModelGeneric Value Chain Model
Internal Business ProcessInternal Business Process
EXAMPLE

19
What is Your Value Chain?What is Your Value Chain?
How do we get new work? Where does it come from?
What processes do we need to perform really well?
How do we complete the work?
How do we deliver it to our clients/ customers?
How can we improve our processes to meet attributes identified in the VP?

20
PHARMACY
VRP Pharmacy Vendors ProcurementIC Customer
Place Order Review Order
Human,Veterinary, or
ControlledDrug
OrderedVariousVendors
Order Placed toContracted Vendor
Complete DEA-22Form
ProcessRequest
ResearcherReceives Drug
PlacesRequest
Human orVeterinary
Log of Usage
Receipt sent toPharmacy for
Tracking Purposesand Log isDeveloped
Receipt sent toProcurement
ReceivedReceives Order
and Log forTracking
Order Placedto Vendor
User must haveDEA Registrationand CompletedDEA 22 Form
Category 1Controlled
DrugRequest
VeterinaryDrug
Veterinary
HumanHuman Category 2 Drug
Human Drug
Human Category3-5 Drug
21
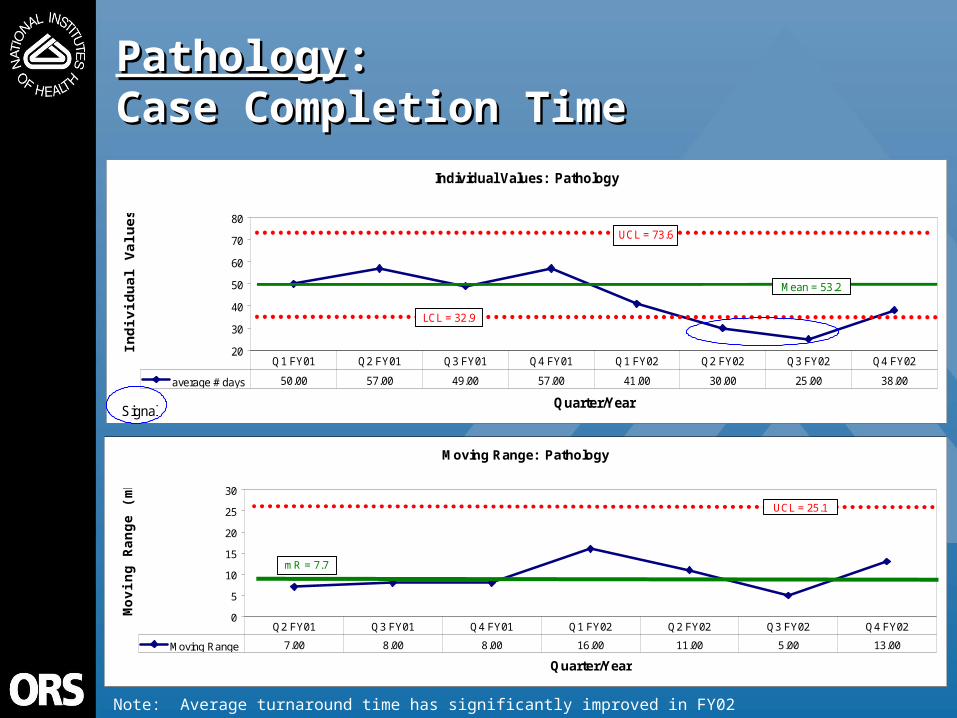
PathologyPathology::Case Completion TimeCase Completion Time
Note: Average turnaround time has significantly improved in FY02
FALSE
if 2/3 or more of the moving ranges are below mean moving rangeFALSE
Moving Range: Pathology
0
5
10
15
20
25
30
Quarter/Year
Mo
vin
g R
an
ge
(m
R)
Moving Range 7.00 8.00 8.00 16.00 11.00 5.00 13.00
Q2 FY01 Q3 FY01 Q4 FY01 Q1 FY02 Q2 FY02 Q3 FY02 Q4 FY02
UCL = 25.1
mR = 7.7
Individual Values: Pathology
20
30
40
50
60
70
80
Quarter/Year
Ind
ivid
ual
Val
ues
(X)
average # days 50.00 57.00 49.00 57.00 41.00 30.00 25.00 38.00
Q1 FY01 Q2 FY01 Q3 FY01 Q4 FY01 Q1 FY02 Q2 FY02 Q3 FY02 Q4 FY02
Mean = 53.2
LCL = 32.9
UCL = 73.6
Signal

22
What Improvements Can Be Made in What Improvements Can Be Made in Our Internal Processes?Our Internal Processes? What do we need to do
better to make our clients/ customers happy?
Can we be more efficient or more effective at what we do?

23
Learning & GrowthLearning & Growth
Typical Learning & Growth ObjectivesTypical Learning & Growth Objectives
Skills & CompetenciesKnowledge &
Technology AssetsClimate for
Action
• Strategic skills
• Training levels
• Core competencies
• Strategic technologies
• Strategic databases
• Experience capture
• Best practices
• Patents, copyrights
• Leadership
• Accountability / empowerment
• Alignment
• Results Oriented
• Teaming
24
What do our employees need to What do our employees need to help us achieve our goals?help us achieve our goals?
What Skills Need to be Addressed?
What will the Knowledge and skills needs be over the next 5 years?
Do we need to train/recruit/contract out?

25
Discrete Service
Unit Definition
# Units Total Direct Cost Unit Cost
Perform veterinary surgery
# of surgeries 1,590 $899,530 $566
Provide pathology services
# of animals submitted
2,498 $1,068,873 $428
Operate acute and intensive care animal service
total # tests, tasks, and procedures
18,171 $940,766 $52
Conduct laboratory services
# of submission (bacteriology)
40,362 $1,051,406 $26
Provide veterinary pharmacy services
# Items 20,954 $144,402 $7
Conduct animal health surveillance
# submissions (serology)
25,411 $1,736,471 $68
Unit CostUnit Cost
26
What is in it for the NIH and What is in it for the NIH and ORS?ORS?
• Systematic improvement of performance
• Information for Decision making• Evidence of performance levels• Justification for resource needs• Greater personnel involvement
(decision-making, ownership, pursuing improvement)

27
Performance Management Performance Management and A-76and A-76
Better Performance Data Better PWS Better PWS, better:
Competition (e.g., less room for confusion)
Better QASP and overall management of the contract

28
Every function, before facing an A-76 competition, should:
Identify the boundaries of its “span of contribution / value chain,” and manage it, cross-functionally
Continually find and implement better ways to do the work
Evaluate every position before filling it, and determine whether the work should be contracted out
Must be as efficient and effective as possible, so future MEOs do not have to be drastically different to win
Performance Management and A-76Performance Management and A-76 (cont.)(cont.)

29
Data / Results Data / Results

30
Percent of Service Groups with Percent of Service Groups with completed PMPs completed PMPs (as of Quarter 1 FY04)(as of Quarter 1 FY04)
Value Proposition
Strategy Description
Objectives Measures Targets
ORS - 33 teamsNumber of Teams 27 27 28 28 28
Percentage 82% 82% 85% 85% 85%
ORF- 13 teamsNumber of Teams 10 10 9 9 8
Percentage 77% 77% 69% 69% 62%
Overall - 46 teamsNumber of Teams 37 37 37 37 36
Percentage 80% 80% 80% 80% 78%

Percent of Teams with PMPs Reviewed Percent of Teams with PMPs Reviewed by Program Managementby Program Management (as of Quarter 1 (as of Quarter 1 FY04)FY04)
ORS Total Number of Teams 33 PMP’s Reviewed by Management 24
73% ORF
Total Number of Teams 13 PMP’s Reviewed Management 9
69% Overall
Total Number of Teams 46 PMP’s Reviewed by Management 33
72%

Percent of service groups with ongoing Percent of service groups with ongoing data collection data collection (as of Quarter 1 FY04)(as of Quarter 1 FY04)
ORS Total Number of Teams 33 Teams with ongoing data collection 26
79% ORF
Total Number of Teams 13 Teams with ongoing data collection 6
46%
Overall Total Number of Teams 46 Teams with ongoing data collection 32
70%
33
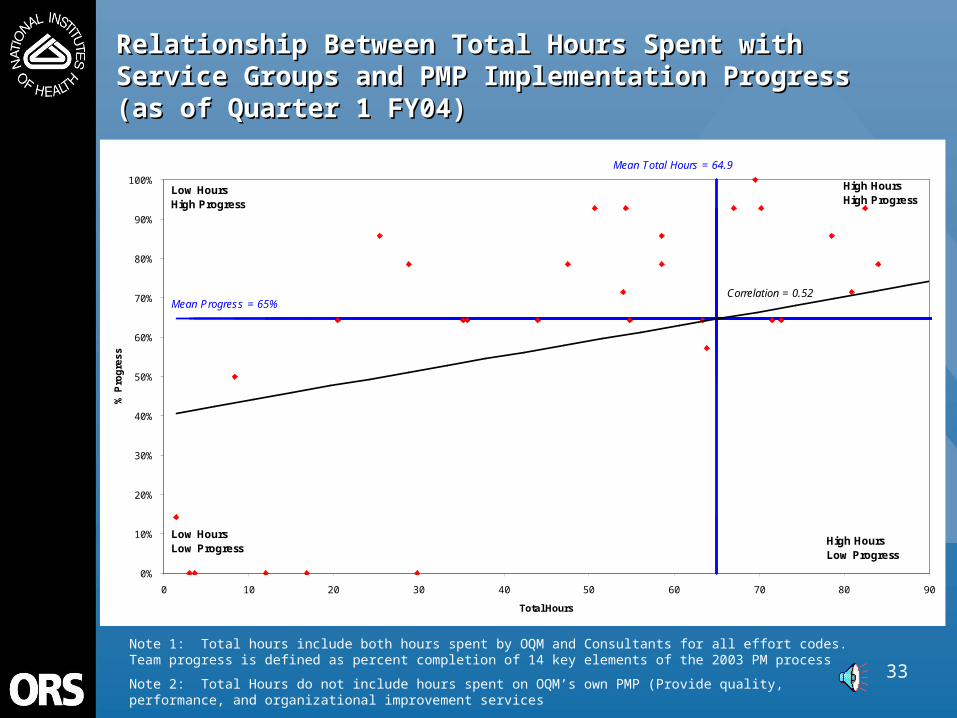
Relationship Between Total Hours Spent with Relationship Between Total Hours Spent with Service Groups and PMP Implementation Progress Service Groups and PMP Implementation Progress (as of Quarter 1 FY04)(as of Quarter 1 FY04)
Note 1: Total hours include both hours spent by OQM and Consultants for all effort codes. Team progress is defined as percent completion of 14 key elements of the 2003 PM process
Note 2: Total Hours do not include hours spent on OQM’s own PMP (Provide quality, performance, and organizational improvement services
0%
10%
20%
30%
40%
50%
60%
70%
80%
90%
100%
0 10 20 30 40 50 60 70 80 90
Total Hours
% P
rog
res
s
Low HoursLow Progress
Low HoursHigh Progress
High HoursHigh Progress
High HoursLow Progress
Mean Progress = 65%
Mean Total Hours = 64.9
Correlation = 0.52

34
Number of OQM data analyses services Number of OQM data analyses services provided provided (as of Quarter 1 FY04)(as of Quarter 1 FY04)
33 Total
Types of Data Analyses Provided: Assisted DFP in developing benchmark study Analyzed cycle time data for Department of
Veterinary Resources (DVR) nutrition program Analyzed cycle time data for DVR pharmacy
program Analyzed Process data for DVR histopathologies With Division of Facilities Planning (DFP),
developed large scale project scheduling system to track project status
35
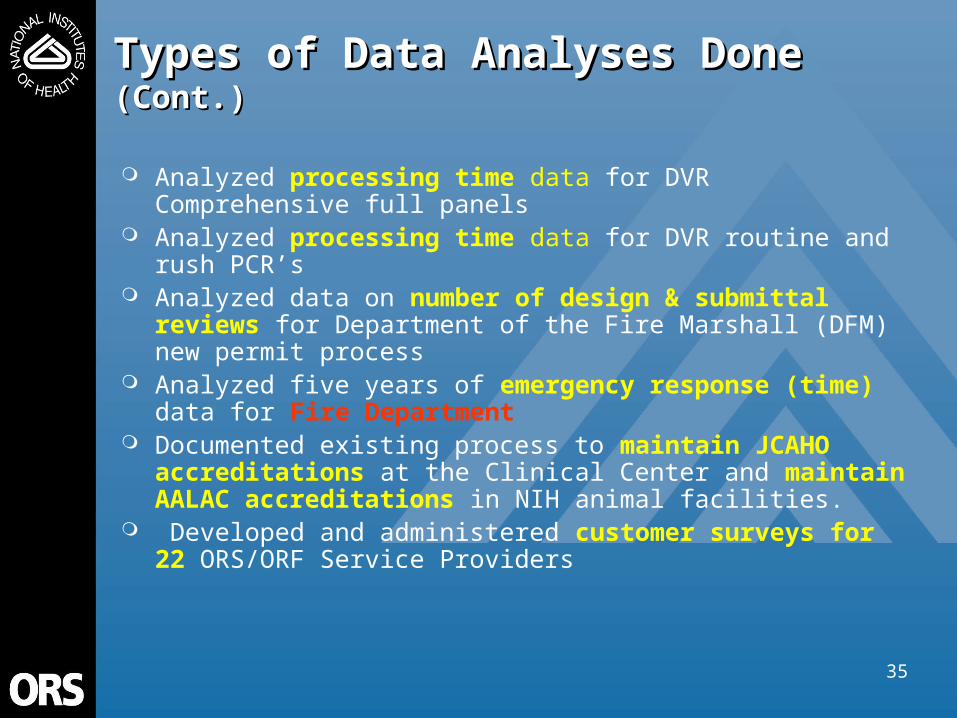
Types of Data Analyses Done Types of Data Analyses Done (Cont.)(Cont.)
Analyzed processing time data for DVR Comprehensive full panels
Analyzed processing time data for DVR routine and rush PCR’s
Analyzed data on number of design & submittal reviews for Department of the Fire Marshall (DFM) new permit process
Analyzed five years of emergency response (time) data for Fire Department
Documented existing process to maintain JCAHO accreditations at the Clinical Center and maintain AALAC accreditations in NIH animal facilities.
Developed and administered customer surveys for 22 ORS/ORF Service Providers
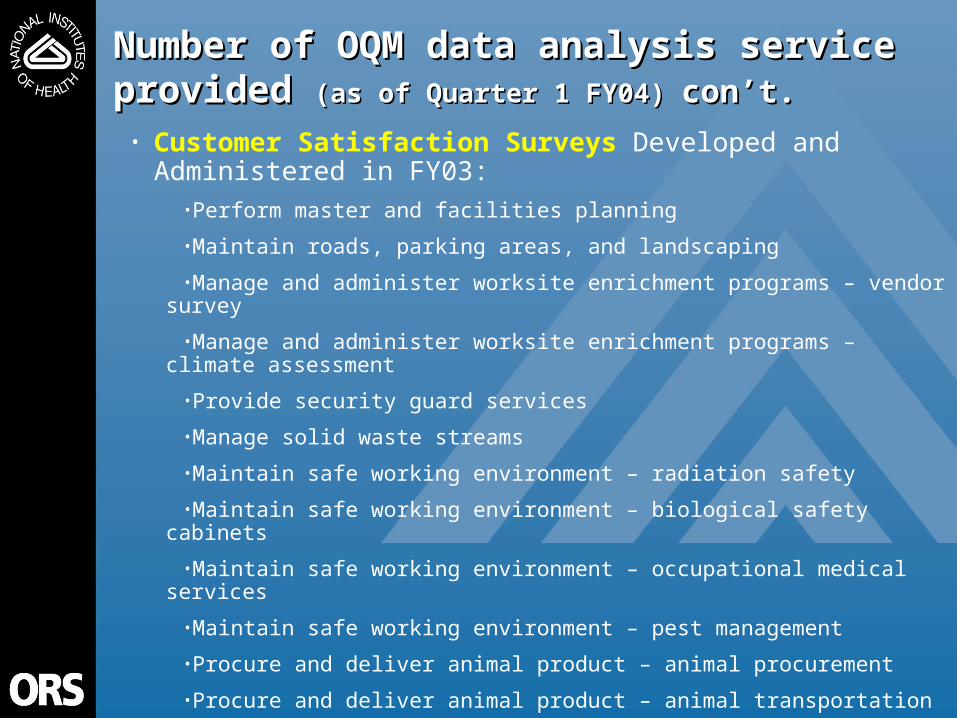
• Customer Satisfaction Surveys Developed and Administered in FY03:
•Perform master and facilities planning
•Maintain roads, parking areas, and landscaping
•Manage and administer worksite enrichment programs – vendor survey
•Manage and administer worksite enrichment programs – climate assessment
•Provide security guard services
•Manage solid waste streams
•Maintain safe working environment – radiation safety
•Maintain safe working environment – biological safety cabinets
•Maintain safe working environment – occupational medical services
•Maintain safe working environment – pest management
•Procure and deliver animal product – animal procurement
•Procure and deliver animal product – animal transportation
•Provide animal research services – phenotyping
•Provide library services – translations
Number of OQM data analysis service Number of OQM data analysis service provided provided (as of Quarter 1 FY04) (as of Quarter 1 FY04) con’t.con’t.
Conclusion Conclusion andand
What Should Happen Next?What Should Happen Next?

38
Conclusion and Next Steps Significant progress achieved in FY03 in spite of
“additional” challenges (resource intensive) We need to raise the performance bar:
Every service group should contribute at least one verifiable “bottom-line” improvement such as evidence of:
Higher customer satisfaction Savings Cost avoidance Shortened cycle times Improved QOWL
• ORS Program Areas should have their own PMP and scorecards (cross-functional/service groups)
• ORF should continue to refine higher-level PMPs and scorecards
• ORS and ORF should report organization-wide performance results on an annual basis

39

40
41
Mr. Leonard TaylorMr. Leonard TaylorActing Director of Office of Research Acting Director of Office of Research Facilities, Development and OperationsFacilities, Development and Operations

42
Break
Concurrent Sessions Start at 9:15
ORS in rooms E1 and E2
ORF in room D