1 Pearson Research John T. Behrens,Ph.D. Pearson Center for Digital Data, Analytics, & Adaptive...
33
1 Pearson Research John T. Behrens,Ph.D. Pearson Center for Digital Data, Analytics, & Adaptive Learning 12 September, 2012
-
Upload
cori-bryan -
Category
Documents
-
view
213 -
download
0
Transcript of 1 Pearson Research John T. Behrens,Ph.D. Pearson Center for Digital Data, Analytics, & Adaptive...
1
Pearson Research
John T. Behrens,Ph.D.Pearson Center for Digital Data, Analytics, & Adaptive Learning12 September, 2012

Agenda
• Me• The centers• My Center• Two things we think about
Copyright © 2010 Pearson Education, Inc. or its affiliates. All rights reserved. 2
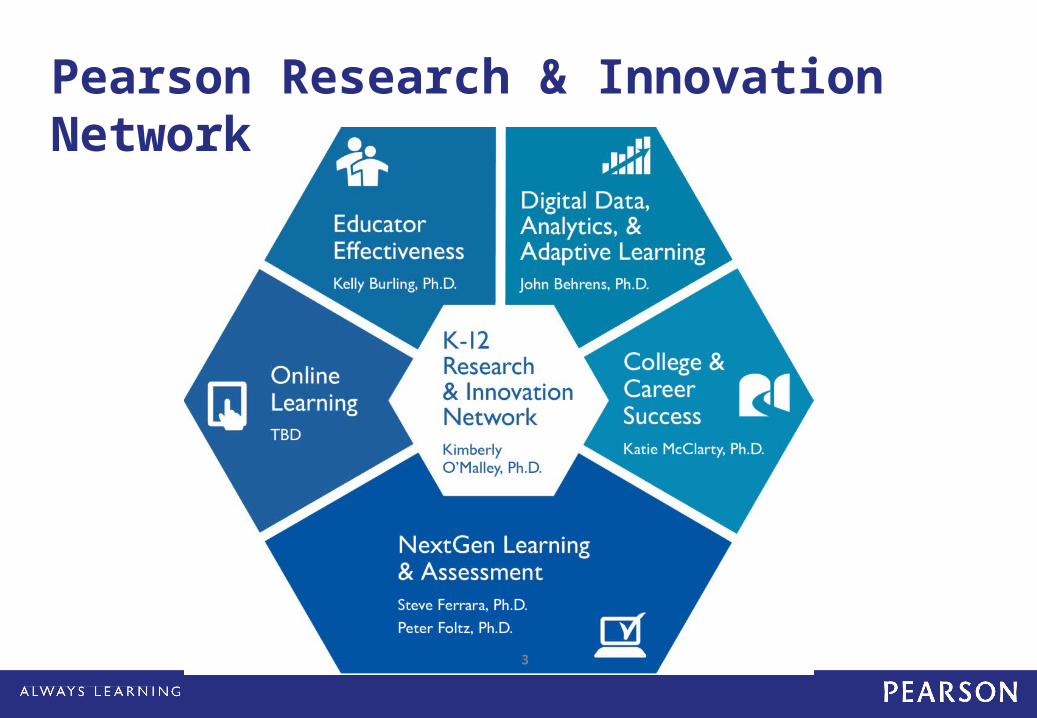
Pearson Research & Innovation Network
3

Foci of the Center
4 Copyright © 2012 Pearson Education, Inc. or its affiliates. Al
rights reserved.
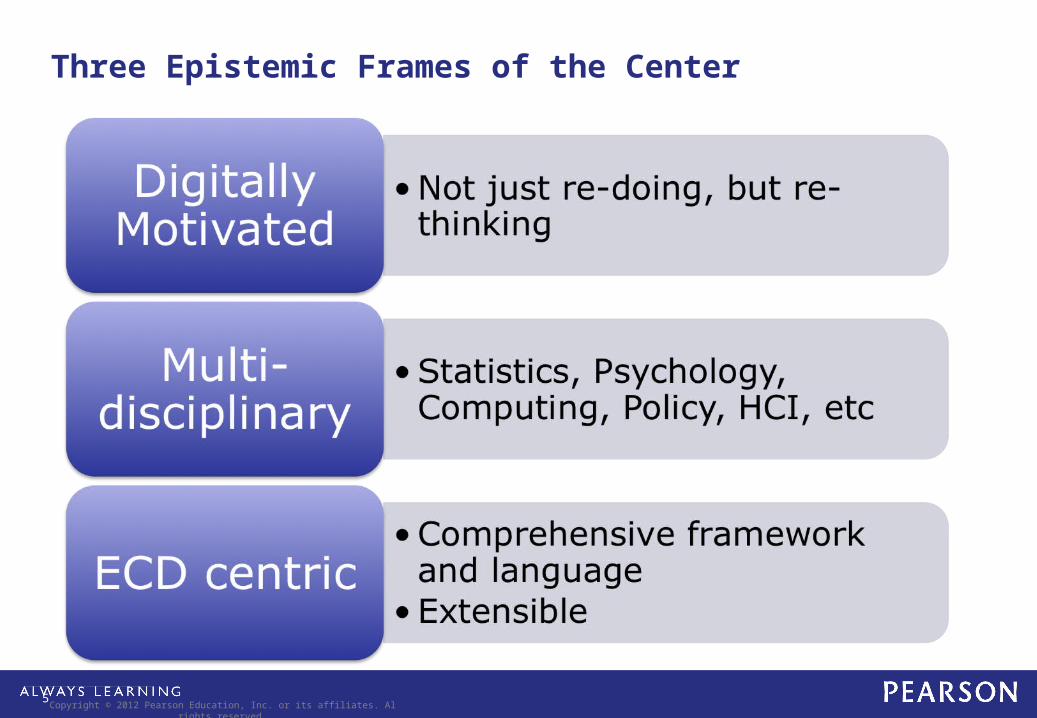
Three Epistemic Frames of the Center
5 Copyright © 2012 Pearson Education, Inc. or its affiliates. Al
rights reserved.

Four goals•Research•Communication•Product Vision•Capacity Building in Company and Field
6Copyright © 2012 Pearson Education, Inc. or its affiliates. Al
rights reserved.

7
How does a small center have big impact?
Copyright © 2012 Pearson Education, Inc. or its affiliates. Al rights reserved.

Idea 1
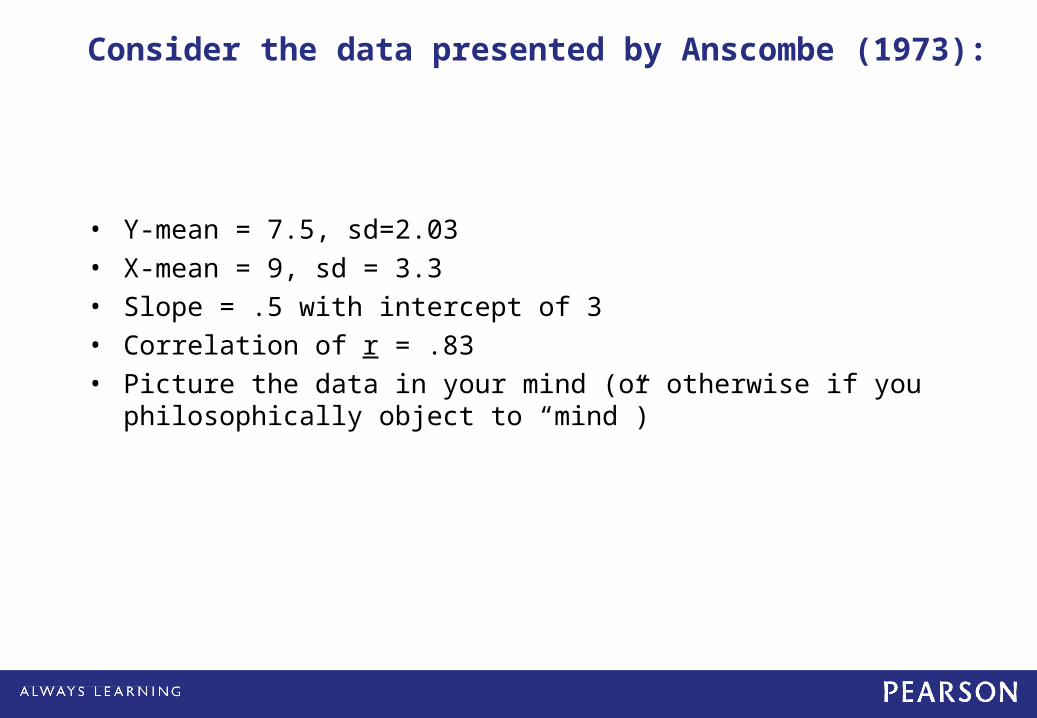
Consider the data presented by Anscombe (1973):
• Y-mean = 7.5, sd=2.03• X-mean = 9, sd = 3.3• Slope = .5 with intercept of 3• Correlation of r = .83• Picture the data in your mind (or otherwise if you
philosophically object to “mind”)

If you think the data look like this, then you are right

or, if you think the data look like this, then you are right

or, if you think the data look like this, then you are right

or, if you think the data look like this, then you are right

All of these patterns have the same algebraic summaries, but dramatically different data patterns!

Conclusion 1
• Algebraic summaries lie, so we need to use graphics!

Now, consider this small set of numbers which we may see in quiz scores.
• 1,1,2,2,3,3,4,4,5,5,5,5,6,6,6,6,6,6,7,7,7,7, 8,8,9,9,10,10,11,11
• Lets see how graphics can help.

Here is a histogram of the data:
Notice the structure of slight skew that we could not see in the listing of data.

Bin width = 1
Bin width = 2
Some more histograms of the same data

Bin width = 1.5,
intervals start at 1.
Bin width = 2,
intervals start at 1.
Even more histograms of the same data

Which is the real picture of the data?

Evolving Communication Framework
21 Copyright © 2012 Pearson Education, Inc. or its affiliates. Al
rights reserved.

Idea 2

A general adaptivity loop
Copyright © 2012 Pearson Education, Inc. or its affiliates. Al rights reserved.
23
100 90 80 70 60 50 40 30 40 50 Combine observations & Update Profile
If A and B then activity = Z
Give Activity& Collect WP
Look at Profile and choose Activity
Identify features & make observationsX1
X2
X3
X4
Xn
If A and B then X1 = 1
If C then X2 = “P”

CAT (in item paradigm)
Copyright © 2012 Pearson Education, Inc. or its affiliates. Al rights reserved.
24
100 90 80 70 60 50 40 30 40 50 Combine scores & Update Profile
Give Item & Collect Answer
Look at Profile and choose Activity
Identify correctness & make score
X1
X2
X3
X4
Xn
If A and B then X1 = 1
If C then X2 = “P”

The Practice Tutor
Copyright © 2012 Pearson Education, Inc. or its affiliates. Al rights reserved.
25
100 90 80 70 60 50 40 30 40 50 Combine observations & Update Profile
(To move in ZPD)
Give Activity & Collect Work
Look at Profile and choose Activity
Identify features & make observationX1
X2
X3
X4
Xn
If A and B then X1 = 1
If C then X2 = “P”

The Game
Copyright © 2012 Pearson Education, Inc. or its affiliates. Al rights reserved.
26
100 90 80 70 60 50 40 30 40 50 Combine observations & Update Profile
(To Maximize Motivation)
Give Activity & Collect Work
Look at Profile and choose Activity
Identify features & make observationX1
X2
X3
X4
Xn
If A and B then X1 = 1
If C then X2 = “P”
Wouldn’t it be interestingTo work at a company that did all these things?
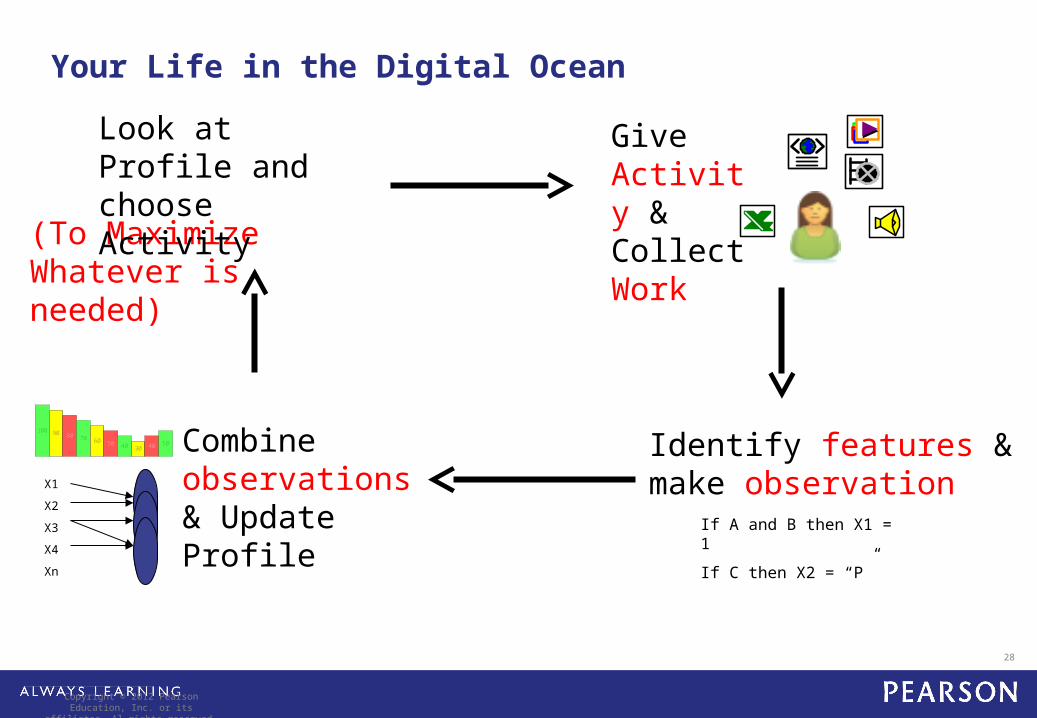
Your Life in the Digital Ocean
Copyright © 2012 Pearson Education, Inc. or its
affiliates. Al rights reserved.
28
100 90 80 70 60 50 40 30 40 50 Combine observations & Update Profile
(To Maximize Whatever is needed)
Give Activity & Collect Work
Look at Profile and choose Activity
Identify features & make observationX1
X2
X3
X4
Xn
If A and B then X1 = 1
If C then X2 = “P”

Digital Desert Digital Ocean
Disconnected intrusions Ongoing ubiquitous data
Small samples of data Dramatically large and ubiquitous
Special intrusive systems to get data
Data built into daily activity
Lack of data requires special focused inputs
“Items” no longer exist
Absence of data requires inferential stretch
Availability of data lessons need for inference
Data scarcity leads to small sample science (e.g models of expertise)
Data ocean leads to improved understanding of detailed mechanisms & rules (automated automated scoring)
“Exam” ignorant of your state
Activity starts with access to previous history
Data outside classroom not even considered
Data is data no matter where it is
Copyright © 2012 Pearson Education, Inc. or its affiliates. Al rights reserved.
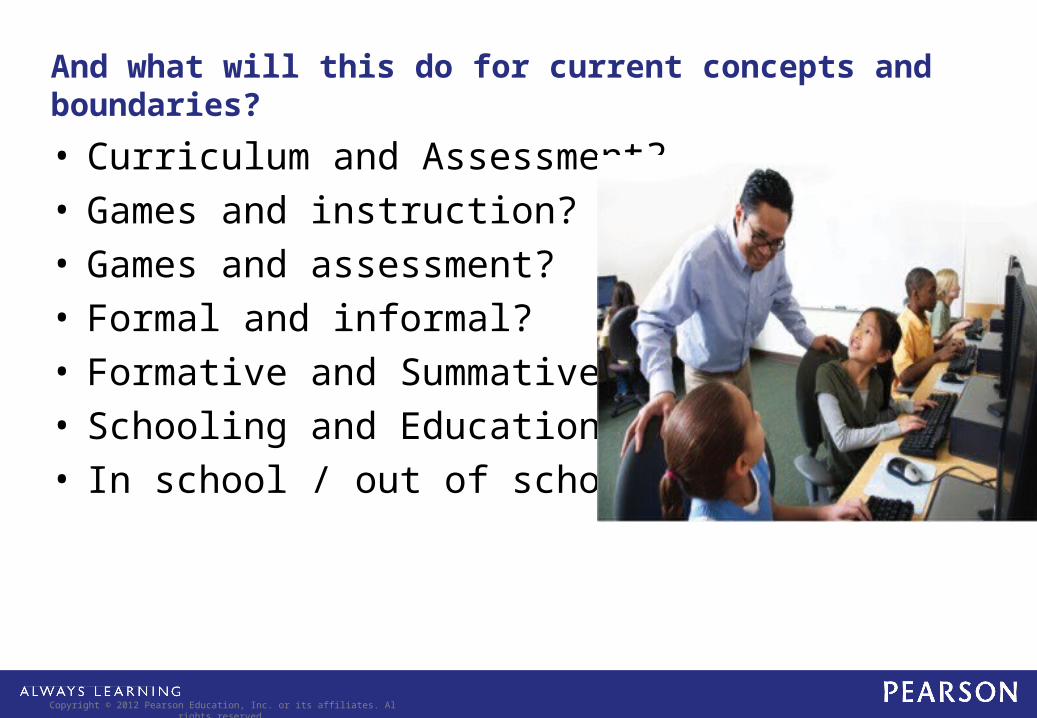
And what will this do for current concepts and boundaries?
• Curriculum and Assessment?• Games and instruction?• Games and assessment?• Formal and informal?• Formative and Summative?• Schooling and Education• In school / out of school
Copyright © 2012 Pearson Education, Inc. or its affiliates. Al rights reserved.
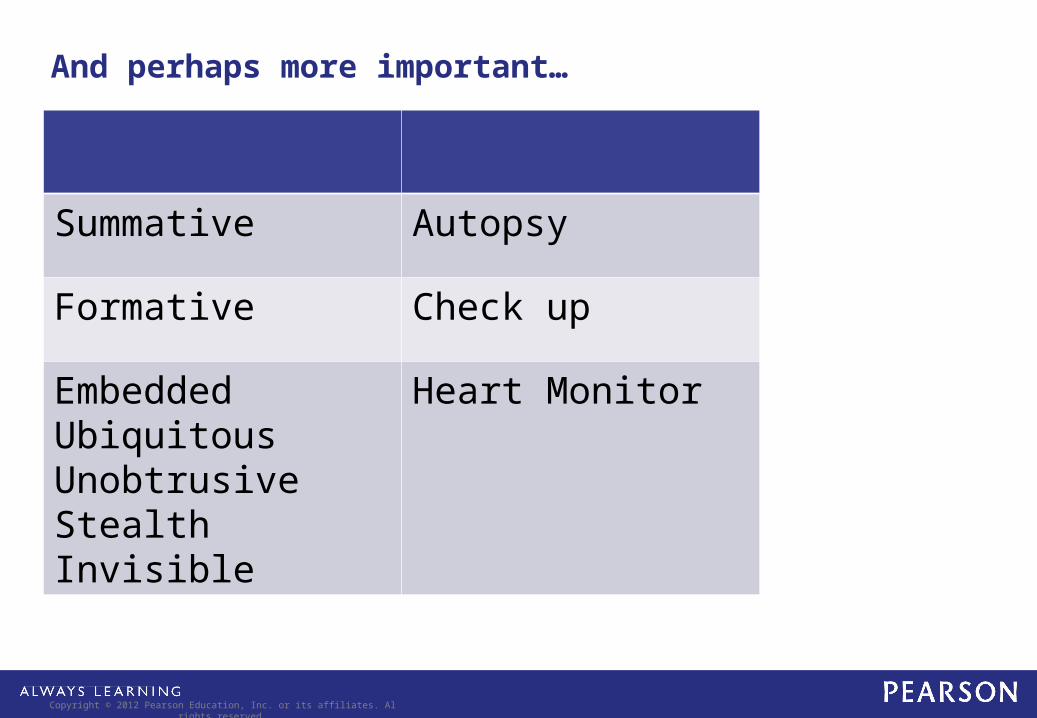
And perhaps more important…
Summative Autopsy
Formative Check up
Embedded Ubiquitous Unobtrusive StealthInvisible
Heart Monitor
Copyright © 2012 Pearson Education, Inc. or its affiliates. Al rights reserved.

Say the summary here
32
Thanks!
33