1 Ordinally Scale Variables Greg C Elvers. 2 Why Special Statistics for Ordinally Scaled Variables...
43
1 Ordinally Scale Variables Greg C Elvers
-
Upload
justina-shaw -
Category
Documents
-
view
233 -
download
0
Transcript of 1 Ordinally Scale Variables Greg C Elvers. 2 Why Special Statistics for Ordinally Scaled Variables...

1
Ordinally Scale Variables
Greg C Elvers

2
Why Special Statistics for Ordinally Scaled Variables
The parametric tests (e.g. t, ANOVA) rely on estimates of variance which cannot be meaningfully obtained from ordinally scaled data
The non-parametric tests for nominally scaled variables (e.g. binomial, 2) do not use all the information that is present in ordinally scaled variables
3
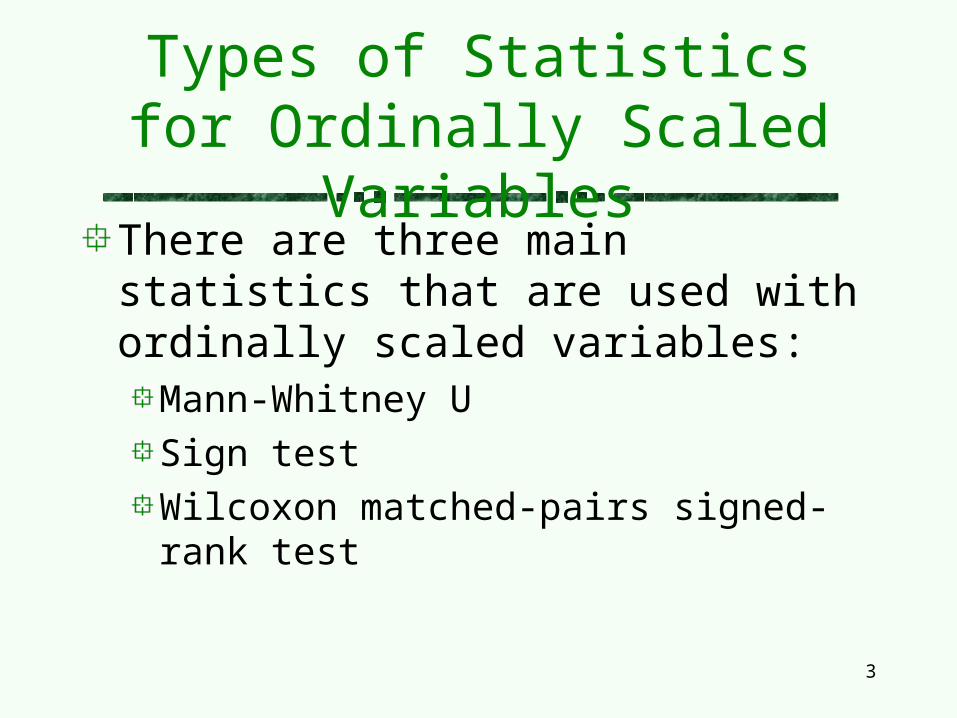
Types of Statistics for Ordinally Scaled Variables
There are three main statistics that are used with ordinally scaled variables:
Mann-Whitney U
Sign test
Wilcoxon matched-pairs signed-rank test
4
Mann-Whitney U Test
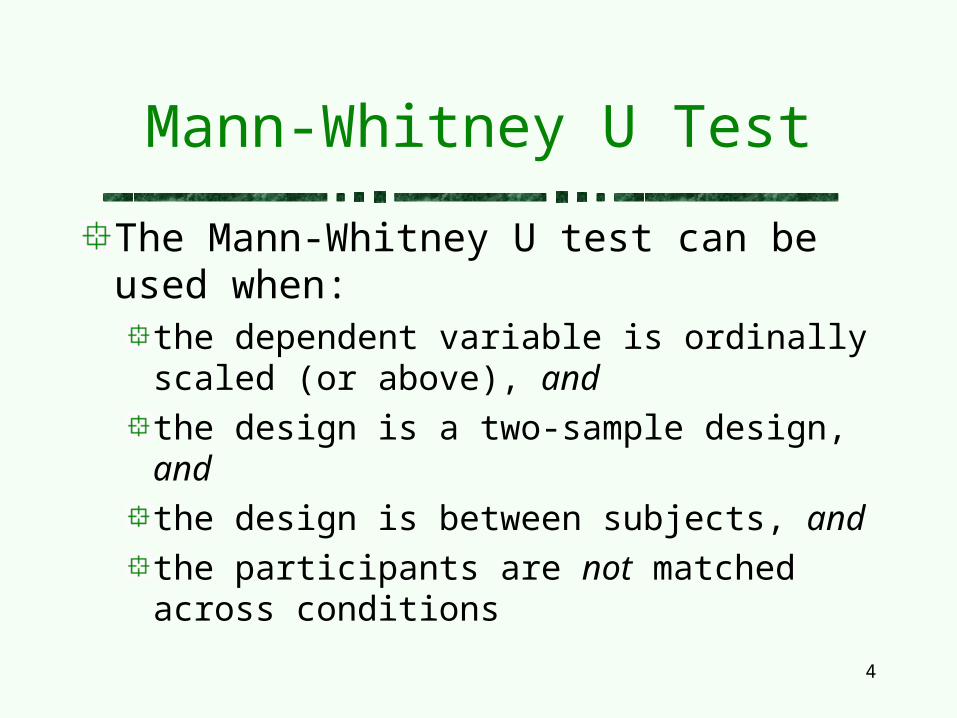
The Mann-Whitney U test can be used when:
the dependent variable is ordinally scaled (or above), and
the design is a two-sample design, and
the design is between subjects, and
the participants are not matched across conditions

5
Mann-Whitney U Test
The Mann-Whitney U test is a useful alternative to the t-test if
the dv is ordinally scaled, or
you do not meet the assumption of normality, or
you do not meet the assumption of homogeneity of variance

6
Steps in the Mann-Whitney U Test
Write the hypotheses:H0: 1 = 2 or H0: 1 2
H1: 1 2 or H1: 1 > 2
Decide if the hypothesis is one- or two-tailed
Specify the level
Calculate the Mann-Whitney U

7
Steps in the Mann-Whitney U Test
Rank order all of the data (from both control and experimental conditions) from lowest to highest
Lowest score has a rank of 1
Sum the ranks of the scores in the first conditionThe sum of the ranks is called R1
Sum the ranks of the scores in the second condition
The sum of the ranks is called R2

8
Steps in the Mann-Whitney U Test
Calculate the U (or U’) statistic:
2
2221
111
21
R2
1NNNNU
R2
1NNNNU
N1 is the number of scores in the 1st conditionN2 is the number of scores in the 2nd conditionR1 is the sum of the ranks of the scores in the 1st condition
R2 is the sum of the ranks of the scores in the 2nd condition
9
Steps in the Mann-Whitney U Test
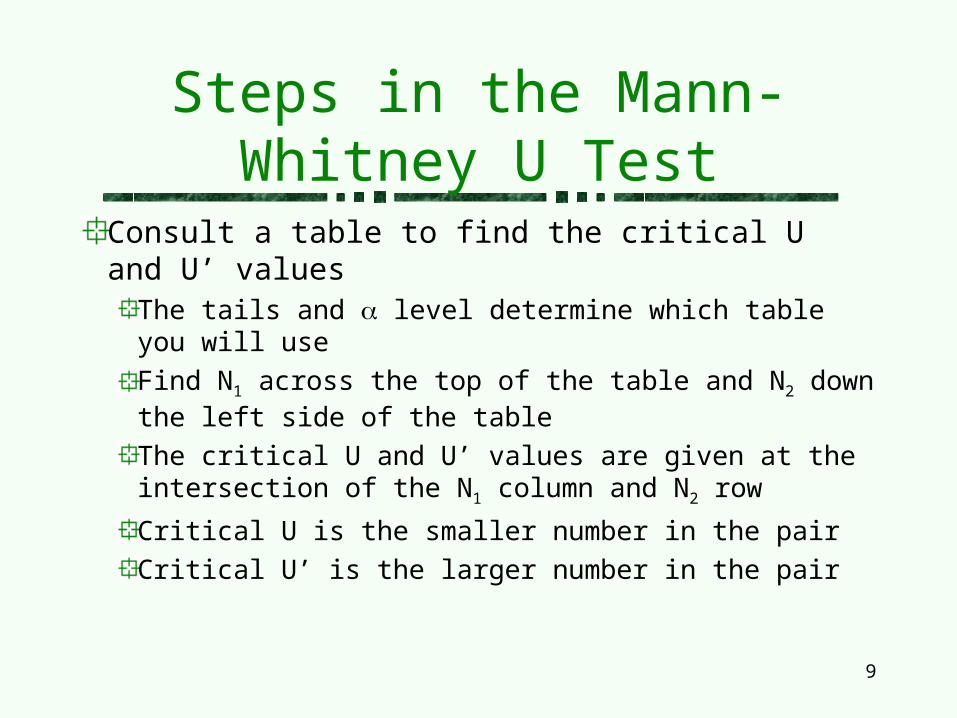
Consult a table to find the critical U and U’ valuesThe tails and level determine which table you will use
Find N1 across the top of the table and N2 down the left side of the table
The critical U and U’ values are given at the intersection of the N1 column and N2 row
Critical U is the smaller number in the pair
Critical U’ is the larger number in the pair

10
Steps in the Mann-Whitney U Test
Decide whether to reject H0 or not:
If the observed U is less than or equal to the critical U, reject H0
If the observed U’ is greater than or equal to the critical U’, reject H0

11
Mann-Whitney Example
An instructor taught two sections of PSY 216One section used SPSS for calculations
The other section performed calculations by hand
At the end of the course, the students rated how much they liked statistics
The questionnaire asked 20 questions on a 5 point scale

12
Mann-Whitney U Example
Are the mean ratings of liking different?Write the hypotheses:
H0: SPSS = Hand
H1: SPSS Hand
Determine the tailsIt is a two-tailed, non-directional test
Specify the level = .05
Calculate the Mann-Whitney U
13
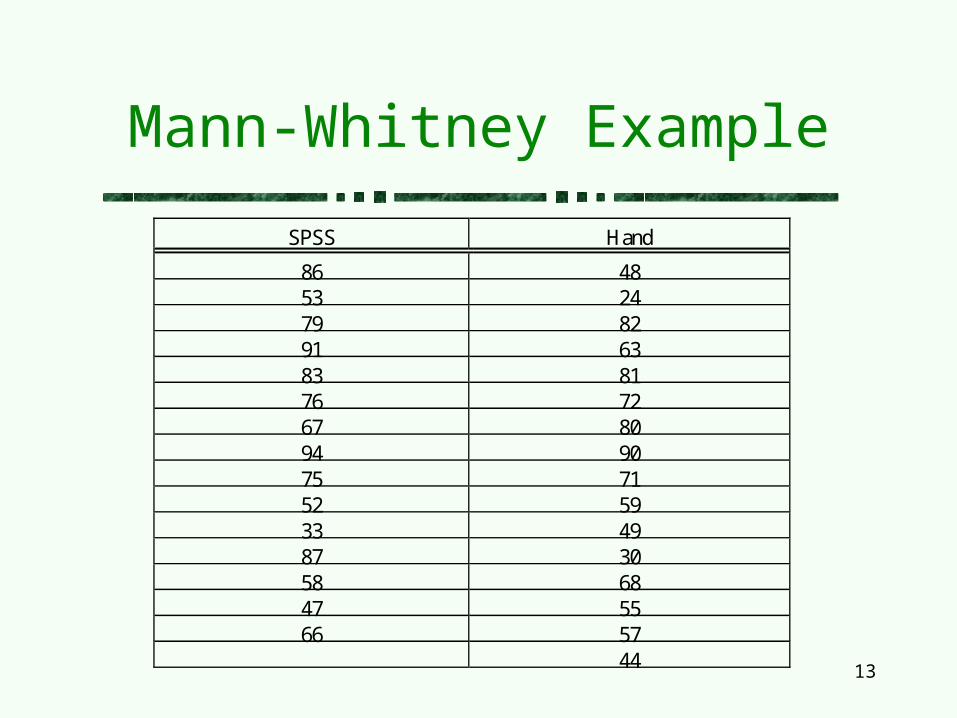
Mann-Whitney Example
SPSS Hand
86 4853 2479 8291 6383 8176 7267 8094 9075 7152 5933 4987 3058 6847 5566 57
44

14
Mann-Whitney Example
SPSS HandScore Rank Score Rank
86 27 48 653 9 24 179 22 82 2591 30 63 1483 26 81 2476 21 72 1967 16 80 2394 31 90 2975 20 71 1852 8 59 1333 3 49 787 28 30 258 12 68 1747 5 55 1066 15 57 11
44 4
R1 = 273 R2 = 223
15
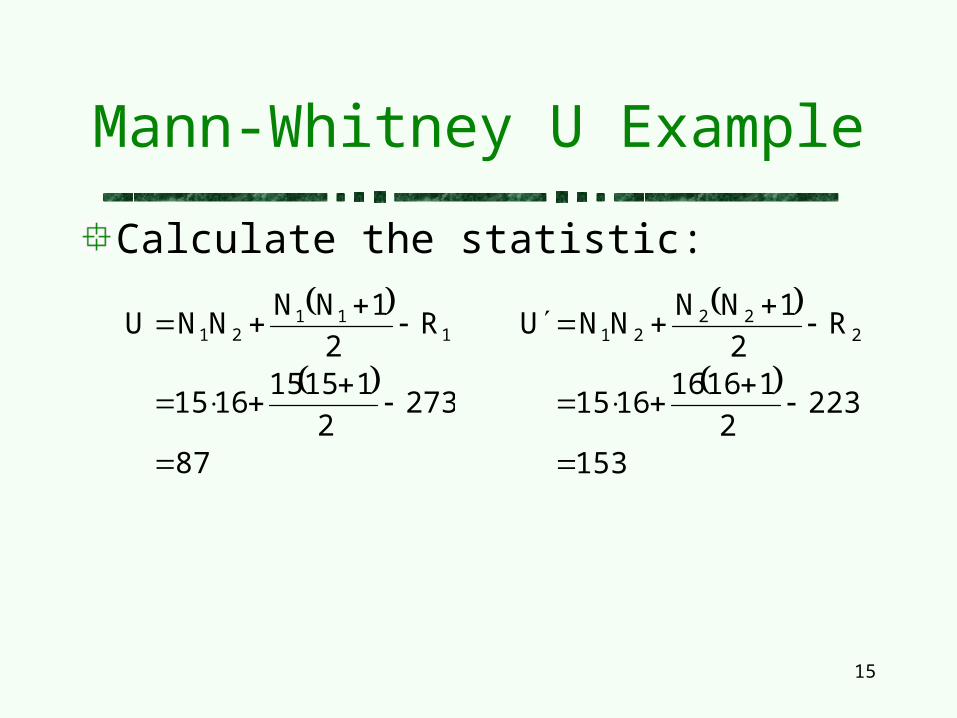
Mann-Whitney U Example
Calculate the statistic:
87
2732
115151615
R2
1NNNNU 1
1121
153
2232
116161615
R2
1NNNNU 2
2221

16
Mann-Whitney U Example
Find the critical U and U’ values
Consult the table of critical U values with = .05, two-tailed
Column = N1 = 15
Row = N2 = 16
Critical U = 70
Critical U’ = 170
17
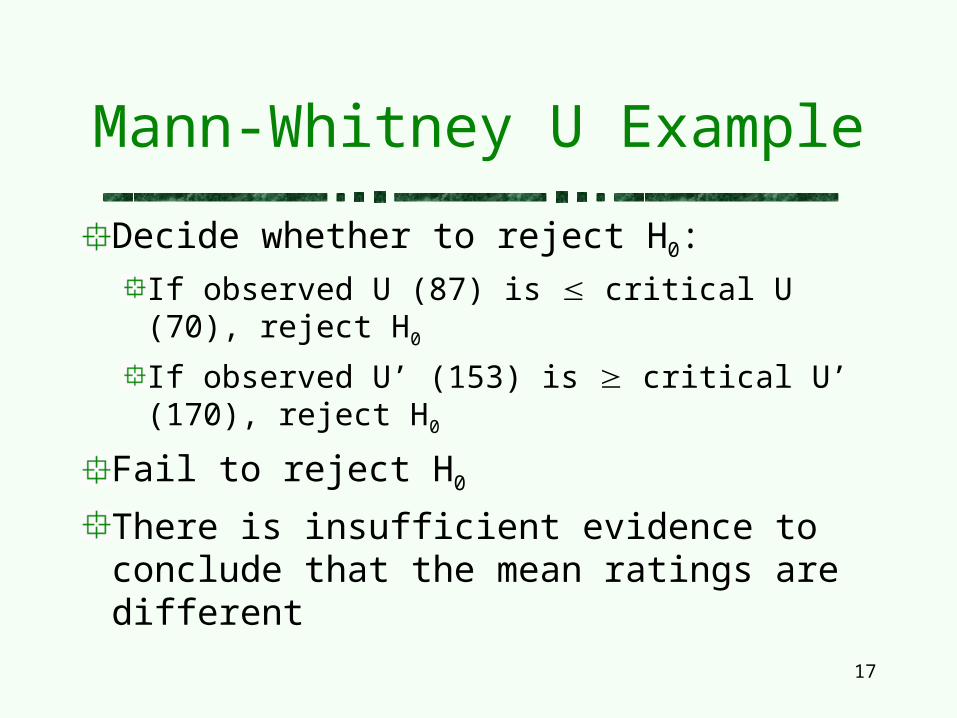
Mann-Whitney U Example
Decide whether to reject H0:
If observed U (87) is critical U (70), reject H0
If observed U’ (153) is critical U’ (170), reject H0
Fail to reject H0
There is insufficient evidence to conclude that the mean ratings are different

18
Special Considerations
If a score in one condition is identical to a score in the other condition (i.e. the ranks are tied) then a special form of the Mann-Whitney U test should be used
Failure to use the special form increases the probability of a Type-II error

19
Special Considerations
When N1 and / or N2 exceed 20, then the sampling distributions are approximately normal (due to the central limit theorem) and the z test can be used:
U
E1
s
UUz
WhereU1 = sum of ranks of group 1
UE = sum expected under H0
su = standard error of the U statistics

20
Special Considerations
2
1NNNU 211
E
12
1NNNNs 2121
u

21
Sign Test
The sign test can be used when:the dependent variable is ordinally scaled (or above), and
the design is a two-sample design, and
the participants are matched across conditions

22
Sign Test
The basic idea of the sign test is that we take the difference of each pair of matched scores
Then we see how many of the differences have a positive sign and how many have a negative sign

23
Sign Test
If the groups are equivalent (i.e. no effect of the treatment), then about half of the differences should be positive and about half should be negative
Because there are only two categories (+ and -), the sign test is no different from the binomial test

24
Steps in the Sign Test
Write the hypotheses:H0: P = .5
H1: P .5where P = probability of a positive sign in the difference
Decide if the hypothesis is one- or two-tailed
Specify the level
Calculate the Sign Test

25
Calculate the Sign Test
For each pair of scores, take the difference of the scores
Count the number of differences that have a positive sign

26
Steps in the Sign Test
Determine the critical value from a table of binomial values
Find the column with the appropriate number of tails and level
Find the row with the number of pairs of scores
The critical value is at the intersection of the row and column
27
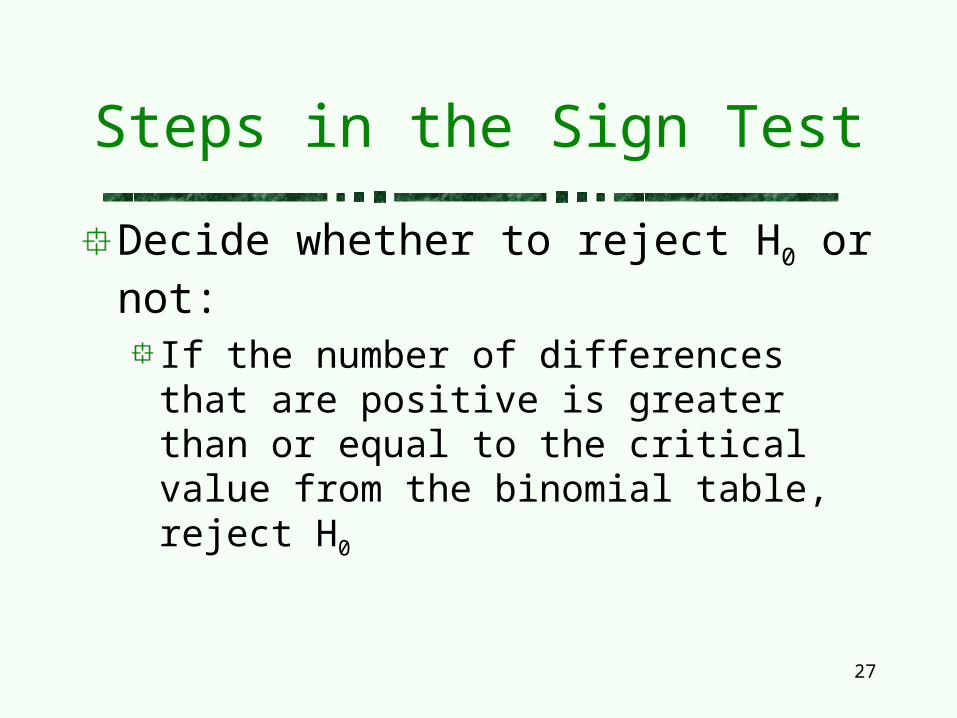
Steps in the Sign Test
Decide whether to reject H0 or not:
If the number of differences that are positive is greater than or equal to the critical value from the binomial table, reject H0
28
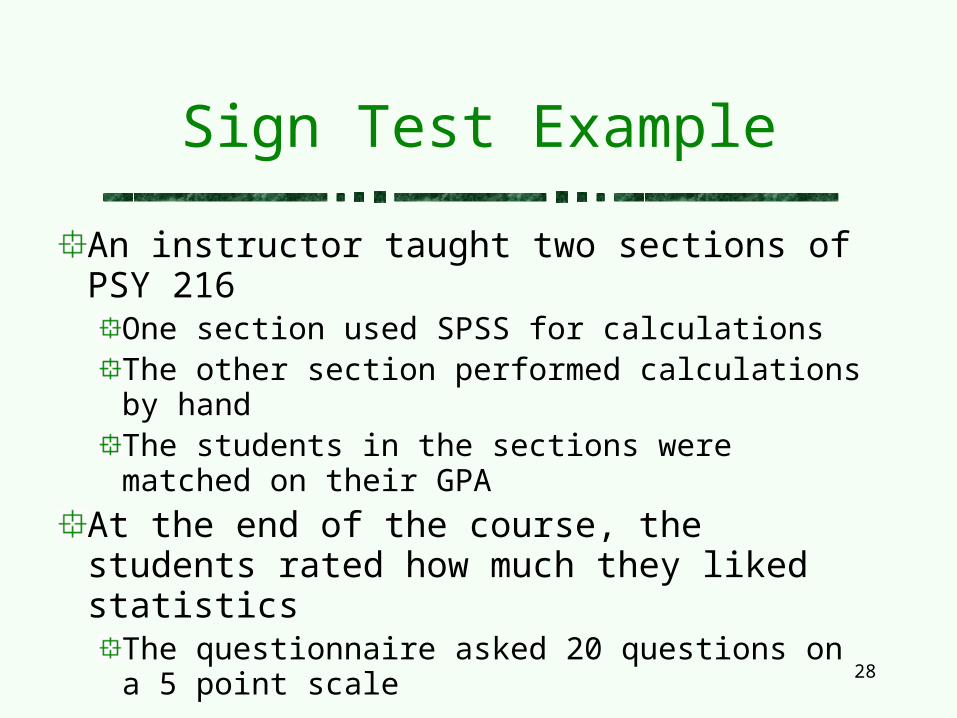
Sign Test Example
An instructor taught two sections of PSY 216One section used SPSS for calculationsThe other section performed calculations by handThe students in the sections were matched on their GPA
At the end of the course, the students rated how much they liked statistics
The questionnaire asked 20 questions on a 5 point scale

29
Sign Test Example
Are the mean ratings of liking different?Write the hypotheses:
H0: P = .5
H1: P .5
Determine the tailsIt is a two-tailed, non-directional test
Specify the level = .05
Calculate the sign test

30
Sign Test Example
SPSS Hand
86 4853 2479 8291 6383 8176 7267 8094 9075 7152 5933 4987 3058 6847 5566 57

31
Sign Test Example
SPSS Hand Sign of Difference
86 48 +53 24 +79 82 -91 63 +83 81 +76 72 +67 80 -94 90 +75 71 +52 59 -33 49 -87 30 +58 68 -47 55 -66 57 +
# + Signs = 9
32
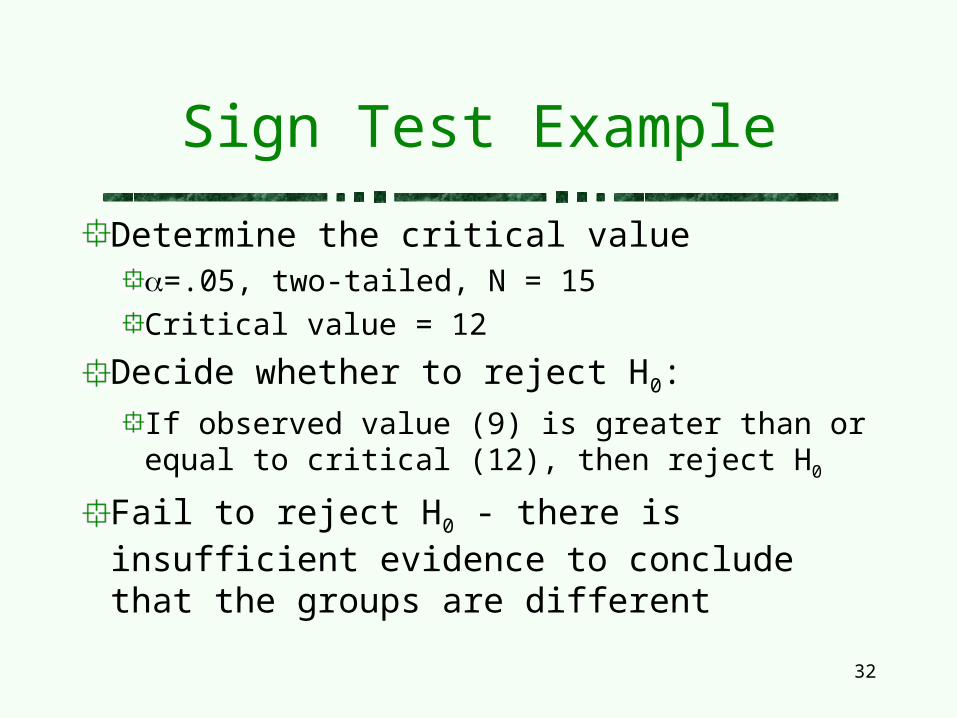
Sign Test Example
Determine the critical value=.05, two-tailed, N = 15
Critical value = 12
Decide whether to reject H0:
If observed value (9) is greater than or equal to critical (12), then reject H0
Fail to reject H0 - there is insufficient evidence to conclude that the groups are different

33
Wilcoxon Matched-Pairs Signed-Rank Test
The sign test considers only the direction of the difference, and not the magnitude of the difference
If the magnitude of the difference is also meaningful, then the Wilcoxon matched-pairs signed-rank test may be a more powerful alternative
34
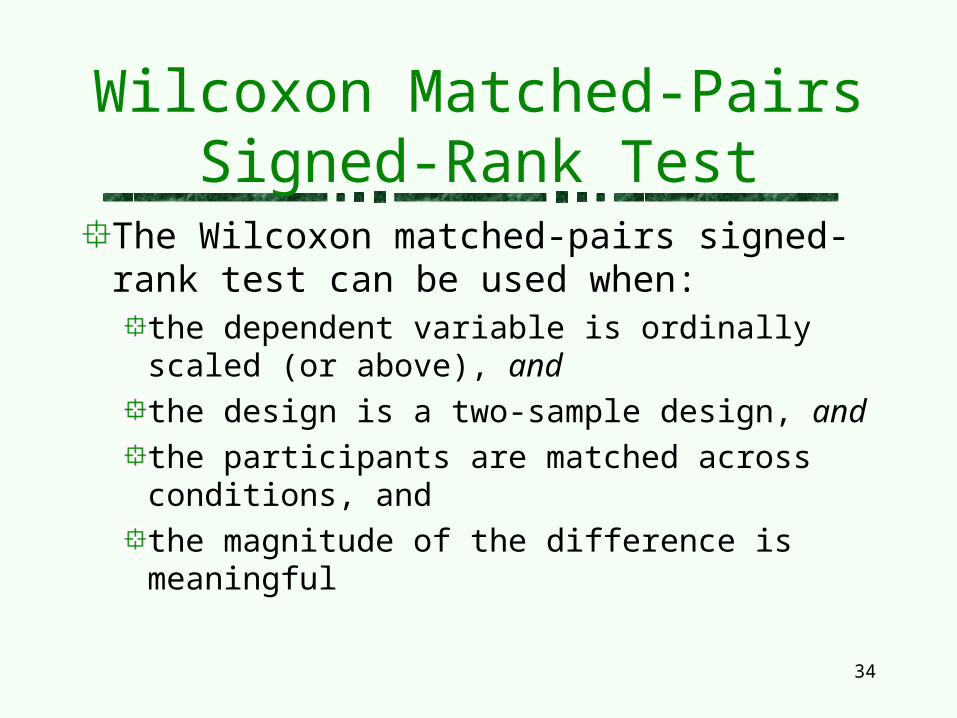
Wilcoxon Matched-Pairs Signed-Rank Test
The Wilcoxon matched-pairs signed-rank test can be used when:
the dependent variable is ordinally scaled (or above), and
the design is a two-sample design, and
the participants are matched across conditions, and
the magnitude of the difference is meaningful
35
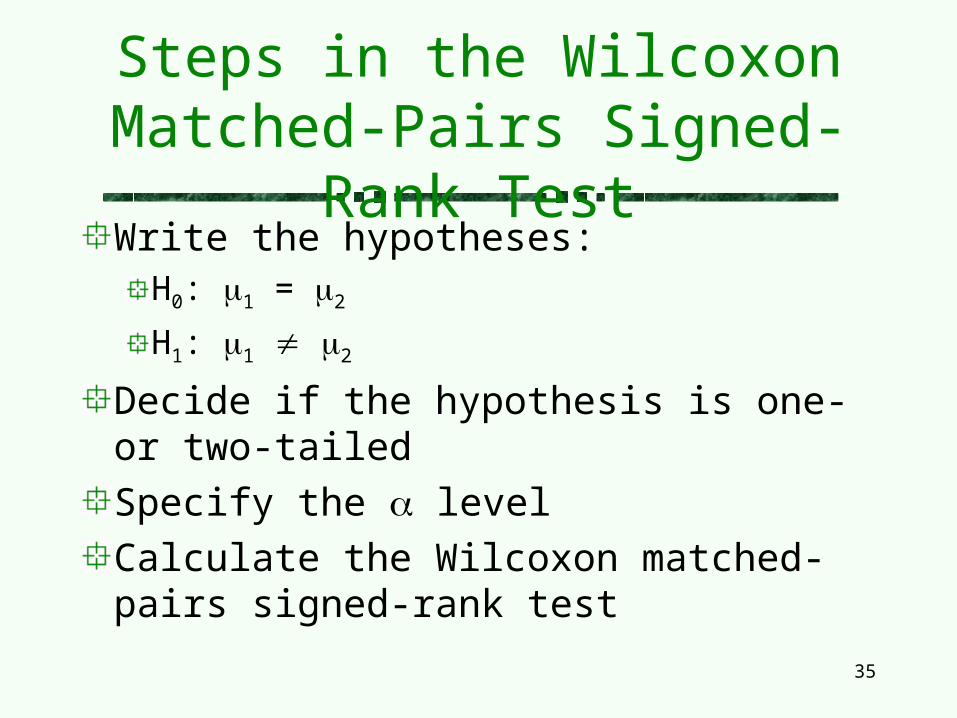
Steps in the Wilcoxon Matched-Pairs Signed-Rank Test
Write the hypotheses:H0: 1 = 2
H1: 1 2
Decide if the hypothesis is one- or two-tailed
Specify the level
Calculate the Wilcoxon matched-pairs signed-rank test

36
Steps in the Wilcoxon Matched-Pairs Signed-Rank Test
For each pair of scores, take the difference of the scores
Rank order the differences from lowest to highest, ignoring the sign of the difference
Sum the ranks that have a negative sign

37
Steps in the Wilcoxon Matched-Pairs Signed-Rank Test
Determine the critical value from a table of critical Wilcoxon values
Find the column with the appropriate number of tails and level
Find the row with the number of pairs of scores
The critical value is at the intersection of the row and column

38
Steps in the Wilcoxon Matched-Pairs Signed-Rank Test
Decide whether to reject H0 or not:
If the absolute value of the sum of the negative ranks is less than the critical value from the table, reject H0

39
Wilcoxon Matched-Pairs Signed-Rank Test Example
We will use the same example as the sign-test

40
Wilcoxon Matched-Pairs Signed-Rank Test Example
Are the mean ratings of liking different?Write the hypotheses:
H0: SPSS = Hand
H1: SPSS Hand
Determine the tailsIt is a two-tailed, non-directional test
Specify the level = .05
Calculate the Wilcoxon test

41
Wilcoxon Matched-Pairs Signed-Rank Test Example
SPSS Hand Difference Rank of Difference Ranks With - Value
86 48 38 1453 24 29 1379 82 -3 (-)2 (-)291 63 28 1283 81 2 176 72 4 467 80 -13 (-)10 (-)1094 90 4 475 71 4 452 59 -7 (-)6 (-)633 49 -16 (-)11 (-)1187 30 57 1558 68 -10 (-)9 (-)947 55 -8 (-)7 (-)766 57 9 8
T = -45

42
Wilcoxon Matched-Pairs Signed-Rank Test Example
Determine the critical value=.05, two-tailed, N = 15
Critical value = 25
Decide whether to reject H0:
If the absolute value of the observed value (-45) is less than the critical (25), then reject H0
Fail to reject H0 - there is insufficient evidence to conclude that the groups are different

43
Special Considerations
The Wilcoxon test assumes that the differences are ordinally scaled
This assumption is often incorrect, and is hard to verify
If we cannot verify it, we should not use the Wilcoxon test