
1' - ntrs.nasa.gov TM X-2790 PILE ^ (HASA-TH-X-2790) ANALYSIS Or THE ... figure error control of the...
65
«'j,k,,^-i 'f.ftffan !•*?. t^.'ji.' v ' *f4*''"..' ; - v." NA SA TECHNICAL... MEMORANDUM X i fi- ." 3,' -' :?s-; K.'fc;, 1 t-i-ji 1' NASA TM X-2790 PILE ^ (HASA-TH-X-2790) ANALYSIS Or THE DYNAMICS OP 1HIN PBIMfcRY KIEEOSS FOE LAHGt ASTEOSCMICAL TliLESCOPES (NASA) 6U p HC $3oOC CSCL 1UB N73=26911 1 Onclas 07287 ,.-• • i- »*} .*- OF THIN LARGB ; AS TELESCOP1S Aaron J, Osfroff and Mary *^ Resmrcb Center • -, , Va. 23665 RAWJfAL IttQNAUTICS AKD SPACE ADMlKtSIRAHON • WASHIN6TOH, D. C. • JULY 1973 - 1 - 5;i.'-'(; | 4 ,4.i«-,K'l •} if- ',-{ 4s i- ,-. "••'. jli. ' :.J » IJI i it I 5: tffa ;i https://ntrs.nasa.gov/search.jsp?R=19730018184 2018-06-29T01:44:39+00:00Z
Transcript of 1' - ntrs.nasa.gov TM X-2790 PILE ^ (HASA-TH-X-2790) ANALYSIS Or THE ... figure error control of the...
«'j,k,,^-i 'f.ftffan !•*?. t^.'ji.'v ' *f4*' '" . . ' ;-
v."
??'H!;.7i
NA SA TECHNICAL.. .M E M O R A N D U M
X
i fi-
." 3,' -': ? s - ;K.'fc;,1 t-i-ji
1'
NASA TM X-2790
PILE
^
(HASA-TH-X-2790) ANALYSIS Or THEDYNAMICS OP 1HIN PBIMfcRY KIEEOSS FOELAHGt ASTEOSCMICAL TliLESCOPES (NASA)6U p HC $3oOC CSCL 1UB
N73=26911 1
Onclas07287
,.-• • i- »*} .*-
OF THINLARGB; AS TELESCOP1S
Aaron J, Osfroff and Mary*^
Resmrcb Center • -,
, Va. 23665
RAWJfAL IttQNAUTICS AKD SPACE ADMlKtSIRAHON • WASHIN6TOH, D. C. • JULY 1973
- 1 -5 ; i . ' - ' ( ; |4,4.i«-,K'l •} if- ',-{ 4s i- ,-. "••'.jli. ' :.J » IJI i it I 5: tffa ;i
https://ntrs.nasa.gov/search.jsp?R=19730018184 2018-06-29T01:44:39+00:00Z

1. Report No.NASA TM X-2790
2. Government Accession No.
4. Title and SubtitleANALYSIS OF THE DYNAMICS OF THIN PRIMARY MIRRORS
FOR LARGE ASTRONOMICAL TELESCOPES
7. Author(s)
Aaron J. Ostroff (Langley Research Center) andMary McCann (Vought Missiles and Space Company)
9. Performing Organization Name and Address
NASA Langley Research CenterHampton, Va. 23665
12. Sponsoring Agency Name and AddressNational Aeronautics and Space Administration
Washington, D.C. 20546
3. Recipient's Catalog No.
5. Report DateJuly 1973
6. Performing Organization Code
8. Performing Organization Report No.L-8893
10. Work Unit No.188-78-57-05
1 1 . Contract or Grant No.
13. Type of Report and Period CoveredTechnical Memorandum
14. Sponsoring Agency Code
15. Supplementary. Notes
16. Abstract
The NASTRAN structural analysis program has been used to investigate the dynamicproperties of thin primary mirrors suitable for use in large orbiting astronomical telescopes.One application for which the dynamic properties of large flexible mirrors are necessary isfigure error control of the primary mirror. This paper includes an analysis of the modeshapes and modal frequencies for several thin, homogeneous, isotropic mirrors. Typicalcases include two different mirror diameters, two different diameter-to-thickness ratios,and both a mirror without and a mirror with a central hole that is 22 percent of the mirrordiameter.
The finite -element structural model is first evaluated by comparing the NASTRANgenerated results with theoretical values for a simply supported, flat, circular mirror. Thesame model is then used for the spherical mirrors evaluated in the remainder of this paper.The results for a spherical mirror will be very similar to those for a parabolic mirrorbecause the distance between surfaces is small compared to the thickness of the mirror.The mode shapes and frequencies of a 0.762 -meter-diameter mirror with a 60-to-l diameter-to-thickness ratio and a three-point rigid kinematic (not overconstrained) mount are calcu-lated and plotted for comparison with results obtained previously from the SAMIS structuralanalysis program for this same mirror. A static analysis is also shown for comparison withexperimentally obtained influence coefficients . Masses corresponding to actuator pads arethen attached to 58 points on the finite -element model to observe the effect on the natural fre-quency of vibration. A central hole is incorporated into the mirror and both the diameter anddiameter-to-thickness ratio are changed. Inclusion of a hole that is 22 percent of the diameterreveals a slightly more flexible mirror than one with a solid center, with essentially unchangedmode shapes. Contour plots of the first several modes for each configuration are included.
17. Key Words (Suggested by Author(s))
Astronomical telescopeEigenvectorsEigenvaluesNASTRANThin mirrorsInfluence coefficients
19. Security Qassif. (of this report)Unclassified
18. Distribution Statement
Unclassified — Unlimited
20. Security Classif. (of this page) 21. No. of Pages 22. Price*Unclassified 62 $3.00
For sale by the National Technical Information Service, Springfield, Virginia 22151

ANALYSIS OF THE DYNAMICS OF THIN PRIMARY MIRRORS
FOR LARGE ASTRONOMICAL TELESCOPES
By Aaron J. Ostroff and Mary McCann*Langley Research Center
SUMMARY
The NASTRAN structural analysis program has been used to investigate the dynamicproperties of thin primary mirrors suitable for use in large orbiting astronomical tele-scopes. One application for which the dynamic properties of large flexible mirrors arenecessary is figure error control of the primary mirror. This paper includes an analysisof the mode shapes and modal frequencies for several thin, homogeneous, isotropic mir-rors. Typical cases include two different mirror diameters, two different diameter-to-thickness ratios, and both a mirror without and a mirror with a central hole that is22 percent of the mirror diameter.
The finite-element structural model is first evaluated by comparing the NASTRANgenerated results with theoretical values for a simply supported, flat, circular mirror.The same model is then used for the spherical mirrors evaluated in the remainder ofthis paper. The results for a spherical mirror will be very similar to those for a para-bolic mirror because the distance between surfaces is small compared to the thicknessof the mirror. The mode shapes and frequencies of a 0.762-meter-diameter mirrorwith a 60-to-l diameter-to-thickness ratio and a three-point rigid kinematic (not overcon-strained) mount are calculated and plotted for comparison with results obtained previouslyfrom the SAMIS structural analysis program, for this same mirror. A static analysis isalso shown for comparison with experimentally obtained influence coefficients. Massescorresponding to actuator pads are then attached to 58 points on the finite-element modelto observe the effect on the natural frequency of vibration. A central hole is incorporatedinto the mirror and both the diameter and diameter-to-thickness ratio are changed.Inclusion of a hole that is 22 percent of the diameter reveals a slightly more flexible mir-ror than one with a solid center, with essentially unchanged mode shapes. Contour plotsof the first several modes for each configuration are included.
Vought Missiles and Space Company.

INTRODUCTION
During the past several years, a great deal of interest has been generated in thearea of sensing and controlling the figure error of a primary mirror suitable for largeorbiting telescopes. By using figure error control, diffraction-limited tolerances can bemaintained despite initial figure errors and external disturbances such as launch stresses,thermal environment, and gravity release.
References 1 and 2 describe an approach that treats the mirror as a flexiblestructure, the figure of which is regulated by forces acting at discrete points on its rearsurface. The ability to maintain diffraction-limited tolerances by this method is a func-tion of the physical properties of the mirror, external disturbances, the control law, andboth actuator and figure error sensing locations. By using modal analysis, Creedon andLindgren (ref. 3) have developed a control law in which the deformation of the physicalmirror with its supporting structure is described by an infinite series of the modes offree vibration. Inherent in the design of a modal control system is the requirement for aknowledge of the mode shapes (eigenvectors) and frequencies (eigenvalues) of the mirror.A theoretical technique for designing mirror control systems based on the use of thisinformation has been developed (ref. 4) and experimental tests (ref. 1) have been per-formed by using a 0.762-meter-diameter, thin, homogeneous, isotropic, spherical mirrorwith a 60-to-l diameter-to-thickness ratio. For an astronomical telescope the primarymirror will probably be much larger and will have a central hole. The purpose of thispaper is to analyze the mode shapes and modal frequencies for several mirror sizes,both with and without central holes. The structural model is first evaluated by using aflat, circular mirror to compare theoretical results with numerical values. This model,with appropriate out-of-plane coordinates, is then used for the 0.762-meter-diameterspherical mirror to compare with previous results from reference 4. The distancebetween the surfaces of a spherical and parabolic mirror is very small compared to thethickness of the mirrors analyzed, and the results should be essentially the same for bothmirrors. The spherical configuration was maintained to establish continuity throughoutthis paper. Other configurations include the addition of masses at the rear of the mirrorto simulate the mass of actuators and pads and the changing of supporting mount locations.A central hole is then incorporated into the mirror, and finally both the diameter anddiameter-to-thickness ratio of the mirror are changed.
SIMPLY SUPPORTED, FLAT, CIRCULAR MIRROR
A test case for which the natural frequencies of vibration are theoretically knownconsisted of analyzing a flat, circular mirror with a simple circumferential support.

The numerical results obtained from the NASTRAN structural analysis program werecompared with theoretical values to determine relative accuracy. The finite-elementstructural model chosen was identical with that used by Howell and Creedon (ref. 4) so asto minimize differences between their results obtained from the SAMIS structural analy-sis program and the NASTRAN numerical results for a spherical mirror that is describedin the next section. The mirror model is shown in figure 1 and consists of 462 triangularelements and 253 grid points. For best numerical accuracy all elements, except those onthe exterior boundary, are equilateral triangles. The numbering system used in thisanalysis was chosen to minimize the bandwidth of the stiffness and mass matrices forminimum storage and solution times (ref. 5).
Table I contains a list of the material and physical properties for the flat, circularmirror. These properties were also used for the spherical mirrors described subse-quently, except where differences are noted.
TABLE I.- MIRROR PROPERTIES
Material Fused silicaYoung's modulus, N/m2 6.89 X 10¹⁰
Poisson's ratio 0.2Mass density, kg/m3 2.2 x 10³
Physical properties:Outside diameter, m 0.762Inside diameter, m 0Diameter-thickness ratio 60Shape Flat, circularMirror support Simple
The theoretical eigenvalue solutions for the plate described in table I have been cal-culated by substituting the appropriate boundary conditions and material properties intothe plate equations. (See, for example, ref. 6.) Table n shows a comparison of theNASTRAN numerical results with the theoretical eigenvalues for the first 30 modes. Thelast column shows that the error in NASTRAN is less than 1 percent for all 30 eigenvaluescompared. In general, the NASTRAN data are lower than the theoretical values for thefirst 12 modes and higher for the remaining modes. Based upon these results, the finite-element structural model shown in figure 1 should be adequate to evaluate a relativelyflat, spherical mirror.

TABLE H.- EIGENVALUES FOR SIMPLY SUPPORTED,
FLAT, CIRCULAR MIRROR
Mode
1234
5
6789
1011
12
1314151617
18192021222324252627
282930
Theoretical,(rad/sec)2
0.477129 x lO 6
3.955603.95560
13.557213.557218.281233.112033.1120
48.797848.797867.129567.1295
102.232102.232114.372
120.778120.778186.047186.047
199.866199.866219.867219.867
308.417308.417310.835310.835375.627375.627
398.473
NASTRAN,(rad/sec)^
0.476470 x 10⁶
3.950463.95049
13.523113.531118.30832.975133.0559
48.900348.9125
66.890666.9264
102.495102.536114.892120.257120.467
186.325186.982
199.143199.185221.258221.343308.856309.474309.552310.530
378.382378.524402.294
% error inNASTRAN
-0.138-.130
-.118-.252
-.193.147
-.413-.169
.210
.235
-.356-.303
.257
.297
.455
-.431-.257
.149
.503-.362-.341
.633
.671
.142
.343-.413-.098
.733
.771
.959

SPHERICAL TEST MIRROR
Modal Analysis
The previously described finite -element structural model with appropriate out-of -plane coordinates was also used to analyze a spherical mirror with a 4. 52 12 -meterradius of curvature and a three -point rigid kinematic mount located at grid points 15,119, and 247 (fig. 1). Grid point 15 was constrained in all three translational directions;grid point 247 was constrained only in the out-of-plane direction; grid point 119 was con-strained in the out-of-plane direction and one inplane direction. All other mirror mate-rial and physical properties were identical to those described in table I. The purpose ofanalyzing this mirror was to compare the NASTRAN numerical data with the SAMIS pro-gram results, previously obtained by Howell and Creedon (ref. 4), and with experimentaldata (ref. 1).
All input and output data were defined with respect to a spherical coordinate system,whereas the constraints for the support points were defined in a rectangular coordinatesystem (ref. 5). For the remainder of this paper all mode shapes (eigenvectors) aredescribed by the component of displacement normal to the mirror surface.
The Givens method (ref. 5), which uses a tridiagonalization technique, was selectedfor the normal mode analysis. The number of degrees of freedom for the structuralmodel used was reduced from 1518 to 250 by using a combination of partitioning tech-niques and the Guyan reduction (ref. 5) within the NASTRAN rigid format. One advantageof the Givens method is that all 250 eigenvalues can be calculated in a single run. Inorder to compare the SAMIS and NASTRAN results, the SAMIS eigenvalue (ref. 4) mustfirst be related to the NASTRAN eigenvalue by
where XN is the NASTRAN eigenvalue, Xg is the SAMIS eigenvalue, pm is the massdensity, and t is the mirror thickness. The natural frequency f is related to theNASTRAN eigenvalue by
and is plotted in figure 2 for the first 58 modes. Both sets of data, SAMIS and NASTRAN,agree very closely for all modes and establish confidence in the numerical results. Thethird curve in the figure represents the results obtained by adding masses to 58 differentpoints on the mirror. These masses simulate the mass of Invar pads, which were used

to couple actuator forces into the experimental mirror (ref. 1). For a spherical mirror,the longer pads are located on the circumference and the shortest pad is at the center.Table HI shows the location and mass of all 58 pads. With the addition of these padmasses, the total mass of the mirror is increased from 12.679 kg to 14.812 kg; this is afactor of 1.168. Because the natural frequency is inversely proportional to the squareroot of the increase in mass, the results should be approximately 0.925 times the naturalfrequencies for the mirror without masses. An analysis of the frequency curves in fig-ure 2 shows this factor to be fairly constant for all modes.
TABLE IE.- PAD MASSES AND LOCATION ON MIRROR
Grid point Mass,kg
12793, 95, 125, 129, 159, 16162, 91, 97, 157, 163, 19260, 64, 123, 131, 190, 19433, 35, 58, 66, 89, 99, 155, 165, 188, 196, 219, 22131, 37, 121, 133, 217, 22311, 56, 68, 186, 198, 2439, 13, 29, 39, 87, 101, 153, 167, 215, 225, 241, 2457, 135, 239
0.0288.0298.0319.0329.0357.0376.0408.0419.0481
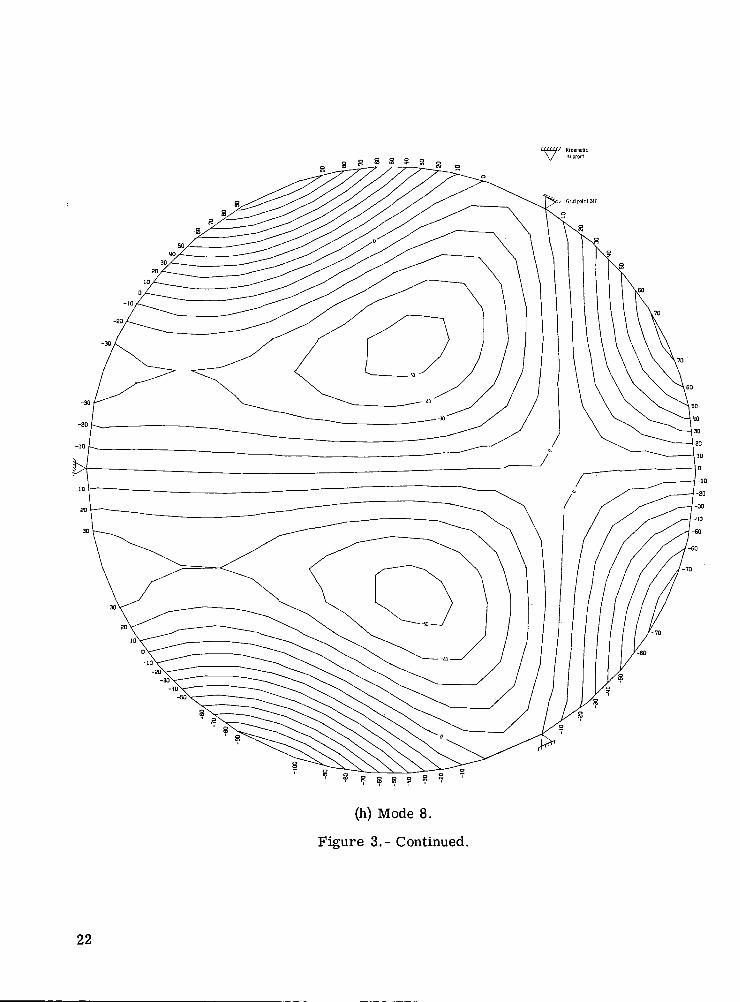
Contour plots for the first 10 mode shapes, normalized to -100, are shown in fig-ure 3. The numbers on these maps indicate the percent of the maximum amplitude andthe direction with respect to the peak point of -100. These mode shapes are the same forthe two NASTRAN runs described and very similar to the SAMIS results (ref. 4). Thethree triangles on the contour maps show the locations of the kinematic support points onthe boundary.
Static Analysis
A complete set of influence coefficients (elements of the flexibility matrix) wereobtained by a simple alteration of the NASTRAN rigid format. (See appendix.) The tech-nique involves the inversion of the stiffness matrix after all constraints have beeneliminated.
An analysis of the flexibility matrix indicates that the mirror essentially has six-fold symmetry; the six portions are obtained by drawing diametrical lines from the three

support points (15, 119, 247 in fig. 1). By applying forces to only one-sixth of themirror, influence coefficients can be obtained for the complete mirror. Table IV showsthe calculated displacements normal to the mirror surface for six points on the mirror,owing to a force of 4.448 newtons (1 pound) in the normal direction. The small differ-ences in mirror deflection at these six points are caused by the three-point kinematicmount. If a three-point simple support was used, all displacements would be equal.
TABLE IV.- INFLUENCE COEFFICIENTS AT SIX POINTS
Location of force,grid point
356689
155196221
Location of displacement,grid point
6464
123123194194
Displacement,/im
1.651141.629171.630941.639931.638141.63686
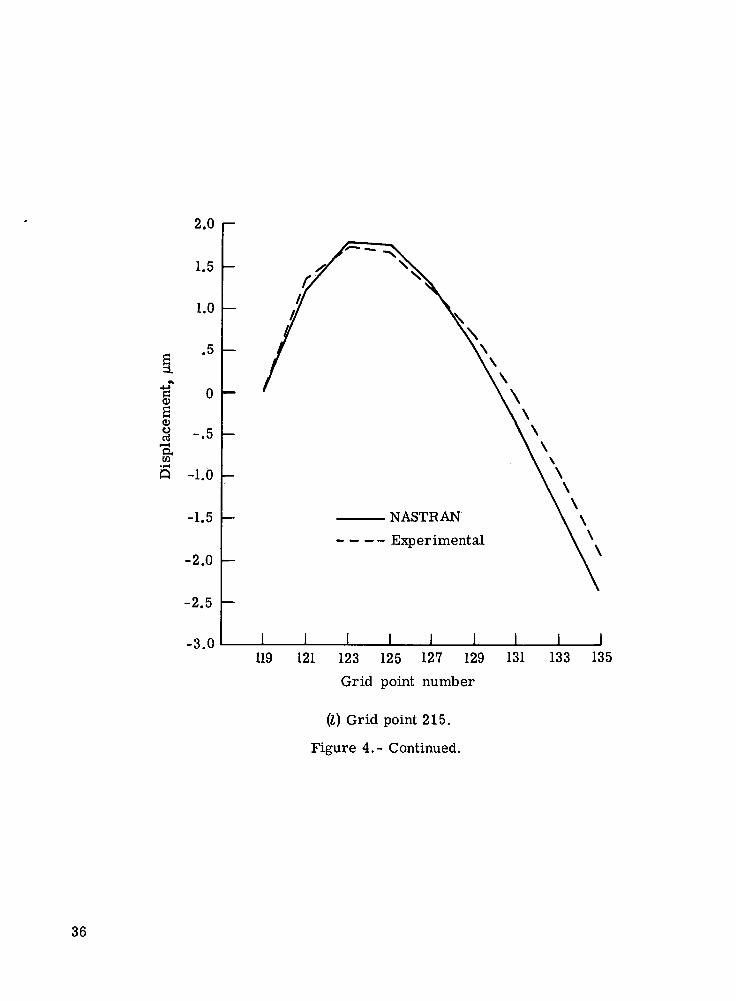
The numerical results obtained from NASTRAN were compared with the experi-mental data (ref. 1). Figure 4 shows a comparison of the mirror displacements acrossone diameter of the mirror (grid points 119 to 135) for the 14 different load locations.The grid point numbers where the loads were applied are 121, 123, 125, 127, 153, 155,157r159, 186, 188, 190, 215, 217, and 239. The one case where a significant differenceexists between two sets of data is for a force applied to grid point 121. Because gridpoint 121 is located near a support point (grid point 119), the mirror displacements shouldbe smaller than with the same force applied to grid point 123. The NASTRAN resultsshow smaller peak displacements, whereas the experimental data have the oppositeresults (figs. 4(a) and 4(b)). For this reason, the experimental data shown in figure 4(a)are believed to be in error.
Interior Kinematic Mount
An analysis was made to investigate the effect of a slight change in mirror-mountlocation. The three-point kinematic support was moved toward the center of the mirrorby 0.0467 meter to grid points 25, 120, and 236. Contour plots for the first seven modesare shown in figure 5 and appear to be very similar to the plots shown in figures 3(a)to 3(g). The main difference is the change in the nodal lines. For example, mode 3 hasa nodal line through each support point shown by the crosses in figure 5(c), whereas pre-viously mode 3 did not have a nodal line (fig. 3(c)). This type of shift can significantly

change the desired force pattern on a flexible mirror when used in an active control sys-tem (ref. 4). The natural-frequency curve is similar to the NASTRAN results shown infigure 2.
Spherical Mirrors With Central Holes
Large orbiting astronomical telescopes will probably have a Cassegrain-typedesign, which has a central hole in the primary mirror (refs. 7 and 8). As an example,the primary mirror may have an f-number of approximately 3 and a maximum centralhole that is approximately 20 percent of the outside diameter (ref. 8). In order to main-tain continuity with the analysis made on the mirrors without holes, a spherical mirrorwith the same f-number of approximately 2.97 was continued for all cases. The centralhole is 22 percent of the mirror diameter and should allow worst case variations fromthe mirror without any hole. Modal analysis results in this section are for 0.762-meter -diameter (30-inch) and 3.048-meter-diameter (120-inch) mirrors with a 60-to-ldiameter-to-thickness ratio and for a 3.048-meter-diameter mirror with a 20-to-l ratio.All mirrors have a three-point rigid kinematic mount located at the outer edge of themirror. Other mirror properties are the same as shown in table I.
Contour plots for the two 60-to-l diameter-to-thickness-ratio mirrors are identi-cal and are shown in figure 6 for the first seven modes. A comparison of these plotswith those for the mirror without any hole (figs. 3(a) to 3(g)) shows that the inclusion of alarge central hole has relatively little effect on the mode shapes. The inclusion of acentral hole results in a slightly more flexible mirror. The fundamental frequency fo_rthe 0.762-meter-diameter mirror decreased by 4.84 percent from 81.0 hertz to 77.1 hertz.Most of the higher modes have a smaller percentage change in frequency. A plot of fre-quency as a function of mode number for both the 0.762-meter- and 3.048-meter-diametermirrors with central holes is shown in figure 7. The natural frequencies of the largermirror are lower by a factor of 4.
The middle curve in figure 7 is for the larger size mirror with a 20-to-l diameter-to-thickness ratio. The natural frequencies for this mirror are approximately threetimes greater than those for the thinner mirror with the same diameter. Figure 8 showsthe contour plots for the first seven modes of the 20-to-l ratio case. There are a fewslight differences between these plots and those for the thinner mirror (fig. 6). Modes 5,6, and 7, which have eigenvalues of approximately the same magnitude, have altered posi-tions from the previous case. Mode 7 for the thicker mirror (fig. 8(g)) is very similarto mode 5 for the thinner mirror (fig. 6(e)), and modes 5 and 6 for the thicker mirror(figs. 8(e) and 8(f)) are similar to modes 6 and 7, respectively, for the thinner mirror(figs. 6(f) and 6(g)). Some of the nodal lines of other modes have slightly altered loca-tions on the mirror. In general, the mode shapes of mirrors with central holes as large
8

as 22 percent of the outside diameter are very similar to the mode shapes for mirrorswithout holes.
From the analysis of the three mirrors with central holes, the natural frequenciesof vibration can be predicted for any mirror within the diameter and thickness ranges ofthe test cases, when the same mounting arrangement, f-number, and material propertiesare assumed. Figure 9 shows a plot of the fundamental frequency as a linear function ofmirror diameter for a mirror with a central hole that is 22 percent of the outside diam-eter and a 60-to-l diameter-to-thickness ratio. The two data points show that a diam-eter increase by a factor of 4 results in a frequency decrease by the same amount. Aplot of the fundamental frequency as a function of the diameter-to-thickness ratio for a3.048-meter-diameter mirror with the same size central hole is shown in figure 10. Anincrease in the ratio by a factor of 3 results in a frequency decrease by the same amount.
CONCLUDING REMARKS
A dynamic analysis has been made for a large telescope primary mirror to observethe effect of various physical characteristics on the natural modes of vibrations and thenatural frequencies. The finite-element structural model was evaluated by analyzing asimply supported, flat, circular mirror which has known eigenvalues. The first 30 eigen-values calculated by the NASTRAN structural analysis program agree with theoreticalvalues within 1 percent. Based upon these results, the mirror model should be adequateto evaluate a relatively flat, spherical mirror.
The first spherical mirror evaluated had a solid center and is the same mirrorpreviously analyzed by using the SAMIS program. Excellent agreement was foundbetween SAMIS and NASTRAN calculated natural frequencies and mode shapes of themirror. The addition of 58 scalar masses to grid points on the NASTRAN mirror modelto simulate mass pads used in the experimental analysis resulted in a decrease in naturalfrequency by approximately the predicted amount. A static analysis reveals that theflexibility matrix for this mirror essentially has sixfold symmetry. The small differ-ences in the six areas are caused by the three-point kinematic mount. In general, forthe static analysis, good agreement exists between the NASTRAN numerical results andexperimental data. An analysis made to investigate the effect of small changes insupport-point locations shows relatively little change in modal response. The mainchange is the shift of node lines through support locations.
A typical large orbiting telescope will have a primary mirror with a central hole.Inclusion of the largest expected hole size reveals a slightly more flexible mirror thanone with a solid center, with essentially unchanged mode shapes. Variation of the

diameter and thickness for this mirror shows that the fundamental natural frequency isinversely proportional to the mirror diameter for a constant diameter-to-thickness ratioand is inversely proportional to the diameter-to-thickness ratio for a constant mirrordiameter.
Langley Research Center,National Aeronautics and Space Administration,
Hampton, Va., May 18, 1973.
10

APPENDIX
TECHNIQUE FOR OBTAINING FLEXIBILITY MATRIX
A complete set of influence coefficients (elements of the flexibility matrix) can becalculated in one NASTRAN run by a simple alteration of the NASTRAN rigid format.The technique involves the inversions of the stiffness matrix KLL to obtain the flexi-bility matrix FLEX.
The DMAP statements inserted into rigid format 1 of Level 12 are
ALTER 90SOLVE KLL, /FLEX/C,N,1/C,N,1/C,N,2/C,N,2 $MATGPR GPL, USET,SIL,FLEX //C,N,2/C,N,2 $ENDALTER
Subroutine SOLVE calculates the output matrix FLEX from the equation
[KLL] [FLEX] = [i]
where the identity matrix was obtained by purging the second input to SOLVE.
11

REFERENCES
1. Robertson, Hugh J.: Evaluation of the Thin Deformable Active Optics Mirror Concept.NASA CR-2073, 1972.
2. Robertson, Hugh J.: Development of an Active Optics Concept Using a Thin DeformableMirror. NASA CR-1593, 1970.
3. Creedon, J. F.; and Lindgren, A. G.: Control of the Optical Surface of a Thin, Deform-able Primary Mirror With Application to an Orbiting Astronomical Observatory.Automatica. vol. 6, no. 5, Sept. 1970, pp. 643-660.
4. Howell, W. E.; and Creedon, J. F.: A Technique for Designing Active Control Systemsfor Astronomical-Telescope Mirrors. NASA TN D-7090, 1973.
5. MacNeal, Richard H., ed.: The NASTRAN Theoretical Manual. NASA SP-221, 1970.
6. Leissa, Arthur W.: Vibration of Plates. NASA SP-160, 1969.
7. Anon.: Technology Study for a Large Orbiting Telescope. 70-9443-1 (ContractNASw-1925), Opt. Syst. Div., Itek Corp., May 15, 1970. (Available as NASACR-110253.)
8. Anon.: Large Space Telescope - Continuation of a Technology Study. Itek 71-9463-2(Contract NASw 2174), Opt. Syst. Div., Itek Corp., Sept. 3, 1971. (Available asNASA CR-122851.)
12

250 25!
Figure 1.- Finite-element structural model.
13

5000
4000
3000 -
2000 -
MW
S*£
1000900800700600
500
400
300
200
100908070
SAMIS
•NASTRANNASTRAN with pad masses
_L10 20 30
Mode number40 50 60
Figure 2.- Modal frequency distribution for 0.762-meter-diameter solidspherical mirror with 60-to-l diameter-to-thickness ratio for com-parison of SAMIS and NASTRAN data.
14

(a) Mode 1.
Figure 3.- Contour plot for 0.762-meter-diameter solid spherical mirrorwith 60-to-l diameter-to-thickness ratio and kinematic mount at gridpoints 15, 119, and 247.
15

V Klnerasuppoi
(b) Mode 2.
Figure 3.- Continued.
16

V KineiaOcsiW'l
(c) Mode 3.
Figure 3.- Continued.
17

V Kinematicsupport
(d) Mode 4.
Figure 3.- Continued.
18

(e) Mode 5.
Figure 3.- Continued.
19

(f) Mode 6.
Figure 3.- Continued.
20

V Kinematicsupport
(g) Mode 7.
Figure 3.- Continued.
21
? ° 8 8 S 7 ? "
(h) Mode 8.
Figure 3.- Continued.
22

(i) Mode 9.
Figure 3.- Continued.
23

V HKIHUcugport
(j) Mode 10.
Figure 3.- Concluded.
24

1s0>
31—4o,ra
2.0
1.8
1.6
1.4
1.2
1.0
.8
.6
.2
0
-.2
-.4
-.6
-.8
Experimental
_L _L I I I I I _L I119 121 123 125 127 129 131 133 135
Grid point number
(a) Grid point 121.
Figure 4.- Displacement for normal force of 4.448 N at one grid point.
25

2.0
1.8
1.6
1.4
1.2
a0)
wa
.8
.6
.4
.2
0
-.2
-.4
-.6
NASTRAN
Experimental
I I I I I
119 121 123 125 127 129
Grid point number
(b) Grid point 123.
Figure 4.- Continued.
131 133 135
26

2.4 r-
2.2
2.0
1.8
1.6
1.4
1 1.2S3o, 1.0CQ
.8 -
.6
.4 h
.2
0 h-
-.2 J I
NASTRAN
Experimental
I I I I I I
119 121 123 125 127 129 131 133 135Grid point number
(c) Grid point 125.
Figure 4.- Continued.
27

2.4 p
2.2 -
2.0
1.8
1.6
1.4
I '-°•aCO Os -8
.6
.4
.2
0
-.2 I
NASTRAN
Experimental
I I I I I I I
119 121 123 125 127 129 131 133 135
Grid point number
(d) Grid point 127.
Figure 4.- Continued.
28

<us•atoa
1.0 r-
.8
.6
.4
.2
0
-.2
-.4
-.6
-.8 I
Experimental
I I I I I 1119 121 123 125 127 129 131
Grid point number
(e) Grid point 153.
Figure 4.- Continued.
\
_L133 135
29

0)
1.8
1.6
1.4
1.2
1.0
.8
.6
W 9
'2
o
-.2
-.4
-.6
-.8
-1.0
f
I I
NASTRAN
Experimental
I I I
119 121 123 125 127 129 131 133 135
Grid point number
(f) Grid point 155.
Figure 4.- Continued.
30

aO)
2.2
2.0
1.8
1.6
1.4
1.2
1.0
.6
.4
.2
0
-.2
-.4
-.6
-.8 I
Experimental
\\
I I I I I I I119 121 123 125 127 129 131 133 135
Grid point number
(g) Grid point 157.
Figure 4.- Continued.
31

2.2
2.0
1.8
1.6
1.4
1.2f§ 1.03i—iaW O
.1-1 «OQ
.6
.4
.2
0
-.2 1
Experimental
1 1 1 J L119 121 123 125 127 129
Grid point number
(h) Grid point 159.
Figure 4.- Continued.
J131 133 135
32

1.50
1.25
1.00
.75
.50
.25
sI•a,en
-.25
-.501—
-.75
-1.00
-1.25 h-
-1.50
-2.00
,\
\
NASTRAN
Experimental
I I I119 121 123 125 127 129 131 133 135
Grid point number
(i) Grid point 186.
Figure 4.- Continued.
33

2.00
1.75
1.50
1.25
1.00
.75
.50
.25
0
a -.25
-.50
-.75
-1.00
-1.25
-1.50
-2.00
eo>sooa•aCO
I
NASTRANExperimental
I I I I I I I
119 121 123 125 127 129 131Grid point number
(j) Grid point 188.
Figure 4.- Continued.
133 135
34

2.00
1.75
1.50
1.25
1.00
.75•aa>
o> .50orti—<a
s -25
0
-.25
-.50
-.75
-1.00
-1.25 I
NASTRANExperimental
I I I I I I119 121 123 125 127 129
Grid point number
(k) Grid point 190.
Figure 4.- Continued.
I I131 133 135
35
sao>
2.0 ,-
1.5
1.0
.5
0
CO
6 -i.o
-1.5
-2.0
-2.5
-3.0 I
\
NASTRAN
Experimental
I I I I I I J I119 121 123 125 127 129 131 133 135
Grid point number
(I) Grid point 215.
Figure 4.- Continued.
36

s
2.0
1.5
1.0
0.5
0
8 -0.5rt•a
-1.5
-2.0
-2.5
-3.0
\\
NASTRANExperimental
I I I _L _L J_119 121 123 125 127 129 131
Grid point number
(m) Grid point 217.
Figure 4.- Continued.
\
_L I133 135
37

2.0
1.5
1.0
.5
0
I -.5
•t
1 -1.0s<U
I •"0 -2.0
-2.5
-3.0
-3.5
-4.0 h
-4.5
\
NASTRAN
— Experimental
I I I119 121 123 125 127 129 131
Grid point number
(n) Grid point 239.
Figure 4.- Concluded.
133 135
38

(a) Mode 1.
Figure 5.- Contour plot for 0.762-meter-diameter solid spherical mirrorwith 60-to-l diameter-to-thickness ratio and supports moved to gridpoints 25, 120, and 236.
39

CO Mode 2.

3.
Figure 5-- Continued-

(d) Mode 4.
Figure 5.- Continued.
42

(e) Mode 5.
Figure 5.- Continued.
43

(f) Mode 6.
Figure 5.- Continued.
44

(g) Mode 7.
Figure 5.- Concluded.
45

s s
(a) Mode 1.
Figure 6.- Contour plot for 0.762-meter-diameter spherical mirror with60-to-l diameter-to-thickness ratio and central hole that is 22 per-cent of outside diameter with supports at grid points 15, 119, and 247.
46

(b) Mode 2.
Figure 6.- Continued.
47

s s
(c) Mode 3.
Figure 6.- Continued.
48

(d) Mode 4.
Figure 6.- Continued.
49

(e) Mode 5.
Figure 6.- Continued.
50

(f) Mode 6.
Figure 6.- Continued.
51

(g) Mode 7.
Figure 6.- Concluded.
52

o8I
5000
4000
3000
2000
1500
1000900800700600500400
300
200
150
100908070605040
30
20
15
r
0.762-m diam60-to-l ratio
3.048-m diam20-to-l ratio
3.048-m diam60-to-l ratio
I10 20 30
Mode number40 50 60
Figure 7.- Modal frequency distribution for spherical mirrors with centralhole that is 22 percent of outside diameter and supports at gridpoints 15, 119, and 247.
53

VKinematicsupport
(a) Mode 1.
Figure 8.- Contour plot for 3.048-meter-diameter spherical mirror with20-to-l diameter-to-thickness ratio and central hole that is 22 per-cent of outside diameter with supports at grid points 15, 119, and 247.
54

(b) Mode 2.
Figure 8.- Continued.
55

(c) Mode 3.
Figure 8.- Continued.
56

Figure 8.- Continued.
57

S 8
(e) Mode 5.
Figure 8.- Continued.
58

(f) Mode 6.
Figure 8.- Continued.
59

(g) Mode 7.
Figure 8.- Concluded.
60

CO
oCO
C<J
0)-4->d>
rt
ooo
oc-oto o
CO
In w
r <aw m*" C
1 I
rt £O I•£ o*H -l->0> I;C ^a <u
° Im TO•rH
h T30)
-w i-t0) I
•rH O•o to
gl• r-l tj
S ^•g B§ |S <D
§ S«ri CO
« Srt
s
03
vSrt
TJ
• rt05 ^J o<U C ^wsi <u a3 0 ^
ZH
61

oCO
oirt
oCO
oeo o
Cvl
o• i-H
•acoCDcu
oCO
0)
•sa«to X<M Q
o,O T3
.1-1 TH•H CQ
CO
S
CM<M
11• i-H -4->
S ^-a<4-l SO 0)e °O T3
ciI
>> 13a SC .fHCU JHS COg1 -a!H CQ
"5 «
I 1I?C LI
S ci 1£ o rt$-1 • -i-iS eo -Obe
62 NASA-Langley, 1973 32 L-8893

NATIONAL AERONAUTICS AND SPACE ADM fN ISTR ATION
WASHINGTON, D.C. 2O546
OFFICIAL BUSINESS
PENALTY FOR PRIVATE USE *3OO SPECIAL FOURTH-CLASS RATEBOOK
POSTAGE AND FEES PAIDNATIONAL. AERONAUTICS AND
SPACE ADMINISTRATION
431
POSTMASTER: If UlncMivcraMe (Section 158Poxtal Manual) Do Not Return
"The aeronautical and space activities of the United States shall beconducted so as to contribute , , . to the expansion of human knowl-edge of phenomena in the atmosphere and space. The Administrationshall provide for the widest practicable and appropriate disseminationof information concerning its activities and the results thereof."
—NATIONAL AERONAUTICS AND SPACE ACT OF 1958
NASA SCIENTIFIC AND TECHNICAL PUBLICATIONSTECHNICAL REPORTS: Scientific andtechnical information considered important,complete, and a lasting contribution to existingknowledge.
TECHNICAL NOTES; Information less broadin scope but nevertheless of importance as acontribution to existing knowledge.
TECHNICAL MEMORANDUMS.Information receiving limited distributionbecause of preliminary data, security classifica-tion, or other reasons. Also includes conferenceproceedings with either limited or unlimiteddistribution.
CONTRACTOR REPORTS: Scientific andtechnical information generated under a NASAcontract or grant and considered an importantcontribution to existing knowledge.
TECHNICAL TRANSLATIONS: Informationpublished in a foreign language consideredto merit NASA distribution in English.
SPECIAL PUBLICATIONS. Informationderived from or of value to NASA activities.Publications include final reports of majorprojects, monographs, data compilations,handbooks, sourcebooks, and specialbibliographies.
TECHNOLOGY UTILIZATIONPUBLICATIONS: Information on technologyused by NASA that may be of particularinterest in commercial and other non-aerospaceapplications. Publications include Tech Briefs,Technology Utilization Reports andTechnology Surveys.
Details on the availability of these publications may be obtained from:
SCIENTIFIC AND TECHNICAL INFORMATION OFFICE
N A T I O N A L A E R O N A U T I C S A N D S P A C E A D M I N I S T R A T I O N
Washington, D.C. 20546