
A World Class West End Camden’s West End Commission submission December 11 th 2012.
February 2014 Page 1 of 36
1 JANUARY TO 31 DECEMBER 2012
SUBMISSION
to
AUSTRALIAN COMPETITION & CONSUMER COMMISSION
in respect of
HUNTER VALLEY ACCESS UNDERTAKING
ROLL FORWARD ASSET BASE CEILING TEST
UNDERS AND OVERS ACCOUNT
REVISED FEBRUARY 2014
February 2014 Page 2 of 36
CONTENTS 1. INTRODUCTION & BACKGROUND ............................................................................................................... 3
1.1. 2011 HUNTER VALLEY COAL NETWORK ACCESS UNDERTAKING REQUIREMENTS .................................................... 3 1.2. FORM OF THIS SUBMISSION ............................................................................................................................... 4
2. RAB ROLL FORWARD .................................................................................................................................... 6
2.1. COMPONENT CALCULATION .............................................................................................................................. 6 2.2. COMPONENT VALUES ....................................................................................................................................... 7
2.2.1. RAB Start (RAB t-1 start) ...................................................................................................................... 7 2.2.2. Rate of Return (RoR) ............................................................................................................................ 8 2.2.3. Revenue [Out-turn Revenuet-1] ......................................................................................................... 8 2.2.4. Operating Expenditure [Out-turn Opext-1] ........................................................................................ 8 2.2.5. Net Capital Expenditure [Net Capext-1] ............................................................................................. 8
2.3. OUTCOME AND CLOSING VALUES ...................................................................................................................... 9
3. RAB FLOOR LIMIT ROLL FORWARD ......................................................................................................... 10
3.1. COMPONENT CALCULATION ............................................................................................................................ 10 3.2. COMPONENT VALUES ..................................................................................................................................... 11
3.2.1. RAB Floor Limit Opening Value [RAB Floor Limitt-1 start] ........................................................... 11 3.2.2. Consumer Price Index [CPIt-1] ........................................................................................................ 11 3.2.3. Net Capital Expenditure [Net Capext-1] ...................................................................................... 11 3.2.4. Depreciation [Depreciationt-1] ...................................................................................................... 12
3.3. OUTCOME AND CLOSING VALUES .................................................................................................................... 12 3.4. PRICING ZONE 3 RAB AND RAB FLOOR LIMIT COMPARISON .............................................................................. 13
4. CAPITAL EXPENDITURE ............................................................................................................................. 14
5. DISPOSALS .................................................................................................................................................... 16
6. CONTACT DETAILS – STAKEHOLDERS ..................................................................................................... 17
7. CEILING TEST ............................................................................................................................................... 18
7.1. COMPLIANCE SCOPE....................................................................................................................................... 18 7.2. ACCESS REVENUE .......................................................................................................................................... 19 7.3. FULL ECONOMIC COST ................................................................................................................................... 20
7.3.1. Maintenance costs .............................................................................................................................. 20 7.3.2. Network Control ................................................................................................................................. 21 7.3.3. Corporate Overheads ......................................................................................................................... 23
8. UNDERS & OVERS ACCOUNTING .............................................................................................................. 24
8.1. 1 JANUARY TO 31 DECEMBER 2012 UNDERS & OVERS BALANCE .............................................................. 24 8.2. OPERATION OF THE UNDERS AND OVERS ACCOUNT ................................................................................... 25
9. PRICING ZONE 3 – INTERIM INDICATIVE ACCESS CHARGES ................................................................ 26
10. SYSTEM WIDE TRUE UP TEST AUDIT ....................................................................................................... 27
11. CONTACT DETAILS (ARTC)........................................................................................................................ 29
APPENDIX A – HVAU SCHEDULE E ....................................................................................................................... 30
APPENDIX B – 1 JANUARY TO 31 DECEMBER 2012 MAJOR CAPITAL EXPENDITURE INCLUDED IN THE RAB/RAB FLOOR LIMIT .......................................................................................................................................... 31
APPENDIX C – 1 JANUARY TO 31 DECEMBER 2012 DISPOSALS ..................................................................... 32
APPENDIX D – 1 JANUARY TO 31 DECEMBER 2012 RAB FLOOR LIMIT ROLL FORWARD SUMMARY ...... 33
APPENDIX E – 1 JANUARY TO 31 DECEMBER 2012 RAB FLOOR LIMIT VALUES BY SEGMENT & RAB VALUES BY SEGMENT ............................................................................................................................................. 34
APPENDIX F - INTEREST DURING CONSTRUCTION – 1 JANUARY TO 31 DECEMBER 2012 ....................... 35
APPENDIX G – STAKEHOLDER LISTING ............................................................................................................... 36

February 2014 Page 3 of 36
1. Introduction & Background
Terms used in this submission are as per the 2011 Hunter Valley Coal Network Access Undertaking (“2011 HVAU”) unless otherwise obvious from the context.
1.1. 2011 Hunter Valley Coal Network Access Undertaking requirements
In accordance with the 2011 HVAU, ARTC must submit to the Australian Competition and Consumer Commission (“ACCC”) each calendar year1:
• documentation detailing roll-forward of the RAB (with respect to Pricing Zone 3) and the RAB Floor Limit, and comparisons between RAB and RAB Floor Limit with respect to Pricing Zone 3;
• documentation detailing calculations relevant to reconciliation of Access revenue with the applicable Ceiling Limit and any allocation of the total unders and overs amount including in Pricing Zone 3, where RAB is at or below RAB Floor Limit; and
• a copy of the Final Audit Report. Documentation requirements are set out in detail at Schedule G of the 2011 HVAU. The purpose of this submission is to demonstrate ARTC’s compliance with the requirements of Section 4.10 of the 2011 HVAU for the period 1 January 2012 to 31 December 2012 (“Compliance Period”). This submission is intended by ARTC to meet the information requirements detailed in clause 2 of Schedule G of the 2011 HVAU provided at Attachment 1. Under Section 4.10 of the 2011 HVAU, the ACCC is required to determine whether ARTC has undertaken: • roll-forward of the RAB and RAB Floor Limit in accordance with the 2011 HVAU
and, where the roll forward is not in accordance with the 2011 HVAU, determine what closing RAB or RAB Floor Limit would be in accordance with the 2011 HVAU;
• when required, the calculations relevant to reconciliation of Access revenue with
the applicable Ceiling Limit and calculation of any allocation of the total unders and overs amount in accordance with the 2011 HVAU, and where the calculations are not in accordance with the 2011 HVAU, determine what total unders and overs amount or allocation would be in accordance with the 2011 HVAU having regard to the operation of its unders and overs account;
In determining whether ARTC has undertaken roll-forward of the RAB and RAB Floor Limit in accordance with the 2011 HVAU, the ACCC may have regard to the submissions of relevant industry participants but if Capital Expenditure has been
1 Section 4.10 of the 2011 HVAU
February 2014 Page 4 of 36
endorsed by the RCG in accordance with Section 9 of the 2011 HVAU, the ACCC will not consider whether that Capital Expenditure is Prudent. The ACCC will publish its findings on its website and/or circulate to Access Holders in relation to the matters for its determination. ARTC will revise the closing RAB and manage Constrained Coal Customer Accounts in accordance with any determination by the ACCC. The ACCC will determine whether ARTC has incurred Efficient costs and Efficient operating expenditure in accordance with Section 4.5(b) of the 2011 HVAU, and determine the change (if any) to the total unders and overs amount or allocation and the closing RAB that results from Economic Cost only including Efficient costs and Efficient operating expenditure. The ACCC will review the Final Audit Report and will decide, and will notify ARTC of, any amounts of underpayment of rebates that are owing to Access Holders or amounts of overpayment of rebates ARTC is entitled to recover.
1.2. Form of this submission In order to ensure compliance with the information requirements set out at Schedule G of the 2011 HVAU, ARTC has sought to prepare this submission broadly in line with the prescribed order at clause 2 of Schedule G. Table 1 below sets out the sections in this submission together with the relevant information requirement under Schedule G of the 2011 HVAU.
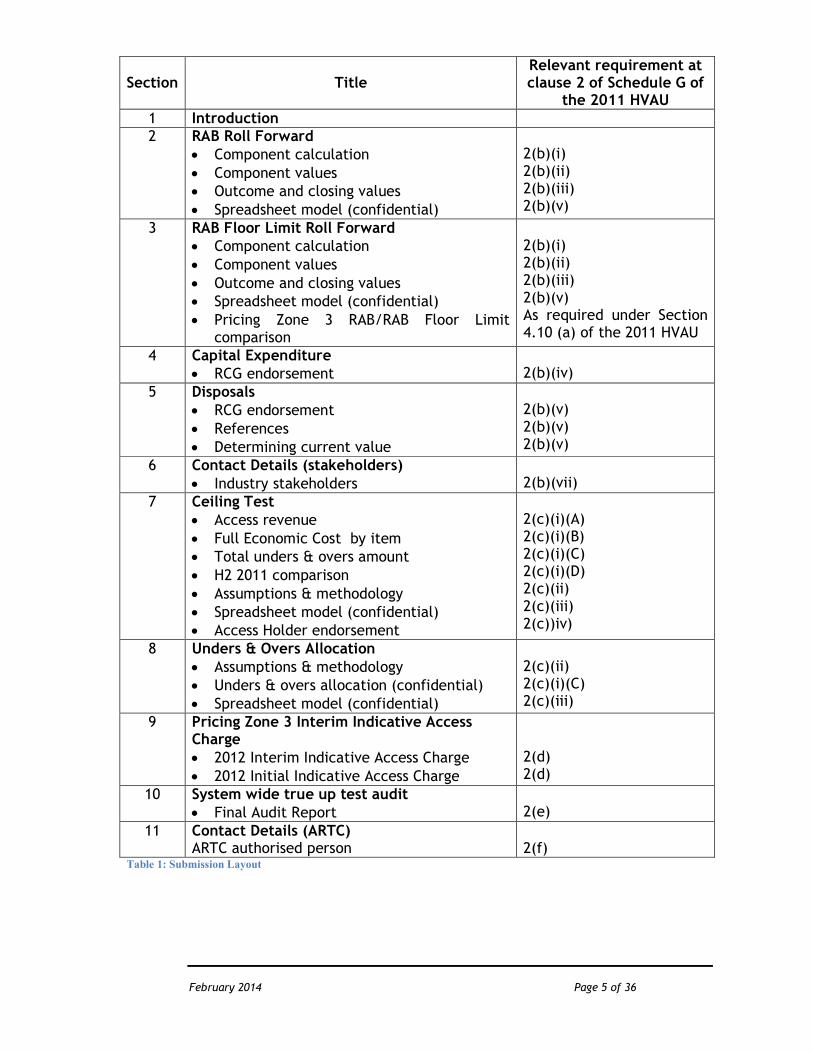
February 2014 Page 5 of 36
Section Title Relevant requirement at clause 2 of Schedule G of
the 2011 HVAU 1 Introduction 2 RAB Roll Forward
• Component calculation • Component values • Outcome and closing values • Spreadsheet model (confidential)
2(b)(i) 2(b)(ii) 2(b)(iii) 2(b)(v)
3 RAB Floor Limit Roll Forward • Component calculation • Component values • Outcome and closing values • Spreadsheet model (confidential) • Pricing Zone 3 RAB/RAB Floor Limit
comparison
2(b)(i) 2(b)(ii) 2(b)(iii) 2(b)(v) As required under Section 4.10 (a) of the 2011 HVAU
4 Capital Expenditure • RCG endorsement
2(b)(iv)
5 Disposals • RCG endorsement • References • Determining current value
2(b)(v) 2(b)(v) 2(b)(v)
6 Contact Details (stakeholders) • Industry stakeholders
2(b)(vii)
7 Ceiling Test • Access revenue • Full Economic Cost by item • Total unders & overs amount • H2 2011 comparison • Assumptions & methodology • Spreadsheet model (confidential) • Access Holder endorsement
2(c)(i)(A) 2(c)(i)(B) 2(c)(i)(C) 2(c)(i)(D) 2(c)(ii) 2(c)(iii) 2(c))iv)
8 Unders & Overs Allocation • Assumptions & methodology • Unders & overs allocation (confidential) • Spreadsheet model (confidential)
2(c)(ii) 2(c)(i)(C) 2(c)(iii)
9 Pricing Zone 3 Interim Indicative Access Charge • 2012 Interim Indicative Access Charge • 2012 Initial Indicative Access Charge
2(d) 2(d)
10 System wide true up test audit • Final Audit Report
2(e)
11 Contact Details (ARTC) ARTC authorised person
2(f)
Table 1: Submission Layout
February 2014 Page 6 of 36
2. RAB Roll Forward
2.1. Component Calculation Initial RAB The initial valuation of the Hunter Valley Coal Network was carried out by IPART in 2001. In December 2001, based on IPART’s report, the Minister of Transport advised the infrastructure manager at the time, Rail Infrastructure Corporation (RIC), of the opening asset values to be used effective from 1 July 19992. As part of annual compliance reviews conducted by IPART in accordance with the NSWRAU between 2000 and 2004, the 1999 opening values were rolled forward to determine the closing values for 2003-04, ahead of ARTC’s commencement of its lease of the Hunter Valley Coal Network in 2004-05. Since that time, asset values have been rolled forward as part of subsequent annual compliance assessments conducted by IPART in accordance with the NSWRAU to ultimately determine closing asset values as at 30 June 2011 as described earlier in this submission. Upon commencement of the 2011 HVAU, Section 4.4(a)(i) provides for applicable parts of the regulatory asset base to be ascribed a regulatory asset value in accordance with the NSW Rail Access Undertaking in force at the time immediately preceding the commencement date. These values have been set in accordance with the NSW Rail Access Undertaking as at the commencement date of the 2011 HVAU (1 July 2011). For those assets not ascribed a value for regulatory purposes under the NSWRAU, a valuation determined using the depreciated optimised replacement cost (DORC) methodology has been approved by the ACCC. RAB Roll Forward Calculation For Segments forming part of Pricing Zone 3 in Schedule E of the 2011 HVAU, RAB will be rolled forward annually according to the following methodology:
RABt start =RABt-1 end = (1 + RoR) x RABt-1 start – Out-turn Revenuet-1 + Out-turn Opext-1 + Net Capext-1 x (1 + 0.5 x RoR) where: RABt start: RAB at the start of the relevant calendar year (t)
(which, for the first year following the Commencement Date, would be the Initial RAB).
RABt-1 end: the RAB at the end of the preceding calendar year (t-
1).
2 http://www.railcorp.info/__data/assets/file/0015/672/Correspondence_from_Minister_to_RAC.pdf
February 2014 Page 7 of 36
RABt-1 start: the RAB at the start of the preceding calendar year (t-
1). RoR: the nominal pre tax Rate of Return. Out-turn Revenuet-1: the total Access revenue earned by ARTC in the
preceding calendar year (t-1) but will not include:
(i) a Capital Contribution received from an Applicant or an Access Holder; or
(ii) Access revenue returned to a Contributor as a result of the operation of a user funding agreement between the Contributor and ARTC.
Out-turn Opext-1: the total operating expenditure incurred by ARTC in the
preceding calendar year (t-1), on an Efficient basis, determined in accordance with sections 4.5(a)(i), (iv) and (vii) and 4.5(b).
Net Capex t-1: the net additions to the RAB in the preceding calendar
year (t-1), that is out-turn Capital Expenditure by ARTC less the written down value of any disposals during the preceding calendar year (t-1) on a Prudent basis, including interest costs incurred during construction up until 1 July in the calendar year the asset was commissioned, capitalised in the year the asset was commissioned and determined by reference to the relevant form of the Rate of Return (to the extent that Capital Expenditure is incurred on a Prudent basis, including interest costs), but will not include Capital Contributions.
2.2. Component Values
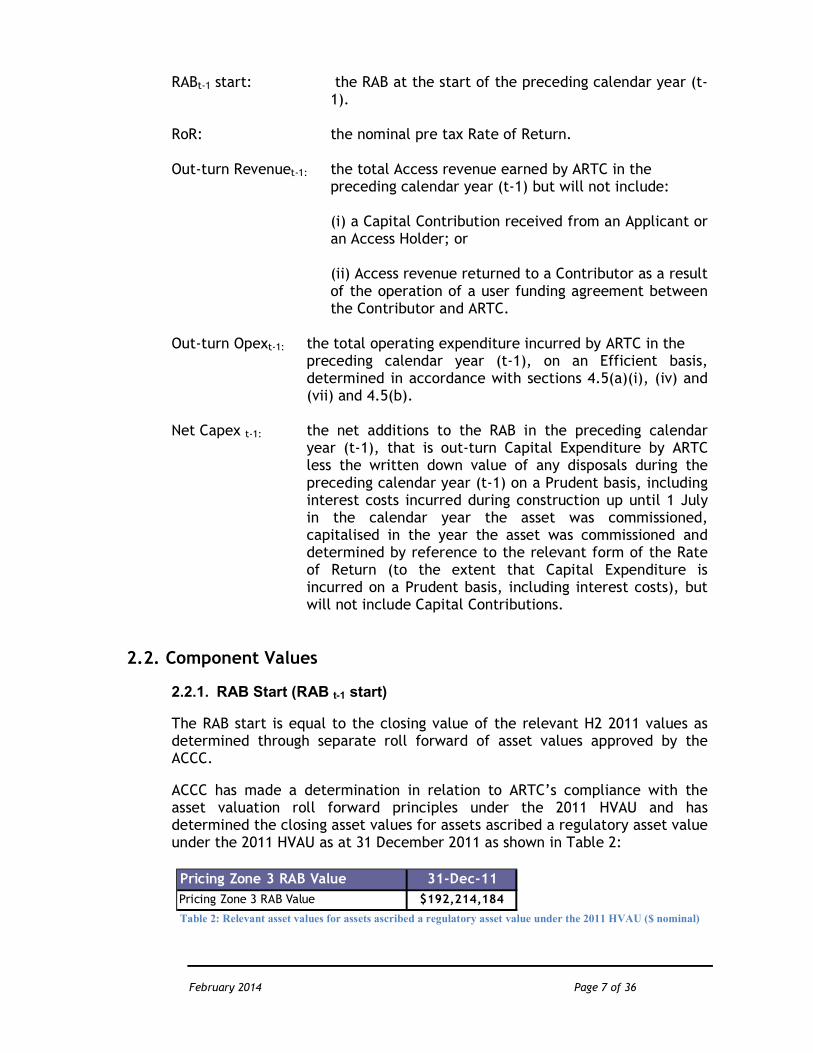
2.2.1. RAB Start (RAB t-1 start)
The RAB start is equal to the closing value of the relevant H2 2011 values as determined through separate roll forward of asset values approved by the ACCC.
ACCC has made a determination in relation to ARTC’s compliance with the asset valuation roll forward principles under the 2011 HVAU and has determined the closing asset values for assets ascribed a regulatory asset value under the 2011 HVAU as at 31 December 2011 as shown in Table 2:
Table 2: Relevant asset values for assets ascribed a regulatory asset value under the 2011 HVAU ($ nominal)
Pricing Zone 3 RAB Value 31-Dec-11
Pricing Zone 3 RAB Value $192,214,184
February 2014 Page 8 of 36
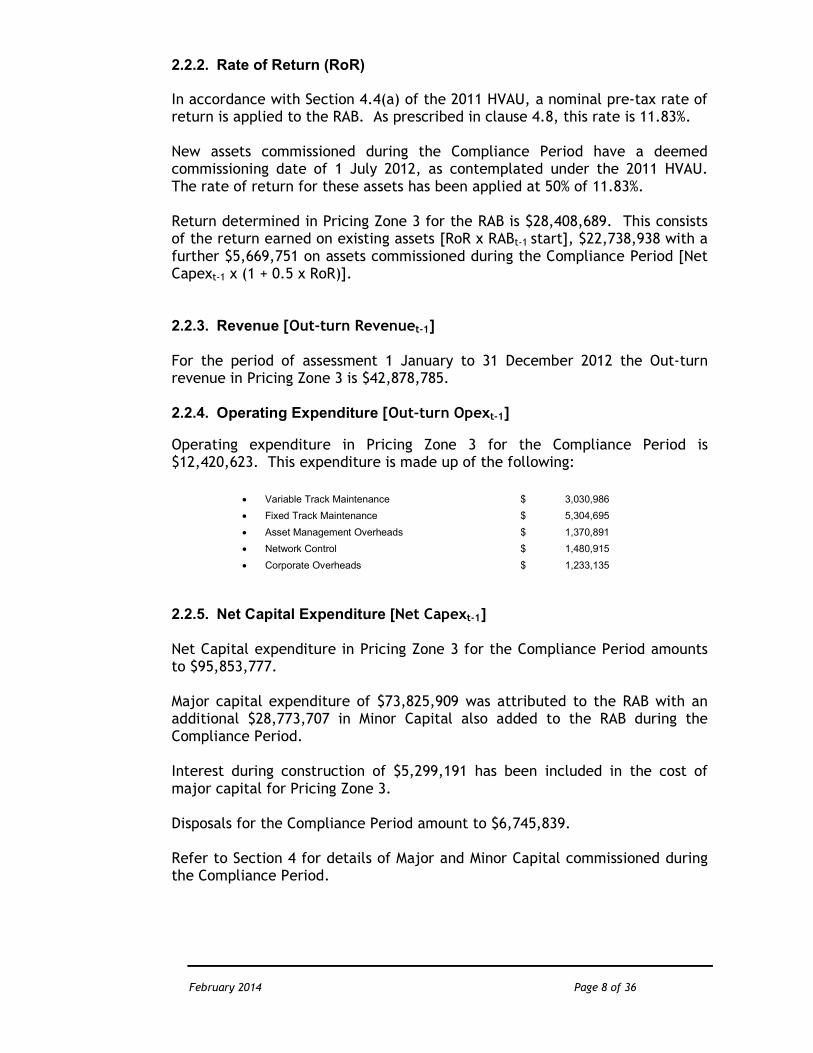
2.2.2. Rate of Return (RoR)
In accordance with Section 4.4(a) of the 2011 HVAU, a nominal pre-tax rate of return is applied to the RAB. As prescribed in clause 4.8, this rate is 11.83%. New assets commissioned during the Compliance Period have a deemed commissioning date of 1 July 2012, as contemplated under the 2011 HVAU. The rate of return for these assets has been applied at 50% of 11.83%. Return determined in Pricing Zone 3 for the RAB is $28,408,689. This consists of the return earned on existing assets [RoR x RABt-1 start], $22,738,938 with a further $5,669,751 on assets commissioned during the Compliance Period [Net Capext-1 x (1 + 0.5 x RoR)]. 2.2.3. Revenue [Out-turn Revenuet-1] For the period of assessment 1 January to 31 December 2012 the Out-turn revenue in Pricing Zone 3 is $42,878,785. 2.2.4. Operating Expenditure [Out-turn Opext-1]
Operating expenditure in Pricing Zone 3 for the Compliance Period is $12,420,623. This expenditure is made up of the following:
• Variable Track Maintenance $ 3,030,986
• Fixed Track Maintenance $ 5,304,695
• Asset Management Overheads $ 1,370,891
• Network Control $ 1,480,915
• Corporate Overheads $ 1,233,135
2.2.5. Net Capital Expenditure [Net Capext-1] Net Capital expenditure in Pricing Zone 3 for the Compliance Period amounts to $95,853,777. Major capital expenditure of $73,825,909 was attributed to the RAB with an additional $28,773,707 in Minor Capital also added to the RAB during the Compliance Period. Interest during construction of $5,299,191 has been included in the cost of major capital for Pricing Zone 3. Disposals for the Compliance Period amount to $6,745,839. Refer to Section 4 for details of Major and Minor Capital commissioned during the Compliance Period.
February 2014 Page 9 of 36
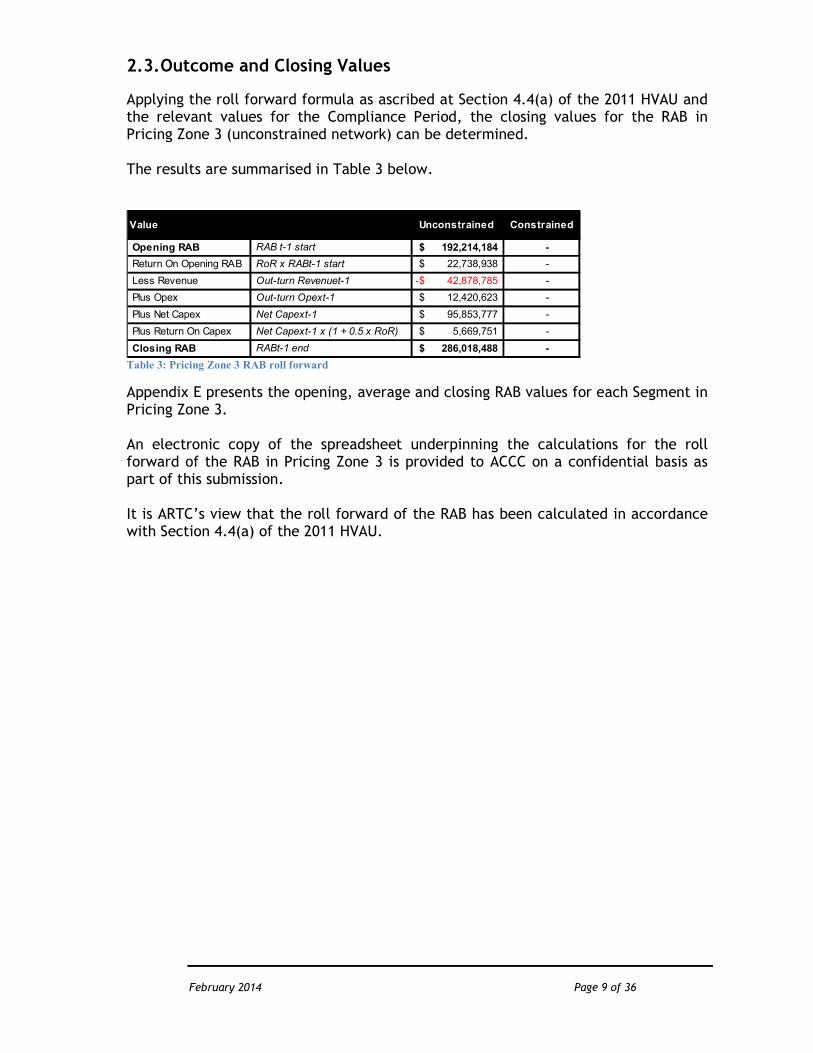
2.3. Outcome and Closing Values
Applying the roll forward formula as ascribed at Section 4.4(a) of the 2011 HVAU and the relevant values for the Compliance Period, the closing values for the RAB in Pricing Zone 3 (unconstrained network) can be determined. The results are summarised in Table 3 below.
Table 3: Pricing Zone 3 RAB roll forward
Appendix E presents the opening, average and closing RAB values for each Segment in Pricing Zone 3. An electronic copy of the spreadsheet underpinning the calculations for the roll forward of the RAB in Pricing Zone 3 is provided to ACCC on a confidential basis as part of this submission. It is ARTC’s view that the roll forward of the RAB has been calculated in accordance with Section 4.4(a) of the 2011 HVAU.
Value Unconstrained Constrained
Opening RAB RAB t-1 start 192,214,184$ -
Return On Opening RAB RoR x RABt-1 start 22,738,938$ -
Less Revenue Out-turn Revenuet-1 42,878,785-$ -
Plus Opex Out-turn Opext-1 12,420,623$ -
Plus Net Capex Net Capext-1 95,853,777$ -
Plus Return On Capex Net Capext-1 x (1 + 0.5 x RoR) 5,669,751$ -
Closing RAB RABt-1 end 286,018,488$ -
February 2014 Page 10 of 36
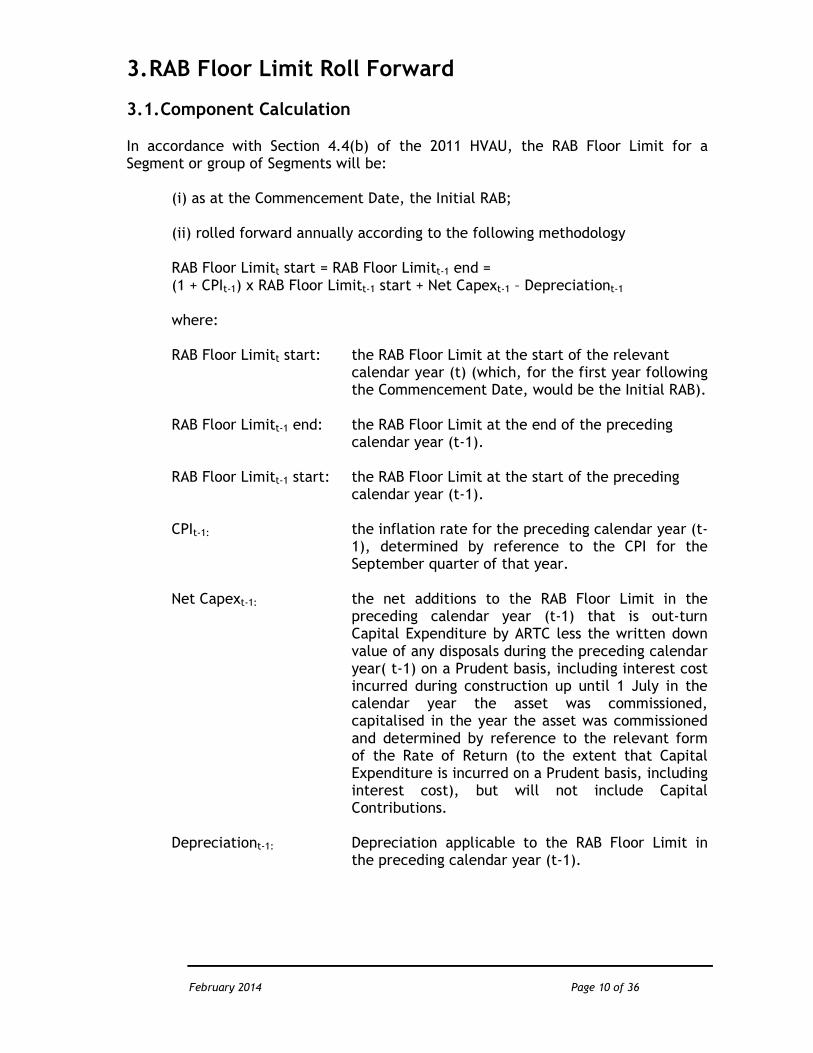
3. RAB Floor Limit Roll Forward 3.1. Component Calculation In accordance with Section 4.4(b) of the 2011 HVAU, the RAB Floor Limit for a Segment or group of Segments will be:
(i) as at the Commencement Date, the Initial RAB;
(ii) rolled forward annually according to the following methodology RAB Floor Limitt start = RAB Floor Limitt-1 end = (1 + CPIt-1) x RAB Floor Limitt-1 start + Net Capext-1 – Depreciationt-1 where: RAB Floor Limitt start: the RAB Floor Limit at the start of the relevant
calendar year (t) (which, for the first year following the Commencement Date, would be the Initial RAB).
RAB Floor Limitt-1 end: the RAB Floor Limit at the end of the preceding
calendar year (t-1). RAB Floor Limitt-1 start: the RAB Floor Limit at the start of the preceding
calendar year (t-1). CPIt-1: the inflation rate for the preceding calendar year (t-
1), determined by reference to the CPI for the September quarter of that year.
Net Capext-1: the net additions to the RAB Floor Limit in the
preceding calendar year (t-1) that is out-turn Capital Expenditure by ARTC less the written down value of any disposals during the preceding calendar year( t-1) on a Prudent basis, including interest cost incurred during construction up until 1 July in the calendar year the asset was commissioned, capitalised in the year the asset was commissioned and determined by reference to the relevant form of the Rate of Return (to the extent that Capital Expenditure is incurred on a Prudent basis, including interest cost), but will not include Capital Contributions.
Depreciationt-1: Depreciation applicable to the RAB Floor Limit in
the preceding calendar year (t-1).
February 2014 Page 11 of 36
3.2. Component Values
3.2.1. RAB Floor Limit Opening Value [RAB Floor Limitt-1 start]
As prescribed at clause 4.4 (a) of 2011 HVAU RAB Floor Opening Value is equal to the closing RAB Floor Limit approved by the ACCC for the half year compliance period ending 31 December 2011.
3.2.2. Consumer Price Index [CPIt-1] In accordance with clause 4.4(b) of the 2011 HVAU, CPI has been calculated to be 2.302%. The rate has been determined based on the variation in CPI from September 2011 (All Sydney) of 99.9 and September 2012 (All Sydney) of 102.2. For the Compliance Period CPI has been applied to the RAB Floor Limit Opening Value increasing the RAB Floor Limit by $24,717,225.
3.2.3. Net Capital Expenditure [Net Capext-1]
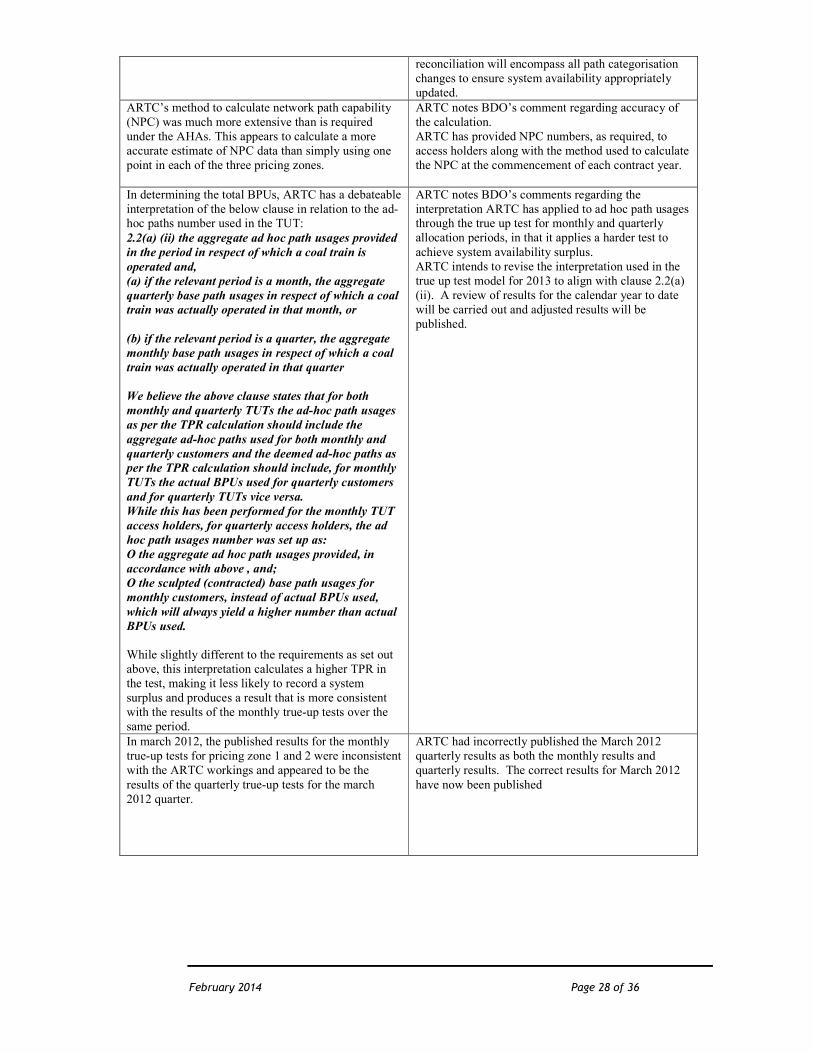
Major and minor capital additions for the Compliance Period have added a net value (including interest during construction and loss on disposals) of $519,404,725 to the RAB Floor Limit.
Major capital additions total $488,326,872 including interest during construction of $43,839,220 (as per Table 4 below) and minor capital of $39,567,969 has been included. Assets disposed of during the Compliance Period were commissioned prior to 1 July 2011 and have been included in the roll forward of Existing Assets. Disposals amount to $8,490,116. Appendix C provides a listing of disposals. Capital additions commissioned during the Compliance Period are ‘deemed’ to have been commissioned at the mid-point of the Compliance Period (1 July 2012) for the purposes of determining Depreciation. Financing costs and return are also determined on a consistent basis.
Table 4: Interest During Construction 2012
Refer to Section 4 of this document for supporting data and Appendix B for a detailed list of the Major Capital additions by Segment and confidential Attachment 2 for Minor Capital.
Project Name Interest During Construction
Maitland to Minimbah Third Road - Stage 2 $33,233,320.04
Nundah – Third Track $5,306,708.85
Bells Gate Passing Loop $2,084,483.53
Pages River Passing Loop $1,569,997.03
Chilcotts Creek Passing Loop $1,644,710.89
Total Interest During Construction 2012 $43,839,220.33

February 2014 Page 12 of 36
3.2.4. Depreciation [Depreciationt-1]
Section 4.7 of the 2011 HVAU provides that depreciation is calculated each year using a straight line methodology with respect to the remaining useful life of the assets. The remaining useful life approved as part of the 2011 HVAU has been determined to be the average remaining mine life of 22 years as at 2010 (taken to be at the midpoint of 2010).
Depreciation is charged on the inflation adjusted RAB Floor Limit Opening Value and Net Capital Expenditure incurred during the Compliance Period.
For assets existing as at 1 January 2012, Depreciation will be determined for the Compliance Period, with CPI applied as per 2011 HVAU. The applicable remaining useful life for these assets as at 1 January 2012 is 20.5 years. Assets commissioned during the Compliance Period are ‘deemed’ to have been commissioned at the mid-point of the Compliance Period (1 July 2012) for the purposes of determining Depreciation. The applicable remaining useful life for these assets as at 1 July 2012 is 20 years. Assets included in the Opening RAB Floor Limit value have been depreciated using the straight line methodology, as described above, by applying the remaining life applicable at time of commissioning or upon commencement of the 2011 HVAU, as appropriate.
Total depreciation charged is $66,368,462, split between $53,171,091 for existing assets and $13,197,371 for assets commissioned during the Compliance Period.
3.3. Outcome and Closing Values
Applying the roll forward formula and the relevant values for the Compliance Period 1 January to 31 December 2012, the closing values for the ARTC Hunter Valley Coal Network can be determined for the total network and for the constrained network. The results are summarised in Table 5 below.
Table 5: RAB Floor Limit roll forward
Appendix E presents the opening, average and closing RAB Floor Limit values for each Segment for the Compliance Period, clearly specifying which Segments form the Constrained Network.
Values Value Network
Opening Value RAB Floor Limit t - 1 start 1,073,587,301$
CPI CPI t-1 2.302% 24,717,225$
Cap Ex Net Capext-1 519,404,725$
Depreciation Depreciation t-1 66,368,462-$
Closing Value 1,551,340,789$

February 2014 Page 13 of 36
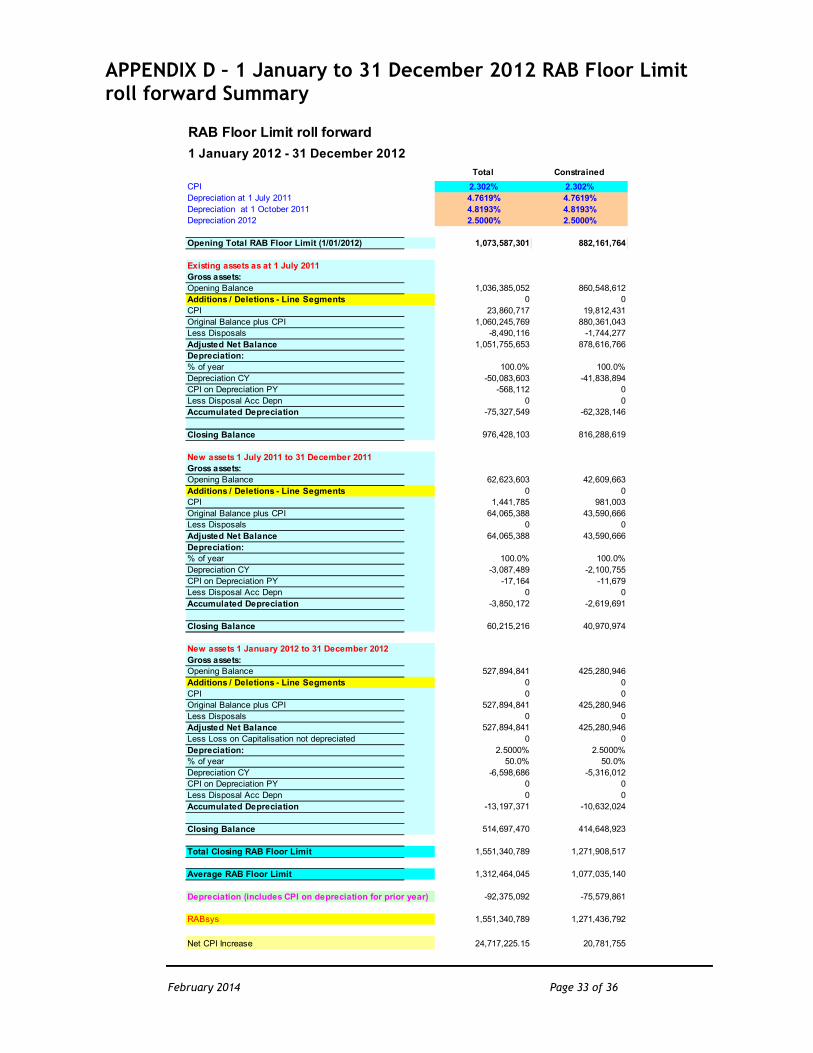
An electronic copy of the spreadsheet underpinning the calculations for the roll forward of the RAB Floor Limit is provided to ACCC on a confidential basis as part of this submission. A summary of the RAB Floor Limit roll forward is shown in Appendix D. It is ARTC’s view that the roll forward of the RAB Floor Limit has been calculated in accordance with the Section 4.4(b) of the 2011 HVAU.
3.4. Pricing Zone 3 RAB and RAB Floor Limit Comparison
Table 6: Pricing Zone 3 RAB Floor Limit 2012
Table 3 (in Section 2.3) shows a closing RAB value for Pricing Zone 3 assets for the Compliance Period of $286,018,488. Table 6 above shows a closing RAB Floor Limit value for Pricing Zone 3 assets for the Compliance Period of $275,579,819. This demonstrates that for Pricing Zone 3, RAB is higher than RAB Floor Limit. This confirms that Pricing Zone 3 is an unconstrained part of the Network. In accordance with Section 4.10(a)(ii) of the 2011 HVAU, ARTC is not required to detail calculations relevant to reconciliation of Access revenue with the applicable Ceiling Limit and calculations of any allocation of the total unders and overs amount.
Values PZ 3
Opening Value RAB Floor Limit t - 1 start 186,996,217$
CPI CPI t-1 2.302% 4,305,218$
Cap Ex Net Capex t-1 95,853,777$
Depreciation Depreciation t-1
11,575,394-$
Closing Value 275,579,819$

February 2014 Page 14 of 36
4. Capital Expenditure
Sections 7 to 11 of the 2011 HVAU set out compliance activities with regard to initiation of, industry consultation on, and funding of Capital Expenditure in relation to the Network. Specifically, these sections provide a framework for industry endorsement of Capital Expenditure through the Rail Capacity Group (RCG) for inclusion in the RAB. The Capital Consultation Document (Attachment 3) describes ARTC’s relevant compliance activities, and industry endorsement, with regard to the Compliance Period. Under the HVAU section 9.2; ARTC are obliged to convene and conduct regular monthly meetings of the RCG. The RCG is a regular industry forum to ensure Access Holders, prospective Access Holders and other industry stakeholders are provided relevant input to identify, prioritise and evaluate future network investments and refine the capital works programme. During 2012, ARTC followed a number of existing consultation and endorsement practices that had been applied historically under the NSWRAU which had been successful and were considered to be consistent with the above objectives. Such a practice included the process for development, endorsement and delivery of the minor capital programme, where the programme was presented for endorsement, indicative works and costings provided within that programme were provided, the programme was endorsed, and the works delivered. It was generally accepted that the detail of the programme related to planned works and cost estimates and that at the detailed level the nature of the works could change in terms of scope, priority and timing depending on prevailing circumstances such as identified network conditions and access to the network. This existing practice was intended to be explicitly provided for in the RCG process at Section 9(e)(ii) of the HVAU. Consistent with this, ARTC has sought RCG endorsement for the minor capital programme in its entirety rather than as individual works, and has provided an indicative scope of works as planned and cost estimates for these. Due to this history, ARTC continued a consultation and endorsement approach for the minor capital program consistent with the above in H2 2011 under the HVAU, on the understanding that the intent of the wording in the HVAU, and the approach itself was acceptable to industry stakeholders, the RCG and the ACCC. Following the initial 2012 Annual Compliance submission, ARTC has engaged with the ACCC and recognises that the ACCC is seeking greater clarity around the consultation and endorsement of minor capital expenditure. It is ARTC’s understanding that the ACCC is now seeking increased evidence of RCG consultation in relation to the minor capital programme and variations to it as described earlier in order to determine whether minor capital expenditure has been incurred on a Prudent basis. ARTC proposes that in the future RCG be kept informed of the progress of the endorsed minor capital program where material variations are identified. That is,

February 2014 Page 15 of 36
projects showing a forecast variance to cost to complete of +/- $50,000 of the amount endorsed or have encountered material change to timely delivery. ARTC has initiated the process to amend the current RCG consultation and endorsement process accordingly. It is intended that updates regarding delivery of the minor capital program will routinely be provided on a six monthly basis. ARTC will continue to work with the RCG to develop a satisfactory process that it hopes will assist the ACCC in coming to a view as to whether expenditure in relation to the minor capital works program has been incurred on a Prudent basis. To this end, ARTC will keep the ACCC informed of progress in relation to this development process. Capital Expenditure on new and existing assets to be included in the RAB and RAB Floor Limit for the Compliance Period is set out in Appendix B. This appendix details Major Capital Expenditure for each project commissioned during the Compliance Period. Minor capital has been detailed in confidential Attachment 2, together with the Segment that the Capital Expenditure relates to. Evidence of Access Seekers endorsement of Capital Expenditure as required under Schedule G of the 2011 HVAU is provided in Attachment 4 (not for publication).

February 2014 Page 16 of 36
5. Disposals
Capital works resulted in asset disposals for the Compliance Period amounting to $8,490,116. In relation to assets ascribed a regulatory asset value under the NSWRAU, ARTC has calculated:
• disposal values, based on the written down RAB values (with reference to the Booz Allen Hamilton DORC database determined under the NSWRAU in 2001); and
• ARTC’s net loss on disposal, calculated as the written down RAB value less any recovery on disposal (either through an adjustment to inventory or recovery as scrap sales).
The ‘net’ loss on disposals is therefore included in the ‘cost items’ for this submission (as detailed in Table 7 of Section 7.1). An electronic copy of the spreadsheet calculating the RAB disposal values and net loss on disposals referenced, where possible, to the Booz Allen DORC database is confidentially provided to the ACCC as part of this submission. Appendix C provides a summary of the disposals and net loss on disposals for the relevant assets.

February 2014 Page 17 of 36
6. Contact Details – Stakeholders
In accordance with Schedule G, Section 2(b)(vii) of the 2011 HVAU, a list of stakeholders has been confidentially provided for use by the ACCC at Appendix G.
The name, address and contact details (including email address) of stakeholders considered by ARTC to be relevant Applicants and Access Holders and other parties consulted regarding compliance matters. This is to include a contact at CEO/Executive level for the purpose of an ACCC letter and a regular operational contact for email notification. Where a stakeholder identified by ARTC is not a relevant Applicant or Access Holder, ARTC will indicate their relationship with ARTC and/or their interest in ARTC’s compliance, for instance: end user, industry advocate, etc.

February 2014 Page 18 of 36
7. Ceiling Test
7.1. Compliance Scope The Ceiling Test Model (provided to ACCC as part of this submission on a confidential basis) is used to test Access revenue for mines or a combination of mines against the applicable Ceiling Limit to determine the Constrained Network and Constrained Group of Mines as contemplated under the 2011 HVAU. The Ceiling Test Model calculates the amount of Access Revenue and the Economic Cost across the Network Segments utilised by mine or a combination of mines. This allows for testing combinations of mines, including those combinations that could potentially fail the Ceiling Test (i.e. where Access revenue for that combination of mines exceeds Economic Cost for the Segments used by that mine or combination of mines). The combination of mines that is closest to, or exceeds the economic cost for the relevant Network Segments is called the Constrained Group of Mines and the Segments comprise the Constrained Network.
Table 7 below summarises the results of the Ceiling Test Model result for the Constrained Network. A comparison with revenue and costs associated with the constrained network as determined by ACCC in relation to 1 July to 31 December 2011 compliance period has been included. This is intended as a proxy, in the absence of better information, for information required under Schedule G, Section 2(c)(i)(D)of the 2011 HVAU.

February 2014 Page 19 of 36
Table 7: 2012 CY Ceiling Test
7.2. Access Revenue Clause 4.3(a) of 2011 HVAU requires that the Access revenue from any Access Holders or group of Access Holders must not exceed the Economic Cost of those Segments, on a stand-alone basis, identified as forming part of Pricing Zone 1 and 2 in Schedule E (refer Appendix A). This is defined in the 2011 HVAU as the Ceiling Limit. In relation to Pricing Zone 3, 4.3(b) requires that Access revenue from any Access Holder or group of Access Holders must not exceed the Ceiling Limit where the RAB for those Segments is equal to or falls below the RAB Floor Limit for those Segments
ARTC Total ARTC Total
H2 2011 December 2012
millions Actuals Actuals
GTKs GTK GTK
Export 10,696 22,256
Domestic 656 1,456
Total 11,351 23,712
Revenue
Total Revenue 95.56 241.82
Operating Costs
Infrastructure Costs
Variable 9.15 27.15
Fixed 7.54 23.82
Shared Maintenance 7.86 18.27
Total Maintenance Costs 24.55 69.23
Expensed Project Costs 1.50
Total Infrastructure 24.55 70.73
Network Control 3.40 9.30
Corporate Overheads 5.65 12.31
Total Operating Cost 33.59 92.34
Depreciation 21.00 54.57
Net Loss on Disposal 0.89 1.74
Total Cost 55.48 148.65
Profit/Loss 40.08 93.17
Total ROA 39.36 97.99
Full Economic Costs 94.83 246.64
Revenue - Costs 0.73 -4.82
Average Asset Base 864.08 1076.80
CEILING TEST DEC 2012
TABLE 7
February 2014 Page 20 of 36
at the end of the calendar year (t-1). For the Compliance Period, the RAB Floor Limit is below the RAB for the Segments comprising Pricing Zone 3. From 1 February 2012 Access Holders transitioned to executed and operational Access Holder Agreements. During the Compliance Period Access revenue was collected from both Access Holders and Rail Operators under existing Access Agreements, based on 2012 Interim Indicative Access Charges and other Charges as contemplated under the 2011 HVAU. The total Access revenue received from each mine within the Hunter Valley Network were obtained from ARTC’s billing systems. Access revenue collected and used as the basis for determining allocations of the total unders and overs amount to Constrained Coal Customer Accounts for the Compliance Period amounts to $241.82million. Constrained Coal volumes for the Compliance Period of 120.2 mT (compared to that occurring in the 1 July to 31 December 2011 compliance period, 56.3mT) supports the increase in Access revenue reported in the Compliance Period. The increase in Access Revenue for the Constrained Group of Mines also reflects the increase in Economic Cost for the Constrained Network as shown in Table 7. GTKs for the Constrained Group of Mines have not increased in alignment with the coal volumes. The GTKs reported are as expected and reflect the volumes transported from the mines for the Compliance Period. A change in the number paths utilised by Access Holders between H2 2011 and 2012 can be seen in the graph below.
Graph deleted to maintain confidentiality of volumes.
7.3. Full Economic Cost
7.3.1. Maintenance costs
Maintenance costs include major periodic maintenance (“MPM”) and reactive corrective routine maintenance (“RCRM”). As with the previous submission to the ACCC actual MPM costs have been used. Both RCRM and MPM costs are reported for each Segment and split between fixed and variable based upon an engineering assessment of the extent to which the activity varies in proportion with volume.
Total variable costs for each Segment are divided by total GTK’s (including non-coal and unconstrained GTKs) to derive a variable cost per GTK for each Segment.
All fixed maintenance costs for each Segment forming part of the Constrained Network is included in the Ceiling Limit in accordance with the 2011 HVAU. By the nature of maintenance costs, it could be expected that variable maintenance expenditure would vary with volume changes, while fixed

February 2014 Page 21 of 36
maintenance expenditure would depend more on movements in cyclic maintenance requirements which can vary independently of volume changes.
The overall cost of maintenance work performed by ARTC for the Compliance Period is largely in alignment with the costs incurred during H2 2011, when considered on a full year basis, and with maintenance costs forecast for 2012 as advised to Access Holders in pricing advice provided in late 2011 in accordance with the requirements of the 2011 HVAU. In that advice, an increase in fixed maintenance expenditure to that in 2011 was forecast to occur in 2012 largely due to a cyclic ballast cleaning program in Pricing Zone 2 commencing in 2012 (extending through to 2014). In addition mud hole rectification in Pricing Zone 1 was expected. An unexpected cost in fixed maintenance of $1.5M arose through the expensing of project costs for the Bengalla Loop. In that advice, maintenance expenditure was forecast to increase by around 36% over that in 2011 to reflect increased cyclic activity and volumes. Actual maintenance expenditure in 2012 was only 21% over that advised in 2011 due largely to the lower than expected task. Actual variable maintenance expenditure was around 16% lower than forecast in the advice, which is consistent with lower than forecast volumes. Excluding project cost expensed, fixed maintenance expenditure was 1% higher than forecast reflecting the advised forecast increase in cyclic maintenance activity on the network rather than volume. Shared Maintenance has seen a 12% (real) increase over H2 2011, amounting to $2.23M (adjusted for CPI). This increase reflects a step change in resourcing required for the Hunter Valley Coal Network. ARTC maintained the existing headcount from 2008 until 2012 for the Coal Network. As a result temporary contractors and consultants were used to supplement the existing workforce. Access Holders Agreements commit ARTC to provide a network that is fit for purpose and able to manage the volume growth contracted in 2012. ARTC has recruited in advance of this growth to provide continuity of service delivery as required by contracts with Access Holders. The new roles include:
• 2 x Project Managers - Project Delivery – commenced H2 2012 • 1 x Heavy Haul Manager • 1 x Delivery Manager Hunter Valley • 1 x Delivery Engineer Maitland • 3 x Infrastructure & Planning Resources
7.3.2. Network Control
Network control includes labour and materials associated with the delivery of the following functions:

February 2014 Page 22 of 36
• train control and signalling • train planning and programming • operations and customer management
• train communication costs Network control costs are apportioned to the Hunter Valley on the basis of area of coverage of the train control and signalling function required to operate that section of the network and where this is not relevant, on a train kilometre basis in accordance with Section 4.6 of the 2011 HVAU. Network control also includes the terminal management costs associated with the delivery of:
• yard control • signalling • incident management
Network control costs for the Compliance Period of $9.30M, have increased based on a full year comparison with network control costs approved by ACCC for H2 2011. Primary contributors to the increase in the provision of Network Control include:- • Transitioning Costs for new staff associated with high 2011 staff turnover.
Thirteen new Network controllers commenced in calendar 2012 compared to eight in calendar 2011. The final quarter of 2011 experienced an unusually high staff turnover. To ensure the ongoing safety and efficient operation of the network vacancies are covered with the use of overtime for existing Network Control staff, with these costs continuing during the months required for new staff to become competent through provision of job specific training, largely provided in house, as well as a period of on the job side-by-side training to develop business and day of operations experience enabling the recruited replacement to carry out the controller function solo.
• New positions to support the ARTC functions within the HVCCC sponsored Integrated Live Run approach. In 2011 a coal chain service provider process resulted in a HVCCC Board supported initiative to provide tools and processes to an Integrated Live Run team approach to managing day of operations disruptions. Commensurate with the ARTC’s unique position within the coal chain and the new subsequent partially formed tools and processes, ARTC allocated extra network controller resources to fulfil the functions identified by the process to complement the newly created HVCCC roles “LR Coordinator”.
• New positions to enable workload management required due to growth of the Ulan line and Gunnedah basin volumes. Historically train control management of the Ulan line and Gunnedah basin line to Werris Creek was able to be managed by a single train control board, but following the consideration of a number of factors and formidable growth forecasts five extra employees were engaged in 2012 in anticipation of the introduction of a separate fulltime board to manage the Ulan branch traffic.

February 2014 Page 23 of 36
7.3.3. Corporate Overheads
Corporate overheads include labour and materials associated with the following functions:
• human resources • property • legal • information technology • finance • procurement • risk and safety • CEO office
Corporate overheads are allocated to the Hunter Valley Network by train km, in accordance with Section 4.6 of the 2011 HVAU. Corporate overhead costs are largely in alignment with H2 2011(refer Table 7) based on a full year comparison for the Compliance Period, with a small increase on H2 2011 Corporate Overheads of $609k (when adjusted for CPI). This reflects the increased share of Constrained Coal Train Kms of total ARTC Network Train Kms compared to that of H2 2011.

February 2014 Page 24 of 36
8. Unders & Overs Accounting
8.1. 1 January to 31 December 2012 Unders & Overs Balance Total Access revenue earned by ARTC from the Constrained Group of Mines was compared to the Economic Cost of the Constrained Network, including the operating costs described in section 7 of this submission Depreciation, net loss on disposal and half of the real Return of 9.10% based on the average RAB Floor Limit for the 1 January to 31 December 2012 Compliance Period, as detailed in Section 2. The difference between Access revenue for the Constrained Group of Mines and Economic Cost of the Constrained Network (Ceiling Limit) results in a total unders and overs amount for the 1 January to 31 December 2012 Compliance Period as contemplated at Section 4.9 of the 2011 HVAU and as otherwise agreed with the ACCC (refer section 2.1 of this submission), as shown in Table 8 below.
Table 8: Unders & Overs
The unders and overs amount for 1 July to 31 December 2011 compliance period reflects the ACCC’s determination with respect to its assessment in 2012 in accordance with the 2011 HVAU. It is ARTC’s intention to bring this amount to zero as at 30 April 2013, by refunding $0.73M to relevant rail operators. ARTC’s 2012 Interim Indicative Access Charges and other Charges that applied during the Compliance Period were based on a forecast volume of 125M nett tonnes for constrained export coal and 8.2M nett tonnes for constrained domestic coal for the 2012 calendar year. These forecasts were obtained directly from coal producers and adjusted by ARTC to align to coal chain capacity declared by the Hunter Valley Coal Chain Coordinator (HVCCC) for that period. Actual volumes during the Compliance Period were below the forecast. This is the principal reason for the under recovery of revenue for the Compliance Period It is ARTC’s view that the Ceiling Test and determination of the Unders and Overs amount has been carried out on an Efficient cost basis, and in accordance with Section 4 of the 2011 HVAU. The relativity of the under recovery to the actual volumes railed demonstrates the robustness of the modelling used to determine 2012 Interim Indicative Access Charges, 2012 Initial Indicative Access Charges and other Charges, and ARTC’s control of efficient costs. As requested by the ACCC on 19th April 2013, a separate confidential analysis of unit costs will be provided in support of this submission.
ARTC TOTAL ARTC TOTAL
H2 2011 December 2012
millions Actuals Actuals
ARTC Unders/Overs
Opening Value -20.93 0.73
Refunds/Payments 20.93 -0.73
Yearly adjustment 0.73 -4.82
Closing Value 0.73 -4.82

February 2014 Page 25 of 36
8.2. Operation of the Unders and Overs Account As indicated in section 8.1 of this submission, ARTC is in the process of reconciling the 1 July to 31 December 2011 total unders and overs amount and unders and overs account balances with relevant Access Seekers in accordance with the 2011 HVAU. As part of this submission ARTC has provided the allocation spreadsheet to the ACCC on a confidential basis that determines allocations of the total unders and overs amount for the Compliance Period to Constrained Coal Customers in accordance with the requirements set out in clause 4.9(b)(iii). As Access revenue has been earned during the Compliance Period under Access Agreements with both Access Holders and rail operators, Constrained Coal Customer Accounts have been established for Access Holders only for the Compliance Period.
February 2014 Page 26 of 36
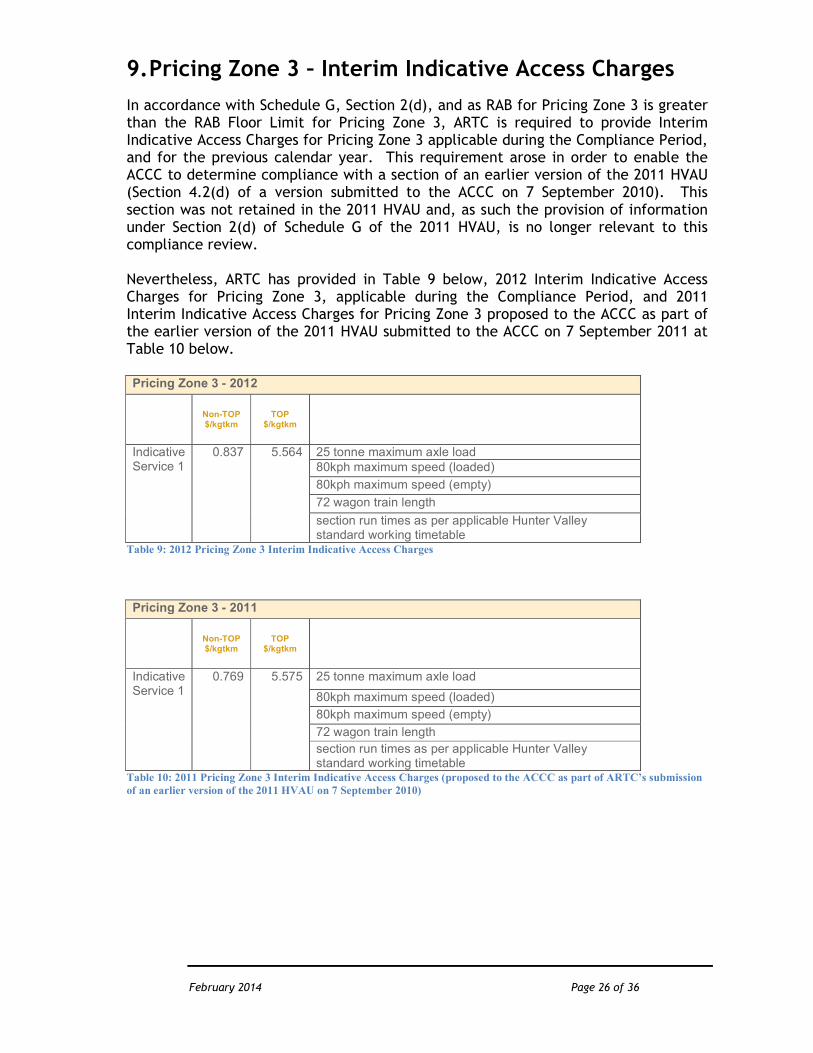
9. Pricing Zone 3 – Interim Indicative Access Charges
In accordance with Schedule G, Section 2(d), and as RAB for Pricing Zone 3 is greater than the RAB Floor Limit for Pricing Zone 3, ARTC is required to provide Interim Indicative Access Charges for Pricing Zone 3 applicable during the Compliance Period, and for the previous calendar year. This requirement arose in order to enable the ACCC to determine compliance with a section of an earlier version of the 2011 HVAU (Section 4.2(d) of a version submitted to the ACCC on 7 September 2010). This section was not retained in the 2011 HVAU and, as such the provision of information under Section 2(d) of Schedule G of the 2011 HVAU, is no longer relevant to this compliance review. Nevertheless, ARTC has provided in Table 9 below, 2012 Interim Indicative Access Charges for Pricing Zone 3, applicable during the Compliance Period, and 2011 Interim Indicative Access Charges for Pricing Zone 3 proposed to the ACCC as part of the earlier version of the 2011 HVAU submitted to the ACCC on 7 September 2011 at Table 10 below. Pricing Zone 3 - 2012
Non-TOP $/kgtkm
TOP $/kgtkm
Indicative Service 1
0.837 5.564 25 tonne maximum axle load 80kph maximum speed (loaded)
80kph maximum speed (empty)
72 wagon train length
section run times as per applicable Hunter Valley standard working timetable
Table 9: 2012 Pricing Zone 3 Interim Indicative Access Charges
Pricing Zone 3 - 2011
Non-TOP $/kgtkm
TOP $/kgtkm
Indicative Service 1
0.769 5.575 25 tonne maximum axle load
80kph maximum speed (loaded)
80kph maximum speed (empty)
72 wagon train length
section run times as per applicable Hunter Valley standard working timetable
Table 10: 2011 Pricing Zone 3 Interim Indicative Access Charges (proposed to the ACCC as part of ARTC’s submission
of an earlier version of the 2011 HVAU on 7 September 2010)
February 2014 Page 27 of 36
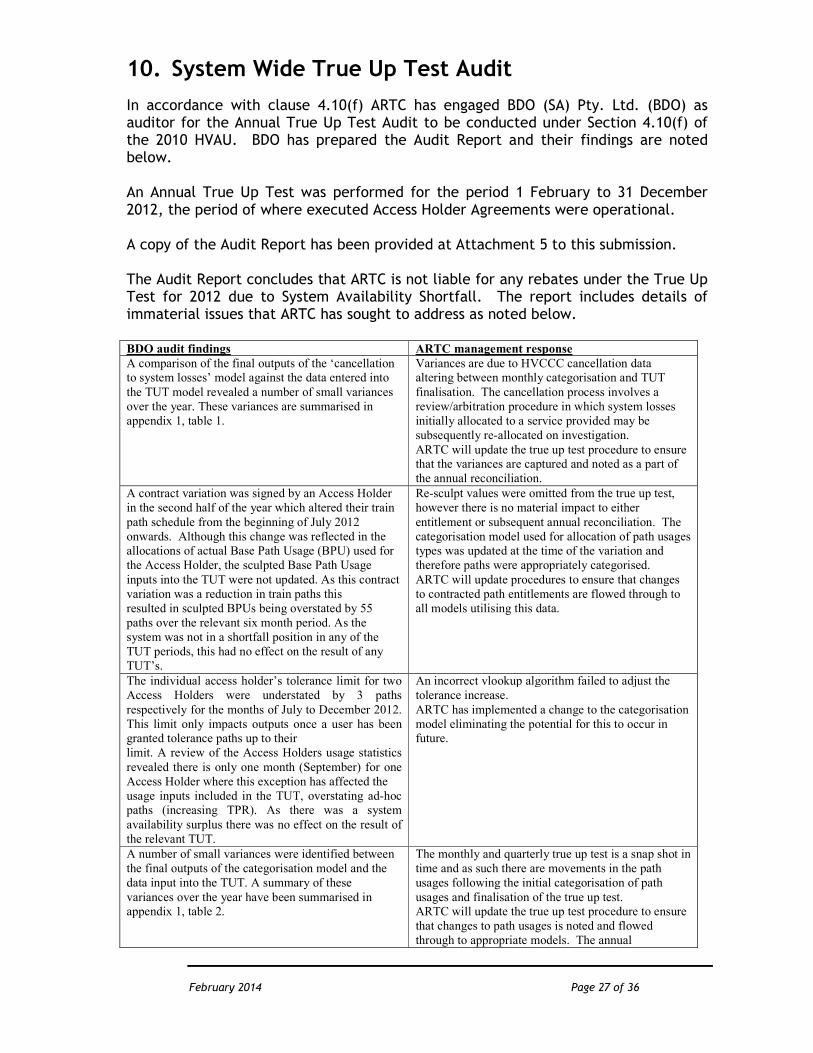
10. System Wide True Up Test Audit
In accordance with clause 4.10(f) ARTC has engaged BDO (SA) Pty. Ltd. (BDO) as auditor for the Annual True Up Test Audit to be conducted under Section 4.10(f) of the 2010 HVAU. BDO has prepared the Audit Report and their findings are noted below. An Annual True Up Test was performed for the period 1 February to 31 December 2012, the period of where executed Access Holder Agreements were operational. A copy of the Audit Report has been provided at Attachment 5 to this submission. The Audit Report concludes that ARTC is not liable for any rebates under the True Up Test for 2012 due to System Availability Shortfall. The report includes details of immaterial issues that ARTC has sought to address as noted below. BDO audit findings ARTC management response
A comparison of the final outputs of the ‘cancellation
to system losses’ model against the data entered into
the TUT model revealed a number of small variances
over the year. These variances are summarised in
appendix 1, table 1.
Variances are due to HVCCC cancellation data
altering between monthly categorisation and TUT
finalisation. The cancellation process involves a
review/arbitration procedure in which system losses
initially allocated to a service provided may be
subsequently re-allocated on investigation.
ARTC will update the true up test procedure to ensure
that the variances are captured and noted as a part of
the annual reconciliation.
A contract variation was signed by an Access Holder
in the second half of the year which altered their train
path schedule from the beginning of July 2012
onwards. Although this change was reflected in the
allocations of actual Base Path Usage (BPU) used for
the Access Holder, the sculpted Base Path Usage
inputs into the TUT were not updated. As this contract
variation was a reduction in train paths this
resulted in sculpted BPUs being overstated by 55
paths over the relevant six month period. As the
system was not in a shortfall position in any of the
TUT periods, this had no effect on the result of any
TUT’s.
Re-sculpt values were omitted from the true up test,
however there is no material impact to either
entitlement or subsequent annual reconciliation. The
categorisation model used for allocation of path usages
types was updated at the time of the variation and
therefore paths were appropriately categorised.
ARTC will update procedures to ensure that changes
to contracted path entitlements are flowed through to
all models utilising this data.
The individual access holder’s tolerance limit for two
Access Holders were understated by 3 paths
respectively for the months of July to December 2012.
This limit only impacts outputs once a user has been
granted tolerance paths up to their
limit. A review of the Access Holders usage statistics
revealed there is only one month (September) for one
Access Holder where this exception has affected the
usage inputs included in the TUT, overstating ad-hoc
paths (increasing TPR). As there was a system
availability surplus there was no effect on the result of
the relevant TUT.
An incorrect vlookup algorithm failed to adjust the
tolerance increase.
ARTC has implemented a change to the categorisation
model eliminating the potential for this to occur in
future.
A number of small variances were identified between
the final outputs of the categorisation model and the
data input into the TUT. A summary of these
variances over the year have been summarised in
appendix 1, table 2.
The monthly and quarterly true up test is a snap shot in
time and as such there are movements in the path
usages following the initial categorisation of path
usages and finalisation of the true up test.
ARTC will update the true up test procedure to ensure
that changes to path usages is noted and flowed
through to appropriate models. The annual
February 2014 Page 28 of 36
reconciliation will encompass all path categorisation
changes to ensure system availability appropriately
updated.
ARTC’s method to calculate network path capability
(NPC) was much more extensive than is required
under the AHAs. This appears to calculate a more
accurate estimate of NPC data than simply using one
point in each of the three pricing zones.
ARTC notes BDO’s comment regarding accuracy of
the calculation.
ARTC has provided NPC numbers, as required, to
access holders along with the method used to calculate
the NPC at the commencement of each contract year.
In determining the total BPUs, ARTC has a debateable
interpretation of the below clause in relation to the ad-
hoc paths number used in the TUT:
2.2(a) (ii) the aggregate ad hoc path usages provided
in the period in respect of which a coal train is
operated and,
(a) if the relevant period is a month, the aggregate
quarterly base path usages in respect of which a coal
train was actually operated in that month, or
(b) if the relevant period is a quarter, the aggregate
monthly base path usages in respect of which a coal
train was actually operated in that quarter
We believe the above clause states that for both
monthly and quarterly TUTs the ad-hoc path usages
as per the TPR calculation should include the
aggregate ad-hoc paths used for both monthly and
quarterly customers and the deemed ad-hoc paths as
per the TPR calculation should include, for monthly
TUTs the actual BPUs used for quarterly customers
and for quarterly TUTs vice versa.
While this has been performed for the monthly TUT
access holders, for quarterly access holders, the ad
hoc path usages number was set up as:
O the aggregate ad hoc path usages provided, in
accordance with above , and;
O the sculpted (contracted) base path usages for
monthly customers, instead of actual BPUs used,
which will always yield a higher number than actual
BPUs used.
While slightly different to the requirements as set out
above, this interpretation calculates a higher TPR in
the test, making it less likely to record a system
surplus and produces a result that is more consistent
with the results of the monthly true-up tests over the
same period.
ARTC notes BDO’s comments regarding the
interpretation ARTC has applied to ad hoc path usages
through the true up test for monthly and quarterly
allocation periods, in that it applies a harder test to
achieve system availability surplus.
ARTC intends to revise the interpretation used in the
true up test model for 2013 to align with clause 2.2(a)
(ii). A review of results for the calendar year to date
will be carried out and adjusted results will be
published.
In march 2012, the published results for the monthly
true-up tests for pricing zone 1 and 2 were inconsistent
with the ARTC workings and appeared to be the
results of the quarterly true-up tests for the march
2012 quarter.
ARTC had incorrectly published the March 2012
quarterly results as both the monthly results and
quarterly results. The correct results for March 2012
have now been published

February 2014 Page 29 of 36
11. Contact Details (ARTC)
In relation to this compliance submission, in accordance with Schedule G, Section 2(f), further information in relation to this submission can be arranged through:
Glenn Edwards Manager Economic Regulation Telephone: 08 8217 4292 Email: [email protected]

February 2014 Page 30 of 36
APPENDIX A – HVAU Schedule E
February 2014 Page 31 of 36
APPENDIX B – 1 January to 31 December 2012 Major Capital Expenditure included in the RAB/RAB Floor Limit
Sector / Segment # Line Segment Activity CAPEX Project TypeCapital Expenditure
$MWritten Down Value $M
Constrained Network
(Yes / No)
947 Farley to Branxton
5255 - Maitland to
Minimbah Third Road -
Stage 2
Major Capital Works
Project
166.663
Yes
Interest During
Construction 17.342Yes
948 Branxton to Whittingham
5255 - Maitland to
Minimbah Third Road -
Stage 2
Major Capital Works
Project
139.231
Yes
Interest During
Construction 15.891Yes
955 Whittingham to Camberwell Jct5811 - Nundah – Third
Track
Major Capital Works
Project 35.457Yes
Interest During
Construction 2.524Yes
956 Camberwell Jct to Glennies Creek5811 - Nundah – Third
Track
Major Capital Works
Project 34.610Yes
Interest During
Construction 2.783Yes
964 6724 - Bells Gate Passing Loop6724 - Bells Gate Passing
Loop
Major Capital Works
Project 20.492No
Interest During
Construction 2.084No
964 6891 - Pages River Passing Loop6891 - Pages River
Passing Loop
Major Capital Works
Project 22.024No
Interest During
Construction 1.570No
964 6892 - Chilcotts Creek Passing Loop6892 - Chilcotts Creek
Passing Loop
Major Capital Works
Project 26.011No
Interest During
Construction 1.645No
TOTAL Network 488.327 0.000
TOTAL CONSTRAINED 411.718 0.000

February 2014 Page 32 of 36
APPENDIX C – 1 January to 31 December 2012 Disposals
Line Segment Activity PROJECT2012 RAB
Value $M
Net Loss on
Disposal $M
Constrained
Network (Yes / No)
917 Rerailing Rerailing 0.027 0.018 Yes
925 Rerailing Rerailing 0.067 0.057 Yes
931 Rerailing Rerailing 0.082 0.071 Yes
937 Rerailing Rerailing 0.086 0.076 Yes
947 Rerailing Maitland to Minimbah Stage 2 0.341 0.292 Yes
948 Rerailing Maitland to Minimbah Stage 2 0.538 0.413 Yes
951 Rerailing Rerailing 0.093 0.084 Yes
955 Rerailing Rerailing 0.440 0.394 Yes
956 Rerailing Rerailing 0.047 0.041 Yes
957 Rerailing Rerailing 0.203 0.177 Yes
973 Rerailing Rerailing 0.137 0.122 Yes
963 Various Resleepering, Rerailing 5.680 5.349 No
964 VariousResleepering, Rerailing, Turnout
replacement0.940 0.838 No
965 Resleepering Resleepering 0.569 0.559 No
TOTAL NETWORK 9.250 8.490
TOTAL CONSTRAINED 2.062 1.744
February 2014 Page 33 of 36
APPENDIX D – 1 January to 31 December 2012 RAB Floor Limit roll forward Summary
RAB Floor Limit roll forward
1 January 2012 - 31 December 2012
Total Constrained
CPI 2.302% 2.302%
Depreciation at 1 July 2011 4.7619% 4.7619%
Depreciation at 1 October 2011 4.8193% 4.8193%
Depreciation 2012 2.5000% 2.5000%
Opening Total RAB Floor Limit (1/01/2012) 1,073,587,301 882,161,764
Existing assets as at 1 July 2011
Gross assets:
Opening Balance 1,036,385,052 860,548,612
Additions / Deletions - Line Segments 0 0
CPI 23,860,717 19,812,431
Original Balance plus CPI 1,060,245,769 880,361,043
Less Disposals -8,490,116 -1,744,277
Adjusted Net Balance 1,051,755,653 878,616,766
Depreciation:
% of year 100.0% 100.0%
Depreciation CY -50,083,603 -41,838,894
CPI on Depreciation PY -568,112 0
Less Disposal Acc Depn 0 0
Accumulated Depreciation -75,327,549 -62,328,146
Closing Balance 976,428,103 816,288,619
New assets 1 July 2011 to 31 December 2011
Gross assets:
Opening Balance 62,623,603 42,609,663
Additions / Deletions - Line Segments 0 0
CPI 1,441,785 981,003
Original Balance plus CPI 64,065,388 43,590,666
Less Disposals 0 0
Adjusted Net Balance 64,065,388 43,590,666
Depreciation:
% of year 100.0% 100.0%
Depreciation CY -3,087,489 -2,100,755
CPI on Depreciation PY -17,164 -11,679
Less Disposal Acc Depn 0 0
Accumulated Depreciation -3,850,172 -2,619,691
Closing Balance 60,215,216 40,970,974
New assets 1 January 2012 to 31 December 2012
Gross assets:
Opening Balance 527,894,841 425,280,946
Additions / Deletions - Line Segments 0 0
CPI 0 0
Original Balance plus CPI 527,894,841 425,280,946
Less Disposals 0 0
Adjusted Net Balance 527,894,841 425,280,946
Less Loss on Capitalisation not depreciated 0 0
Depreciation: 2.5000% 2.5000%
% of year 50.0% 50.0%
Depreciation CY -6,598,686 -5,316,012
CPI on Depreciation PY 0 0
Less Disposal Acc Depn 0 0
Accumulated Depreciation -13,197,371 -10,632,024
Closing Balance 514,697,470 414,648,923
Total Closing RAB Floor Limit 1,551,340,789 1,271,908,517
Average RAB Floor Limit 1,312,464,045 1,077,035,140
Depreciation (includes CPI on depreciation for prior year) -92,375,092 -75,579,861
RABsys 1,551,340,789 1,271,436,792
Net CPI Increase 24,717,225.15 20,781,755
February 2014 Page 34 of 36
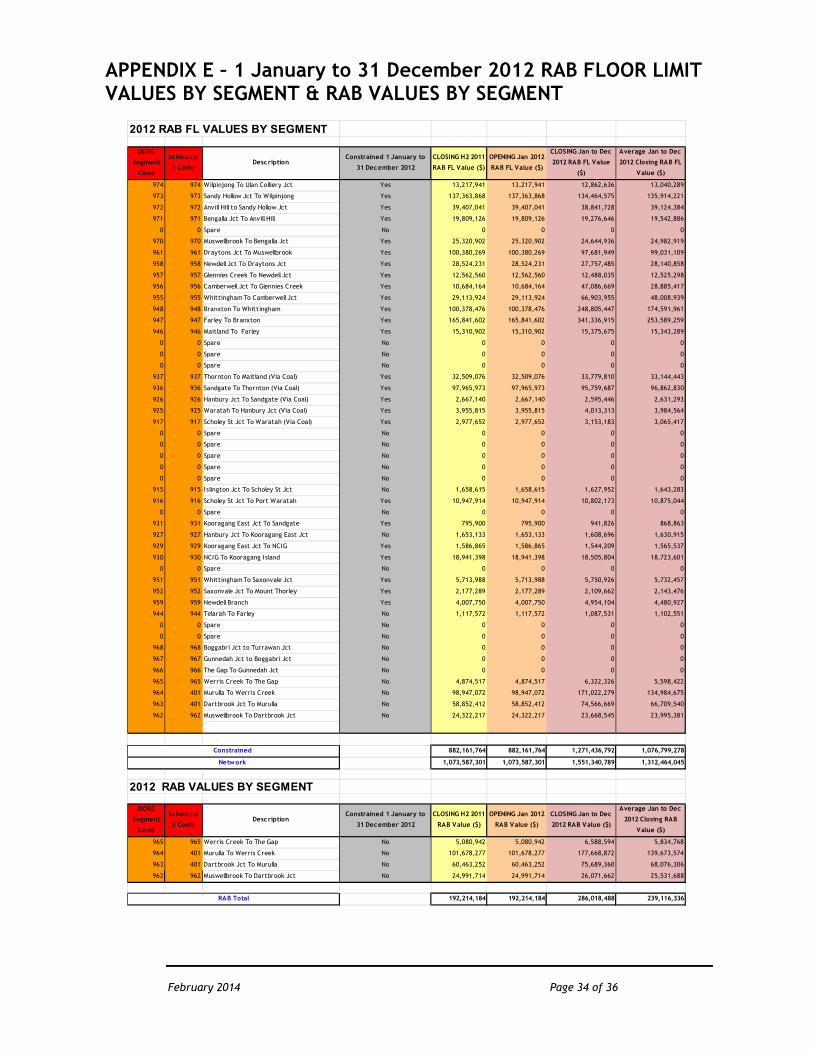
APPENDIX E – 1 January to 31 December 2012 RAB FLOOR LIMIT VALUES BY SEGMENT & RAB VALUES BY SEGMENT
2012 RAB FL VALUES BY SEGMENT
DORC
Segment
Code
Schedule
E CodeDescription
Constrained 1 January to
31 December 2012
CLOSING H2 2011
RAB FL Value ($)
OPENING Jan 2012
RAB FL Value ($)
CLOSING Jan to Dec
2012 RAB FL Value
($)
Average Jan to Dec
2012 Closing RAB FL
Value ($)
974 974 Wilpinjong To Ulan Colliery Jct Yes 13,217,941 13,217,941 12,862,636 13,040,289
973 973 Sandy Hollow Jct To Wilpinjong Yes 137,363,868 137,363,868 134,464,575 135,914,221
972 972 Anvill Hill to Sandy Hollow Jct Yes 39,407,041 39,407,041 38,841,728 39,124,384
971 971 Bengalla Jct To Anvill Hill Yes 19,809,126 19,809,126 19,276,646 19,542,886
0 0 Spare No 0 0 0 0
970 970 Muswellbrook To Bengalla Jct Yes 25,320,902 25,320,902 24,644,936 24,982,919
961 961 Draytons Jct To Muswellbrook Yes 100,380,269 100,380,269 97,681,949 99,031,109
958 958 Newdell Jct To Draytons Jct Yes 28,524,231 28,524,231 27,757,485 28,140,858
957 957 Glennies Creek To Newdell Jct Yes 12,562,560 12,562,560 12,488,035 12,525,298
956 956 Camberwell Jct To Glennies Creek Yes 10,684,164 10,684,164 47,086,669 28,885,417
955 955 Whittingham To Camberwell Jct Yes 29,113,924 29,113,924 66,903,955 48,008,939
948 948 Branxton To Whittingham Yes 100,378,476 100,378,476 248,805,447 174,591,961
947 947 Farley To Branxton Yes 165,841,602 165,841,602 341,336,915 253,589,259
946 946 Maitland To Farley Yes 15,310,902 15,310,902 15,375,675 15,343,289
0 0 Spare No 0 0 0 0
0 0 Spare No 0 0 0 0
0 0 Spare No 0 0 0 0
937 937 Thornton To Maitland (Via Coal) Yes 32,509,076 32,509,076 33,779,810 33,144,443
936 936 Sandgate To Thornton (Via Coal) Yes 97,965,973 97,965,973 95,759,687 96,862,830
926 926 Hanbury Jct To Sandgate (Via Coal) Yes 2,667,140 2,667,140 2,595,446 2,631,293
925 925 Waratah To Hanbury Jct (Via Coal) Yes 3,955,815 3,955,815 4,013,313 3,984,564
917 917 Scholey St Jct To Waratah (Via Coal) Yes 2,977,652 2,977,652 3,153,183 3,065,417
0 0 Spare No 0 0 0 0
0 0 Spare No 0 0 0 0
0 0 Spare No 0 0 0 0
0 0 Spare No 0 0 0 0
0 0 Spare No 0 0 0 0
915 915 Islington Jct To Scholey St Jct No 1,658,615 1,658,615 1,627,952 1,643,283
916 916 Scholey St Jct To Port Waratah Yes 10,947,914 10,947,914 10,802,173 10,875,044
0 0 Spare No 0 0 0 0
931 931 Kooragang East Jct To Sandgate Yes 795,900 795,900 941,826 868,863
927 927 Hanbury Jct To Kooragang East Jct No 1,653,133 1,653,133 1,608,696 1,630,915
929 929 Kooragang East Jct To NCIG Yes 1,586,865 1,586,865 1,544,209 1,565,537
930 930 NCIG To Kooragang Island Yes 18,941,398 18,941,398 18,505,804 18,723,601
0 0 Spare No 0 0 0 0
951 951 Whittingham To Saxonvale Jct Yes 5,713,988 5,713,988 5,750,926 5,732,457
952 952 Saxonvale Jct To Mount Thorley Yes 2,177,289 2,177,289 2,109,662 2,143,476
959 959 Newdell Branch Yes 4,007,750 4,007,750 4,954,104 4,480,927
944 944 Telarah To Farley No 1,117,572 1,117,572 1,087,531 1,102,551
0 0 Spare No 0 0 0 0
0 0 Spare No 0 0 0 0
968 968 Boggabri Jct to Turrawan Jct No 0 0 0 0
967 967 Gunnedah Jct to Boggabri Jct No 0 0 0 0
966 966 The Gap To Gunnedah Jct No 0 0 0 0
965 965 Werris Creek To The Gap No 4,874,517 4,874,517 6,322,326 5,598,422
964 401 Murulla To Werris Creek No 98,947,072 98,947,072 171,022,279 134,984,675
963 401 Dartbrook Jct To Murulla No 58,852,412 58,852,412 74,566,669 66,709,540
962 962 Muswellbrook To Dartbrook Jct No 24,322,217 24,322,217 23,668,545 23,995,381
882,161,764 882,161,764 1,271,436,792 1,076,799,278
1,073,587,301 1,073,587,301 1,551,340,789 1,312,464,045
2012 RAB VALUES BY SEGMENT
DORC
Segment
Code
Schedule
E CodeDescription
Constrained 1 January to
31 December 2012
CLOSING H2 2011
RAB Value ($)
OPENING Jan 2012
RAB Value ($)
CLOSING Jan to Dec
2012 RAB Value ($)
Average Jan to Dec
2012 Closing RAB
Value ($)
965 965 Werris Creek To The Gap No 5,080,942 5,080,942 6,588,594 5,834,768
964 401 Murulla To Werris Creek No 101,678,277 101,678,277 177,668,872 139,673,574
963 401 Dartbrook Jct To Murulla No 60,463,252 60,463,252 75,689,360 68,076,306
962 962 Muswellbrook To Dartbrook Jct No 24,991,714 24,991,714 26,071,662 25,531,688
192,214,184 192,214,184 286,018,488 239,116,336
Constrained
RAB Total
Network

February 2014 Page 35 of 36
APPENDIX F - Interest During Construction – 1 January to 31 December 2012
Calculation of Interest During Construction
Rate of Return - IPART 10.92%
Rate of Return - HVAU 11.83%
2007/08 2008/09 2009/10 2010/11 2011 H2 2012
Maitland to Minimbah Third Road - Stage 2 Year 1 Year 2 Year 3 Year 4 Year 5 Year 6
Capital Spend ($'000) 21,096 62,874 67,042 153,367
IDC on Capex incurred during year 0 0 1,152 3,433 1,983 9,072
Previous Years Interest Capitalisation 0 0 2,429 5,382 9,783
Total Capitalised Interest 0 0 1,152 5,862 7,365 18,855
Commissioning Month/Year Nov-12
Proportion of final year for IDC (to 31 December) 0.50
Interest During Construction 33,233,320
Line Segment 947 52.18% 17,342,337
948 47.82% 15,890,983
Calculation of Interest During Construction 33,233,320
Rate of Return - IPART 10.92%
Rate of Return - HVAU 11.83%
2010/11 2011 H2 2012
Nundah – Third Track Year 1 Year 2 Year 3
2008/09 expenses not included. Already claimed in previous submissions
Capital Spend ($'000) 6,430 11,671 51,965
IDC on Capex incurred during year 351 345 3,074
Previous Years Interest Capitalisation 0.00 401 1,136
Total Capitalised Interest 351 746 4,209
Commissioning Month/Year Nov-12
Proportion of final year for IDC (to 31 December) 0.50
Interest During Construction 5,306,709
Line Segment 955 47.56% 2,523,983
956 52.44% 2,782,726
Calculation of Interest During Construction 5,306,709
Rate of Return - IPART 10.92%
Rate of Return - HVAU 11.83%
2010/11 2011 H2 2012
Bells Gate Passing Loop Year 1 Year 2 Year 3
Capital Spend ($'000) 4,109 11,597 4,785
IDC on Capex incurred during year 224 343 283
Previous Years Interest Capitalisation 0.00 256 978
Total Capitalised Interest 224 599 1,261
Commissioning Month/Year Feb-12
Proportion of final year for IDC (to 31 December) 0.50
Interest During Construction 2,084,484
Line Segment 964
Calculation of Interest During Construction
Rate of Return - IPART 10.92%
Rate of Return - HVAU 11.83%
2010/11 2011 H2 2012
Pages River Passing Loop Year 1 Year 2 Year 3
Capital Spend ($'000) 1,679 1,892 18,453
IDC on Capex incurred during year 92 56 1,091
Previous Years Interest Capitalisation 0.00 105 226
Total Capitalised Interest 92 161 1,318
Commissioning Month/Year Jul-12
Proportion of final year for IDC (to 31 December) 0.50
Interest During Construction 1,569,997
Line Segment 964
Calculation of Interest During Construction
Rate of Return - IPART 10.92%
Rate of Return - HVAU 11.83%
2010/11 2011 H2 2012
Chilcotts Creek Passing Loop Year 1 Year 2 Year 3
Capital Spend ($'000) 577 1,105 24,329
IDC on Capex incurred during year 32 33 1,439
Previous Years Interest Capitalisation 0.00 36 105
Total Capitalised Interest 31.5 68.7 1,544.5
Commissioning Month/Year Dec-12
Proportion of final year for IDC (to 31 December) 0.50
Interest During Construction 1,644,711
Line Segment 964

February 2014 Page 36 of 36
APPENDIX G – Stakeholder Listing Deleted for privacy reasons