
1 Introduction - lss.fnal.govlss.fnal.gov/archive/other/eso-tp-73b.pdf1 Introduction - lss.fnal.gov
22
• \: I () VJ \f\j I, -7P-73B ....... -- VQ/yl J99 '7 DEC 23 1997 An Introduction to Interferoilletry with the ESO Very Large Telescope i Oskar von der Liihe Observator,Y. Earl-Schwarzschild-Str. 2, D - 85748 Garching 1 Introduction The interferometric mode of the ESO Very Large Telescope (VLT) permit.s w- Ilfrenl. combination of stellar light beams collected by four Unit Telescopes (L'Ts) with 8m diameter and by several Auxiliary Telescopes (ATs) of the 2m class. While the position of the UTs is fixed, ATs can be moved on rails and can op- erate from 30 stations distributed on the top of the observatory site for efficient lTV mverage. Coherent beam combination can be achieved with the l'Ts alone, with the ATs alone, or with any combination of up to eight telescopes. A distinct feature of the interferometric mode is the high sensitivity due to the 8m pupil of the {iTs with the potential for adaptive optics compensation in the near-infrared spectral regime. The VLT Interferometer is conceived as an evolutionary programme where a significant fraction of the interferometer's functionality is initialJy funded, and more capability may be added later while experience is gained and further fund- ing becomes available. The scientific program is now defined by a team which consists of a VLTI Scientist at ESO and fifteen astronomers from the VLT com- munity. ESO has recently decided to resume the construction of the VLTI which was delayed in December 1993, in order to achieve first interferometric fringes with two of the 8m telescopes around the year 2000, and routine operation with ATs from 2003 onwards. This paper presents an overview of the history of the VLT Interferometer and its basic capabilities. The synthesis capability and the sensitivity of VLTI are addressed in more detail. An extensive bibliography on VLTI-relates papers is also provided. 2 History of VLTI A coherent combined mode has bf>en part of the Very Large Telescope program since its beginning in the early 80's (Enard, 1984, Merkle, ID88a and 1988b, Lena, 1987 and 1988). Combining the collecting power of 8m diamet.er telesmpes with the resolution of a baseline of about. 100m seemed t.o be all opportunity too good to miss. Thf> main driver for including the interferometrir mode were making images of celestial sources at a resolution of the mill i-as. At.
-
Upload
nguyennhan -
Category
Documents
-
view
228 -
download
0
Transcript of 1 Introduction - lss.fnal.govlss.fnal.gov/archive/other/eso-tp-73b.pdf1 Introduction - lss.fnal.gov

~\
•�
\:I
() VJ \f\j
I ,�
~~ -7P-73B .......-VQ/yl J99 '7
DEC 23 1997
An Introduction to Interferoilletry with the ESO Very Large Telescope i
Oskar von der Liihe
Eur?p_~~Q1lthefJ1 Observator,Y.� Earl-Schwarzschild-Str. 2, D - 85748 Garching�
1 Introduction
The interferometric mode of the ESO Very Large Telescope (VLT) permit.s wIlfrenl. combination of stellar light beams collected by four Uni t Telescopes (L'Ts) with 8m diameter and by several Auxiliary Telescopes (ATs) of the 2m class. While the position of the UTs is fixed, ATs can be moved on rails and can operate from 30 stations distributed on the top of the observatory site for efficient lTV mverage. Coherent beam combination can be achieved with the l'Ts alone, with the ATs alone, or with any combination of up to eight telescopes. A distinct feature of the interferometric mode is the high sensitivity due to the 8m pupil of the {iTs with the potential for adaptive optics compensation in the near-infrared spectral regime.
The VLT Interferometer is conceived as an evolutionary programme where a significant fraction of the interferometer's functionality is initialJy funded, and more capability may be added later while experience is gained and further funding becomes available. The scientific program is now defined by a team which consists of a VLTI Scientist at ESO and fifteen astronomers from the VLT community. ESO has recently decided to resume the construction of the VLTI which was delayed in December 1993, in order to achieve first interferometric fringes with two of the 8m telescopes around the year 2000, and routine operation with ATs from 2003 onwards.
This paper presents an overview of the history of the VLT Interferometer and its basic capabilities. The synthesis capability and the sensitivity of VLTI are addressed in more detail. An extensive bibliography on VLTI-relates papers is also provided.
2 History of VLTI
A coherent combined mode has bf>en part of the Very Large Telescope program since its beginning in the early 80's (Enard, 1984, Merkle, 1~86, ID88a and 1988b, Lena, 1987 and 1988). Combining the collecting power of 8m diamet.er telesmpes with the resolution of a baseline of about. 100m seemed t.o be all opportunity too good to miss. Thf> main driver for including the interferometrir mode were making images of celestial sources at a resolution of the mill i-as. At.
) Oskar von del' Li.ihe
that time, int.erferometry at radio wavelengths was becoming recognized as a very powerful tool, which could provide much of the data analysis techniques needed for the optial spectral ranges. Speckle interferometry and related techniques were int.ensely researched and well on the way to their current "toolbox" state. Exploiting the diffraction limit. with adaptive optics appeareel as a more distant possibility. There was only litte experience with distributed interferometers at optical wavelength, ess/"ntially concentrated in Europe.
The main thrust. for interferometry with large aperture t.elescopes was for observations in the near infrared domain (RoddieI' and Lena, U)84). It was recognised early on that a fixed configuration of large telescopes would prove too inflexible to make faithful images of sources with even moderate complexity. Therefore, the \iLT includes several smaller Auxiliary Telescopes of the 2m cla,;s which can be relocated to easily change baselines which complement t.hosf' of the fixed large telescopes. Also, more baselines could be provided at a given time which would result in a better and faster covered UV plane. It was not until later that the power of the small telescopes for providing an independent interferometric array which could be used all of the time was recognised.
The early definition of conceptual choices for the VLTI was performed by an ESO Working Group (VLT Report No. 49, 1986). The development of a detailed technical concept commenced, after the ESO Council approved the VLT Programme in 1987, in 1988 with a team led by Jacques Beckers for more than three years (Beckers et al., 1990a, Beckers, 1990b, Beckers, 1990c, Beckers, 1990d, Beckers, 1991a, Beckers, 1991b). An Interferometry Panel set up from experts in high angular resolution observations and related science fields made many contributions until end of 1992. As a result of the work of this body, the first implementation plan for VLTI was published in 1989 (Beckers et al., VLT Report 59 1989). In hindsight, it is interesting to see how many of the current science targets were already addressed in this report. However, astrometric capability was not considered feasible, as the potential of narrow-angle astrometry was not yet. recognised. A second report (Beckers et aI., VLT Report 65 1992) addressed the concepts for instrumentation for combined focus (Claret et al., 1991, Reinheimer et al., 1991), and still serves as a reference for the variety of possible techniques to combine beams.
In the meantime, the location for the observatory on Cerro Paranal was decided and the work on the site progressed. The layout of the VLTI - a subject of debates since years - was completed after some fulminant weeks early 1992 and remained unchanged ever since (von del' Liihe et aI., 1991). The four 8m Unit Telescopes (UTs) are placed in some sort of a semi-circle. A more accentuated circle would have been more desirable but was not possible for reasons of wind obstruction and the quality of the rock in certain locations. The locations of the Jelay line tunnel and 30 stations for the ATs telescopes were identified and are now cast in concrete. The goal was to optimise the array layout for imaging and t.o leave the door open for a variety of phase recovery methods.
At this time, VLTI consisted of the coude optical trains on all UTs, two movable ATs (Plathner et al., 1991), two delay lines with a 60m stroke each

3 An Introduction to Interferometry with the ESO Very Large Telescope
(J orck et aI., 1991), and a beam combination t.elescope in the interft'rometrv laboratory with an 8 as continuous field (Beckers et aI., 1990a, Beckers et al~, 1991c). The large field requirement came from the desire to use SOUI"Ct'S in tht' field for phase referencing (the equivalent to adaptivt' optics with a refernre star) but resulted in very largp dinlf'nsions for the delay lines anJ t1H' transfer optics. An extra budget was foreseen for the development of the fringe eletpction instrumentation within the rommunity.
The development of VLTI had its all time high when the French Centre ~ational de la Rccherchp Scientifique (CNRS), the Max-Planck Society (MPG) and ESO signed an agreement on the enhancement of the interferometric mode of the VLT in December 1992 (The Messenger, 199:)a). Under this agreement, a third AT and a third delay line could bp developeel togther with the first two. t.hereby substantially enhancing the synthesis capability of thp array by adding; phase closure capability. VLTI could be used all of the time with the ATs in pha5e closure modes, removing much of the pressure from the UTs.
An all timp low was reached just a year later, when the ESO Council determined in December 1993 that the development of VLTI should be put on hold for reasons of cash flow levelling (The Messenger, 1993b). The elevelopment. continued in the form of a "research and development programme" while means to overcome the budgetary situation were sought (von del' Luhe et a!', 1994 and 1995a, hoehler et a!', 1994, Ferrari et a!', 1994a and 1994b, Gay et a!', 1994a and 1994b). Also, a fresh look at the concept and its scientific just ification were taken when the successor to the Interferometry Panel, the Interferometry Science Advisory Committee (ISAC) was assembled in 1995. A sumrnary of a science programme and the resulting conceptual consequences is described in the ESO l\lessenger (Paresce et aI., 1996). One proposal was to limit the operational wavelength for the early phases with Auxiliary telescopes to the near infra-red and with UTs to the thermal infra-red spectral ranges. The VLTI would then not require higher order adaptive optics systems which considerably reduces system complexity and cost. Atmospheric and instrumental control can be limited to tip-tilt compensation only.
Although the efforts to acquire additional funding were not succesful, ESO decided in December 1995 to go ahead with the development of a reduced VLTJ. A "new plan" which accounts for the recommendations of the ISAC was developeel during the first half of 1996 (von del' Luhe et a!', 1996) in coordination wi th the partners of the VLTI agreement, in order to secure their continued support. Furthpr details of this plan are described in this paper. The detailed defintion of the VLTI is continuing (Eoehler et. a!.. 1996, Leveque et. a!', 1995a, 190.sh and 1996). This ESO workshop is another milestone on the way towards a new anel improved VLTI.
The implementation of the VLTI is now distributeel over two phases. The firsl phase (Phase A) includes the coude optical trains on two UTs, two elelay lines. two auxiliary telescopes and the beam combination inst.rument.at.ion for t.he near-infrared (ATs) anel the thermal infrared (eTs). This phase is funded and will carry t.he program t.hrough t.he year 2003. A second phase (Phase B)
4 Oskar von cler Luhe
includes a third AT, the remaining two coude trains on the lJTs and two more delay lines will require additional funding. Phase B can be concluded by 2005 if funding is possihle from 20UO onwards.
3 General Capabilities
3.1 Layout of the VLT Interferometer
Fig. 1 shows the layout of the VLTI on Parana!' The North direction is approximately 20 degrees clockwise from topwards. The four UTs are seen on the upper half of the picture. The delay line tunnel transverses the mountain in the middle. The lower part of the mountain is filled with Auxiliary telescope stations and the tracks on which they will be transported. Two tracks extend across the tunnel to the northern part of the site, the western one passes close by the central facilities where a station is located which will be used for servicing the coude insets.
Starlight from telescope~ is directed underground towards the tunnel in the form of collimated beams. Mirrors direct the light beams along the tunnel to
wards the opposite sides where the cat's eyes optics of the delay line retro-reflect the beams. Another set of mirrors redirects the light near the center of the tunnel towards the beam combination equipment in the laboratory. Beam combination and detection of interferometric fringes occur in the laboratory.
3.2 Availability
Whenever the UTs will be used for the interferometric mode, their time allocation will go through ESO's ordinary review process, which means competition with single telescope programs. Only observations which require high sensitivity and / or high spectral resolution will usually require UTs. We expect that the use of them will be limited to a small percentage of the observing time initially, and will evolve with experience.
In contrast, the Auxiliary telescopes will be available all of the time for interferometry, as these specialised telescopes will not support any other observing mode. They will therefore support obseving programs which need a lot of observing time, but less sensitivity, and for synoptic programs.
3.3 Sky coverage and access
The sky coverage is limited by the sky coverage of the telescopes and the optical delay that the delay lines can produce. All telescopes support a coverage of 60 deg from Zenith with full performance. The delay lines support a ('overage of 60 deg from Zenith for baselines up to 130m (i.e., all UT baselines). For AT configurations with baselines larger than 120m, the coverage is reduced and depends on the exact configuration. A good value to use here is 30 deg. Ultimately, the sky coverage can be increased to 60 deg on all baselines.

5 An Introduction t.o Int.erferometry with the ESO Very Large Telescope
two (four) Unit Telescopes C'o" Trilck
equipped with coude trains ~~
, ' ; ,~ "<~~n.1
(@) '''' UTI
: ,.. '
Long Tri.lck
[w() (three) Auxi!i:iry Tck'C(\l'l'~,
Fig. 1. Configuration of the VLT on Cerro Parana!.
VLTl supports rapid slewing between sources to enable efficient observation of mutiple sources and calibrator sources. This is essential for maximizing onsource time. The target t.ime for acquiring fringes on near-by sources (wit.hin 1 degree) is of the order of 30 sec. The t.elescopes can acquire a source anywhere in t.he sky wit.hin 3 min.
3.4 Field of View and Dual Feed
The desire for including narrow-angle 1992 astromet.ric capability into VLTl with Auxiliary telescopes became apparent in 1994 (Leger et al., 1995, Quirrenbach 1995). The original idea to accommodate this capability was to augment the optics for the Auxiliary telescopes (von der Luhe et a1. 1995b). In view of the current changes in the concept we intend to pursue a different approach.
The coude foci of Unit and Auxiliary telescopes will be equipped with dual fpeds which support two field angles, one of which is on the axis. to be select.ed and fed into the interferometer. There will be a 2 as field centered at each of the t,wo field positions. One field position will be used t.o transfer the light from the source unc!pr investigation, the other will be used for phase referencing (CTs

G Oskar VOIl del' Luhe
and ATs) or astrometric referencing (ATs only). The range of the selection will be 5· . ·60 as from the axis, this accomodates the complete field at the coude foci. The two beamlines share the delay lines optics
The concept behind the phase reference is similar to a reference star for adaptice optics; it will serve for image and fringe tracking should the science target be too faint. Atmospheric effects introduce differential phase errors between the tviO field positions of the dual feed which result in fringe contrast loss. For typical conditions at Paranal, a reduction of fringe contrast by a factor 0.7 occurs for field separations of 10 as at a 2.2 pm wavelength, and of 40 as at 10 pm.
The requirements and engineering implications of narrow angle astrometry are, on the other hand, very severe and need thorough studies. The atmospheric limits to astrometric precision depend linearly 011 field angle and amount to about 10 /las with a 100 m baseline and 30 min of integration. Achieving this precision in practice requires the knowledge of the vector baselines to 50 pm accuracy and of the instrumental differential delay between the primary and secondary beam to 5 nm accuracy. At this time, the technical limits to determine the differential delay are not known.
The concept for the dual feed is still under development. Although designs for dual feeds exist elsewhere, the requirements for VLTl are not trivial. For example, the requirement for spectral coverage and astrometric precision essentially exclude the use of transmissive optics.
3.5 Fringe-tracked and blind operation
The term fringe-tracked operation refers to the generation of a fringe position error signal near the point of beam combination with a suitable sensor. The Observatoire de Cote d'Azur currently develops a fringe sensor prototype under contract with ESO (Gay et aL, 1994b). The sensor operates independently from any other beam combination instrument in the H band (1.6 pm) on the science source or a reference source. The error signal is fed to the control system of the delay lines to adjust their position. The high frequency part of the fringe position error operates on a piezoelectric element which controls the piston of the eat's eye field mirror.
No fringe sensor is used when operating "blindly". The delay lines track the expected geometric delay, which is calculated using a model for the instrumental delays and telescope positions, similar to a telescope pointing model. Short exposure interferograms which "freeze" the disturbance effects of the atmosphere are taken. Those will show fringes only if the deviation from zero path difference is small (within ~ 3 pm in the V band, 10 /Lm in the K band, and 50 pm in the N band). Atmospheric piston will prod uce path differences of 10 .. ·30 /l1Tl
rTlls. This mode requires accurate knowledge of the instrumental characteristics of VLTI

I An Introduction t.o Interferometry with the ESO \'ery Large Telescope
3.6 Beam combination and Instruments
The beam combination laboratory area will accommodate inst.ruments, at least for t.he near and tlH'rmal lR, along with a number of other subsystems. Figurp 2 shows an overview of the layout. Stellar light beams enter the laboratory from below. A switchyard which consists of dichroic and fully reflect.ive mirrors dirert the light towards the instruments and to the fringe and image ::iensors. A calibration unit which provides various sources also feeds both instruments and sensors and assures intercalibration. Laser metrology beams feed thp fringe sensor, as wrll as the instruments, for internal calibration. Other met.rology beams travel hack to the telescopes and determine the delay line zero position for thE' internal path. Primary and secondary beams emerging from the delay linE' carriages (hat.ched boxes in the t.unnel) are directed towards the laborat.ory in t.1l(' upper half. The switchyard is near the center of the layout. Intruments are on the top and right. Fringe and image sensors are to the left. The structure to t.he lower right. is the metrology beam launching system.
Thennal IR Near-IR Instrument Instrument
/. " '/ f/ .~ Fringe sensor I \~:: ::.. I I / ~ -' Unil .' : ; Ii', f/~V~/ '-..... t--- . .,---'" Internal r:;ITiID;/
. ~. . I AI' r,V Image / PupIl I ~ Ignment V ~ Alignment ~ Sources
~ Units tg~~'1 fI~Wif~li' ~iJ.::::::----==j L--------,.---,.~.......,...r-:,-l'/ L-._______ L ----' r//J-r7"T'T7"":rr-;"77!�
'y /////. //// : 1111;11 '////// //(
Beams from----------telescopes i
Fig.2. Layout of the beam combination Laboratory.
The initial operation of VLTI will concentrate on the near IR with ATs and on the thermal IR. with the UTs. Top-level capabilities of beam combination instruments as recommended by the Science Advisory Committee are given belo\\'.
_. [SAC recommendations for tl1(' l\ear-IR • support four beam lines
8 Oskar von der Luhe
• spectral range 07· . ·4J-lm with a spectral resolution up to 10.000 • calibration through single mode operation ("spatial filter'·) • internal fringe tracking capability • support dual feed�
ISAC recommendations for Mid-IR� • support two to four beam lines • spectral range N+Q bands (extension to M), resolution up to 1,000 • calibration through single mode operation • internal fringe tracking capability • fringe detection by temporal modulation • may not deliver "zero spacings"
3.7 Operational Capabilities
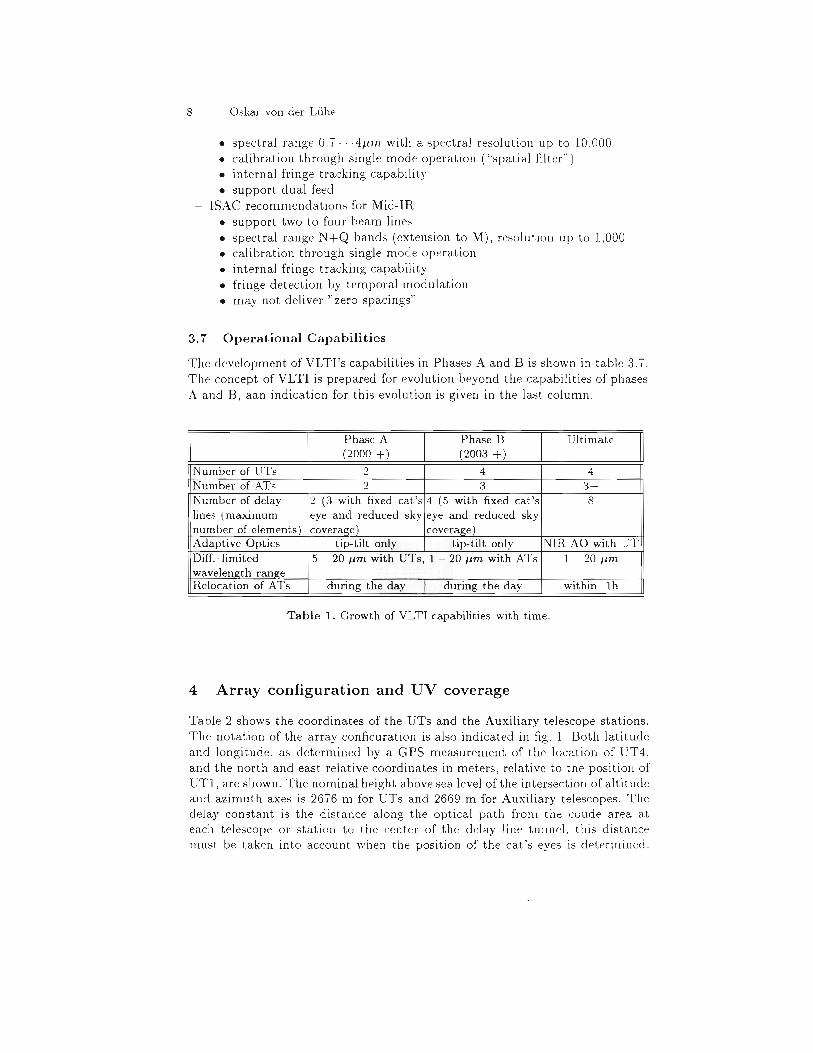
The development of VLTI's capabilities in Phases A and B is shown in table 3.7. The concept of VLTI is prepared for evolution beyond the capabilities of phases A and B, aan indication for this evolution is given in the last column.
Phase A Phase B Ultimate (2000 +) (2003 +)
Number of UTs 2 4 4 Number of ATs 2 3 3+ Number of delay 2 (3 with fixed eat's 4 (5 with fixed eat's 8 lines (maximum eye and reduced sky eye and reduced sky number of elements) coverag-e) coverag-e) Adaptive Optics tip-tilt only tip-tilt only NIR AO with UT Diff.-limited 5 - 20 /-1m with UTs, 1 - 20 /-1m with ATs 1 - 20 /-1m wavelength range Relocation of ATs during the day during the day within Ih
Table 1. Growth of VLTI capabilities with time.
4 Array configuration and UV coverage
Table 2 shows the coordinates of the UTs and the Auxiliary telescope stations. The notation of the array conficuration is also indicated in fig. 1. Both latitude and longitude, as determined by a GPS measurement of thp location of l'T4, and the north and east relative coordinates in meters, relative to the position of UTI, are shown. The nominal height above sea level of the intersertion of altitude and azimuth axes is 2676 m for UTs and 2669 m for Auxiliary telescopes. The delay constant is the distance along the optical path fronl the cuude area at each telescope or station tu the center of the delay line- tunnel, this distance must be taken into account when the position of the eat's eyes is determined.

9 An Introduction to Interferometry with the ESO Very Large Telescope
Station Latitude Longitude N rd [m Erel [m] Delay constant [m]� UTI -24.37.33.117 70.24.11.642 0.00 0.00 88� UT2 -24.37.31.465 70.24.10.855 51.08 24.31 88� UT3 -24.37.30.300 70.24.09.896 87.08 53.97 96� l'T4 -24:37:31.000 70: 24 :08.000 65.45 112.59 104�
Long track 1 -24:37:32.707 70:24:07.394 12.68 131.33 72� Long track 2 -24:37:32.793 70:24:07.638 10.00 123.79 64� Long track 3 -24:37:32.880 70:24:07.882 7.32 116.25 56� Long track 4 -24:37:33.226 70:24:08.857 -3.38 86.10 24� Long track 5 -24:37:33.573 70:24:09.832 -14.09 55.94 32� Long track 6 -24:37:33.746 70:24: 10.320 -19.45 40.86 48� Long track 7 -24:37:33.919 70:24:10.808 -24.80 25.79 64� Long track 8 -24:37:34.092 70:24:11.295 -3016 10.71 80� Long track 9 -24:37:34.179 70:24: 11.539 -32.83 3.17 88� Long track 10 -24:37:34.265 70:24: 11.783 -35.51 -4.37 96� Cross track 1 -24:37:31.260 70:24:08.73 57.42 89.97 80� Cross track 2 -2 /1:37:30.772 70:24:08.905 72.50 84.62 96� Cross track 3 -24:37:30.041 70:24:09.164 95.11 76.59 120� Cross track 4 -24:37:29.309 70:24:09.424 117.73 68.56 144� Cross track 5 -24:37:33.698 70:24:07.866 -17.97 116.74 72� Cross track 6 -24:37:34.430 70:24:07.606 -33.05 122.10 88�
Track 2 1-24:37:34.359170:24:08.180 -38.40 107.02 72� Track 3-1 -24:37:35.523 70:24:09.140 -74.40 77.36 96� Track 3-2 -24:37:32.841 70:24:10.092 8.52 47.91 96� Track 4-1 -24:37:34.894 70:24:10.461 -54.96 36.49 96� Track 4-2 -24:37:35.382 70:24:10.288 -70.04 41.84 96� Track 5-1 -24:37:34.580 70:24:11.122 -45.23 16.06 96� Track 5-2 -24:37:34.824 70:24:11.036 -52.77 18.74 104� Track 5-3 -24:37:35.068 70:24:10.949 -60.31 21.42 112� Track 6-1 -24:37:34.667 70:24:11.366 -47.91 8.52 104� Track 6-2 -24:37:34.910 70:24:11.279 -55.45 11.20 112� Track 6-3 -24:37:35.154 70:24: 11.193 -62.99 13.88 120� Track 6-4 -24:37:35.398 70:24: 11.106 -70.53 16.55 128� Track 6-5 -24:37:35.642 70:24:11.Q20 -78.07 19.23 136� Track 7-1 -24:37:34.753 70:24: 11.610 -50.59 0.98 112�
Table 2. Locations of UTs and AT stations
The information presented here can be used to calculate the UV response of any configuration of telescopes in the VLTI and the corresponding positions of the delay line carriages.
Baselines between UTs range from some 30m (CT2 and l'T3) to some 130m (UTI and l'T4). Baselines are shorter (and the CV coverage is thinner) in the NW-SE direction. Baselines between ATs range from 8m in the SVv' corner to 200m in the NS direction. The station layout is very flexible, virtually any desired configuration of three or four ATs can be obtained. Some stations have been placed in such a way that the limited CV coverage of the l'Ts can be

5
lCJ Oskar von der Luhe
('omplemented with baselines between a L'T and an AT ("hybrid mode"), to result in an even and circular coverage. The centers of all telescopes and stations are located on an 8m by 8m grid.
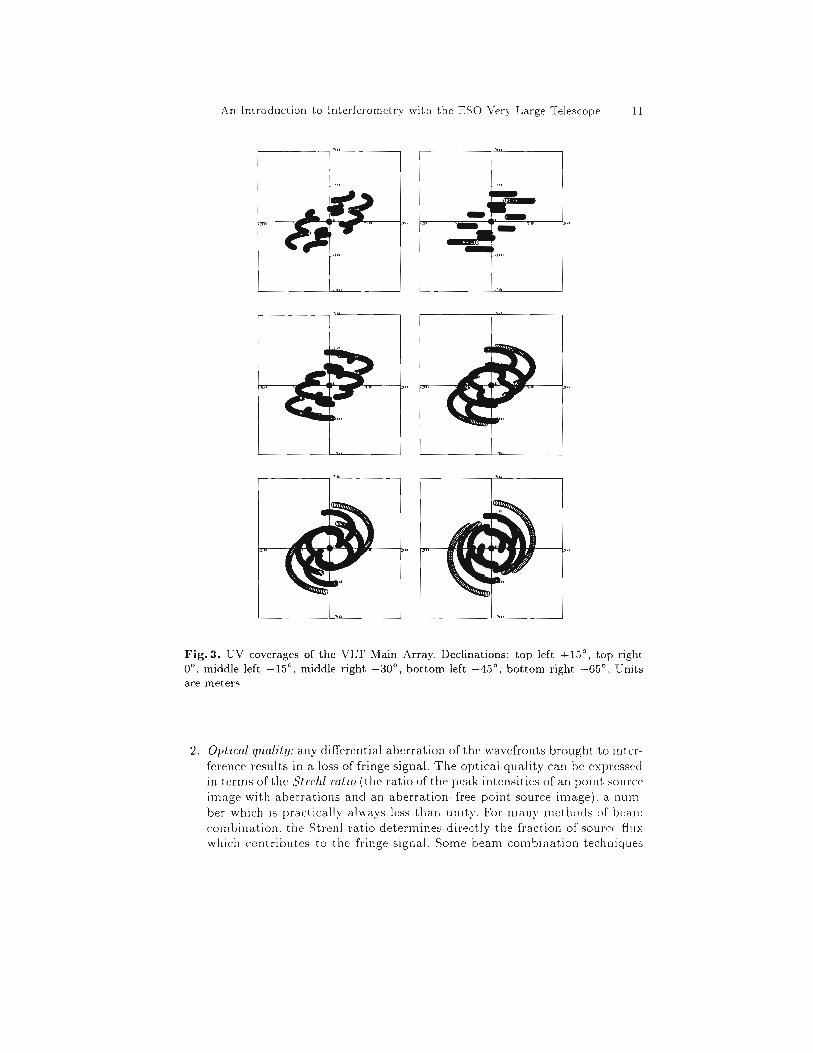
Figure 3 shows the L'V coverage of the array which consists of only the four UTs. This array is referred to as the "VLT Interferometer Main Array" (VIMA). The source declinations cover the range which is accessible with the \iLT. It is evident that the U\' coverage of the four main telescopes is less than perfect. There are substantial holes and the NW-SE corner is not well covered.
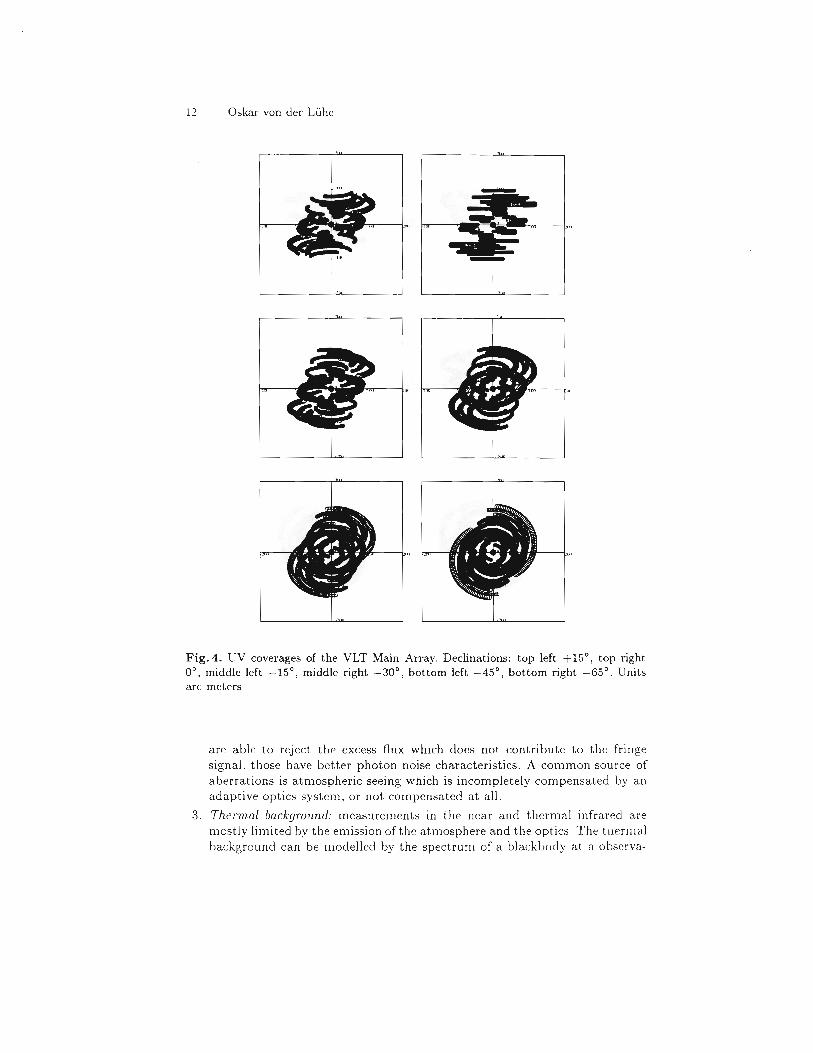
Some locations of AT stations were selected such as to optimally complement the VIMA array in terms of UV coverage with baselines between a UT and an AT. Figure 4 presents the UV coverage of the array which consists of all four UTs and three ATs located at the stations long track 4 and long track 7 and cross track 2. as an example. This configuration closes many of the holes which are left in the VIMA coverage, but there is still some reduced coverage in the NW direction. This can be improved by including an AT station near the southeastern end of the site e. g., cross track 6.
In all cases, a substantial lack of UV coverage will occur for relatively short baselines. This "central hole" is a common problem which is due to the mutual obstruction of lJTs by their enclosures, so it cannot be solved with lTTs. Only baselines between ATs can be made short enough (less than 8m) to fill the central 25m of baseline space. The cluster of short spacings south of L'Tl has been specifically laid out to provide these short spacings.
Sensitivity and Limiting Magnitudes
The sensitivity of an interferometer depends critically on the context of the measurement and cannot be comprehensively covered here. We will however give some guidelines which can be used to assess the feasibility of most experiments. An important sensitivity measure is the signal-to-noise ratio of the fringe's contrast magnitude, which is relevant to measurements of visibility magnitude and of referenced phases. Closure phase measurements involve triple product statistics which are significantly less sensitive than visibility magnitude measurements. The visibility magnitude signal-to-noise ratio (SNR) depends mostly on the following factors.
1.� Detected SaUTee flux: the detected source flux determines directly the strength of the measured signal. Depending on source magnitude, spectral bandwidth and integration time the detected source flux may vary enormously. The associated photon noise grows with the square root of the signal strength. There are two regimes which are distinguished by the significance of Lhe photon noise due to the source. In the photon rzch regime, the photon noise of the source dominates all other noise sources, and the signal-to-noise ratio grows with the square root of the flux (one decade of SNR per 5 l11agnitudes). In the photon starved regime, the photon noise of the source flux is less significant that the noise from other sources. The SNR is now directly proportional to the flux (one decade of S~R per 2.5 magnitudes).
An Introduction to lnterferornetr\' with the ESO Very Large Telescope ]]
Fig.3. UV coverages of the VLT Main Array. Declinations: top left +15 0 , top right
00, middle left -150, middle right -300, bottom left -45 0, bottom right _65 0 Units•
are meters
2.� OptIcal quality: any differential aberration of the wavefronts brought to interference results in a loss of fringe signal. The optical quality can be expressE'd in terms of the Strehl ratio (the ratio of the peak intensities of an poi nt source' image with aberrations and an aberration-free point source image). a nu mbel' which is practically always less than unity. For many methods of beam combination, the Strehl rat.io determine,; directly the fraction of sourer' flux which contributes to the fringe signal. Some beam combination techniques
1:2 Oskar von der Luhe
0Fig.4. UV coverages of the VLT Main Array. Declinations: top left +15 0, top right
0 , middle left _15 0
, middle right _30 0 , bottom left -45 0
, bottom right _65 0 . Units
are meters
are able to reject the excess flux which does not contribute to the fringe signal, those have better photon noise characteristics. A common source of aberrations is atmospheric seeing which is incompletely compensated by all adaptive optics system, or not compensated at all.
3.� Thermal background: measurements in the near and thermal infrared are mostly limited by the emission of the atmosphere and the optics. The thermal background can be modelled by the spectrum of a blackbody at a observa
13 An Introduction to Interferometry with the ESO Very Large Telescope
tory temperature. It creates signal independent photon noisE' which increases with the ::;quare root of the exposure. The detected background flux is givE'n by the product of the emission coefficient of the atmosphere and thE' optics, the optical etendue of thE' detection system, and the integral of the Planck function weighted by the spectral response of the detection system. For an interferometer \vhich has lots of optics, the emission coefficient can be assumed as (1 - Topt wlwre Topt is the overall transmission of the optics. A heamcombiner which limits the detected field to thE' Airv disk of an arrav
-') - .. '"
element has an entendue of >.. - where>.. is the mean detected wavelength.
4.� Detector noise: many detectors generate thermal or readout noise which degrades the signal and needs to be taken into account. This type of noisE' may have different characteristics with respect to integration time. Thermal noisc can be reduced by increasing integration time while readout noise occurs for every readou t of a detector, irrespective of how long an integration takes.
5.� Intrinsic visibility: the proper ("intrinsic") visibility of the source at tllt-' observed baseline determines directly the strength of the fringE' signal. Most interesting sources have low intrinsic visibility, a useful range is values from 10- 3 .. ·10°
6.� Coherent and incoherent integration times: the term "coherent" integration time refers to a single detector readout of a stabilised fringe. Depending on the experiment, the coherent integration time may be mil Ii-seconds (for a measurement limited by the atmospheric correlation timE') to minutes (for a measurement with fringe stabilisation which is only limited by the time dependence of the baseline). Several coherent integrations of the fringe signal may be combined to an "incoherent" integration by, e. g., averaging the squared moduli of the fringe amplitude measurements. This kind of integration is relevant when, e. g., each coherent integration would be too noisy to reliably detect the position of a fringe. The SNR of one incoherent integration increases with the square root of the number of accumulated coherent integrations.
7.� Number of elements: the number of array elements which are simultaneously detected may influence the measured signal on a given baseline. The fringe signal of a non-redundant baseline is given by the intrinsic visibility of the source divided by the number of array elements which contribute to the detection. For example, with beam combination in the image plane where the light of all array elements is superimposed to a fringed source image, all array elements contribute to the detection. Another option is to split thE' light of each element several ways and to beamcombine pair-wise, thE'n tilE' number of contributing elements is two, but the loss of flux due to tllP multi-way beamcombination needs to be accounted for.
For a measurement. where the detected flux is limit.ed to thE' fraction of pnergy corrpsponding t.o the Strehl ratio, the signal-to-noise ratio for a measurement of visibilit.y magnitude is given with

14 Oskar von der Luhe
SNR" = _ SNp ~,;y; , (1 )VI + N/; + SI\'/-; + N} NTd
For a measurement where all of the flux is detected, the signal-to-noise ratio is given with
S;\R" = SNp ~,;y; (2)VI + Nb + ,VI' + N} NTel \,
S is the Strehl ratio, /111' is the number of detected photons of the source, Nb is the number of detected photons of the background, Nd is the rms detector noise expressed in photon counts, V is the intrinsic visibility of the source (i, e" the quantity of interest), NTel is the number of array elements which contribute to the fringe measurement, and f{ is the number of coherent integrations averaged to form the (incoherent) measurement.
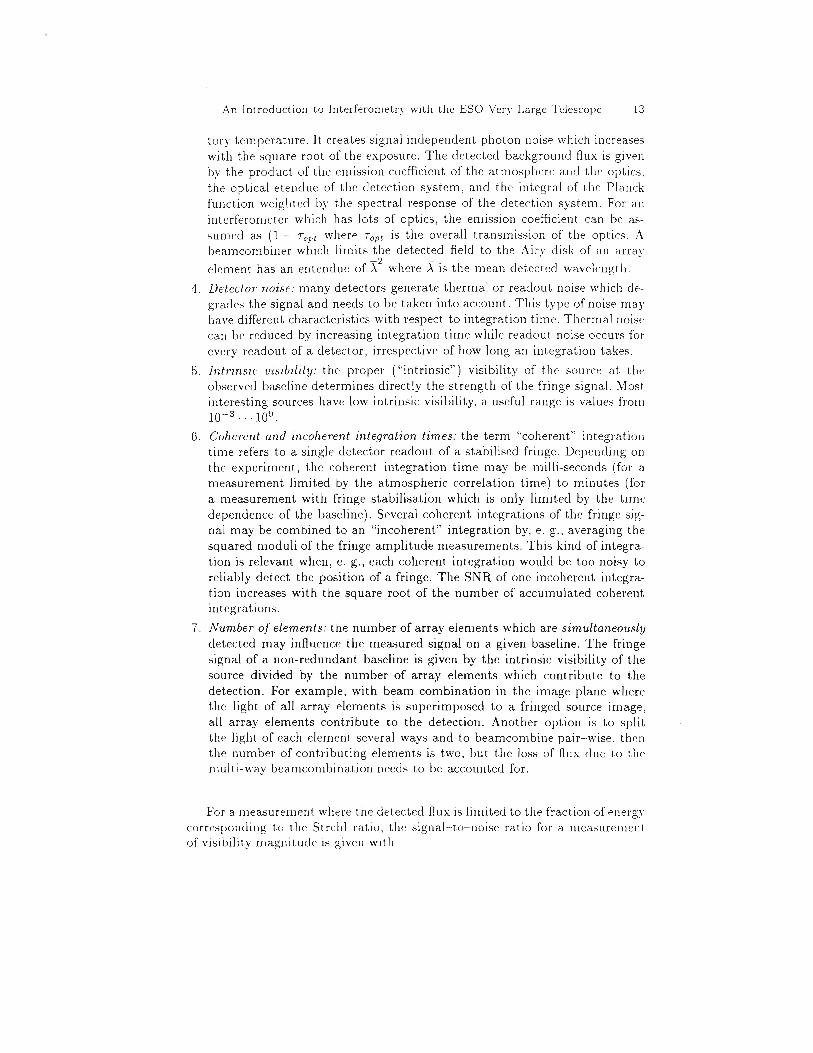
Figures 5 to 5 show the dependence of the signal-to-noise ratio with source magnitude under a variety of conditions which apply to the combination of two elements of the VLT Interferometer, Each figure refers to a different photometric band and shows two sets of four panels, The four upper panels refer to combination of two CTs, the lower four refer to combination of two ATs, Each panel has four plots which represent, from top to bottom, intrinsic source visibilities of 10°,10- 1 ,10- 2 , and 10- 3 ,
In each set of four panels, the top left panel refers to the sensitivity of a fringe tracker with a coherent integration time adapted to the atmospheric correlation time and using the full width of the photometric band, The top right panel refers to coherent integration of 900 sec with the exception of the N band where an incoherent integration of 50 msec exposures, covering 900 sec, is shown, The spectral bandwidth is 200 mA and represents a high spectral resolution mode, The bottom two panels show the SNR for incoherent averages of many short exposures with a spectral bandwidth of 100 A, totalling 900 sec integration time, All panels except for the bottom right ones assume the operation of an adaptive optics compensation system which improves the Strehl ratio, The adaptive optics is optimised for the near-infrared (4,5 degrees of freedom per m 2 area in the entrance aperture and a closed loop bandwidth of 50 Hz) and the improvement in the V band is marginal. The bottom right panel represents the "blind tracking" mode without the use of adaptive optics and fringe control loops, All cases assume a single pixel detector which is photon counting for the V band (no detector noise), The assumed overall optical throughput including detector sensitivity is 0, L
These plots are intended to provide an indication of the sensitivity of tht' VLTL and require some comments to avoid misunderstandings,
1� All initial observations with the VLTI will be done with a single baseline, so the SNR shown was calculated for N Tel = 2, Adding more baselines either reduces the source flux by a factor I\'Tel - 1 if an NTel-way paln,,'isE' heamcombiner is used, or tvTel in eqns. 1 and 2 needs to bt' adjusted.

15 :\n Introduction to Interferometr~' wit.h the ESO Very Large Telescop('
10'� 10' 8m Frince Trackina wilh 1.0� 8m narrow band with AD
1000� 1000Exp. 0.00811� Exp. 9008
100 100 .-/ a:: .-/ .-/ ,/
:z� 10 .-/ 10 .-/ ../' ..-� ..til�
/' .-/ ..- ..- .-/ ...)'.. / .. ...... .",-..� .. .r.: ..•. ./ ......:- ..�I ..-� ..
.-//'/' / /'0.1
)'� 0.1 /"
0.01� 0.01 20 15 10 5 0 -5 20 15 10 5 0 -5
10'� 10' 8m Iho AO�
1000 .-/ 1000�72580 Exp. 8m .-/ ..100 .-/ ..- ..- 100
0:: .-/.-/ ..
:z 10 /' .-/ ..- 10
til ..-� ..- .-/.-/ ... y ---/.. _.;.~,..,:. -- . .. .... . .. . 1�
/'�
.. -- -::·7·~·..;..·;--··~· / /� / ."../' .-/0.1
./� 0.1 ...-/
0.01� )'
0.01 20 15 10 5 0 -5 20 15 10 5 0 -5
10'� 10'
1000� 1000Exp. 0.006.� Exp. goo.
100 100 a:: .-/ :z 10 10 .-/ til ..- .-/ ..
............. '//'<'..... /. ,....::
/' .-/ ..- ..0.1� 0.1 /' /" ..
/' ..0.01� 0.01
20 15 10 5 0 -5 20 15 10 5 0 -5
10'� 10' llh AO 1.8m D AO�
1000 1000�72&80 Exp. 8 m..� 72680 Ell:p. It m •
.-/100� 100.-/0::� .-/.-/:z� 10 10 ../'� .-/til� .-/
.-/... .....,- ...;// ._>.---<. 1 .;../ ..
)'/' / ,//� .-/ ..0.1� 0.1 /' )' ,/� )'
./' ..0.01� 0.01
20 15 10 5 0 -5 20 15 10 5 0 -5 ReI. Magnitude� ReI. Magnitude
Fig.5. SNR of the visibility magnitude for the V band.
16 Oskar von der Llihe
10'�
\000 \000�Exp. 17 m.
100� 100 c:: z 10� 10 CIl�
1 \�
0.1�
001� 20 \5 \0 5 o -5� -5
\0' 10'� .-/�1000 1000�
100 100� .-/� 27100 Exp. 17 ml
.-/.-/ -c::� -
z 10 .-/ -- 10 CIl / .-/ /" -
../ .. ";.;..r-:. . __ ................�1� \
0.1 --� 0.1/ -0.01� .< 0.0\
20 15 10 5 a -5 20 15 10 5 o -5
10'� 1a' ,.-r-'-"--r-r....-.-,-...,-.-,.-,.-,....,-,-rr.,...."",-" ~ 1.8m narrow bend with AO /' 1
1000 1000~' Expo IlOO. -- ~ \00 100 __ -- .-/
c:: z 10 10 ./ .-/.-/ ..--o/" CIl
1 ~.. /"7/"- ..-1�
0.1 r /// /" ..--"-0.1
0.0\� 0.01 20 15 10 5 o -5 20 15 10 5 a -5
10'� 10' 1.8m S ."'.r.... no AO
1000� 1000 27100 expo 17 ml
100� 100 c:: z 10� 10 CIl
1
0.1 0.1�
0001 0.01� 20 15 10 5 0 -5 20 15 10 5 0 -5
ReI. Magnitude ReI. Magnitude
Fig. 6. SNR of the visibility magnitude for the J band.

17 An Introduction t.o Interferomptry with the ESO Very Large Tele:;cope
10'� 10' 8m narrow band wilh AO
1000� 1000Ellp. 33 ml ./" Exp. 900.� ./"� ./"
100� r 100 ./"./" r� r P::� ./"./"� rZ 10 / r
r 10 ./"Ul / ./" r ./"1 ... " .../ .. .".'� I .;-/... / ..... ··.·r·"":
// / ./'/0.1� 0.1 / /"
/ ./� / 0.01� 0.01
20 15 10 5 0 -5 20 15 10 5 0 -5
10'� 10' 0 ./"
..1000� ./" r 1000 13750 up. 86 m../" ..
100 ./" ..- 100 ./" P:: ./" r ./" .... rz 10 / ./" ..- 10� ./"Ul ..-� ./" ..
~"-./. ;.;-# .. ..................� ........~ ..�1 r�
"'r' ../" ./� ./" ..0.1 /
./� 0.1 /
/ ./" ..
0.01� 0.01 20 15 10 5 0 -5 20 15 10 5 0 -5
10'� 10' t.8m narrow hnd with AD
1000� 1000 bp. goo, 100� 100 .../"� ..P::� r ~
Z 10 ./" ..-..- 10� r
r
Ul /� ./" / /'� .../"1 .. -y .../ .... :".'.. 1 ... /" ./ _-:.,....·0
..// / ./'/0.1� 0.1 /
/
/" ../ / / ..
/.0.01� 0.01
20 15 10 5 0 -5 20 15 10 5 0 -5
10'� 10' l.am ........,�1000� 1000137!>O Exp. 88 m.� t37~ exp. e8 m...- ./"� ./"..- ..100 ..- 100� ./"..- ~ ..-�
./P:: ..- /"� ./" ..z 10 / ./" 10� ./"en� /'/� / ./"
..1 .". .../ .. .:~.!"':.. 1 ... .". .. /. ..... _--
// / ./,/ // /" ..0.1� 0.1 / ./� / ..
0.01� 0.01 20 15 10 5 0 -5 20 15 10 5 0 -5
Rel. Magnitude Rel. Magnitude
Fig. 7. SNR of the visibility magnitude for the h band.
18 Oskar von cler Luhe
10'
1000
100 0:: Z 10
'" 1
4 up. 60 me " " " /" " / ,/
,,"/ "./ .. ,././..;/'
10'
1000
100
10
1
8m narrow band with AO
18000 expo 60 ml
0.1 /" /"
./ 0.1
0.01 / ./
20 15 10 5 0 -5 15 10 5 0 -5
10'� 10' "� " 1000 " 1000� " " /� " /
100 / " 100� " 0:: /� " / ." z 10 /"'/ ,/ " 10� ,,"/ "./'"� / ./
.."./.. ,/.. I ,..//../ ... // / "./ // / ./0.1� 0.1
" "� " ./ 0.01� 0.01
20 15 10 5 0 ·-5 20 15 10 5 0 -5
10'� 10' l.8Ir.. f nle trac ins with ~O
1000� 1000 .. up.!>o m.� 16000 _:lip. :JO m. / " 100 100
0:: " z 10� " 10" /'" 1 .... - .. - ....... I//;,/' I�
0.1� ,," / ./ 0.1" ./ 0.01� 0.01
20 15 10 5 0 -5 20 15 10 5 0 -5
10'� 10'
1000� 100018000 Exp. 50 m.� 18000 eJl:p. SO ml " " 100� / 100 "
0:: // /"z 10 ,,"/ 10
/" / / /'" .. .,-."/./ ................. ....r .. /.;/......
0.1� ,," / ./ 0.1 // / ./ / ./ " .//0.01� 0.01
20 15 10 5 0 -5 20 15 10 5 0 -5 ReI. Magnitude� ReI. Magnitude
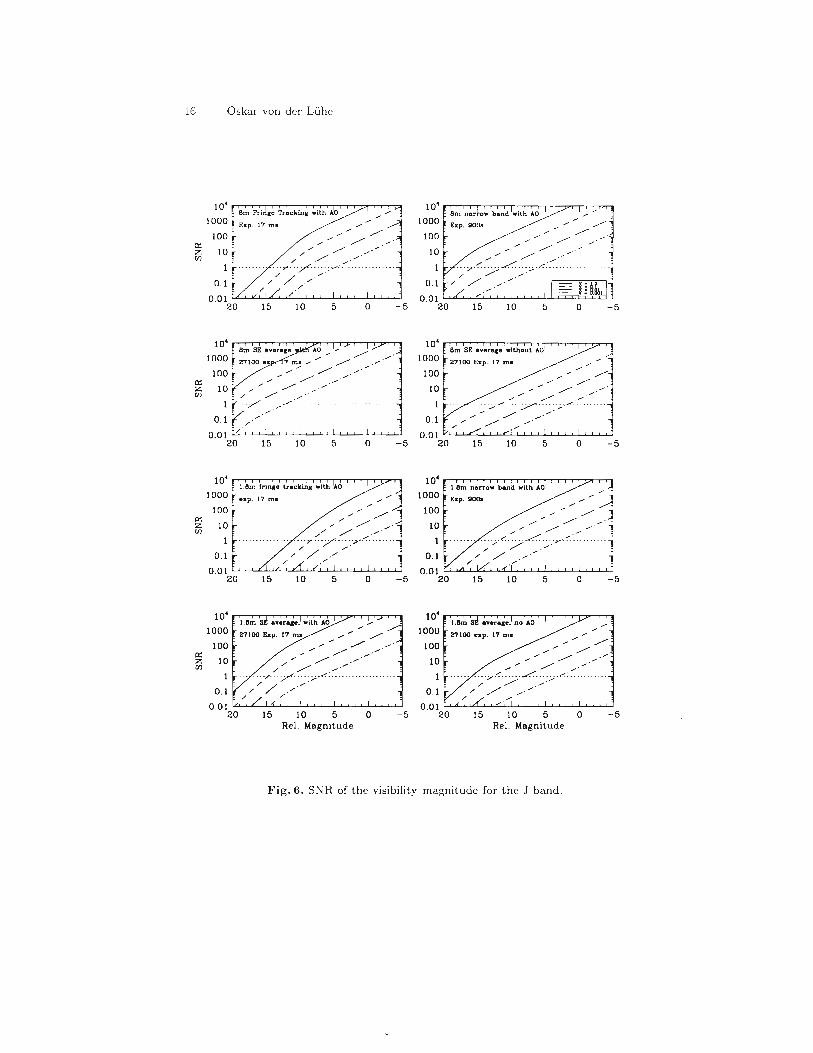
Fig. 8. SNR of the visibilit.y magnitude for the N band.

An Introduction to Interferometry with the ESO Very Large Telescope 19
2.� Tlw fringe tracking case appears to be less sensitive than the long integration case which presupposes fringe tracking. With the VLTI, fringe tracking will be performed in the H band, so one should take the J band curves which are similar to the H band performance. The plots are representative for the ATs where "adaptive optics" will be realized in terms of fast tip-tilt guiding, rendering the ATs diffraction-limited in the near-infrared. The plots are representative for the UTs only with an adaptive optics syst.em, which is currently not. part of Phases A or B. Therefore the sensitivity f01' fringe trackmg with 1JTs without AO systems will be somewhat lower than indicated hert', about at the level of the sensitivity of A1's.
3.� In case that more than two telescopes are used, fringe tracking may be performed on shorter baselines which tend to sample higher intrinsic visibilities, while long term integration is performed on the longer baselines with lower visibility. This potential may unveil the real power of the fringe tracking mode.
4.� The long exposure cases all assume a spectral bandpass of 200 mA which is relevant. to shorter wavelengths, but definitely too narrow for the K and N bands. The curves shown are therefore rather conservative. Also, the SNR per spectral channel is shown. A beamcombiner with a dispersive element may permit. many channels to be detected, where the signal could be combined to increase the SNR even further.
6 Conclusions
We have described the current status of the interferometric mode of the ESO Very Large Telescope. The development plan for the VLTI has been adapted to the difficult financial situation by substantial modification of the concept and by implementig capability gradually in two phases. We feel that the modifications simplfy the project in many areas while even strengthening the scientific potential. However, introducing the astrometric capability is a new requirement which will certainly be difficult. When Phases A and B are completed, a large subset of the initial goals for VLTI will have been put into existence. At this time, the VLTI will be far from complete, and one should prepare for further upgrades.
An impotant capability will be the near infrared capability of Unit telescopes through adaptive optics. Those can be systems which are optimised for interferometric use and therefore may be simpler than stadalone adaptive optics systems developed for other instruments. Introducing adaptive optics will tremendously increase the sensitivity with the UTs, as indicated by the SNR plots. Another import.ant capability would be extending the spectral regime towards the visible, opening a wide range of spectral diagnostics and even higher resolution. Similarly important would be adding a fourth Auxiliary telescope and more delay lines (.0 bring the number of beamlines up to a number of eight. VLTI will then unveil its full potential as an optical aperturp synthesis array.

20 Oskar von del' Liihe
References
J. rl'1. Beckers. R. Braun, G. P. di Benedet.t.o, R. Foy. R. Genzel, 1. I(oechlin, F. Merkle. G. VVeigelt, Thr VLT Intelje7'Omete7' Implementation Plan, Report by the ESO/\'LT Int.erferometry Panel, ESO VLT Report No. 59, October 1989
J.� M. Beckers, D. Enard, M. Faucherre, F. Merkle, G. P. di Benedetto, R. Braun, R. Foy, R. Genzel, 1. Koechlin, G. Weigelt. "The VLT Interferometer: 1. Proposed implementation," Proc SPIE Vol. 1236, pp. 108ff, 1990a.
J.� M. Beckers, "The VLT Interferometer: 2. Factors affecting on-axis operation," Proc SPIE Vol. 1236. pp. 364-371, 1990b.
J.� M. Beckers, "The VLT Interferometer: 3. Factors affecting wide field-of-view operation," Proc SPIE \'01. 1236, pp. 379-389, 1990c.
J.� :'v1. Beckers, "The \'LT Interferometer: 4. The utility of partial adaptive optics," Proc SPIE Vol. 1236, pp. 379-389. 1990d.
J.� M. Beckers, "Imerferometric Imaging with the Very Large Telescope," J. Optics (Paris) 22,2 pp. 73-83. 1991a.
J.� M. Beckers, "Blind operation of optical astronomical interferometers: options and predicted performance," Exp. Astronomy 2, pp. 57-71, 1991b.
J.� 1\1. Beckers, M. Faucherre, B. I(oehler, O. von del' Liihe, "A progress report on the implementation of the VLT Interferometer," ESO Conference on High Resolution Imaging by Inte7je7'Ometry fl, J. M. Beckers, F. Merkle (Eds.), ESO Garching, pp. 775-789, 1991c.
J.� M. Beckers, R. Braun, G. P. di Benedetto, A. Eckard, M. Faucherre, R. Foy. R. Genzel. P. Lena, O. von del' Liihe, 1. Koechlin, F, Merkle, G. Weigelt, Cohe7'ent Combined Instmmentation for the VLT Interferometer, Report by the ESO/VLT Interferometry PaneL ESO VLT Report No. 65, April 1992.
T. R. Bedding. J. M. Beckers. M. Faucherre, N. Hubin, B. Koehler, O. von del' Liihe. F. Merkle, Zhu N., "The VLT Interferometer," in J. G. Robertson and W. J. Tango (Eds.), Very High Angular Resolution Imaging, lAD Symposium 158, pp. 143-150, 1993.
O.� Citterio, D. Downes, A. Labeyrie, P, Lena, J. E. Noordam, F. RoddieI', J. Wijnbergen, G. Weigelt, 1. Weliachev, D. Enard, F. Merkle, M. Sarazin, R. Wilson, Interferometric Imaging with the Very Large Telescope, Final Report presented by the ESO/VLT Working Group on Interferometry, ESO VLT Report No. 49, June 1986.
A.� Claret, J .-M. Mariotti, P. Lena, "Multi-spectral diffraction-limited imaging with the double-Fourier method: simulations for the VLTI," ESO Conference on High Resolution Imaging by Interferometry II, J. M, Beckers, F. Merkle (Eds.), ESO Garching, pp. 835-844, 1991.
D.� Enard, "ESO 16 metre Very Large Telescope: The linear array concept," Proc. of the lAD Colloquium No 79, Very Large Telescopes, their Instrumentation and Programs, M.-H. Ulrich and K. Kjiir (Eds.), Garching, pp. 767-787, April 1984.
!II. Fauchen'e, R. Maurer, "On metrolog~' systems for delay lines," ESO Conference on High Resolution Imaging by Interferometry!T, J. M. Beckers, F. Merkle (Eds.), ESO Garching, pp. 1205-1214, 1991.
I'd.� Faucherrt'. B. lCoehler, O. von del' Liihe, F. Merkle, Zhu N., "The VLT Interferometer. current. stat.us and expectations for the next. 20 years," Proc. of the ESA Colloquiulll on Targets for Space-based Interferomet.ry, ESA SP-354, Beaulieu, pp. 91-91:\. 1992.
21 An Introduction to lnterferometr.Y with the ESO Very Large Telescope
M.� Ferrari, G. LemaItre, "Variable curvature mirrors for the ESO VLTI," in Proc. SPIE 2201 Adaptive Optics in Aslmnomy, 1994a.
M,� Ferrari, LemaItre, G., Mazzanti, S., von del' Llihe, 0., di Biagio, B., Montiel. P .. Rt>vest, D., Joulie, P., Carre, J.-F., "Highly variable curvature mirrors for the Very Large Telescope Interferometer," in M. A. Ealey and F. Merkle (eds.), Adaptive Optics in Astmnomy, SPIE Proceedings Vol. 2201, 1994b.
J. Gay,� Y. Rabbia, "LAMP: a concept for the ESO VLTI fringe sensor," in Proc. SPIE Proc. Vol. 2200 .4 mplitude and Intensity Spatial interferometry II, J. Breckinridge (Ed.), 1994a.
J.� Gay, Y. Rabbia, P. M. Bourlon, P. Antonelli, M. Dugue, J. Marchal, S. Menardi, M. Faucherre, N. Hubin, "Prototype for the ESO VLTI fringe sensor," in Proc. SPIE Proc. Vol. 2200 A mplitude and intensity Spatial Interfemmet.·y II, J. Breckinridgt> (Ed), 1994b.
H. Jorck,� R. Maurer, J. ](ase, M. Faucherre, J. M. Beckers, G, I(uhn, H. Hupe, "The design of the Delay Lines for the VLT Interferometer," ESO Conference on High Resolution Imaging by Inlerferometr'y II, J. M. Becker~, F. Merkle (Eds.), ESO Garching. pp. 1157-1168, 1991
B.� ](oehler, O. von del' Luhe, "Engineering aspects of environmental factors in VLTI," in J. Breckinridge (ed.), Amplitude and Intensity Spatial Interferometry II, SPIE Proceedings Vol. 2200, 1994.
B.� ](oehler, S. Leveque, O. von del' Luhe, "Results of studies on the environmental factors affecting the VLTI performance," in Optical Telescopes of Today and Tomon·ow. SPIE Proc., June 1996.
A. Leger,� Mariotti, J.-M., Rouan, D., Schneider, "How to search for extra-solar planets with the VLT/VISA?" in Science with the VLT, Proceedings of the ESO Workshop 28 June - 4 July 1994, J. R. Walsh and I. J. Danziger (eds.), Springer 1995, pp. 21-32, 1995.
P. Lena,� F. Merkle, "Interferometry with the European Very Large Telescope," ESONOAO Conference on interferometr'ic Imaging in Astronomy, J. W. Goad (Ed.), NOAO Tucson, pp. 169-170, 1987.
P.� Lena, "The interferometric mode of the European Very Large Telescope," NOAOESO Conference on High Resolution imaging by Interferometry, F. Merkle (Ed.), ESO Garching, pp. 899-908, March 1988.
S.� Leveque, B. Koehler, O. von del' Luhe, "Measurement of Optical Path Fluctuations due to internal Seeing for the VLT", in Advanced Imaging Technology and Commercia/ Applications, SPIE Proc. 2566, J. Gonglewski (Ed.), 156-163, 1995a.
S.� Leveque, B. Koehler, O. von del' Luhe, "Longitudinal dispersion compensation for the Very large Telescope Interferometer," subm. to Experimental Astronomy, 1995b.
S.� Leveque, B. KoeWer, O. von del' Luhe, "Optical path difference model for the Very large Telescope Interferometer" , in Opticat Telescopes of Today and Tomorrow, SPIE Proc., June 1996.
F.� Merkle, P. Lena, "Spatial interferometry with the European VLT," Proc. SPIE Vol. 628 Advanced Technology Optical Telescopes III, pp. 261-272, 1986.
F.� Merkle, "Synthetic-aperture imaging with the European Very Large Telescope." Journ. Opt. Soc. Am. A 5,6, pp. 904-913, 1988a.
F.� Merkle, "Current concept of the VLT interferometric mode," NOAO-ESO Conference on High Resolution Imaging by lnterjemmetr'y, F. Merkle (Ed.), ESO Garching, pr. 909-919, 1988b.
"ESO.� C:NRS and MPC: Sign Agreement on Enhancement of the VLT Interferometer." The Messenger 71, ESO, p. 1, March 1993a.
22 Oskar von der Luhe
"News from Council," The !\1essenger 74, ESO, p. 1, December 1993b. F.� Paresce, and the [nterferometry Science Advisory Committee, "A :'-if'W Start. f("lr the
VLTl'·. ESO Messenger 83. pp, 14-21. March 1996, D.� Plathner, J. M. Beckers, "The design of the Auxiliary Telescopes for the VLT
Int.erferometer," ESO Conference on High Resolution Imaging by Interjel'omelry II, J M. Beckers, F. l\Ierkle (Eds.), ESO Garching, pp. 939-948, 1991.
A Quirrenbach, " Ast.rometric detection ond investigation of planetary systems with the VLT Interferometer," in Srience with the VLT, Proceedings of the ESO Workshop 28 June - 4 July 1994. J. R vValsh and I. J. Danziger (eds.), Springer 1995, pp. 33-37, 1995.
Th. Reinheimer, I<.-H. Hofmann, G. Weigelt, "Computer simulations of interferometric imaging with the VLT interferometer," ESO Conference on High Resolution Imaging by Inttrferometry Il. J. M. Beckers, F. Merkle (Eds.), ESO Garching, pp. 827-834, 1991.
F.� RoddieI', P. Lena, "Long baseline Michelson interferometry with large ground-based telescopes operating at optical wavelengths II. Interferometry at infrared wavelengths," J. Optics (Paris) 15,6 pp. 363-374, 1984.
Shao,� M., M. M. Colavita. "Potential od long-baseline infrared interferometry for narrow-angle astrometry," Astron. Astrophys. 262, pp. 353-358, 1992.
O. von del'� Luhe, J. M. Beckers, R. Braun, "The configuration of the VLT Interferometer on the Paranal site," ESO Conference on Jiigh Resolution Imaging by Inteljerometry Il, J. M. Beckers, F. Merkle (Eds.), ESO Garching, pp. 959-96R, 1991.
O.� von der Luhe, J. M. Beckers, M. Faucherre, B. I<oehler, F. Merkle, Zhu !'i., "Int.erferometry with the Very Large Telescope," Proc. of an ESA Workshop on Solar Physics and Astmhysics at Interferometric Resolution, ESA-SP 344, Paris, pp. ~47254, 1992.
O. von der Luhe, D. Ferrand, B. hoehler, Zhu N., Th. Reinheimer, "The Interferometric Mode of the ESO Very Large Telescope", in Proc. SPIE Proc. Vol. 2200 Amplitude and Intensity Spatial Intelje"ometry Il, J. Breckinridge (Ed.), pp. 168-179, 1994.
O. von� der Luhe, F. Derie, D. Ferrand, B. Koehler, S. Leveque, F. Paresce, L. d'Arcio, "Interferometry with t.he ESO Very Large Telescope", in Proc. SPIE Proc. Vol. 2566 Advanced Imaging Technology and Commercial Applications, N. Clark, J. Gonglewski (Eds.). pp. 124-133, 1995a.
O. von cler Liihe, A.� Quirrenbach, and B. Koehler, "Narrow-angle Astrometry with t.he VLT Interferometer," in SCIence with the VLT, Proceedings of t.he ESO Workshop 28 June - 4 July 1994, J. R. Walsh and L J. Danziger (eds.), Springer 1995, pp. 445-450, 1995b.
O.� von del' Liihe, A. Quirrenbach, "Calibration of the VLT Interferometer," in Understanding and Calibrating JiST and VLT Data, ESO Conference, P. Benvenuti (Ed.), 173179, 1995c.
O.� von del' LUhe, "VISA: the sub-array mode of the ESO Very Large Telescope Interferometer," in Programmes A strophysiques pour VISA. Workshop by the French ~ational Program for High Angular Resolution in Astronomy. J. Bouvier, Ed. 20-36, 1995d.
O.� von dcr Luhe, F. Derie, B. Eoehler, S. Leveque, F. Paresce, M. Verola, "Interferomet.ry with the ESO Ver~' Large Telescope", In Optical Telescopes oj Today and Tomonow. SPIE Proc., June 1996.
-I

![Untitled1 [lss.fnal.gov]lss.fnal.gov/archive/other/ssc/ssc-153.pdf · november 1987 ssemonthly report ssc-153 project summary cdgreport bnlreport fnalreport lblreport project cost](https://static.fdocuments.in/doc/165x107/5f0dc7547e708231d43c0aa3/untitled1-lssfnalgovlssfnalgovarchiveothersscssc-153pdf-november-1987.jpg)


![Untitled3 [lss.fnal.gov]lss.fnal.gov/archive/other/sdc/sdc-90-151.pdf · 2009. 8. 12. · SD~-'tO-OO,s-l Or Letter of Intent OT by the SOLENOIDAL DETECTOR COLLABORATION to construct](https://static.fdocuments.in/doc/165x107/5fd2004678236530e445a345/untitled3-lssfnalgovlssfnalgovarchiveothersdcsdc-90-151pdf-2009-8.jpg)
