1 In - Jefferson Lab | Exploring the Nature of Matter or ge Washington University, Washington, DC...
54
Transcript of 1 In - Jefferson Lab | Exploring the Nature of Matter or ge Washington University, Washington, DC...

Photoproduction
of ! Mesons o� Protons
with Linearly Polarized Photons
F.J. Klein�yz, V. Burkert, E.S. Smith
Thomas Je�erson National Accelerator Facility, Newport News, VA 23606
P.L. Cole�
University of Texas at El Paso, El Paso, TX 79968
J.C. Sanabria
Universidad de los Andes, Bogot�a, Colombia
H. Crannell, D.I. Sober
The Catholic University of America, Washington, DC 20064
H. Funsten
College of William and Mary, Williamsburg, VA 23185
C. Bennhold, B.L. Berman, W.J. Briscoe, K.S. Dhuga, I. Strakovsky
The George Washington University, Washington, DC 20052
Z.P. Li, Q. Zhao
Peking University, Beijing 100871, PR China
S. Capstick
Florida State University, Tallahassee, FL 32306
W. Roberts
Old Dominion University, Norfolk, VA 23529
J.-P. Didelez, M. Guidal, E. Hourany
Institut de Physique Nucl�eaire, Universit�e de Paris, Orsay, France
J.-M. Laget
CEA-Saclay, DAPNIA/SPhN, Gif-sur-Yvette, France
J.D. Kellie, K. Livingston, D. Ireland, R.O. Owens, G. Rosner
Glasgow University, Glasgow, Great Britain
+
The CLAS Collaboration
� Co-Spokesperson
y Contact personz Will present proposal
Abstract
The photoproduction of ! mesons o� protons will be used to study baryon reso-
nances and t-exchange processes in the center-of-mass energy regime of 1.73 to 2.24 GeV.
In baryon spectroscopy, the !N channel is expected to be a signi�cant branch for the de-
cay of baryon resonances carrying the isospin I = 12. t-channel exchange contributions
can only be disentangled by use of a linearly polarized photon beam. The measurement
will employ a linearly polarized beam of photons produced by the approved Coherent
Bremsstrahlung Facility to measure the beam asymmetry and the spin density matrix
elements of the three-pion decay of the !. The spin density matrix elements and polar-
ization asymmetry of the ! decay will be extracted as functions of the center-of-mass
energyps and the ! production angle �cm in the center-of-mass frame. These measure-
ments will expedite the search for baryon resonance contributions and will provide new
physics information on di�ractive, t- and u-channel processes. The proposed experi-
ment will probe the lower energy region (1:2 < E < 1:6 GeV) with an average photon
polarization of 65% by using a 4 GeV electron beam. A second run with a 6 GeV
electron beam will permit measurements in the energy regime 1:5 < E < 2:2 GeV
with an average photon polarization of 80%. The 100 MeV overlap will allow for cross
checking and comparing the results of the two runs. We propose to collect data in par-
allel with and contiguous to the already approved experiments E94-109 and E98-109,
which are scheduled for the 8 CLAS running period.
1 Introduction
We propose to measure the production of ! mesons by using a beam of linearly polarized
photons. The measurement of the complete angular distributions of the decay products
of the ! will result in a set of rigid constraints necessary for elucidating the character of
the exchange between the target nucleon and the incident photon for low four-momentum
transfer squared t, and provide crucial information on the extraction of masses, partial
widths, and helicity amplitudes of baryon resonances that decay via the !N mode. Due to
the narrow decay width (8.43 MeV) of the ! meson and to isospin selectivity, the ! meson
channel will serve as an unique signal for extracting N� resonances that possess an isospin of
1/2. The quantities to be measured in this experiment are the spin density matrix elements
of the !. These observables, three from unpolarized photoproduction experiments and six
additional ones with a linearly polarized photon beam, are extracted in the rest frame of the
! by measuring the polar and azimuthal angular distributions of the decay pions referenced
with respect to the orientation of the photon spin. Data to be obtained over the full �lab
range and over a large incident photon energy range will allow us to extract the spin density
matrix elements as functions both of the c.m. energyps and of the c.m. polar angle �cm
between the beam axis and the produced ! meson. By using CLAS, the photon tagger and a
continuous electron beam, we will be able to perform these measurements with full angular
coverage, low systematic uncertainties, and high statistics.
Linearly polarized photons at high energies have been used to determine the natural
parity character of the pomeron exchange in the Vector Meson Dominance model (VMD).
The ! photoproduction data [1] in the energy range of 20 < E < 70 GeV, in particular, has
lent strong support to VMD. From the SLAC bubble-chamber experiment using a linearly
polarized beam of photons with E~ = 2:8 and 4.7 GeV, large contributions of unnatural-
parity exchange were measured for ! photoproduction [2]. Such behavior is expected in
models which are based upon one-pion exchange (J� = 0�) in the t-channel [3], [4]. The
strength of the contributions from either natural- or unnatural-parity exchange can be deter-
mined by the density matrix elements. All but two of the nine measureable matrix elements
are zero for both of these processes, and a ip in sign of one of these observables allows one
to distinguish between natural- and unnatural-parity exchange.
At resonance energies (ps < 2:4 GeV), the high energy approximation used to sepa-
1

rate natural- and unnatural-parity exchange no longer holds over the whole t-range. In-
stead, s-channel processes may contribute as well. Unlike di�ractive ! photoproduction,
the helicity of the photon is not directly transferred to the ! meson. We expect to see a
much di�erent behavior of the spin density matrix elements at energies where resonance
contributions are important compared with higher energies.
Whereas di�ractive and t-channel exchange contributions will dominate the ! cross sec-
tion at low t, and u-channel exchange will be large at high t, we expect the contributions from
resonance production to be enhanced in the mid-t regime. The low- and high-t processes are
of interest in their own right, and interference e�ects with resonant ! photoproduction may
well be signi�cant. We will be measuring over the full kinematical range in t and thus will be
sensitive to all of these processes. Furthermore, the probe of linearly polarized photons pro-
vides a powerful tool for disentangling the contributions of natural-parity (Pomeron, �; f2)
and unnatural-parity exchange (mostly pion) in the t-channel.
2 Motivation
The spectrum of excited states of a system of bound particles opens a window to the under-
lying interaction. Just as in nuclear spectroscopy, where the excited-state spectrum re ects
the quantum many-body con�gurations of nucleons and mesons interacting via the strong
nuclear force, so does baryon spectroscopy a�ord us the opportunity to study the interaction
of quarks and gluons in excited states.
An important motivation for studying the spectrum of baryon resonances with photons is
to obtain information on the photoproduction amplitudes of the individual resonances. Most
of our knowledge of the baryon resonance spectrum has come from the reactions �N ! �N ,
N ! �N , and �N ! ��N . At center-of-mass energies below 1.7 GeV, the single pion
production channel dominates both the pion and photoabsorption cross sections. As the c.m.
energy increases towards 2.0 GeV, the two- and three-pion decay channels become dominant,
and it is in this energy region that the masses and partial widths of the resonances are poorly
determined.
An outstanding problem in our understanding of baryon spectroscopy is that of the
2

missing resonances. For example, SU(6) O(3) symmetric quark models predict far more
resonances than have been observed. One solution is to restrict the number of internal
degrees of freedom by assuming that two quarks are bound in a diquark pair [5], thus
lowering the level density of baryon resonances. An alternate solution has been put forward
by Koniuk and Isgur [6] and others [7],[8]. In these calculations, it was found that the missing
resonances tend to couple weakly to the �N channel but stronger to the �N , ��, and !N
channels. For example, in Table 1, we tabulate the supermultiplet assignments with the
corresponding PDG [9] star rating for the measured and missing baryon resonances from the
QCD-improved model of Cutkosky [10]. The supermultiplets in the boxes are fully consistent
with the predictions of the diquark model. We remark that all of the boxed entries have at
least a three-star rating. We also observe that the positive parity P11(1710) and P13(1870)
resonances are inconsistent with the diquark model. The partial widths for the photon and
hadronic couplings in the framework of Koniuk-Isgur are contained in Table 2. We note
that the P13(1870) as well as the F15(1955) are predicted to have primarily an !N decay
mode. Since most of our information on the baryon resonance spectrum comes from partial-
wave analyses of �N ! �N measurements, these `missing states' will clearly have escaped
detection. The models predict that these resonances will have a reasonable coupling to the
photon. For this reason, an approved CEBAF experiment [11] using unpolarized electrons
will search for resonances decaying via the !N channel. We expect the identi�cation of
many of these resonances decaying through the !N mode to be di�cult due to their broad
widths and narrow spacing. The sensitivity a�orded by linearly polarized photons will
provide additional constraints in identifying these resonances, and such a measurement is
complementary to electroproduction experiments.
Experimentally, several di�culties are apparent. The number of resonances extracted
either from the analyses of pion production data or from the theoretical predictions is large.
In addition, the resonance widths are broad (typically � 150 MeV), and one is faced with the
problem of disentangling many overlapping resonances. Moreover, di�ractionlike processes
dominate the vector meson photoproduction in forward angles. A phase-shift analysis is
required to identify resonant behaviour and to extract the helicity amplitudes for the vari-
ous resonances. Such an analysis is greatly supported by the measurement of polarization
observables.
3

Table 1: SU(6) O(3) supermultiplet assignments from the QCD-improved model of
Cutkosky for the measured and missing baryon resonances. The boxed supermultiplets
are fully consistent with the diquark model.
N� Status SU(6) O(3) Parity �� Status SU(6) O(3)
P11(938) **** (56,0+) + P33(1232) **** (56,0+)
S11(1535) **** (70,1�)
S11(1650) **** (70,1�) S31(1620) **** (70,1�)
D13(1520) **** (70,1�) � D33(1700) **** (70,1�)
D13(1700) *** (70,1�)
D15(1675) **** (70,1�)
P11(1520) **** (56,0+) P31(1875) **** (56,2+)
P11(1710) *** (70,0+) P31(1835) (70,0+)
P11(1880) (70,2+)
P11(1975) (20,1+)
P13(1720) **** (56,2+) P33(1600) *** (56,0+)
P13(1870) * (70,0+) P33(1920) *** (56,2+)
P13(1910) (70,2+) + P33(1985) (70,2+)
P13(1950) (70,2+)
P13(2030) (20,1+)
F15(1680) **** (56,2+) F35(1905) **** (56,2+)
F15(2000) ** (70,2+) F35(2000) ** (70,2+)
F15(1995) (70,2+)
F17(1990) ** (70,2+) F37(1950) **** (56,2+)
4

Table 2: Partial widths for photon and hadronic couplings to baryon resonances in the Isgur-
Karl model. The total hadronic width, summed over all identi�ed channels, is also given.
The units are MeV.
Mass J� p �N �� �N !N Total
N(1490) 1/2� 1.3 28. 2.9 40. 0. 98.
N(1655) 1/2� 0.72 76. 67. 102. 1.4 262.
N(1535) 1/2� 0.58 85. 52. 27. 0. 164.
N(1745) 3/2� 0.009 13. 317. 26. 2.9 360.
N(1670) 5/2� 0.013 30. 86. 5.3 0. 130.
N(1405) 1/2+ 0.026 46. 5.8 0.1 0. 52.
N(1705) 1/2+ 0.23 45. 13. 36. 0.8 108.
N(1890) 1/2+ 0.057 19. 12. 22. 37. 96.
N(2055) 1/2+ 0.009 1.4 3.2 1.7 32. 39.
N(1710) 1/2+ 1.0 42. 4.4 156. 32. 242.
N(1870) 3/2+ 0.027 10. 19. 2.3 98. 149.
N(1955) 3/2+ 0.021 1.2 88. 56. 90. 236.
N(1980) 3/2+ 0.031 1.2 96. 71. 55. 223.
N(2060) 3/2+ 0.0001 0.3 31. 15. 98. 145.
N(1715) 5/2+ 0.29 50. 4.4 20. 1.4 77.
N(1955) 5/2+ 0.24 0.2 64. 67. 184. 324.
N(2025) 5/2+ 0.001 1.7 67. 66. 180. 316.
N(1955) 7/2+ 0.006 9.6 36. 18. 53. 126.
�(1685) 1/2� 0.34 11. 64. 64. �� 139.
�(1685) 3/2� 1.0 24. 146. 289. �� 459.
�(1925) 1/2+ 0.0 28. 35. 37. �� 112.
�(1240) 3/2+ 0.46 121. 0. 0. �� 121.
�(1780) 3/2+ 0.14 29. 74. 32. �� 139.
�(1975) 3/2+ 0.030 0. 59. 35. �� 94.
�(1940) 5/2+ 0.059 16. 41. 45. �� 103.
�(1975) 5/2+ 0.51 1. 41. 388. �� 430.
�(1915) 7/2+ 0.27 56. 30. 88. �� 178.
5
3 Physics
3.1 Processes Contributing to ! Photoproduction
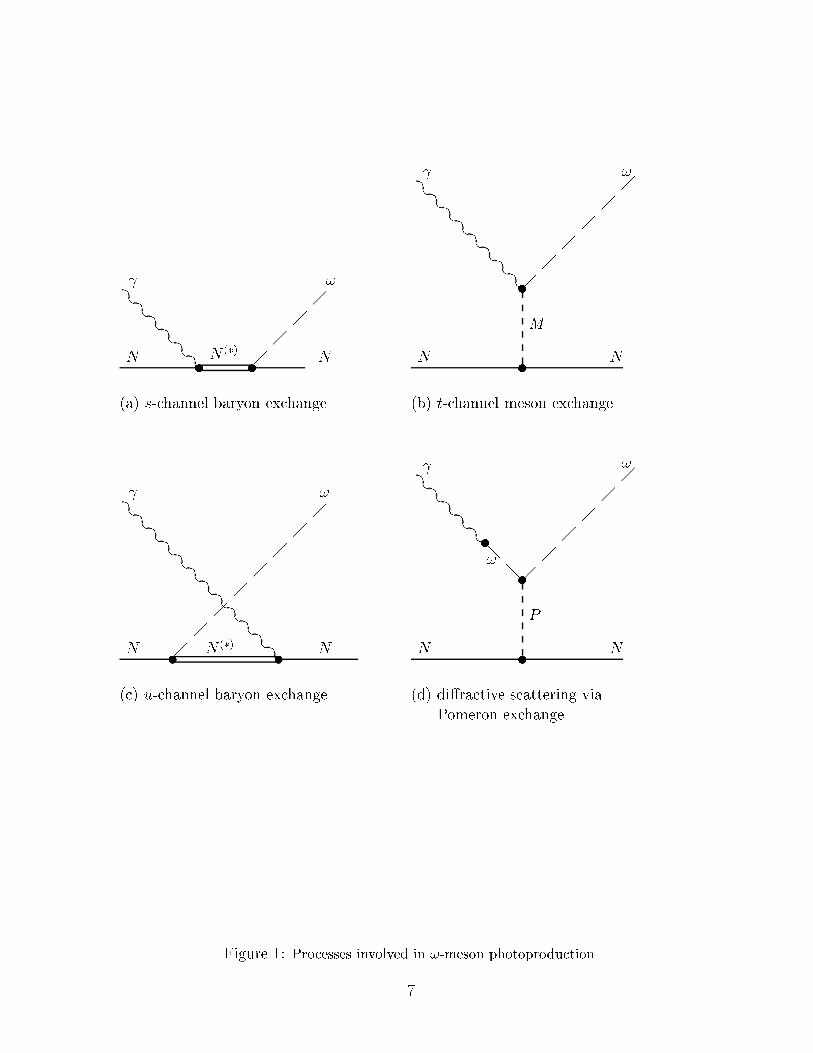
From the duality principle, the cross section for ! photoproduction can be calculated, in prin-
ciple, by summing over all possible t-channel meson-exchange processes [Fig. 1(b)], or over
all possible s-channel plus all possible u-channel baryon-exchange processes. The pomeron
exchange contribution to di�ractive scattering of Fig. 1(d) needs to be added as a special
case, as the e�ects of pomeron exchange in the t-channel are understood to be in addition
to those of meson exchange. In the di�ractive (low-t) region, it is more e�cient to sum
over t-channel exchange processes, the sum over s-channel plus u-channel processes would
require a large number of intermediate baryon states for convergence. Similarly, in the reso-
nance region a t-channel sum will yield only the average cross section and will not show the
characteristic energy dependence attributed to baryon resonances.
Constructing the cross section from a model, and likewise extracting resonance para-
meters from an analysis of the cross section, will therefore require di�erent approaches in
di�erent kinematical regions. The s-channel sum used for an estimate of the resonance
region cross section needs to be supplemented by the terms representing the u-channel
diagrams of Fig. 1(c). If we work within time-ordered perturbation theory, in lowest order,
these diagrams will be suppressed relative to the s-channel diagrams because of energy
denominators which are increased by the presence of the initial photon and the �nal ! in
the intermediate state. For a given intermediate baryon resonance, theps for which the
denominator is minimized, is pushed up to a higher value, and the minimum attained is
signi�cantly larger, relative to the s-channel diagram.
6
(a) s-channel baryon exchange
u uN NN (�)
�
��
��
��
��
��
�
�
�
�
�
!
(b) t-channel meson exchange
N N
�
��
��
��
��
��
��
��
�u
�
�
�
�
�
�!
M
u
(c) u-channel baryon exchange
u uN NN (�)
�
��
��
��
��
��
��
��
��
��
��
��
�
�
�
�
�
�
�
�
�
!
(d) di�ractive scattering via
Pomeron exchange
N N
�
��
��
��
��
�u
@
@!
�
�
�
�
�
�
u
!
P
u
Figure 1: Processes involved in !-meson photoproduction.
7
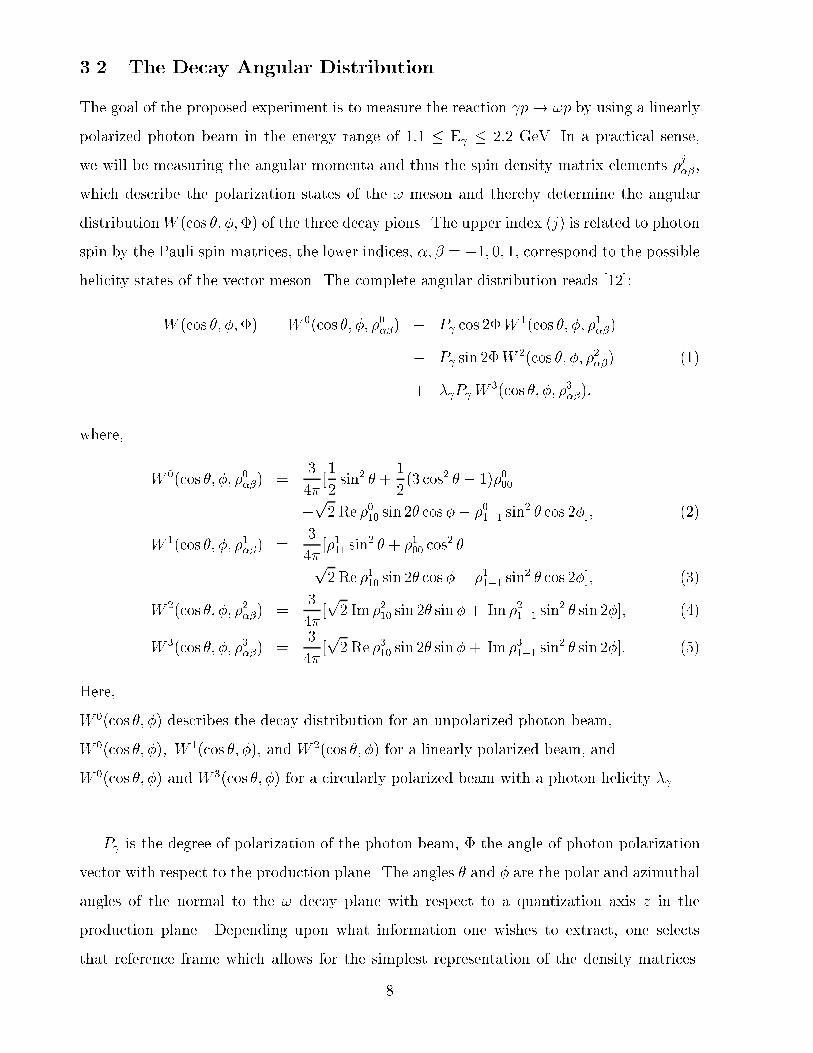
3.2 The Decay Angular Distribution
The goal of the proposed experiment is to measure the reaction p! !p by using a linearly
polarized photon beam in the energy range of 1:1 � E � 2:2 GeV. In a practical sense,
we will be measuring the angular momenta and thus the spin density matrix elements �j��,
which describe the polarization states of the ! meson and thereby determine the angular
distributionW (cos �; �;�) of the three decay pions. The upper index (j) is related to photon
spin by the Pauli spin matrices, the lower indices, �; � = �1; 0; 1, correspond to the possible
helicity states of the vector meson. The complete angular distribution reads [12]:
W (cos �; �;�) = W 0(cos �; �; �0��) � P cos 2�W1(cos �; �; �1��)
� P sin 2�W2(cos �; �; �2��) (1)
+ � P W3(cos �; �; �3��):
where,
W 0(cos �; �; �0��) =3
4�[1
2sin2 � +
1
2(3 cos2 � � 1)�000
�p2 Re �010 sin 2� cos�� �01�1 sin
2 � cos 2�]; (2)
W 1(cos �; �; �1��) =3
4�[�111 sin
2 � + �100 cos2 �
�p2 Re �110 sin 2� cos�� �11�1 sin
2 � cos 2�]; (3)
W 2(cos �; �; �2��) =3
4�[p2 Im �210 sin 2� sin�+ Im �21�1 sin
2 � sin 2�]; (4)
W 3(cos �; �; �3��) =3
4�[p2 Re �310 sin 2� sin�+ Im �31�1 sin
2 � sin 2�]: (5)
Here,
W 0(cos �; �) describes the decay distribution for an unpolarized photon beam,
W 0(cos �; �); W 1(cos �; �), and W 2(cos �; �) for a linearly polarized beam, and
W 0(cos �; �) and W 3(cos �; �) for a circularly polarized beam with a photon helicity � .
P is the degree of polarization of the photon beam, � the angle of photon polarization
vector with respect to the production plane. The angles � and � are the polar and azimuthal
angles of the normal to the ! decay plane with respect to a quantization axis z in the
production plane. Depending upon what information one wishes to extract, one selects
that reference frame which allows for the simplest representation of the density matrices.
8

Figure 2: Helicity reference frame. � is the azimuthal angle of the electric vector
~" of the photon, and � and � are the polar and azimuthal angles of the normal to
the decay plane de�ned by ~p�+ � ~p�� .
For example, in the helicity frame the density matrices reduce to an elementary form for
natural-parity exchange processes, and the Gottfried-Jackson frame is well suited for 0�
processes. The transversity frame, in general, provides a simple form for these observables
when calculating polarization observables.1 Shown in Fig. 2 is the graphical depiction of
these angles.
With linearly polarized photons, one has access to six more independent spin density
matrix elements than can be obtained in an unpolarized vector meson photoproduction
experiment. By using CLAS, we will measure the angular distribution (and hence the spin
density matrix elements) of ! production both as a function of the c.m. energyps and of
the ! production angle �cm.
At high photon energies the measured density matrix elements give rise to an angular
dependence that is characteristic of natural-parity exchange (pomeron exchange) in the
t-channel and of s-channel helicity conservation (SCHC), as one would expect if the helicity
of the vector meson re ects that of the real photon. Shown in Fig. 3 are the angular
1These reference frames di�er by the de�nition of the quantization axis z, and can be transformed, one
to the other, by appropriate rotations and Lorentz boosts. In the helicity frame the z-axis is de�ned as
the direction opposite to the outgoing proton in the total c.m. system; in the Gottfried-Jackson frame, the
z-axis is de�ned as the direction of the incoming photon in the rest frame of the !, whereas in the Adair
frame, the z-axis is de�ned as the direction of the incoming photon in the total c.m. system; it di�ers from
the helicity frame by a rotation of the angle � in Fig. 2. In the transversity frame, the quantization axis is
de�ned as the normal of the production plane.
9

Figure 3: Linearly polarized photon data ( p ! !p) from CERN [1] showing the
angular distribution of the data as functions of helicity polar angle cos(�hel) and
as de�ned in the text.
distributions for events in the ! mass range as observed by the OMEGA collaboration [1].
The experiment used a beam of linearly polarized photons in the energy range between 20
and 70 GeV, with a mean polarization of 48%. The data are displayed as a function of
cos �hel and as a function of = �hel �� (with �hel; �hel, and � as de�ned in Fig. 2). For a
polarization of unity (P = 1), s-channel helicity conservation demands that the three pions
from the ! decay have an angular distribution given by sin2 �hel cos 2 hel, and this is re ected
in the data. The decay products from the ! decay lie preferentially in the plane where �,
the angle made by the photon electric polarization vector and the production plane, is equal
to the azimuthal decay angle.
Another way to determine this feature is to measure the photon asymmetry parameter
� � �k � �?
�k + �?:
Here �k (�?) is the cross section for the pions from ! decay (� = �=2; � = �=2), to emerge
in the plane of the photon polarization (or perpendicular to it). In terms of the decay
distribution and the measureable density matrix elements � can be rewritten as
� =W (cos �
2; �2; �2)�W (cos �
2; �2; 0)
W (cos �2; �2; �2) +W (cos �
2; �2; 0)
= P
2(�111 + �11�1)
1� �000 + 2�01�1
: (6)
If helicity is conserved in the s-channel, then only two of the nine density matrix elements
are nonzero: �11�1 = 0:5, Im�21�1 = �0:5, hence �=1 when P =1 (with �; � determined in the
10
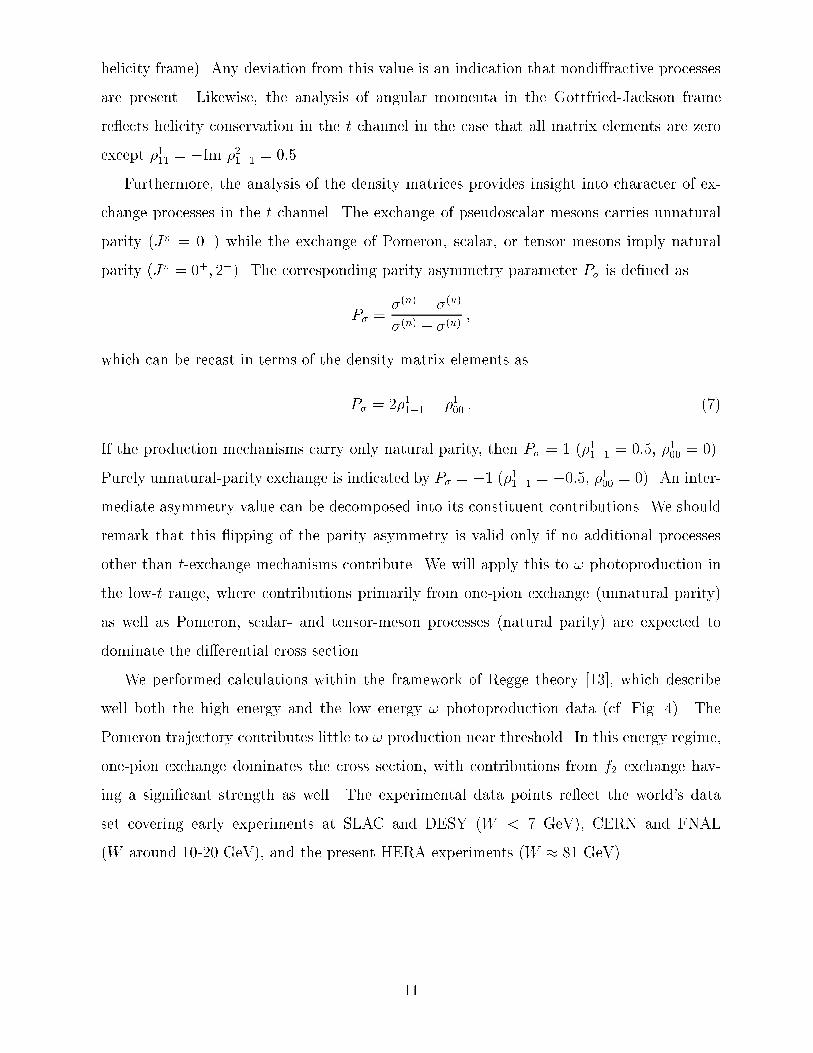
helicity frame). Any deviation from this value is an indication that nondi�ractive processes
are present. Likewise, the analysis of angular momenta in the Gottfried-Jackson frame
re ects helicity conservation in the t channel in the case that all matrix elements are zero
except �111 = �Im �21�1 = 0:5.
Furthermore, the analysis of the density matrices provides insight into character of ex-
change processes in the t channel. The exchange of pseudoscalar mesons carries unnatural
parity (J� = 0�) while the exchange of Pomeron, scalar, or tensor mesons imply natural
parity (J� = 0+; 2+). The corresponding parity asymmetry parameter P� is de�ned as
P� =�(n) � �(u)
�(n) + �(u);
which can be recast in terms of the density matrix elements as
P� = 2�11�1 � �100 : (7)
If the production mechanisms carry only natural parity, then P� = 1 (�11�1 = 0:5, �100 = 0).
Purely unnatural-parity exchange is indicated by P� = �1 (�11�1 = �0:5, �100 = 0). An inter-
mediate asymmetry value can be decomposed into its constituent contributions. We should
remark that this ipping of the parity asymmetry is valid only if no additional processes
other than t-exchange mechanisms contribute. We will apply this to ! photoproduction in
the low-t range, where contributions primarily from one-pion exchange (unnatural parity)
as well as Pomeron, scalar- and tensor-meson processes (natural parity) are expected to
dominate the di�erential cross section.
We performed calculations within the framework of Regge theory [13], which describe
well both the high energy and the low energy ! photoproduction data (cf. Fig. 4). The
Pomeron trajectory contributes little to ! production near threshold. In this energy regime,
one-pion exchange dominates the cross section, with contributions from f2 exchange hav-
ing a signi�cant strength as well. The experimental data points re ect the world's data
set covering early experiments at SLAC and DESY (W < 7 GeV), CERN and FNAL
(W around 10-20 GeV), and the present HERA experiments (W � 81 GeV).
11

Figure 4: Regge calculations by J.M. Laget of the ! cross section incoporating the
processes: Pomeron trajectory (dashed line), Pomeron plus f2 exchange (dotted line),
Pomeron plus f2 plus � exchange (solid line) in the t-channel. The experimental
data points in the top �gure are the world's data set (SLAC, DESY, CERN, FNAL,
and HERA).
12

3.3 Density Matrix Elements and Helicity Amplitudes
The basic amplitude F for processes N ! V N 0 is de�ned as
F =< q�V �N 0 jT jk� �N >;
where k and q are the momenta of the incoming photon and outgoing vector meson, respec-
tively. The helicity states are denoted by � = �1 for the incoming photon, �V = 0;�1
for the outgoing vector meson, and �N = �1=2; �N 0 = �1=2 for the initial and �nal state
nucleons, respectively. Following Ref. [14], the amplitude F can be expressed as a 6 � 4
matrix in the helicity space:
F =
0BBBBBBBBBBBBBBB@
H21 H11 H3�1 �H4�1
H41 H31 �H1�1 �H4�1
H20 H10 �H30 H2�1
H40 H30 H10 H40
H2�1 H1�1 H31 �H41
H4�1 H3�1 �H11 H21
1CCCCCCCCCCCCCCCA
: (8)
Because of parity conservation the Hi�V in equ. (8) reduces to 12 independent complex
helicity amplitudes:
H1�V = < �V ; �N 0 = +1=2jT j� = 1; �N = �1=2 >
H2�V = < �V ; �N 0 = +1=2jT j� = 1; �N = +1=2 >
H3�V = < �V ; �N 0 = �1=2jT j� = 1; �N = �1=2 >
H4�V = < �V ; �N 0 = �1=2jT j� = 1; �N = +1=2 >
(9)
In the spin space, the reaction N ! V N 0 is expressed by a correlation between the
initial and �nal state density matrices via the helicity amplitude matrix:
�f = F�iF y; where �f = �V � �N 0; �i = � � �N : (10)
� ; �N ; �V ; �N 0 are the density matrices describing the polarization state of each particle:
� =I 2(1 + ~� � ~PS); �N = IN
2(1N + ~�N � ~PN);
�N 0 =IN0
2(1N 0 + ~�N 0 � ~PN 0); �V = IV
3(1V + ~S � ~PV + 3� � TV ):
(11)
~PS is the Stokes' Vector which de�nes the photon polarization, ~PN is the target polarization
vector, ~PN 0 the recoil nucleon polarization vector, and ~PV and TV are the vector polarization
13

and the tensor polarization of the vector meson, respectively. The density matrix elements
as used in equ. (1) are formed of bilinear combinations of these amplitudes:
�0ik = 1A
P� �N�N0
H�Vi�N0 ;� �NH�
�Vk�N0 ;� �N;
�1ik = 1A
P� �N�N0
H�Vi�N0 ;�� �NH�
�Vk�N0 ;� �N;
�2ik = 1A
P� �N�N0
� H�Vi�N0 ;�� �NH�
�Vk�N0 ;� �N;
�3ik = 1A
P� �N�N0
� H�Vi�N0 ;� �NH�
�Vk�N0 ;� �N;
where, A =P
�Vi� �N�N0
H�Vi�N0 ;� �NH�
�Vi�N0 ;� �N:
(12)
Here, �ik represents ��Vi�Vk . The angular distribution of the decay particles of the vector
meson is described by
W (cos �; �;�) � dN
d cos � d� d�=M�VM
y
here,M denotes the decay amplitude which is given by a related mixture of Wigner d-functions;
in the case of a decay into spinless particles it reads:
< ��jM j�V >= C
s3
4�d1�V 0:
In order to determine the contributions of individual resonances, we will use a partial
wave expansion of the helicity amplitudes:
hJi�V =< q�V �N 0 jT J jk� �N >;
where the set of helicity quantum numbers for each i label (i=1. . . 4) is the same as in
equ. (9). The partial wave helicity amplitudes hJi�V are related to the helicity amplitude
Hi�V by:
Hi�V =XJM
2J + 1
4�d(J)�
M�f(q)d
(J)M�i
(k)hJi�V ;
where, �f = �V ��N 0 and �i = � ��N . This speci�c form of partial wave expansion allows
for constraining the parameters that are extracted in the low-t range.
Our simulation program is based upon the constituent quark model approach by Q. Zhao,
Z.P. Li, and C. Bennhold [15]; using an e�ective Lagrangian approach, the interaction be-
tween a vector meson and the quarks inside the baryon is described within the SU(6) O(3)
symmetry limit. It further takes into account t-channel exchange mechanisms, which domi-
nate in the low-t range: �-exchange (J� = 0+) in �0 production and �0 exchange (J� = 0�)
in ! production.
14
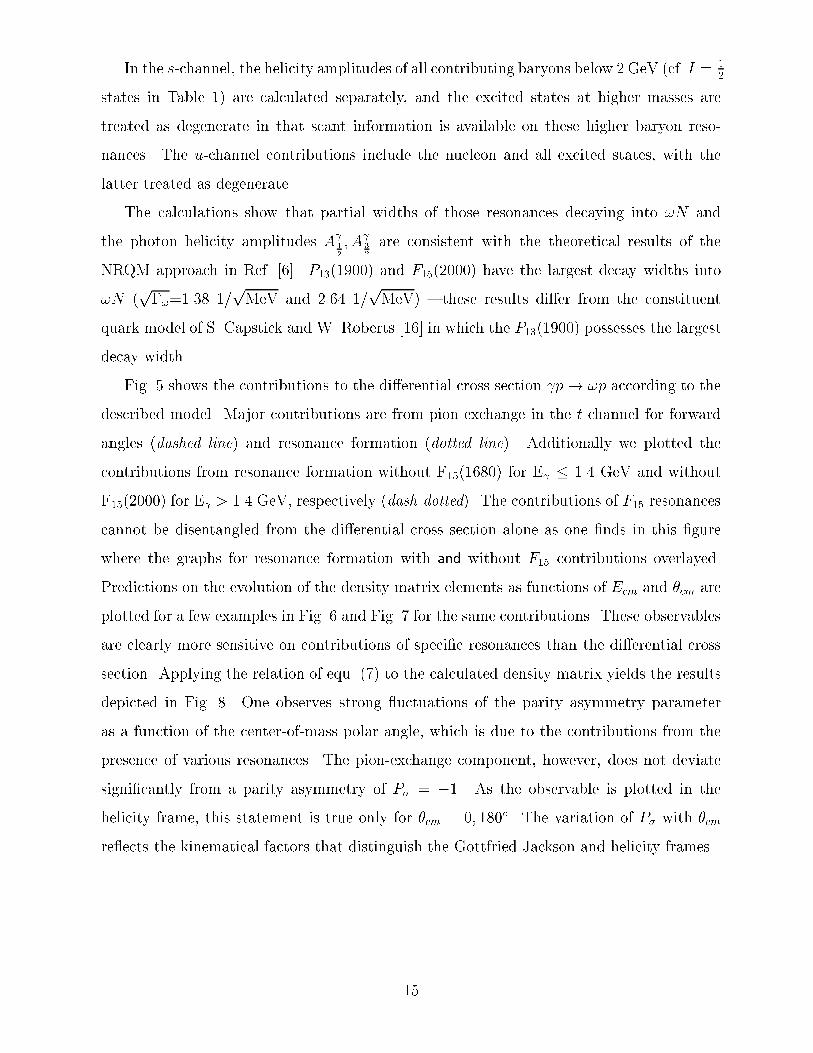
In the s-channel, the helicity amplitudes of all contributing baryons below 2 GeV (cf. I = 12
states in Table 1) are calculated separately, and the excited states at higher masses are
treated as degenerate in that scant information is available on these higher baryon reso-
nances. The u-channel contributions include the nucleon and all excited states, with the
latter treated as degenerate.
The calculations show that partial widths of those resonances decaying into !N and
the photon helicity amplitudes A 1
2
; A 3
2
are consistent with the theoretical results of the
NRQM approach in Ref. [6]. P13(1900) and F15(2000) have the largest decay widths into
!N (p�!=1.38 1/
pMeV and 2.64 1/
pMeV) { these results di�er from the constituent
quark model of S. Capstick and W. Roberts [16] in which the P13(1900) possesses the largest
decay width.
Fig. 5 shows the contributions to the di�erential cross section p! !p according to the
described model. Major contributions are from pion exchange in the t channel for forward
angles (dashed line) and resonance formation (dotted line). Additionally we plotted the
contributions from resonance formation without F15(1680) for E � 1.4 GeV and without
F15(2000) for E > 1.4 GeV, respectively (dash-dotted). The contributions of F15 resonances
cannot be disentangled from the di�erential cross section alone as one �nds in this �gure
where the graphs for resonance formation with and without F15 contributions overlayed.
Predictions on the evolution of the density matrix elements as functions of Ecm and �cm are
plotted for a few examples in Fig. 6 and Fig. 7 for the same contributions. These observables
are clearly more sensitive on contributions of speci�c resonances than the di�erential cross
section. Applying the relation of equ. (7) to the calculated density matrix yields the results
depicted in Fig. 8. One observes strong uctuations of the parity asymmetry parameter
as a function of the center-of-mass polar angle, which is due to the contributions from the
presence of various resonances. The pion-exchange component, however, does not deviate
signi�cantly from a parity asymmetry of P� = �1. As the observable is plotted in the
helicity frame, this statement is true only for �cm = 0; 180�. The variation of P� with �cm
re ects the kinematical factors that distinguish the Gottfried-Jackson and helicity frames.
15

Figure 5: Di�erential cross section d�/d�cm ( p ! !p) in the Quark-Model approach of Zhao,
Li, and Bennhold. Solid line: coherent sum of all contributions, dashed line: contribution from
pion-exchange, dotted line: resonance formation, dash-dotted line: resonance formation without
F15(1680) for E � 1.4 GeV and F15(2000) for E > 1.4 GeV.
16

Figure 6: Contributions to the matrix element �111 in the Quark-Model approach of Zhao, Li,
and Bennhold. Solid line: coherent sum of all contributions, dashed line: contribution from
pion-exchange, dotted line: resonance formation, dash-dotted line: resonance formation without
F15(1680) for E � 1.4 GeV and F15(2000) for E > 1.4 GeV.
17
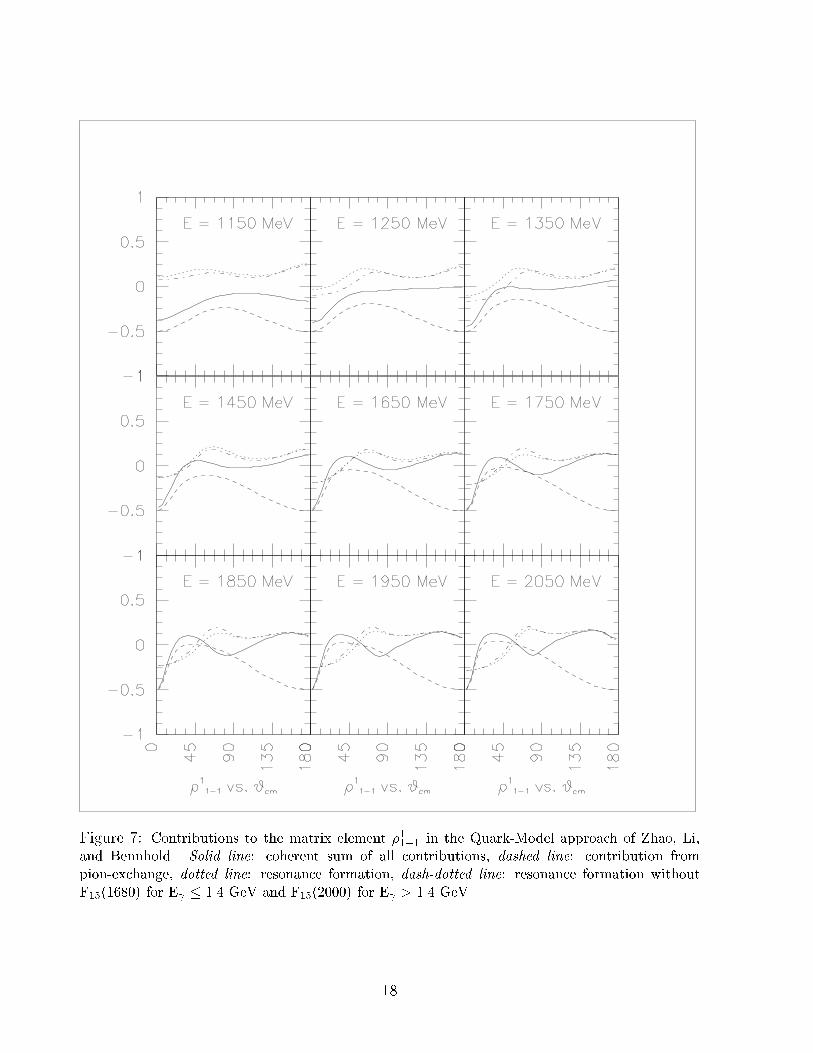
Figure 7: Contributions to the matrix element �11�1 in the Quark-Model approach of Zhao, Li,
and Bennhold. Solid line: coherent sum of all contributions, dashed line: contribution from
pion-exchange, dotted line: resonance formation, dash-dotted line: resonance formation without
F15(1680) for E � 1.4 GeV and F15(2000) for E > 1.4 GeV.
18

Figure 8: Contributions to the parity asymmetry P� in the Quark-Model approach of Zhao,
Li, and Bennhold. Solid line: coherent sum of all contributions, dashed line: contribution from
pion-exchange, dotted line: resonance formation, dash-dotted line: resonance formation without
F15(1680) for E � 1.4 GeV and F15(2000) for E > 1.4 GeV.
19
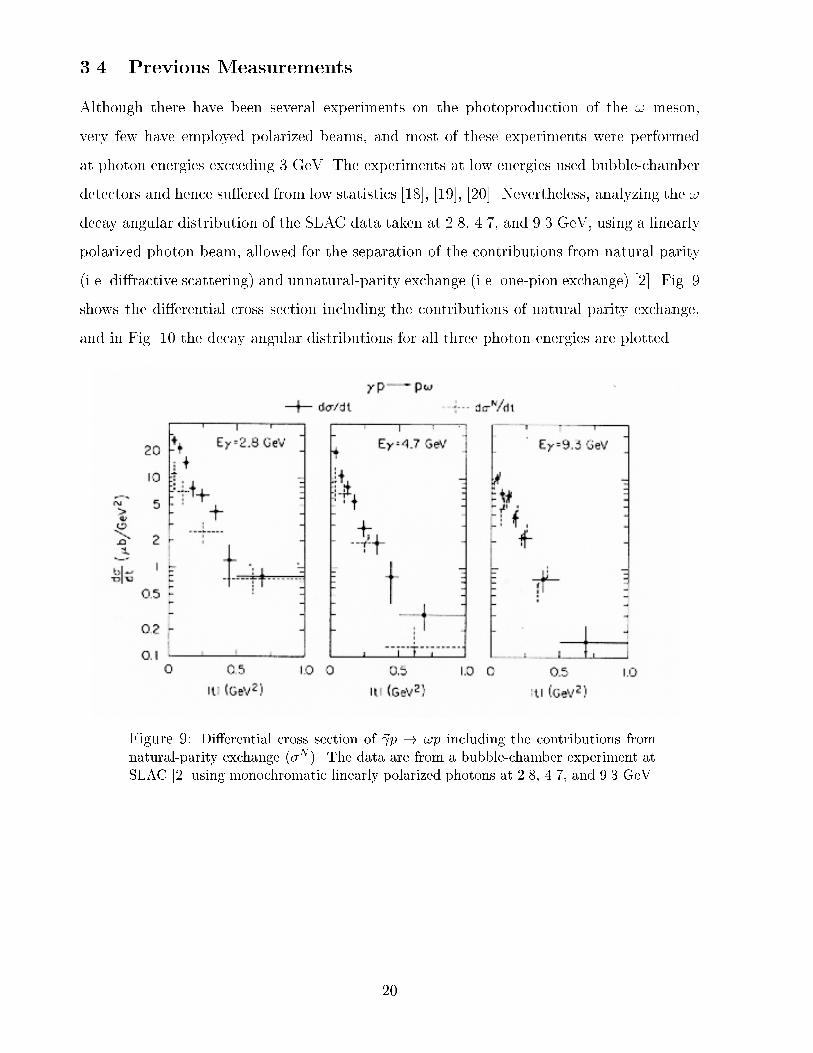
3.4 Previous Measurements
Although there have been several experiments on the photoproduction of the ! meson,
very few have employed polarized beams, and most of these experiments were performed
at photon energies exceeding 3 GeV. The experiments at low energies used bubble-chamber
detectors and hence su�ered from low statistics [18], [19], [20]. Nevertheless, analyzing the !
decay angular distribution of the SLAC data taken at 2.8, 4.7, and 9.3 GeV, using a linearly
polarized photon beam, allowed for the separation of the contributions from natural-parity
(i.e. di�ractive scattering) and unnatural-parity exchange (i.e. one-pion exchange) [2]. Fig. 9
shows the di�erential cross section including the contributions of natural parity exchange,
and in Fig. 10 the decay angular distributions for all three photon energies are plotted.
Figure 9: Di�erential cross section of ~ p ! !p including the contributions from
natural-parity exchange (�N ). The data are from a bubble-chamber experiment at
SLAC [2] using monochromatic linearly polarized photons at 2.8, 4.7, and 9.3 GeV.
20

Figure 10: Decay angular distribution in the helicity frame of the same SLAC
experiment [2].
We stated in Section 3.2 that the results from the CERN experiment, which collected
data on ! photoproduction at much higher photon energies, could be explained purely in
terms of VMD, where the reaction proceeds almost entirely through natural-parity exchange
in the t channel and is s-channel helicity conserving, as would be expected from di�ractive
photoproduction [1].
In the photon energy regime near 1.6 GeV (ps = 1:95 GeV), however, one would ex-
pect to see some indication of resonance production. Unpolarized photoproduction data
taken at DESY by [18] are plotted in Fig. 11 (averaging over the photon energy range of
1:4 < E < 1:8 GeV) and compared with the one-pion-exchange model of Friman and
Soyeur [4]. The agreement between the data and the curve is good for jtj < 0:5 (GeV/c)2.
In the central region, near �cm = 90�, the extrapolated curve underpredicts the data by an
order of magnitude. The preliminary results from a SAPHIR vector meson photoproduction
experiment [21], which used an unpolarized tagged photon beam in the energy range of
1:1 � E � 2:0 GeV, con�rm this observation.
21
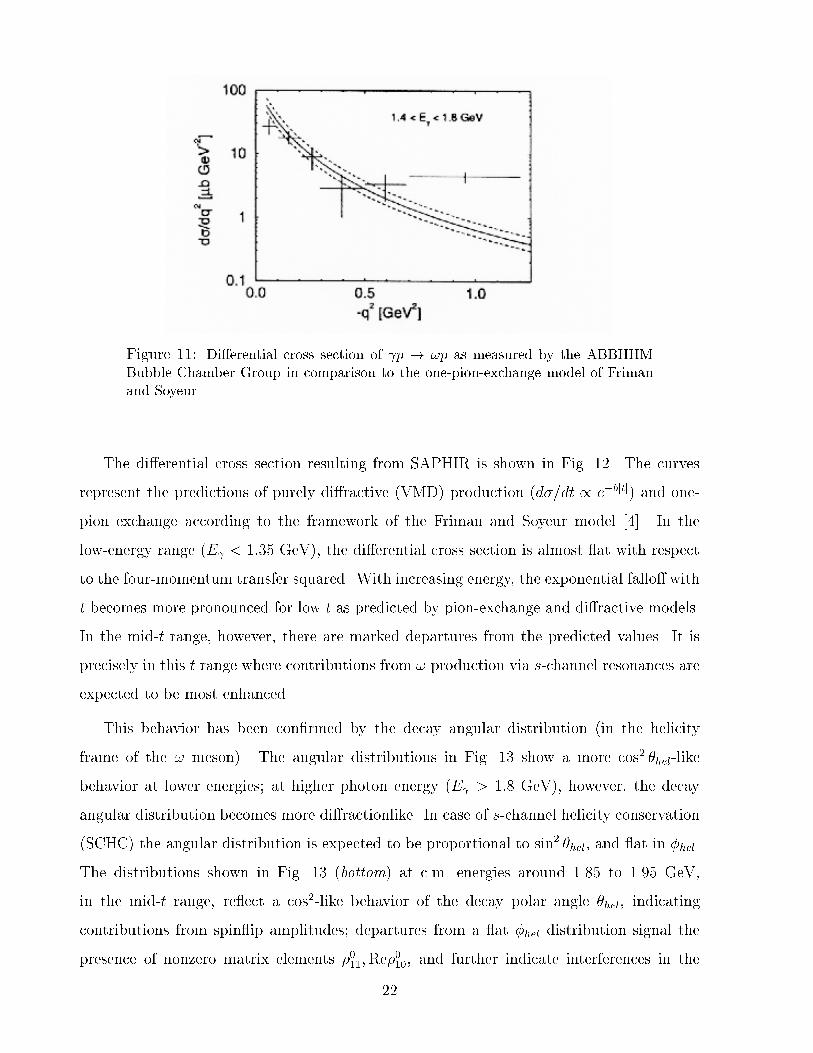
Figure 11: Di�erential cross section of p ! !p as measured by the ABBHHM
Bubble Chamber Group in comparison to the one-pion-exchange model of Friman
and Soyeur.
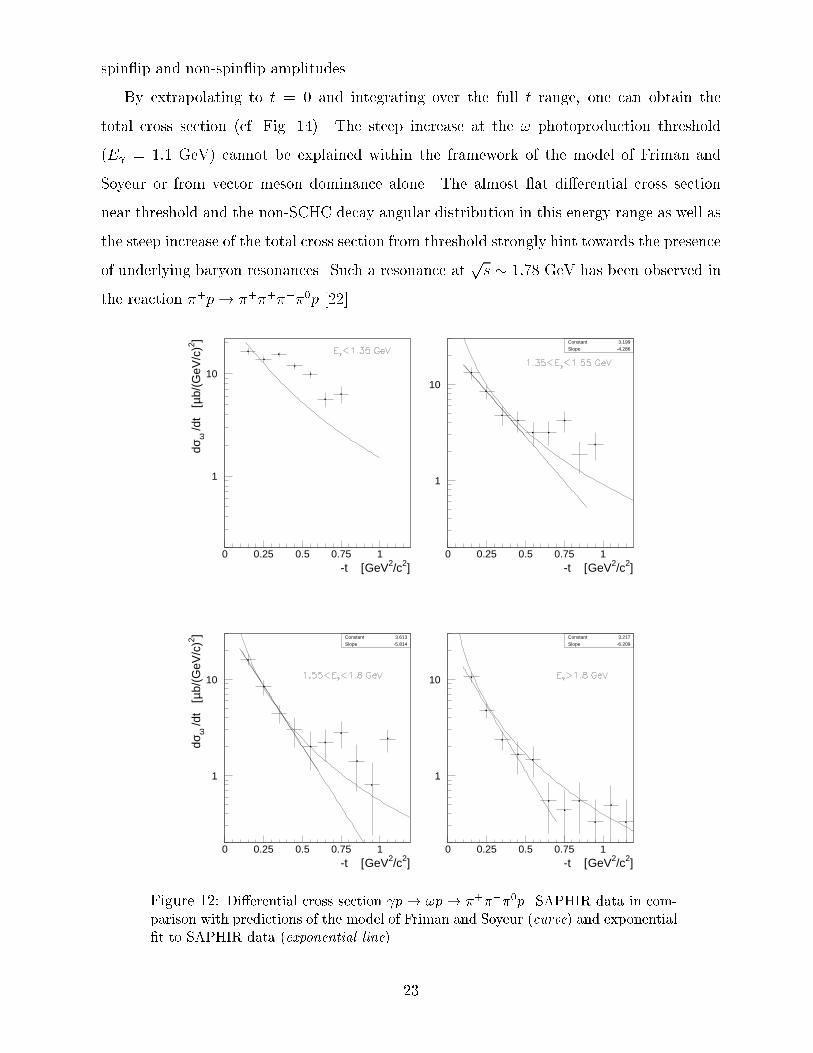
The di�erential cross section resulting from SAPHIR is shown in Fig. 12. The curves
represent the predictions of purely di�ractive (VMD) production (d�=dt / e�bjtj) and one-
pion exchange according to the framework of the Friman and Soyeur model [4]. In the
low-energy range (E < 1:35 GeV), the di�erential cross section is almost at with respect
to the four-momentum transfer squared. With increasing energy, the exponential fallo� with
t becomes more pronounced for low t as predicted by pion-exchange and di�ractive models.
In the mid-t range, however, there are marked departures from the predicted values. It is
precisely in this t range where contributions from ! production via s-channel resonances are
expected to be most enhanced.
This behavior has been con�rmed by the decay angular distribution (in the helicity
frame of the ! meson). The angular distributions in Fig. 13 show a more cos2 �hel-like
behavior at lower energies; at higher photon energy (E > 1:8 GeV), however, the decay
angular distribution becomes more di�ractionlike. In case of s-channel helicity conservation
(SCHC) the angular distribution is expected to be proportional to sin2 �hel, and at in �hel.
The distributions shown in Fig. 13 (bottom) at c.m. energies around 1.85 to 1.95 GeV,
in the mid-t range, re ect a cos2-like behavior of the decay polar angle �hel, indicating
contributions from spin ip amplitudes; departures from a at �hel distribution signal the
presence of nonzero matrix elements �011;Re�010, and further indicate interferences in the
22
spin ip and non-spin ip amplitudes.
By extrapolating to t = 0 and integrating over the full t range, one can obtain the
total cross section (cf. Fig. 14). The steep increase at the ! photoproduction threshold
(E = 1:1 GeV) cannot be explained within the framework of the model of Friman and
Soyeur or from vector meson dominance alone. The almost at di�erential cross section
near threshold and the non-SCHC decay angular distribution in this energy range as well as
the steep increase of the total cross section from threshold strongly hint towards the presence
of underlying baryon resonances. Such a resonance atps � 1:78 GeV has been observed in
the reaction �+p! �+�+���0p [22].
1
10
0 0.25 0.5 0.75 1-t [GeV2/c2]
dσω /d
t [µ
b/(G
eV/c
)2 ]
1
10
0 0.25 0.5 0.75 1
Constant 3.199
Slope -4.286
-t [GeV2/c2]
1
10
0 0.25 0.5 0.75 1
Constant 3.613
Slope -5.814
-t [GeV2/c2]
dσω /d
t [µ
b/(G
eV/c
)2 ]
1
10
0 0.25 0.5 0.75 1
Constant 3.217
Slope -6.209
-t [GeV2/c2]
Figure 12: Di�erential cross section p! !p! �+���0p. SAPHIR data in com-
parison with predictions of the model of Friman and Soyeur (curve) and exponential
�t to SAPHIR data (exponential line).
23

050
100150200250300350400450500
-1 0 1cosθ (hel.)
entr
ies
(acc
ept.
corr
ecte
d)
0
50
100
150
200
250
300
-1 0 1cosθ (hel.)
0
50
100
150
200
250
-1 0 1cosθ (hel.)
entr
ies
(acc
ept.
corr
ecte
d)
0
50
100
150
200
-2.5 0 2.5φ (hel.)
Figure 13: Decay distribution of ! in selected ranges of E and t. The curves
correspond to �ts to the decay angular distribution W 0(cos �hel; �hel) as is de�ned
in equ. (2).
0
2
4
6
8
10
12
1 1.5 2 2.5 3 3.5Eγ [GeV]
σ ω [
µb]
SAPHIR (1993-94)LAMP2 (1979)AHHM (1976)Ballam (1973)ABBHHM (1968)CEA (1967)
Figure 14: Total cross section for p! !p! �+���0p at low photon energies.
24

4 Acceptance Studies
In this section we �rst discuss our acceptance studies for the ! channel. We will then show
the results of these !-extraction techniques that we have applied to the g1 photoproduction
data set; these data were collected in the summer of 1998.
4.1 Identi�cation of the Omega Meson Signal
Here we report our acceptance studies, summarizing the main results and the techniques
that we have developed in distinguishing the reaction p! p! from either the two-pion or
three-pion backgrounds.
The event generators are based upon those described in [21], [24], and [23]. They were
used to realistically distribute the ! signal and three-pion backgound events. Using the sim-
ulation program mentioned in Section 3.2, we studied the decay angular distributions with
regard to the sensitivity for variations of the spin density matrices. We made use of the sim-
ulation package FastMC gen [25], which renders a reasonably realistic representation of
the geometry and mass distribution of the conceptual design of the CLAS detector including
detector e�ciencies. We also employed the CLAS simulation and reconstruction program
SDA [26]. We incorporated track �nding and �tting algorithms which require track elements
in only two of the three drift chambers. After distributing the decay products from our !
event generator and processing the events through the simulation programs, we then ex-
tracted the density matrix elements by means of a maximum-likelihood �t using the CERN
package Minuit [27].
The primary di�culty in identifying the photoproduced !p channel is in e�ciently sep-
arating !-meson from non-!-meson events without unduly sacri�cing the acceptance. In
a �rst approach, the events were generated uniformly in phase space. The daughter pi-
ons created from the decay of the parent vector meson, too, were uniformly distributed in
the phase space of the rest frame of the omega meson. The �nal-state particles were then
Lorentz boosted to the laboratory frame, and subsequently were fed into the CLAS sim-
ulation program FastMC gen. We initially generated 50,000 !p events and background
(p�+���0; p�+��) studies at thirteen di�erent incident photon energies between E =1.125
and 2.2 GeV, and two �eld settings for the CLAS torus magnet, B=B� = +0:5 and +1:0. We
25
found that the cuts e�ectively eliminated �� background events. We have focused on the
! ! �+���� decay mode, requiring that we identify the two positively charged �nal-state
particles, �+ and proton, and thereby obtain the complete four-momentum information.
Both the proton and the �+ must have registered hits in all three drift chambers and have
deposited energy in a ToF scintillator. On the other hand, we require that the �� have hits
in the inner two drift chambers. From this selection criterion, we only obtain momentum
and charge information but cannot identify the particle. We associate this track to a �� and
thereby obtain its energy from the relationship E2 = p2 +m2�� . We now have the complete
four-momentum of the three charged �nal-state particles and the energy of the incident pho-
ton, which we have smeared with a uniform �E of �0:1% consistent with the resolution of
the bremsstrahlung tagger. From the calculated missing mass of the simulated events, we
identify a �0 as that particle with a mass in the range of 0:09 � mx � 0:20 GeV/c2. This cut
e�ectively eliminates two-pion channel events, i.e. p! p��, p! ��, or p! (p�+��)p:s:.
In Fig. 15 we plot the reconstructed mass of the �0 for various incident photon energies for
the omega signal channel p( ; p�+��)�0. Clearly, this �0 cut by itself cannot eliminate the
p�+���0 background events.
26

Figure 15: The missing mass distributions for various incident photon energies are
plotted for B=B� = +0:50. The missing mass is obtained from the smeared tagged
photon, the particle-identi�ed proton and �+, and the momentum-determined ��.
Those events with masses in the range of 0:09 � mx � 0:20 GeV/c2 are considered
to have a �0 in the �nal state.
27

Because the mass peak of the ! meson is so sharp, a cut on the invariant mass of the three
�nal-state pions alone will serve to extract this vector meson signal if the �+���0 background
is minimal. In Fig. 16, we show the raw acceptance of the phase space distributed signal
and background events. For the mid-t kinematic regime, where the signal for s-channel
resonances are most pronounced, we presume the N� di�erential cross section is at. Only
for low t does one observe an exponential fallo� in the di�erential cross section for the
VMD-produced omega mesons. We have also distributed the background �+���0 events
uniformly in phase space. We see in Fig. 16 that the acceptance for background events in
the three-pion invariant mass range 0:75 � m�+���0 � 0:81 GeV decreases with increasing
photon energy due to the fact that the phase space covers a larger kinematical range at
higher energies.
Figure 16: The overall acceptance is plotted as a function of the incident photon
energy for B = +0:50B� for (solid line) p! p! and (dashed line) p! p�+���0.
Only a simple invariant-mass cut of 0:75 � m�+���0 � 0:81 GeV was employed to
identify the omega meson.
28
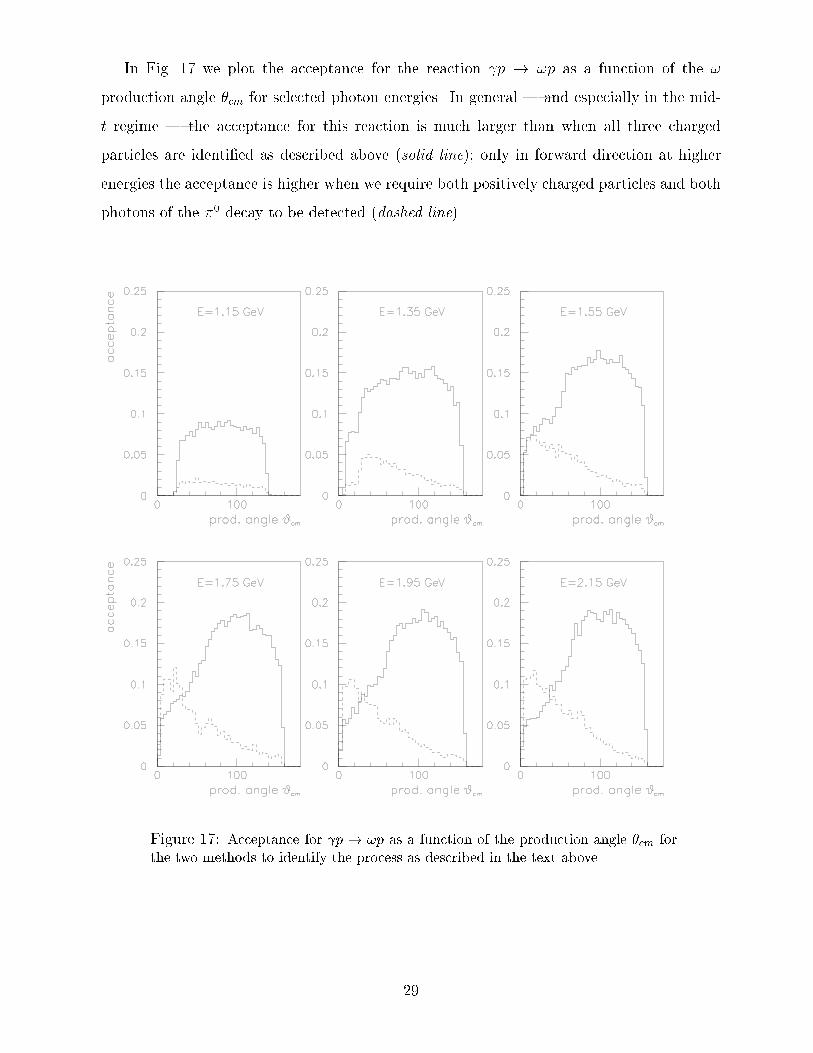
In Fig. 17 we plot the acceptance for the reaction p ! !p as a function of the !
production angle �cm for selected photon energies. In general | and especially in the mid-
t regime | the acceptance for this reaction is much larger than when all three charged
particles are identi�ed as described above (solid line); only in forward direction at higher
energies the acceptance is higher when we require both positively charged particles and both
photons of the �0 decay to be detected (dashed line).
Figure 17: Acceptance for p ! !p as a function of the production angle �cm for
the two methods to identify the process as described in the text above.
29

The ! signal itself is extracted in the three-pion e�ective mass distribution by �tting
to the background. We have studied the e�ects of varying the ratio of the ! signal to the
�+���0 background as a function of incident photon energy. We generated 100,000 of these
combined phase-space distributed signal and background events for jtj > 0:3 (GeV/c)2, and
processed them through FastMC gen. We plot some of the results in Figs. 18 and 19. In
this mid-t range, one sees that the omega peak remains prominent even for E = 1:2 GeV
with the signal being only 5% of the total cross section. We �t the background with a
polynomial function. From this �t, we can extract the omega signal from the three-pion
background on a bin-by-bin basis. We then �t this extracted signal with a gaussian, and
�nd that the centroid and the width of the peak is consistent with the expected values of the
omega meson, with the CLAS detector smearing folded in, as is shown in Figs. 20 and 21.
In summary, the omega channel is exceptionally clean. We have found that our accep-
tances are quite at as a function of magnetic �eld strength above B = +0:50B�.
30

Figure 18: The invariant mass of the !-signal, superimposed upon the �+���0-
background events, is plotted for two incident photon energies and two signal-to-
background ratios. The background is �t with a polynomial function.
31
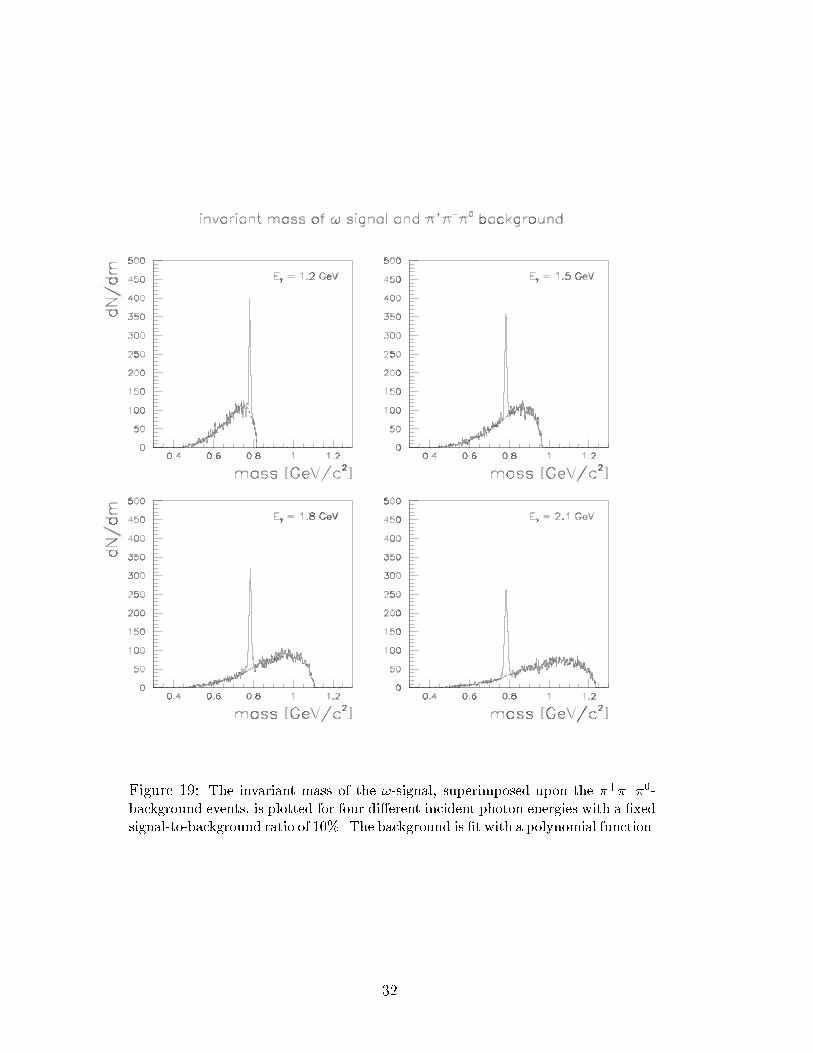
Figure 19: The invariant mass of the !-signal, superimposed upon the �+���0-
background events, is plotted for four di�erent incident photon energies with a �xed
signal-to-background ratio of 10%. The background is �t with a polynomial function.
32
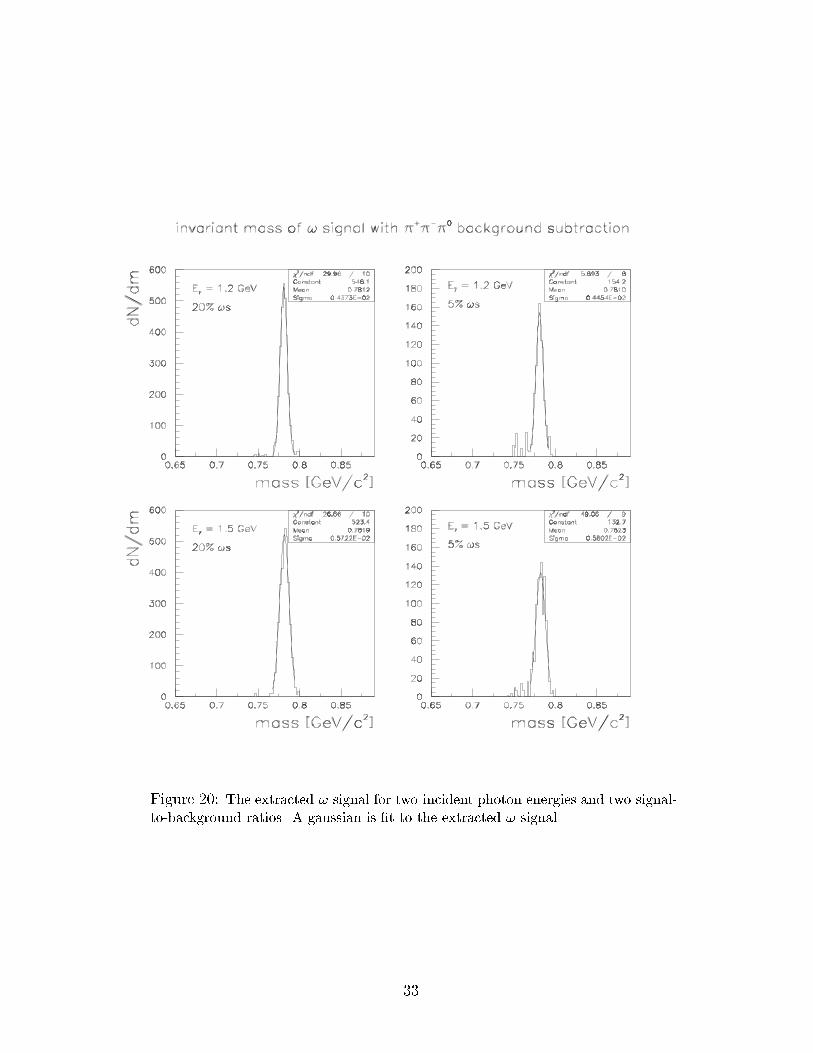
Figure 20: The extracted ! signal for two incident photon energies and two signal-
to-background ratios. A gaussian is �t to the extracted ! signal.
33

Figure 21: The extracted ! signal for four incident photon energies and a �xed
signal-to-background ratio of 10%. A gaussian is �t to the extract ! signal.
34

4.2
Firstanalysis
of!photoproductio
ndata
atCLAS
Wehavebegunanalyzin
gtheg1photoproductio
ndata
taken
inJune'98,where
wehave
applied
theaforem
entio
ned
!-selectio
ncriteria
.Desp
itetheprelim
inary
state
ofboth
the
detecto
rcalibratio
nsandtheaccep
tance/
e�cien
cystu
dies,
wecanextra
ctthe!
signal
quite
well.
Fig.23show
ssomeprelim
inary
results
fortheW
rangebetw
een1.9and2.1GeV
obtained
from
theanalysis
ofabout7%
ofthedata
set. 2
ced[fklein] Wed Dec 9 22:17:55 1998 Run_11910_Event_100495.ps
1
2 3
4
56
Figure22:Completely
detected
p�+���0eventfro
mtheg1
photoproductio
ndata
run.
2Here
weonlyshowmassdistrib
utio
ns.Assoonasthenorm
aliza
tionande�
ciency
questio
nsare
settled,
prelim
inary
crosssectio
ndata
canbepresen
ted.
35

0
10000
20000
30000
40000
50000
60000
70000
80000
0 0.1 0.2 0.3 0.4 0.5 0.6 0.7
Entries 761659
Miss.Mass pπ+π- [GeV]
entr
ies
Figure 23: Missing mass distribution for the reconstructed p�+�� (top) and ex-
traction of the ! signal (bottom) in the W range between 1.9 and 2.1 GeV (subset
of g1 data at E0 = 2:487 GeV).
36

We shall also analyze the triple-pion data taken during the second part of g1 (August '98).
In fact, one of the cospokespersons of this proposed experiment has assigned his graduate
student to pursue these studies for his Ph.D. thesis topic. This data set was produced with
circularly polarized photons on hydrogen. The polarization is given approximately by
Pcirc = Pel(4x� x2)=(4� 4x+ 3x2) with x = k =Eel:
With an obtained electron polarization of 67%, the photon circular polarization is about 67%
at the bremsstrahlung endpoint and about 36% at k =Eel = 0:5. Extracting the ! decay
angular distributions for these data sets, W 0(cos �; �) and W 3(cos �; �), provide additional
constraints for our �nal analysis.
Figure 24: Extraction of the ! if only one proton, a �+ and one photon are identi�ed
(e1 data at E0 = 4:045 GeV for W=2.1 to 2.3 GeV, Q2=1.0 to 1.5 GeV2).
The ! channel can as well be identi�ed by detecting both positively charged particles
(p; �+), together with one of the photons from the �0 decay. Even though the background is
much larger, the ! meson signal can clearly be identi�ed as is shown in Fig. 24 where semi-
inclusive data p(e; e0p�+ )X of the e1 run period for speci�c W and Q2 ranges are shown.
The ! peak towers over the background in the missing mass distribution MM(p(e; e0p)X).
However, in order to extract the decay angular distribution, and thereby the density matrix
elements, it is not su�cient to identify one of the charged pions together with one of the
37

photons from the �0 decay: one has to identify at least two pions of the ! decay.3
4.3 Extraction of the Density Matrix Elements
Employing our simulation programs, we distributed the generated events of the p ! !p
reaction in accordance with the angular distributions, which we calculated for various pro-
duction processes. The polarization vector of the incident photon was held constant. For the
case when all three �nal-state charged particles were accepted, we cut on the missing �0 mass
and plotted the e�ective three-pion mass distribution versus the decay angles �hel and �hel in
the helicity frame. We identi�ed the ! by �tting on the mass distributionM��� within each
bin of �hel and �hel. The nine coe�cients of the density matrices are then extracted via a
maximum-likelihood �t, similar to the approach used in our approved experiment [24], where
we extracted the density matrix elements for the decay kaons in �-meson photoproduction.
As an example the results for one of the matrix elements and the parity asymmetry
which is calculated via equ. (7) are shown in Fig. 25. We generated the events assuming
one-pion exchange as production process.
3As shown in Fig. 2, the decay angles �; � are de�ned with respect to the normal to the decay plane.
38
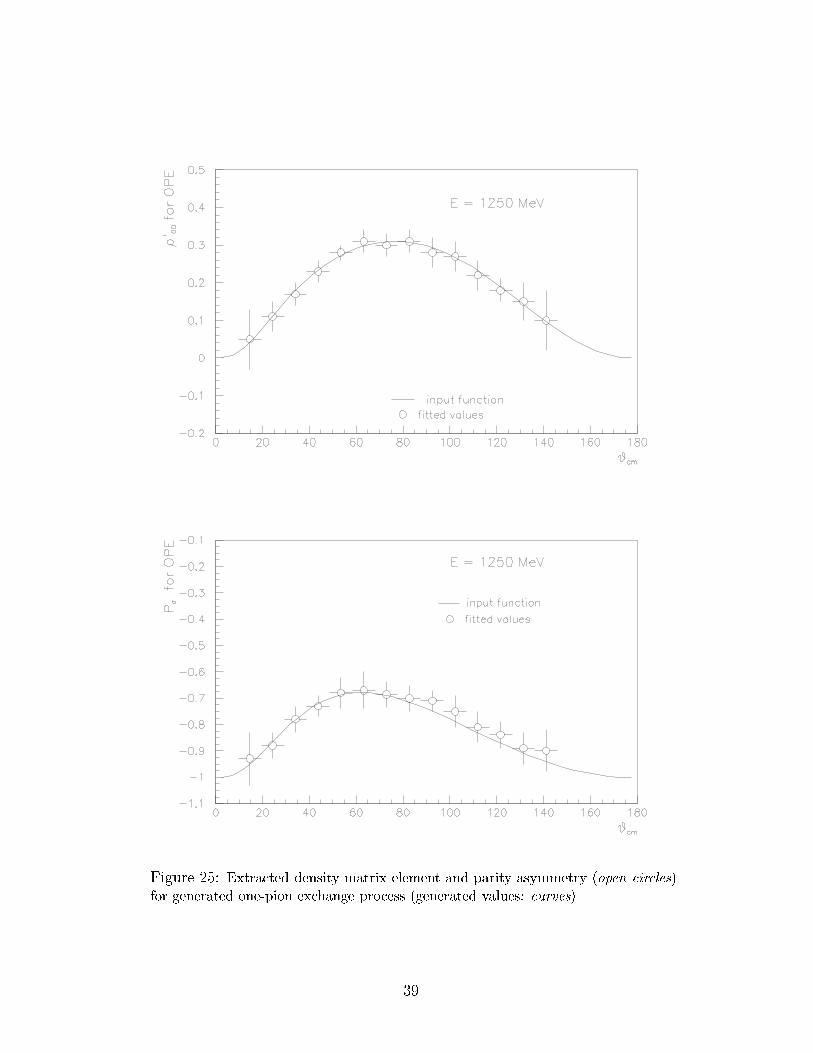
Figure 25: Extracted density matrix element and parity asymmetry (open circles)
for generated one-pion exchange process (generated values: curves).
39

5 Experimental Parameters
5.1 Linearly Polarized Photons
We propose to use a linearly polarized beam of photons produced from the recently approved
Coherent Bremsstrahlung Facility. This technique of obtaining linearly polarized photons
has successfully been employed at both SLAC [29] and Mainz [30]. Detailed discussions of
the underlying theory of coherent bremsstrahlung can be found in references [31], [32], [33],
and [34].
The spectrum of a photon beam produced coherently from a crystal radiator has several
distinguishing characteristics compared with that of incoherent bremsstrahlung. The salient
features of coherent bremsstrahlung are:
1. An energy spectrum with discrete peaks due to the varying contributions of
di�erent reciprocal lattice vectors
2. A strong linear polarization within each of the peaks
3. A polar angle distribution which is correlated with the energy of the photon
4. Tunable peak energies by crystal choice and orientation
5. The direction of the polarization can be quickly and smoothly changed by
rotating the crystal radiator
We shall discuss each of these above points in turn.
For an electron of energy E� to radiate a photon of energy k requires that momentum ~q
be transferred to a nucleus in the crystal lattice. The allowable range of momenta transfers
are con�ned to the volume of a pancakelike region in momentum space, where the pancake
conditions are given by
� � q` � 2� (13)
0 � q? � 2x (14)
where x is the fractional photon energy, k=E�, and
� = qmin` =
1
2E�
x
1� x: (15)
40

We will use the natural units (�h = c = me = 1) unless speci�cally marked otherwise. The
in uence of the crystal structure is given by the Laue condition
~q = ~g: (16)
Here ~g is the reciprocal lattice vector. Several reciprocal lattice vectors can contribute
simultaneously if the orientation of the crystal with respect to the direction of the incident
electron beam is not carefully selected. This leads to overlapping peaks which will smear
out the direction of the polarization. For the following discussion we will assume we have
selected the well isolated reciprocal lattice vector with the Miller indices of (022), which gives
j~g j = 2�a
p22 + 22, and where a is the length of the fundamental cell. For the case of diamond,
a = 925 in dimensionless units. The corresponding momentum transfer to the lattice nucleus
is then j~q j = 9:85 keV/c for (022). Selecting a speci�c q` in the range between � and 2�
with respect to the electron momentum produces coherent-bremsstrahlung photons of the
corresponding fractional energy x. Maximum linear polarization is found in the plane de�ned
by the reciprocal lattice vector and the 3-momentum of the incident electron, i.e. (~g; ~p�).
The angular distribution of the coherent and incoherent bremsstrahlung photons are very
di�erent. Whereas the polar angular distribution of the incoherent bremsstrahlung photons
is independent of the photon energy
dN(�)
d�=
�
(1 + �2)2; (17)
the emission angle of the coherent bremsstrahlung photons decreases with increasing photon
energy (x � xd)
�2 =1� x
x2E�q` � 1 =
1� x
x� xd
1� xd� 1: (18)
Here xd is the maximum fractional photon energy for a given setting of the crystal
xd =2E�q`
1 + 2E�q`; (19)
and the �s are given in units of characteristic angle, i.e.
�char =mec
2
E�
: (20)
For example, for E� = 4:0 GeV, �char ' 1=8 mrad.
We have developed a Monte Carlo which samples the probability density bremsstrahlung
spectrum as a function of fractional energy x, and polar angle �. The incoherent and coherent
41

Figure 26: Overlay of the normalized polar angle distributions for coherent (solid)
and incoherent (dashed).
bremsstrahlung intensities as functions of x and � are combined into one probability density
function, which is based upon the derivations in ref. [34]. We have not yet incorporated
the e�ects of multiple scattering, crystal mosaic spread, nor incident electron beam diver-
gence. We assume that the crystal radiator is a thin wafer of diamond, and that only the
reciprocal lattice vector (022) contributes to the coherent bremsstrahlung spectrum. For a
given x (x � xd) and �, then, the ratio of the intensities of the uncollimated coherent and
incoherent bremsstrahlung photons is quanti�ed by the Debye temperature of diamond. Be-
cause of its relatively high Debye temperature, diamond is the preferred crystal for coherent
bremsstrahlung production.
In Fig. 26 we overlay the incoherent and coherent polar angle distributions (dN=d� vs �).
One sees a clearly delineated band in the scatter plot of the total photon counts (coherent
+ incoherent) as a function of characteristic angle and fractional photon energy (Fig. 27).
We then collimate the beam to reduce the incoherent background, which further serves to
increase the degree of polarization (see Ref. [35]). The maximum polar angle is limited by the
opening angle of the collimator �coll, which gives a lower limit for coherent bremsstrahlung
42
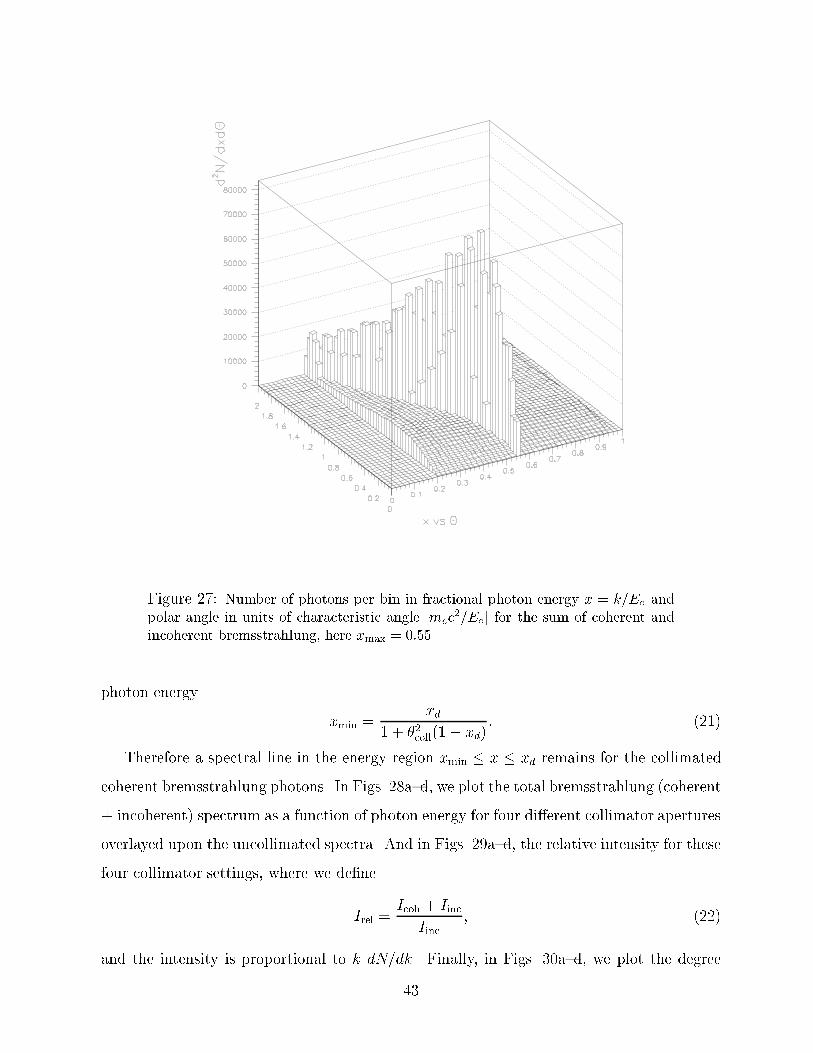
Figure 27: Number of photons per bin in fractional photon energy x = k=E� and
polar angle in units of characteristic angle [mec2=E�] for the sum of coherent and
incoherent bremsstrahlung, here xmax = 0:55.
photon energy
xmin =xd
1 + �2coll(1� xd): (21)
Therefore a spectral line in the energy region xmin � x � xd remains for the collimated
coherent bremsstrahlung photons. In Figs. 28a{d, we plot the total bremsstrahlung (coherent
+ incoherent) spectrum as a function of photon energy for four di�erent collimator apertures
overlayed upon the uncollimated spectra. And in Figs. 29a{d, the relative intensity for these
four collimator settings, where we de�ne
Irel =Icoh + Iinc
Iinc; (22)
and the intensity is proportional to k dN=dk. Finally, in Figs. 30a{d, we plot the degree
43

Figure 28: Superimposed coherent (dashed) and incoherent (solid) dN=dE vs E
bremsstrahlung distributions under various collimator opening angles.
of linear polarization as a function of x under four collimator settings for E� = 4:0 GeV. If
we collimate the photon beam to �coll = �char=2 (�char), we will obtain average polarizations
of 70% (65%) for 1:98 � x � 2:2 GeV (1:85 � x � 2:20 GeV). Tightly collimating the
beam to 0.125 mrad should be reasonably straightforward, since SLAC was able to survey
a collimator of diameter 2 mm at 91 m (�coll = 11 �rad) [36].
44
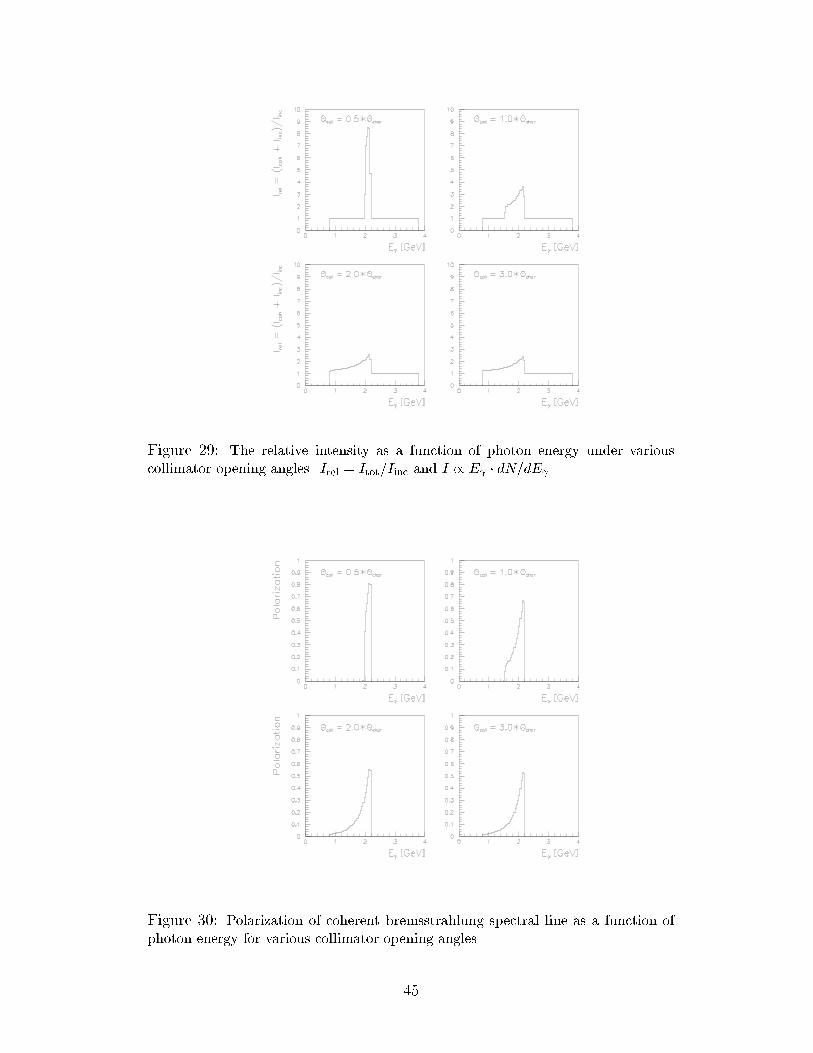
Figure 29: The relative intensity as a function of photon energy under various
collimator opening angles. Irel = Itot=Iinc and I / E � dN=dE .
Figure 30: Polarization of coherent bremsstrahlung spectral line as a function of
photon energy for various collimator opening angles.
45

5.2 Tagger Accidentals
We have performed a study to determine the usable tagging rate with a coherent brems-
strahlung photon beam. We de�ne an accidental as any charged particle that registers a
hit in a TOF counter that occurs within 10 nsec of the p ! !p event. We have studied
beam collimations of a characteristic angle with the coherent peak set at a maximum of
E = 2:20 GeV for an incident electron beam energy of 4.0 GeV. We assume the LH2 target
to be of length 14 cm. We performed the study under varying the following conditions:
� The overall CLAS acceptance (from 60 to 80%) for any + p event.
� The minimum 3-momentum required for a �nal-state proton or pion to pass through
all three drift chamber regions and register a hit in a TOF counter. We assume that
the reaction p ! p�� is twice as likely to occur as the p ! n�+ channel. The
�nal-state particles were distributed uniformly in c.m. phase space by the CERNLIB
routine GENBOD [27]. We then determined the likelihood that the momentum of the
particle exceeded the cuto� value. We expect the momentum cuto� values to vary
as a function of angle in the CLAS. Below are our ranges in cuto� momenta of the
�nal-state proton and pion.
{ j~pprotj � 0:20 GeV/c and j~p�j � 0:15 GeV/c.
{ j~pprotj � 0:20 GeV/c and j~p�j � 0:20 GeV/c.
{ j~pprotj � 0:30 GeV/c and j~p�j � 0:15 GeV/c.
{ j~pprotj � 0:30 GeV/c and j~p�j � 0:20 GeV/c.
� The number of recorded triggers per second in the CLAS. We assume that the lifetime
of the data acquisition system is on the order of 98%, hence the data acquisition rate
(DAQ rate) is roughly identical to the trigger rate.
In Fig. 31 we plot the number of tagged photons striking the target after tight collimation
as a function of CLAS acceptance for trigger rates between 0.5 and 1.5 kHz. We see that for
an overall CLAS acceptance of 80% and trigger rate of 1 kHz, the number of tagged photons
per second incident on the target is 4:23 � 106 Hz. This corresponds to a tagging rate of
2:04� 107 Hz. In Figs. 32a{c we plot the percentage of accidentals per 10 nsec coincidence
46
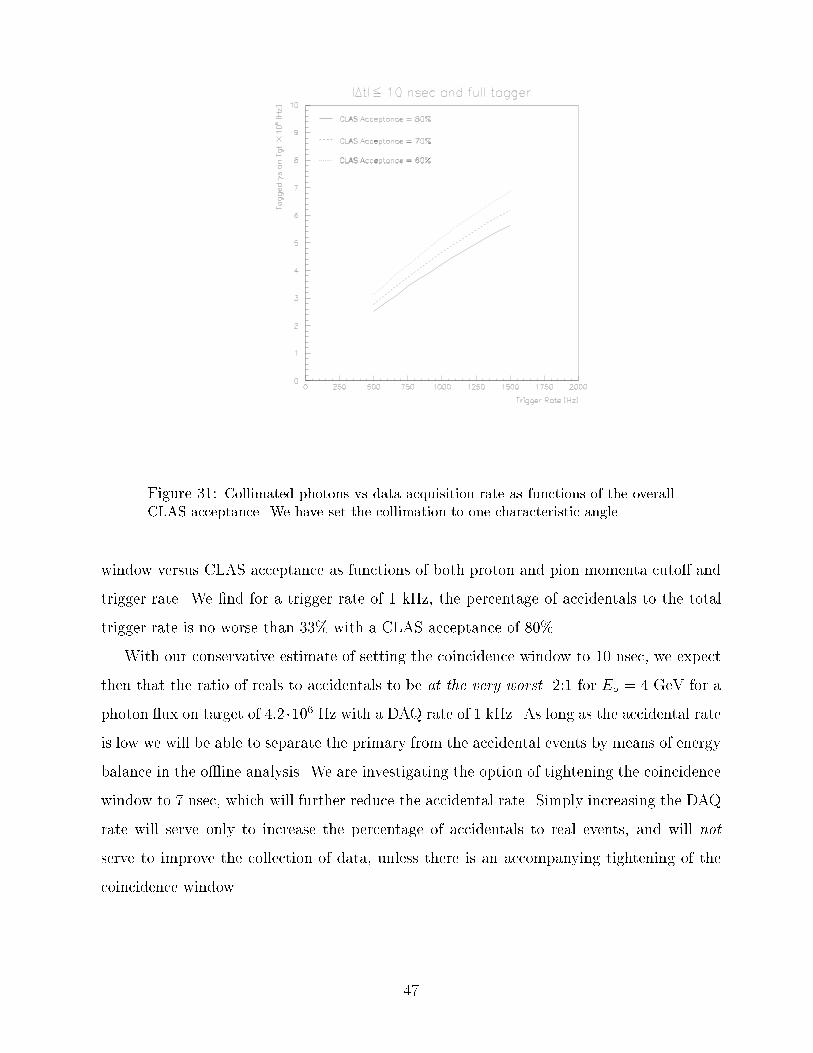
Figure 31: Collimated photons vs data acquisition rate as functions of the overall
CLAS acceptance. We have set the collimation to one characteristic angle.
window versus CLAS acceptance as functions of both proton and pion momenta cuto� and
trigger rate. We �nd for a trigger rate of 1 kHz, the percentage of accidentals to the total
trigger rate is no worse than 33% with a CLAS acceptance of 80%.
With our conservative estimate of setting the coincidence window to 10 nsec, we expect
then that the ratio of reals to accidentals to be at the very worst 2:1 for E� = 4 GeV for a
photon ux on target of 4:2 �106 Hz with a DAQ rate of 1 kHz. As long as the accidental rate
is low we will be able to separate the primary from the accidental events by means of energy
balance in the o�ine analysis. We are investigating the option of tightening the coincidence
window to 7 nsec, which will further reduce the accidental rate. Simply increasing the DAQ
rate will serve only to increase the percentage of accidentals to real events, and will not
serve to improve the collection of data, unless there is an accompanying tightening of the
coincidence window.
47
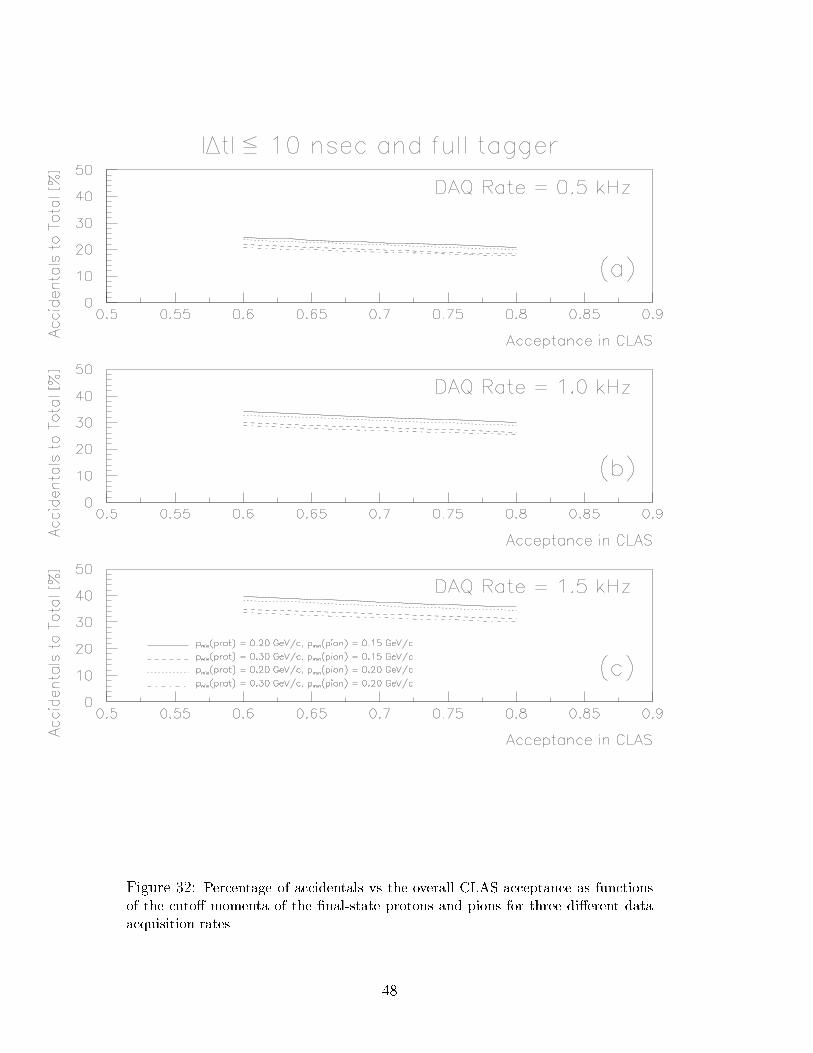
Figure 32: Percentage of accidentals vs the overall CLAS acceptance as functions
of the cuto� momenta of the �nal-state protons and pions for three di�erent data
acquisition rates.
48
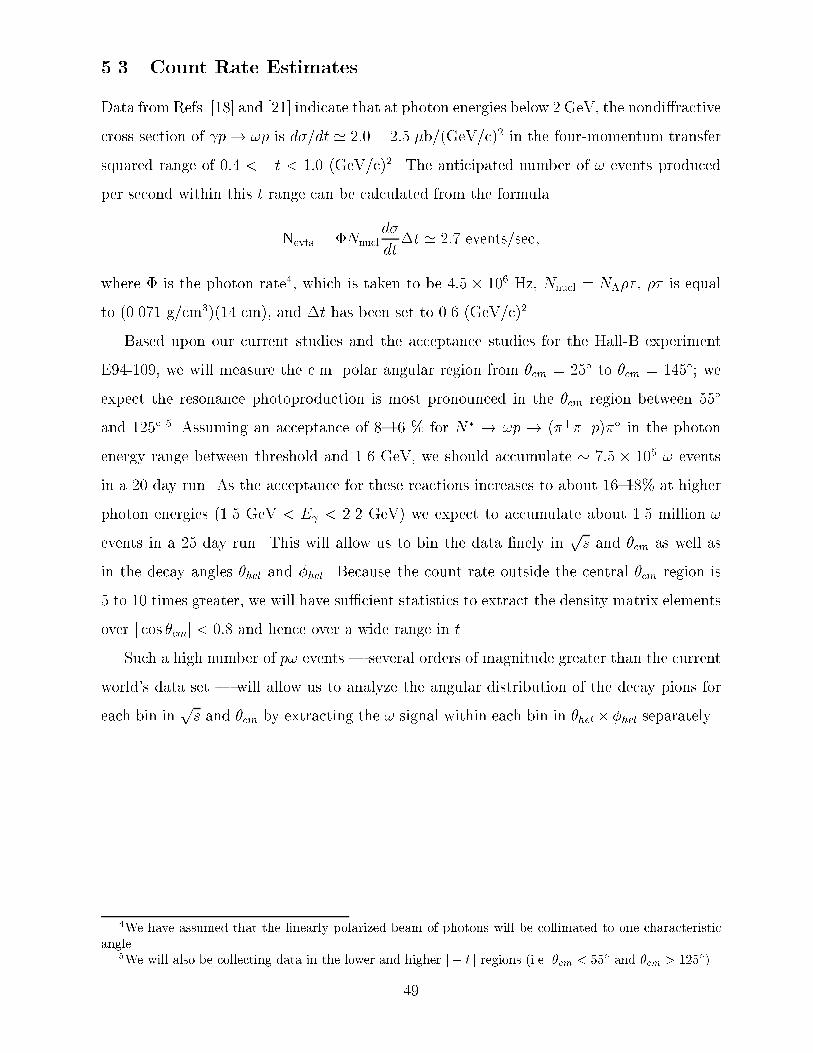
5.3 Count Rate Estimates
Data from Refs. [18] and [21] indicate that at photon energies below 2 GeV, the nondi�ractive
cross section of p! !p is d�=dt ' 2:0� 2:5 �b/(GeV/c)2 in the four-momentum transfer
squared range of 0:4 < �t < 1:0 (GeV/c)2. The anticipated number of ! events produced
per second within this t range can be calculated from the formula
Nevts = �Nnucl
d�
dt�t ' 2:7 events=sec;
where � is the photon rate4, which is taken to be 4:5� 106 Hz, Nnucl = NA�� , �� is equal
to (0.071 g/cm3)(14 cm), and �t has been set to 0.6 (GeV/c)2.
Based upon our current studies and the acceptance studies for the Hall-B experiment
E94-109, we will measure the c.m. polar angular region from �cm = 25� to �cm = 145�; we
expect the resonance photoproduction is most pronounced in the �cm region between 55�
and 125�.5 Assuming an acceptance of 8{16 % for N� ! !p ! (�+��p)�� in the photon
energy range between threshold and 1.6 GeV, we should accumulate � 7:5 � 105 ! events
in a 20 day run. As the acceptance for these reactions increases to about 16{18% at higher
photon energies (1.5 GeV < E < 2.2 GeV) we expect to accumulate about 1.5 million !
events in a 25 day run. This will allow us to bin the data �nely inps and �cm as well as
in the decay angles �hel and �hel. Because the count rate outside the central �cm region is
5 to 10 times greater, we will have su�cient statistics to extract the density matrix elements
over j cos �cmj < 0:8 and hence over a wide range in t.
Such a high number of p! events | several orders of magnitude greater than the current
world's data set | will allow us to analyze the angular distribution of the decay pions for
each bin inps and �cm by extracting the ! signal within each bin in �hel� �hel separately.
4We have assumed that the linearly polarized beam of photons will be collimated to one characteristic
angle.5We will also be collecting data in the lower and higher j � t j regions (i.e. �cm < 55� and �cm > 125�).
49

5.4 Beamtime Request
This experiment has a natural link to experiments E94-109 [23] (Photoproduction of �Mesons
from the Proton with Linearly Polarized Photons) and E98-109 [24] (Photoproduction of
� Mesons with Linearly Polarized Photons). Our proposed experiment will be using CLAS
with the associated coherent bremsstrahlung facility and the same energy settings as the
two already approved experiments. We will work closely with these collaborations, sharing
the approved beam times of 11 days at 4 GeV electron energy and 22 days at 6 GeV beam
energy. In order to perform an accurate analysis of N� ! !p in the c.m. energy range
between 1.73 GeV and 2.24 GeV, we request an additional 400 hours of beamtime:
� 250 hours at 4 GeV electron beam energy to extract the density matrix elements at
photon energies below 1.6 GeV;
� 150 hours at 6 GeV electron beam energy for the extraction of resonance contributions
at photon energies above 1.5 GeV.
There will be 100 MeV overlap between these two data runs to provide for the cross checking
of the systematics.
Below we list the experimental parameters.
�: the photon ux (4:5 � 106 /sec)
P : photon beam polarization: at least 60%
�LH2 = 0.071 g/cm2: density of liquid hydrogen
` = 14 cm: length of the Saclay cryo-target
B=B�: +0:5 (positively charged particles bending outwards)
50

References
[1] Atkinson et al., Nucl. Phys. B 231, 15 (1984).
[2] J. Ballam et al., Phys. Rev. D 7, 3150 (1973).
[3] B. Fraas, Nucl. Phys. B 36, 191 (1972).
[4] B. Friman and M. Soyeur, LNS/Ph/95-16, CNRS 1995.
[5] D.B. Lichtenberg, Phys. Rev. 178, 2197 (1969);
R.E. Cutkosky and R.E. Hendrick, Phys. Rev. D 16, 2902 (1977).
[6] R. Koniuk and N. Isgur, Phys. Rev. D 21, 1868 (1980);
N. Isgur and G. Karl, Phys. Lett. 72B, 109 (1977).
[7] S. Capstick and N. Isgur, Phys. Rev. D 34, 2809 (1986).
[8] S. Capstick and W. Roberts, Phys. Rev. D 47, 1994 (1993).
[9] Particle Data Group, EPJ C 3, 623 (1998).
[10] C.P. Forsythe and R.E. Cutkosky, Z. Phys. C 18, 219 (1983).
[11] H. Funsten et al., E91-024; Also refer to: V.D. Burkert, \Electromagnetic Excitation of Nucleon
Resonances," CEBAF-PR-94-005, the relevant list of approved N� experiments is contained in Table 1
of this reference.
[12] K. Schilling, P. Seyboth, and G. Wolf, Nucl. Phys. B 15, 397 (1970);
D. Schildknecht and B. Schrempp-Otto, Nuovo Cim. 5A, 103 (1971).
[13] J.-M. Laget, \What can we learn from experiments with 10 GeV photons," DAPNIA/SPhN 98 54;
J.-M. Laget and R. Mendez-Galain, Nucl. Phys. A 581, 397 (1995).
[14] M. Pichowsky, C. Savkli, and F. Tabakin, Phys. Rev. C 53, 593 (1996); C. Savkli, F. Tabakin, and
S.N. Yang, Phys. Rev. C 53, 1132 (1996); W.M. Kloet, W.T. Chiang, and F. Tabakin, Eprint nucl-
th/9803042 (1998).
[15] Q. Zhao, Z.P. Li, and C. Bennhold, Phys. Rev. C 58, 2393 (1998);
Q. Zhao, Z.P. Li, and C. Bennhold, Phys. Lett. B 436, 42 (1998).
[16] S. Capstick and W. Roberts, Phys. Rev. D 49, 4570 (1994); W. Roberts, Report to the GRAAL Group
on Photoproduction of Baryon Resonances Using Polarized Photons (1994), unpublished.
[17] R.L. Anderson et al., Phys. Rev. D, 679 (1976).
[18] Aachen-Berlin-Bonn-Hamburg-Heidelberg-M�unchen Collaboration, Phys. Rev. 175, 1669 (1968).
[19] CEA-Bubble-Chamber-Group, Phys. Rev. 146, 994 (1966).
[20] Y. Eisenberg et al., Phys. Rev. Lett. 22, 669 (1969).
[21] F.J. Klein, Ph.D. thesis, Bonn-IR-96-008 (1996);
F.J. Klein, \Overview over Vector Meson Photoproduction," �N Newsletters, No. 14, 141 (1998).
[22] L.Y. Brovkin et al., Phys. At. Nucl. 56, 762 (1993).
[23] P.L. Cole, J.P. Connelly, R.R. Whitney, spokespersons, \Photoproduction of �Mesons from the Proton
with Linearly Polarized Photons," Je�erson Lab E94-109.
51

[24] P.L. Cole, J.A. Mueller, D.J. Tedeschi, spokespersons, \Photoproduction of � Mesons with Linearly
Polarized Photons," Je�erson Lab E98-109.
[25] E.S. Smith, \FAST Monte Carlo for the CLAS Detector," CLAS-Note 90-003;
P.L. Cole, \A Generalized FastMC for the CLAS," CLAS-Note 93-006.
[26] \Standard Data Analysis" by B. Niczyporuk.
[27] CERN program library, CERNLIB 96A.
[28] D.I. Sober, private communication.
[29] W. Kaune et al., Phys. Rev. D11, 478 (1975).
[30] D. Lohman et al., Nucl. Instr. Meth. A 343, (1994); J. Peise, M.S. Thesis, Universit�at Mainz (1989);
D. Lohman, M.S. Thesis, Universit�at Mainz (1992); F. Rambo, M.S. Thesis, Universit�at G�ottingen
(1995); A. Schmidt, M.S. Thesis, Universit�at Mainz (1995).
[31] F.H. Dyson and H. �Uberall, Phys. Rev. 99, 604 (1955);
H. �Uberall, Phys. Rev. 103, 1055 (1956).
[32] H. �Uberall, Phys. Rev. 107, 223 (1957); H. �Uberall, Z. Naturforsch. 17a, 332 (1962).
[33] G. Diambrini-Palazzi, Rev. Modern Phys. 40, 611 (1968).
[34] U. Timm, Fortschr. Phys. 17, 765 (1969).
[35] R. Rambo et al., Phys. Rev. C 58, 489 (1998).
[36] C. Sinclair, private communication.
52


![Xing-xu 20110083 · 2023 G Street NW, Washington, DC 20052, USA; Qingwei Tan [firsttan@sina.com] and Lin Tan, Long Hao Institute of Geology and Paleontology, Hohhot, Inner Mongo−](https://static.fdocuments.in/doc/165x107/601b26d9939bc507032de21e/xing-xu-20110083-2023-g-street-nw-washington-dc-20052-usa-qingwei-tan-firsttansinacom.jpg)


![Osteology of the Late Cretaceous alvarezsauroid Linhenykus ... · 2023 G Street NW, Washington, DC 20052, USA; Qingwei Tan [firsttan@sina.com] and Lin Tan, Long Hao Institute of Geology](https://static.fdocuments.in/doc/165x107/601b259ff6417c39f87b54a8/osteology-of-the-late-cretaceous-alvarezsauroid-linhenykus-2023-g-street-nw.jpg)