Mobile Phone & Smartphone HPFT usage by Service Users and ...

Journalism and Mass Communication, May-June 2019, Vol. 9, No. 3, 101-122 doi: 10.17265/2160-6579/2019.03.001
Generation Z’s Smartphone and Social Media Usage: A Survey
Niaz Ahmed
Saint Cloud State University, Minnesota, USA
This study examined the smartphone and social media usage among Generation Z. A survey was completed by a
non-random sample of 415 students at State University of New York in Oneonta during the academic year
2017-2018. The results revealed that almost all Gen Zers (99%) own a smartphone, and 98% of them use their
smartphones to connect to the Internet most of the time. More than half of Gen Zers spend nine hours or more in a
typical day using their smartphones, and nearly half of them spend 3-8 hours per day on their smartphones. With
regard to the use of social media, more than half of Gen Zers accessed various social media several times a day,
while nearly 1 in 5 admitted accessing social media every hour of the day. As for the amount of time devoted to
social media, nearly one-third of the students admitted using social media for 7-10 hours per day, and slightly less
than one-third of the students spent 5-6 hours per day on social media. With regard to Generation Z’s perception of
their addiction to smartphone and social media, 4 in 5 students admitted that they were spending an excessive
amount of time on the Internet, and two-thirds believed that they were spending too much time on social media.
Furthermore, 7 in 10 students admitted that they were addicted to the Internet, and nearly two-thirds believed they
were addicted to social media. These findings may have significant implications for counseling and intervention for
parents, educators, and policy makers.
Keywords: social media addiction, smartphone addiction, Internet addiction
The advent of the smartphone and social media has significantly transformed our lives in terms of how we
communicate and entertain ourselves. In recent years, smartphone and social media usage has grown
exponentially among the general public and specifically within the Generation Z known as “Gen Z” or “Gen
Zers” (Statista, 2015). The Generation Z is the demographic cohort born during the mid-1990s to mid-2000s
(roughly 13-24 years of age today) and has followed the millennials or Generation Y (Seemiller & Grace, 2016;
Wood, 2013). Generation Z is the first cohort to have smartphones, social media, and other technologies readily
available at a young age. In terms of the size of Gen Z population, current estimate indicates that about
one-third of world’s 7.7 billion people are Gen Zers (Miller & Lu, 2018). Furthermore, Gen Z commands $44
billion in buying power in the consumer market (Hutchinson, 2018).
While the advantages of the smartphone and social media are recognized, constant and excessive use may
have negative consequences for the users such as addictive usage, increased stress, false sense of online
connections, reduced face-to-face interactions, diminishing interpersonal skills, problematic family relations,
and lower self-esteem (Hawi & Samaha, 2016; Smith & Monica, 2016; Nazir & Samaha, 2016; Andreassen &
Pallesen, 2014; Bian & Leung, 2014; Hong & Chiu, 2012).
Niaz Ahmed, Dr., Professor Emeritus, Saint Cloud State University, Minnesota, USA.
DAVID PUBLISHING
D

GENERATION Z’S SMARTPHONE AND SOCIAL MEDIA USAGE: A SURVEY
102
Although a significant amount of research has been done in the recent past about the use of smartphone
and social media among Generation X and Y, insufficient research exists about smartphone and social media
addiction among Generation Z. Since the digital world is changing rapidly every year, it is important to track its
usage and impacts on an ongoing basis for detecting any trends and correlations and for identifying significant
implications for counseling and intervention for parents, educators, and policy makers. The present study
attempts to contribute to the evolving knowledge by examining the implications of the addictive use of
smartphone and social media among Generation Z. It also explores important variables that remained
unexamined in past research.
Literature Review
Past studies have examined the extent and impact of smartphone and social media usage in the general
public as well as among the millennials. A survey (Lee, Sung, Song, Lee, Lee, Cho, Park, & Shin, 2016) of 490
adolescents found that 27% of them were in high risk of smartphone addiction, and showed significantly more
behavioral and emotional problems, lower self-esteem, and poor quality of communication with their parents. A
study by Nazir and Samaha in 2016 also revealed that addictive use of social media had a negative association
with self-esteem. Wu, Cheung, Ku, and Hung (2013) also found a correlation between daily usage of
smartphones and addictive symptoms towards social media. A study by Hong and Chiu (2012) revealed that
students who scored high on smartphone addiction showed more social extraversion, anxiety, and lower
self-esteem. An extensive review of literature by Kuss and Griffiths (2011) indicated that an excessive social
media use may lead to symptoms traditionally associated with substance-related addictions.
A 2014 study of 414 university students (Bian & Leung, 2014) identified five smartphone addiction
symptoms: disregard of harmful consequences, preoccupation, inability to control craving, productivity loss,
and feeling anxious and lost. The results showed that the higher one scored in loneliness, the higher the
likelihood one would be addicted to smartphone. A study of 1,000 Belgians by Wang, Ho, Chan, and Tse (2015)
found that compulsive users scored lower on emotional stability, conscientiousness, self-esteem, and higher on
loneliness and depressive feelings.
Several studies have found that many smartphone users developed addictions as a consequence of using
certain applications such as instant messaging, online gaming, and social networking through their mobile
phones (Lopez-Fernandez, Kuss, Griffiths, & Billieux, 2015; Billieux, Maurage, Lopez-Fernandez, Kuss, &
Griffiths, 2015; Kuss & Griffiths, 2012).
In terms of sociodemographic differences, past research revealed that among those addicted to social
media, females showed a higher prevalence of addictions and were more likely to experience anxiety and
depression symptoms as a negative consequence of social media use (Bragazzi & Del Puente, 2014; Caplan,
2003; Wang et al., 2015). In terms of age variation, past studies found that younger individuals were more
likely to develop addictive behavior with social media (Song, LaRose, Eastin, & Lin, 2004).
Methodology
A survey of college students was conducted to examine the smartphone and social media addiction among
Generation Z during the academic year 2017-2018. The survey was administered online and was completed by
a non-random sample of 415 students at State University of New York in Oneonta. This study poses the
following research question:
What
any statisti
With
New York
points for
females, an
21-25. In t
Asian, Nat
were junior
How Does
As sh
interperson
messaging,
that the use
Table 1
Compariso
Types of com
GENERA
are the perce
cally signific
a completion
in Oneonta.
completing t
nd 43% were
terms of race
ive American
rs and seniors
Generation
hown in Tab
nal communic
, etc.) most o
e of social me
on of Face-to-
mmunication
Fig
ATION Z’S SM
eptions of Ge
cant differenc
n rate of 99%
The respons
the survey as
e males. Abo
, about 54%
n, Mixed). Ap
s, while 10%
Z Commun
ble 1 and Fi
cation or dig
often than fac
edia had decr
-Face and Me
gure 1. Compar
MARTPHON
eneration Z ab
ces in terms o
%, data were c
se rate was pr
part of a cla
out 63% of th
of the respon
pproximately
were gradua
icate?
igure 1, abo
gital commun
ce-to-face co
reased their fa
Mediated Interp
ison of face-to-
NE AND SOC
bout their add
f gender and
Results
collected from
redictably hig
ass requireme
he subjects w
ndents were w
y 48% of the s
ate students.
out 46% of
nication (via
ommunication
ace-to-face co
personal Com
-face and media
CIAL MEDIA
diction to sma
age?
m a sample o
gh due to the
ent. Approxim
were 18-20 y
white and 46
subjects were
the students
smartphone,
n. Moreover,
ommunication
mmunication
ated interperson
A USAGE: A
artphone and
of 415 studen
e fact that the
mately 56%
years of age,
6% were non-
e freshman an
indicated th
social media
about 59% o
n (Figure 2).
Frequerespon
nal communicat
A SURVEY
d social media
nts at State U
e students rec
of the respon
and 27% of
-white (Hispa
nd sophomore
hat they use
a, email, text
of the studen
ency and percendents
tion.
103
a? Are there
University of
ceived extra
ndents were
f them were
anic, Black,
es, and 42%
d mediated
ting, instant
nts admitted
nt of

104
In term
dimensions
than face-t
option “on
students (3
Table 2
ComparisoGender
Notes. * p = 0
As sh
dimensions
interperson
students in
face-to-fac
How Does
Accor
GENERA
ms of gender
s of this vari
to-face comm
ne-third of m
3%) respond
on of Face-to-Freq
0.05, 95% conf
hown in Table
s of this vari
nal communi
n the age gro
ce communica
Generation
rding to surv
ATION Z’S SM
Figure 2. H
variation, th
iable. Both m
munication. A
my communi
ded in affirma
-Face and Mequency and perc
fidence.
e 3, in terms
iable. More s
cation compa
oup 18-20 rev
ation most of
Z Use Smar
vey results, 9
MARTPHON
Have social med
e results did n
males and fem
As shown in
cation is me
ative than mal
Mediated Interpcent of responde
of age varia
students in th
ared to face-
vealed that th
f the time.
rtphones?
9% of the st
NE AND SOC
dia decreased fa
not show any
males used m
n Table 2, si
ediated interp
le students (2
personal Coments
ation, the resu
he age group
-to-face comm
hey used med
tudents had a
CIAL MEDIA
ace-to-face com
y statistically
mediated inter
gnificant diff
personal com
20%).
mmunication
ults showed s
p 21-25 (64%
munication m
diated interp
a functional s
A USAGE: A
mmunication?
significant d
rpersonal com
fference was
mmunication”
by Gender
significant di
%) indicated t
most of the t
ersonal comm
smartphone,
A SURVEY
difference for
mmunication
found for th
” whereby m
ifference for
that they use
time. About 4
munication c
and about 98
most of the
more often
he response
more female
most of the
ed mediated
47% of the
ompared to
8% of them

used their s
difference
dimension
compared t
As sh
More stude
respectivel
younger ag
respectivel
Table 3
ComparisoAge groups
Notes. * p = 0
Table 4
Devices UsTypes of dev
GENERA
smartphones
in terms of
showed sign
to female stud
hown in Table
ents in the old
ly) most of t
ge groups (1
ly) compared
on of Face-to-Freq
0.05, 95% conf
sed to Connecvices
ATION Z’S SM
to connect to
gender for m
ificant differe
dents.
e 6, in terms
der age group
the time than
8-20 and 21-
to older stud
-Face and Mequency and perc
fidence.
ct to the Inter
MARTPHON
o the Internet
most of the d
ence whereby
of age varia
ps (21-25 and
n students in
-25) used lap
dents (26+) w
Mediated Interpcent of responde
rnet Most of t
NE AND SOC
t most of the
dimensions o
y more male s
ation, data rev
d 26+) used sm
the 18-20 ag
ptops to acce
who did not us
personal Coments
the Time
CIAL MEDIA
time (Table 4
of this variab
students used
vealed signif
martphones t
ge group (59
ess the Intern
se laptops to a
mmunication
A USAGE: A
4). Data did n
ble. As show
d game conso
ficant differen
to access the I
9%). Howeve
net most of t
access the Int
by Age
Frequency
A SURVEY
not show any
wn in Table 5
les to access
nce for two d
Internet (66%
er, more stud
the time (29%
ternet.
y and percent of
105
y significant
5, only one
the Internet
dimensions.
% and 100%
dents in the
% and 20%
f respondents

106
Table 5
Devices UsGender
Notes. * p = 0
Table 6
Devices UsTypes of dev
Notes. * p = 0
As sh
their smart
significant
8 and 9).
Table 7
Amount of Amount of ti
GENERA
sed to ConnecFreque
0.05, 95% conf
sed to Connecvices Freque
0.05, 95% conf
hown in Table
tphones, and
difference in
f Time Spent inime
ATION Z’S SM
ct to the Interency and percen
fidence.
ct to the Interency and percen
fidence.
e 7, approxim
d about 48%
n terms of gen
n a Typical D
MARTPHON
rnet Most of tnt of responden
rnet Most of tnt of responden
mately 51% o
spent 3-8 h
nder or age w
Day Using the
NE AND SOC
the Time by Gnts
the Time by Ants
of the student
hours per day
with regard to
e Smartphone
CIAL MEDIA
Gender
Age
ts spent nine
y on their sm
the amount o
e
A USAGE: A
hours or mor
martphones.
of time spent
Frequency and
A SURVEY
re in a typica
Data did not
on smartpho
d percent of res
al day using
t show any
ones (Tables
pondents

Table 8
Amount of Gender
Table 9
Amount of Age groups
With
smartphone
send or rec
media, and
movies onl
In addition
search or a
doing resea
The d
variable. A
more male
used their s
used their s
In term
More stude
100% resp
groups (18
students (2
GENERA
f Time Spent inFreque
f Time Spent inFrequ
regard to the
es to make o
ceive emails.
d to check the
line, 97% use
n, about 40%
apply for job
arch for class
data did not s
As shown in
students used
smartphones
smartphones
ms of age va
ents in the ol
pectively) tha
-20 and 21-2
26+) who did
ATION Z’S SM
n a Typical Dency and percen
n a Typical Duency and perc
e nature of sm
r receive pho
About 80% u
e news online
ed it to play m
used it for on
bs. One notab
s assignments
show any sig
Table 11, on
d smartphone
to access dat
to apply for j
ariation, data
lder age grou
an students in
5) used their
not use smar
MARTPHON
Day Using thent of responden
Day Using theent of responde
martphone usa
one calls, 96%
used their sm
e. Furthermor
music, 9% us
nline purchas
ble finding r
s.
gnificant diffe
nly three of t
es (18%) to p
ting sites com
jobs online co
revealed sign
ups (21-25 an
n the 18-20 a
smartphones
rtphones for
NE AND SOC
e Smartphonents
e Smartphoneents
age, Table 10
% used it to s
martphones to
re, about 66%
sed it to watc
sing, 29% use
revealed that
ference in term
the above dim
play podcast c
mpared to 25%
ompared to m
nificant differ
nd 26+) used
age group (75
s to apply for
this purpose
CIAL MEDIA
e by Gender
e by Age
0 shows that
send or receiv
o take, post, a
% of the stude
ch TV online
ed it for acce
67% of the
ms of gende
mensions sho
compared to f
% females. H
males (8%).
rences for fiv
smartphones
5%). Howeve
jobs online (
at all. Furthe
A USAGE: A
about 95% o
ve text messa
and view pho
ents used the
, and 75% us
ssing dating s
students use
r for most of
owed signific
female studen
However, mor
ve dimension
s to check the
er, more stud
(15% and 8%
ermore, more
A SURVEY
of the student
ages, and 92%
otos and video
eir smartphon
sed it for play
sites, and 12%
ed their smar
f the dimens
cant differen
nts (8%), and
re female stud
ns as shown i
e news onlin
dents in the y
% respectively
e students in t
107
ts used their
% used it to
os on social
nes to watch
ying games.
% used it to
rtphones for
ions of this
ce whereby
d 34% males
dents (15%)
in Table 12.
e (84% and
younger age
y) than older
the younger

108
age groups
students (2
Table 10
Type of AcTypes of act
Table 11
Types of AcTypes of acti
GENERA
s (18-20 and 2
26+) who did
tivities Perfoivities
ctivities Perfoivities
ATION Z’S SM
21-25) used th
not use smar
rmed on Sma
formed on Sm
MARTPHON
heir smartpho
rtphones for th
artphones
artphones by
NE AND SOC
ones to watch
his purpose.
y Gender
CIAL MEDIA
h TV online (
A USAGE: A
(11% and 9%
Frequency
Frequency
A SURVEY
% respectively
y and percent of
y and percent of
y) than older
f respondents
f respondents

Notes. * p = 0
Table 12
Types of AcTypes of acti
Notes. * p = 0
GENERA
0.05, 95% conf
ctivities Perfoivities Freq
0.05, 95% conf
ATION Z’S SM
fidence.
formed on Smquency and perc
fidence.
MARTPHON
artphones bycent of responde
NE AND SOC
y Age ents
CIAL MEDIAA USAGE: AA SURVEY 109

GENERATION Z’S SMARTPHONE AND SOCIAL MEDIA USAGE: A SURVEY
110
How Does Generation Z Use Social Media?
The results revealed that Snapchat, Instagram, Facebook, and Twitter are the most widely used social
media among Generation Z with majority of the respondents having multiple social media accounts. As shown
in Table 13, 93% of the students had an account on Facebook, 95% had an account on Snapchat, 88% had an
account on Twitter, and 58% had an account on Instagram. In addition, about 41% used YouTube while 15%
used Google Plus.
Figure 3. Most frequently used social media.
In terms of frequency of usage, 52% of the respondents indicated that they accessed various social media
several times a day, while 18% admitted accessing social media every hour of the day (Table 14).
As shown in Table 15, in terms of gender variation, significant difference was found for the response
option “about once a day” whereby more male students (33%) responded in affirmative than female students
(19%). Conversely, for the response option “every hour of the day” more female students (25%) responded in
affirmative than male students (9%).
In terms of age variation, the data showed significant differences for most of the dimensions. As shown in
Table 16, the younger students accessed the social media more often than the older students.
With regard to the amount of time devoted to social media, approximately 32% of the students
admitted using social media for 7-10 hours per day, 30% spent 5-6 hours per day, and 29% spent 1-2 hours a
day (Table 17).

Table 13
Most FrequTypes of soc
Table 14
Frequency How often so
Table 15
Frequency Gender
Notes. * p =
GENERA
uently Used Scial media
of Social Meocial media are
of Social MeFreq
= 0.05, 95% c
ATION Z’S SM
Social Media
edia Usage used
edia Usage byquency and perc
confidence.
MARTPHON
y Gender cent of responde
NE AND SOC
ents
CIAL MEDIAA USAGE: A
Frequency
Frequency
A SURVEY
y and percent of
y and percent of
111
f respondents
f respondents

112
Table 16
Frequency Age groups
Notes. * p = 0
Table 17
Amount of Amount of ti
In term
(14%) used
used (37%)
Table 18
Amount of Gender
Notes. * p = 0
GENERA
of Social MeFreq
0.05, 95% conf
f Time Spent oime
ms of gender
d social med
) social medi
f Time Spent oFreq
0.05, 95% conf
ATION Z’S SM
edia Usage byquency and perc
fidence.
on Social Med
r variation, th
dia for 11 hou
a for 1-2 hou
on Social Medquency and perc
fidence.
MARTPHON
y Age cent of responde
dia
he results sho
urs or more p
urs per day tha
dia by Gendecent of responde
NE AND SOC
ents
owed signific
per day than
an female (24
er ents
CIAL MEDIA
Frequenc
cant differenc
males (0.56
4%) students
A USAGE: A
cy and percent o
ce for two dim
%). Convers
(Table 18).
A SURVEY
of respondents
mensions. M
ely, more ma
ore females
ale students
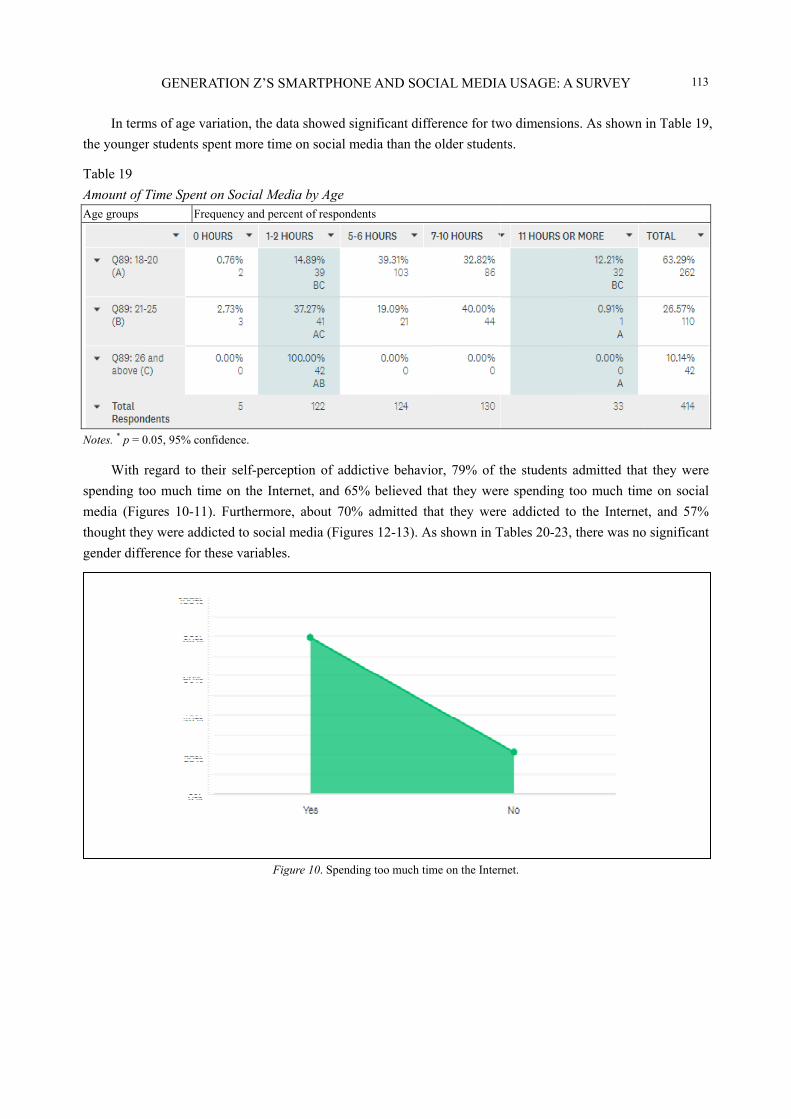
In term
the younge
Table 19
Amount of Age groups
Notes. * p = 0
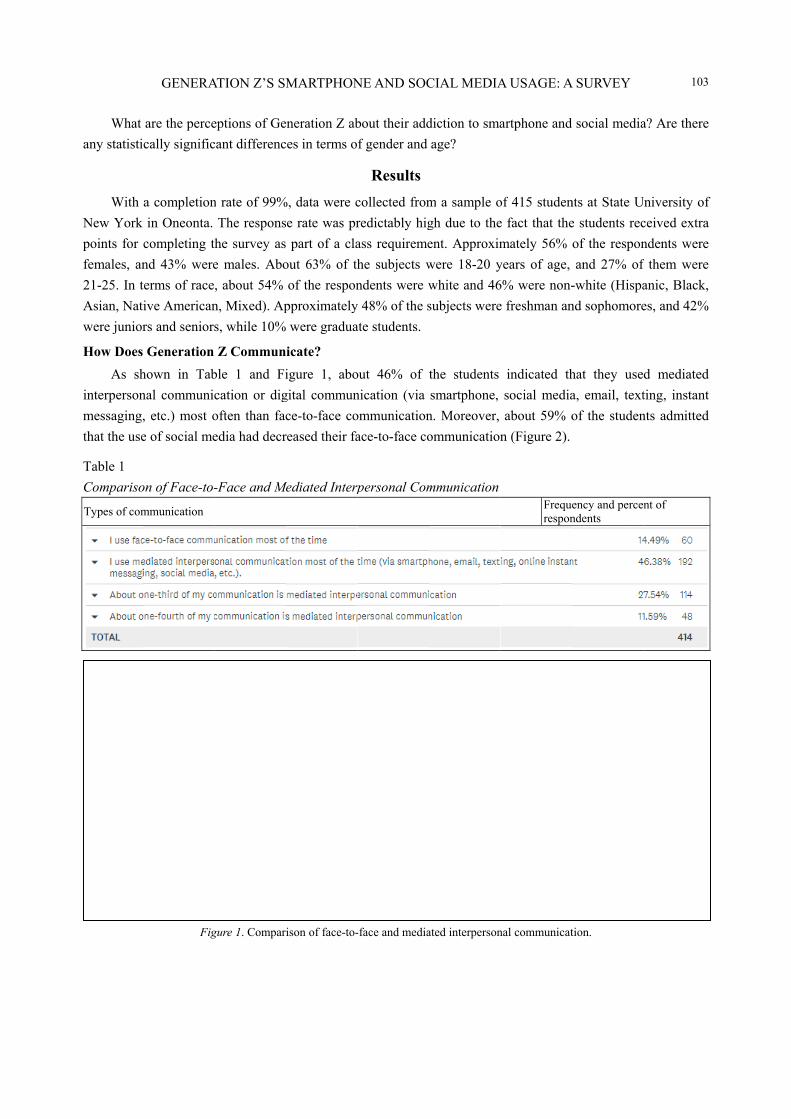
With
spending to
media (Fig
thought the
gender diff
GENERA
ms of age var
er students sp
f Time Spent oFreq
0.05, 95% conf
regard to the
oo much tim
gures 10-11).
ey were addic
ference for th
ATION Z’S SM
riation, the da
ent more tim
on Social Medquency and perc
fidence.
eir self-perce
me on the Inte
. Furthermore
cted to social
hese variables
Fig
MARTPHON
ata showed si
e on social m
dia by Age cent of responde
eption of add
ernet, and 65
e, about 70%
media (Figur
s.
gure 10. Spendi
NE AND SOC
ignificant diff
media than the
ents
dictive behavi
% believed t
% admitted th
res 12-13). A
ing too much tim
CIAL MEDIA
ference for tw
e older studen
ior, 79% of t
that they wer
hat they wer
As shown in T
me on the Inter
A USAGE: A
wo dimension
nts.
the students
re spending t
e addicted to
Tables 20-23,
rnet.
A SURVEY
ns. As shown
admitted tha
too much tim
o the Interne
there was no
113
in Table 19,
at they were
me on social
et, and 57%
o significant

GENERATION Z’S SMARTPHONE AND SOCIAL MEDIA USAGE: A SURVEY
114
Figure 11. Spending too much time on social media.
Figure 12. Addicted to the Internet.
Figure 13. Addicted to social media.
Table 20
Spending TGender
Table 21
Spending TGender
Table 22
Perceived AGender
Table 23
Perceived AGender
In term
time on the
GENERA
Too Much TimFreq
Too Much on Freq
Addiction to IFreq
Addiction to Freq
ms of age var
e Internet and
ATION Z’S SM
me Spent on Iquency and perc
Social Mediaquency and perc
Internet by Gquency and perc
Social Mediaquency and perc
iation, a large
social media,
MARTPHON
Internet by Gecent of responde
a by Gendercent of respond
Gender cent of responde
a by Gendercent of respond
er percentage
, and that they
NE AND SOC
ender ents
ents
ents
dents
of younger st
y were addict
CIAL MEDIA
tudents admit
ed to the Inter
A USAGE: A
tted that they
rnet and socia
A SURVEY
were spendin
al media (Tab
115
ng too much
bles 24-27).

116
Table 24
Spending TAge groups
Notes. * p = 0
Table 25
Spending TAge groups
Notes. * p = 0
Table 26
Perceived AAge groups
Notes. * p = 0
GENERA
Too Much TimFreq
0.05, 95% conf
Too Much TimFreq
0.05, 95% conf
Addiction to IFreq
0.05, 95% conf
ATION Z’S SM
me on Internequency and perc
fidence.
me on Social Mquency and perc
fidence.
Internet by Aquency and perc
fidence.
MARTPHON
et by Age cent of responde
Media by Agcent of respond
Age cent of respond
NE AND SOC
ents
ge ents
dents
CIAL MEDIAA USAGE: AA SURVEY

Table 27
Perceived AAge groups
Notes. *p = 0
When
38% would
absence of
face-to-fac
(Table 28).
In term
without soc
When
would be b
Furthermor
communica
play more
Table 28
Life Withou
Feelings and
GENERA
Addiction to Freq
0.05, 95% conf
n asked what t
d be depresse
f the social m
ce, 73% woul
. As shown in
ms of age var
cial media as
n asked what
bored, 54% w
re, in the ab
ate more face
sports (Table
ut Social Med
d activities
ATION Z’S SM
Social Mediaquency and perc
fidence.
their life wou
ed, 77% woul
media, 80% be
ld do more e
n Table 29, th
riation, the da
compared to
their life wo
would be dep
bsence of the
e-to-face, 75%
e 31).
dia
MARTPHON
a by Age cent of responde
uld be like wi
ld be out of to
elieved that th
exercise, 64%
here was no s
ata revealed t
o older studen
ould be like w
pressed, 61%
e Internet, 80
% would rea
NE AND SOC
ents
ithout the soc
ouch, and 57%
hey would be
% would play
ignificant gen
that younger
nts (Table 30)
without the I
would be ou
0% believed
ad more book
CIAL MEDIA
cial media, 59
% would be l
e more produ
y more sport
nder differen
students exp
).
Internet in ge
ut of touch, a
that they wo
ks, 74% woul
A USAGE: A
9% admitted t
onely (Table
uctive, and w
ts, and 76% w
ce for most o
ressed more
eneral, about
and 42% wou
ould be more
ld do more ex
Frequenresponde
A SURVEY
that they wou
28). Furtherm
ould commun
would read m
of the dimensi
concerns abo
75% admitte
uld be lonely
e productive
xercise, and
ncy and percent ents
117
uld be bored,
more, in the
nicate more
more books
ions.
out their life
ed that they
(Table 31).
and would
63% would
of

118
Table 29
Life WithouGender
Table 30
Life WithouAge groups
Notes. * p = 0
Table 31
Life WithouFeelings and
GENERA
ut Social MedFrequen
ut Social MedFrequen
0.05, 95% conf
ut Internet d activities
ATION Z’S SM
dia by Gendecy and percent
dia by Age cy and percent
fidence.
MARTPHON
er of respondents
of respondents
NE AND SOCCIAL MEDIAA USAGE: A
Frequency a
A SURVEY
and percent of respondents

In term
However, i
life withou
Table 34
Life WithouFeelings and
Table 35
Life WithouAge groups
Notes. * p = 0
This s
The r
smartphone
in a typical
The data d
males and
smartphone
The re
communica
face-to-fac
their face-t
GENERA
ms of gender
in terms of a
ut the Internet
ut Internet byd activities F
ut Internet byFrequen
0.05, 95% conf
study examin
results reveal
es to connect
l day using th
did not show
females, and
es on a daily
esults also sh
ation (via sm
ce communica
to-face comm
ATION Z’S SM
r variation, n
age variation,
t as compared
y Gender Frequency and
y Age ncy and percent
fidence.
ed the smartp
led that almo
t to the Intern
heir smartpho
any significa
d younger as
basis.
howed that ne
martphone, s
ation. Moreo
munication. B
MARTPHON
no significant
, data reveale
d to older stud
percent of resp
of respondents
Discussi
phone and soc
ost all Gen Z
net most of th
ones, and nea
ant difference
well as olde
early half of G
social media
ver, about th
Both males an
NE AND SOC
difference w
ed that young
dents (Table 3
pondents
on and Con
cial media us
Zers (99%)
he time. More
rly half of the
e in terms of
er students ar
Gen Zers use
a, email, tex
hree-fifths adm
nd females u
CIAL MEDIA
was found for
ger students e
35).
nclusions
sage among G
own a smart
e than half of
em spend 3-8
f gender or a
re spending a
e mediated in
xting, instant
mitted that th
used mediated
A USAGE: A
r most of the
expressed mo
Generation Z.
tphone, and
f Gen Zers sp
8 hours per da
age groups, w
a significant a
terpersonal c
t messaging,
he use of soc
d interperson
A SURVEY
e dimensions
ore concerns
98% of them
pend nine hou
ay on their sm
which indicate
amount of tim
communicatio
etc.) most
ial media had
nal communic
119
(Table 34).
about their
m use their
urs or more
martphones.
es that both
me on their
on or digital
often than
d decreased
cation more

GENERATION Z’S SMARTPHONE AND SOCIAL MEDIA USAGE: A SURVEY
120
often than face-to-face communication. However, younger students used mediated interpersonal
communication more often as compared to older students.
In terms of the nature of smartphone usage, one notable finding reveals that more than two-thirds of Gen
Zers use their smartphones for doing research for class assignments. Other usage of smartphones included
making phone calls, text messaging, emailing, checking the news, posting or viewing photos and videos on
social media, watching TV and movies online, playing music and games, purchasing online, accessing dating
sites, and searching and applying for jobs. With regard to the use of social media, the results revealed that
Snapchat, Instagram, Facebook, and Twitter are the most widely used social media among Generation Z with
majority of them having multiple social media accounts. In terms of frequency of usage, more than half of Gen
Zers accessed various social media several times a day, while nearly 1 in 5 admitted accessing social media
every hour of the day. In terms of gender variation, data showed that more female students accessed the social
media every hour of the day compared to males. As for age variation, the findings revealed that the younger
students accessed the social media more often than the older students. With regard to the amount of time
devoted to social media, nearly one-third of the students admitted using social media for 7-10 hours per day,
and slightly less than one-third of the students spent 5-6 hours per day on social media. There were no
significant differences in terms of gender for most of the dimensions. However, a greater percentage of younger
students spent more time on social media than older students.
As for Generation Z’s perception of their addiction to smartphone and social media, 4 in 5 students
admitted that they were spending an excessive amount of time on the Internet, and two-thirds believed that they
were spending too much time on social media. Furthermore, 7 in 10 students admitted that they were addicted
to the Internet, and nearly two-thirds believed they were addicted to social media. Although there was no
significant gender difference, younger students were more likely to admit that they were spending too much
time on the Internet and social media, and that they were addicted to the Internet and social media.
When asked what their life would be like without the social media, roughly 6 in 10 students admitted that
they would be bored and lonely, 4 in 10 would be depressed, and 8 in 10 would be out of touch. Furthermore,
in the absence of the Internet, about 8 in 10 believed that they would be more productive and would
communicate more face-to-face, 7 in 10 would read more books and would do more exercise, and 6 in 10
would play more sports. Younger students expressed more concerns about their life without the Internet and
social media as compared to older students. There was no significant gender difference for this variable.
The aforementioned discussion of data analysis indicates that although there are some positive uses, it
appears that Generation Zers are spending an excessive amount of time on their smartphones and social media,
and that most of them are addicted to their smartphones and social media. These findings may have significant
implications for counseling and intervention for parents, educators, and policy makers. Furthermore, the results
may also have significance for marketers, advertisers, mass media, and apps creators who target the Gen Z with
their products, services, and contents, as majority of Gen Zers use their smartphones and social media for
networking, online purchasing, research, news consumption, and entertainment.
This research was based on a non-random sample and focused on Generation Z, and thereby limiting the
ability to generalize the results to the larger population. Future research with a random sample could focus on
additional variables and dimensions relating to addictive usage of smartphone and social media, and its
implications for the personal, educational, and professional lives of all demographics.

GENERATION Z’S SMARTPHONE AND SOCIAL MEDIA USAGE: A SURVEY
121
References Al-Menayes, J. (2016). The fear of missing out scale: Validation of the Arabic version and correlation with social media addiction.
International Journal of Applied Psychology, 6, 41-46. Andreassen, C. S., & Pallesen, S. (2014). Social network site addiction—an overview. Current Pharmaceutical Design, 20(25),
4053-4061. Bian, M., & Leung, L. (2014). Linking loneliness, shyness, smartphone addiction symptoms, and patterns of smartphone use to
social capital. Social Science Computer Review, 33(1), 61-79. Billieux, J., Maurage, P., Lopez-Fernandez, O., Kuss, D. J., & Griffiths, M. D. (2015). Can disordered mobile phone use be
considered a behavioral addiction? An update on current evidence and a comprehensive model for future research. Current Addiction Report, 2, 156-162.
Buglass, S. L., Binder, J. F., Betts, L. R., & Underwood, J. D. M. (2017). Motivators of online vulnerability: The impact of social network site use and FOMO. Computers in Human Behavior, 66, 248-255.
Bragazzi, N. L., & Del Puente, G. (2014). A proposal for including nomophobia in the new DSMV. Psychology Research and Behavior Management, 7, 155-160.
Caplan, S. E. (2003). Preference for online social interaction: A theory of problematic Internet use and psychosocial well-being. Communication Research, 30, 625-648.
Chen, Y., Liang, C., Mai, X., & Zhong, Q. (2016). General deficit in inhibitory control of excessive smartphone users: Evidence from an event-related potential study. Frontiers in Psychology, 7, 511.
Christofides, E., Muise, A., & Desmarais, S. (2012). Risky disclosures on Facebook: The effect of having a bad experience on online behavior. Journal of Adolescent Research, 27(6), 714-731.
Hawi, N., & Samaha, M. (2016). The relations among social media addiction, self-esteem, and life satisfaction in university students. Social Science Computer Review, 35(5), 576-586.
Hong, F., & Chiu, D. (2012). A model of the relationship between psychological characteristics, mobile phone addiction and use of mobile phones by Taiwanese university female students. Computer Human Behavior, 28, 2152-2159.
Hutchinson, A. (2018). Snapchat publishes new insights into Generation Z. Social Media Today, June 5. Jeong, S., Kim, H., Yum, J., & Hwang, Y. (2016). What type of content are smartphone users addicted to?: SNS vs. games.
Computers in Human Behavior, 54, 10-17. King, D., Delfabbro, P., & Griffiths, M. (2010). The convergence of gambling and digital media: Implications for gambling in
young people. Journal of Gambling Studies, 26, 175-187. Kross, E., Verduyn, P., Demiralp, E., Park, J., Lee, D. S., & Lin, N. (2013). Facebook use predicts declines in subjective
well-being in young adults. PLOS One, 8(8), e69841. Kuss, D. J., & Griffiths, M. D. (2011). Online social networking and addiction—a review of the psychological literature.
International Journal of Environmental Research. Public Health, 8, 3528-3552. Kuss, D. J., & Griffiths, M. D. (2012). Internet gaming addiction: A systematic review of empirical research. International
Journal of Mental Health Addiction, 10, 278-296. Lee, J., Sung, M., Song, S., Lee, Y., Lee, J., Cho, S., Park, M., & Shin, Y. (2016). Psychological factors associated with
smartphone addiction in South Korean adolescents. The Journal of Early Adolescence, 38(3), 288-302. Lin, Y. C., Lee, P. H., Lin, S. H., Lin, L. R., & Chang, T. B. (2015). Time distortion associated with smartphone addiction:
Identifying smartphone addiction via a mobile application. Journal of Psychiatric Research, 65, 139-145. Lopez-Fernandez, O., Kuss, D. J., Griffiths, M. D., & Billieux, J. (2015). The conceptualization and assessment of problematic
mobile phone use. In Encyclopedia of mobile phone behavior (pp. 591-606). US: IGI Global. Megan, A. W., William, M. B., & Lis, E. (2016). The digital self: How social media serves as a setting that shapes youth’s
emotional experiences. Adolescent Research Review, 1(2), 163-173. Montag, P. W. (2016). Carpe diem instead of losing your social mind: Beyond digital addiction and why we all suffer from digital
overuse. Cogent Psychology, 3(1), 1157281. Moreno, M. A., Jelenchick, L. A., Egan, K. G., Cox, E., Young, H., Gannon, K. E., & Becker, T. (2011). Feeling bad on
Facebook: Depression disclosures by college students on a social networking site. Depression and Anxiety, 28(6), 447-455.
Müller, K. W., Dreier, M., Duven, E., Giralt, S., Beutel, M. E., & Wölfling, K. A. (2016). Hidden type of Internet Addiction? Intense and addictive use of social networking sites in adolescents. Computers in Human Behavior, 55, 172-177.

GENERATION Z’S SMARTPHONE AND SOCIAL MEDIA USAGE: A SURVEY
122
Muise, A., Christofides, E., & Desmarais, S. (2009). More information than you ever wanted: Does Facebook bring out the green-eyed monster of jealousy? CyberPsychology & Behavior, 12(4), 441-444.
Nazir, S., & Samaha, M. (2016). Relationships among smartphone addiction, anxiety, and family relations. Behavior & Information Technology, 36(10), 1046-1052.
Oberst, U., Wegmann, E., Stodt, B., Brand, M., & Chamarro, A. (2017). Negative consequences from heavy social networking in adolescents: The mediating role of fear of missing out. Journal of Adolescence, 55, 51-60.
Przybylski, A. K., Murayama, K., DeHaan, C. R., & Gladwell, V. (2013). Motivational, emotional, and behavioral correlates of fear of missing out. Computers in Human Behavior, 29, 1841-1848.
Seemiller, C., & Grace, M. (2016). Generation Z goes to college. San Francisco, California: Jossey-Brass. Schimmenti, A., Passanisi, A., Gervasi, A. M., Manzella, S., & Fama, F. I. (2015). Insecure attachment attitudes in the onset of
problematic Internet use among late adolescents. Child Psychiatry Human Development, 45, 588-595. Smith, A., & Monica, A. (2016). Social media use in 2016. Pew Research Center Internet & Technology. Pew Research Center. Song, I., LaRose, R., Eastin, M. S., & Lin, C. A. (2004). Internet gratifications and internet addiction: On the uses and abuses of
new media. CyberPsychology and Behavior, 7, 384-394. Statista Facts on Social Networks. (2015). Average numbers of hours per day spent by social media users on all social media
channels. Retrieved from https://www.statista.com/statistics/270229/usage-duration-of-social networks-by-country/ Statista Facts on Social Networks. (2016). Retrieved from https://www.statista.com/topics/1164/social-networks/ Tsitsika, A. K., Tzavela, E. C., Janikian, M., Ólafsson, K., Iordache, A., Schoenmakers, T. M., Tzavara, C., & Richardson, C.
(2014). Online social networking in adolescence: Patterns of use in six European countries and links with psychosocial functioning. Journal of Adolescent Health, 55, 141-147.
Wang, C. W., Ho, R. T. H., Chan, C. L. W., & Tse, S. (2015). Exploring personality characteristics of Chinese adolescents with internet-related addictive behaviors: Trait differences for gaming addiction and social networking addiction. Addictive Behavior, 42, 32-35.
Wood, S. (2013). Generation Z as consumers: Trends and innovation. Institute for Emerging Issues. N.C. State University. Wu, A. M. S., Cheung, V. I., Ku, L., & Hung, E. P. W. (2013). Psychological risk factors of addiction to social networking sites
among Chinese smartphone users. Journal of Behavioral Addictions, 2(3), 160-166. Andrew, H. (June 5, 2018). Snapchat publishes new insights into Generation Z. Social Media Today. Miller, L., & Lu, W. (August 20, 2018). Gen Z is set to outnumber millennials. Bloomberg Economic.


![Kantar IMRB & MMA Smartphone Usage and Behaviour Report ... · PDF fileKantar IMRB & MMA Smartphone Usage and Behaviour Report [Overview] – India 2016-17](https://static.fdocuments.in/doc/165x107/5abbc41c7f8b9a76038d1a55/kantar-imrb-mma-smartphone-usage-and-behaviour-report-kantar-imrb-mma-smartphone.jpg)


