1. ELGO DEMETER-Forest Research Institute of...
29
P. Michopoulos 1 , C. Samara 2 , T. Grigoratos 2 , M. G. Kostakis 3 , I. N. Pasias 3 , N. S. Thomaidis 3 1. ELGO DEMETER-Forest Research Institute of Athens, Terma Alkmanos, Athens 115 28, Greece 2. Environmental Pollution Control Laboratory, Department of Chemistry, Aristotle University, Thessaloniki 541 24, Greece 3. Laboratory of Analytical Chemistry, Department of Chemistry, National and Kapodistrian University of Athens, Athens 157 71, Greece
Transcript of 1. ELGO DEMETER-Forest Research Institute of...

P. Michopoulos1, C. Samara2, T. Grigoratos2, M. G.
Kostakis3, I. N. Pasias3, N. S. Thomaidis3
1. ELGO DEMETER-Forest Research Institute of Athens, Terma
Alkmanos, Athens 115 28, Greece
2. Environmental Pollution Control Laboratory, Department of
Chemistry, Aristotle University, Thessaloniki 541 24, Greece
3. Laboratory of Analytical Chemistry, Department of Chemistry,
National and Kapodistrian University of Athens, Athens 157 71,
Greece

In the following slides I am going to present you
the results derived from total elemental analysis
of the Biosoil project samples collected in Greece
through the XRF method.
Also some analysis of these samples was done
with the HF acid and comparison was made.

The soils were collected from 4 Level II plots in Greece.
One plot is in low altitude with maquis vegetation (mainly Q.
ilex) and a flysch parent material, the second is a
mountainous fir plot also on flysch parent material and the
other two plots (also mountainous) are derived from acid
soils with a mica schist parent material supporting oak and
beech forest stands
The soil layers collected were:
1.L horizon
2.FH horizon
3.0-10 cm
4.10-20 cm
5.20-40 cm
6.40-80 cm
From each layer three replicates in space (and not from the
same sample) were created. So in total we had 72 samples,
12 for each layer
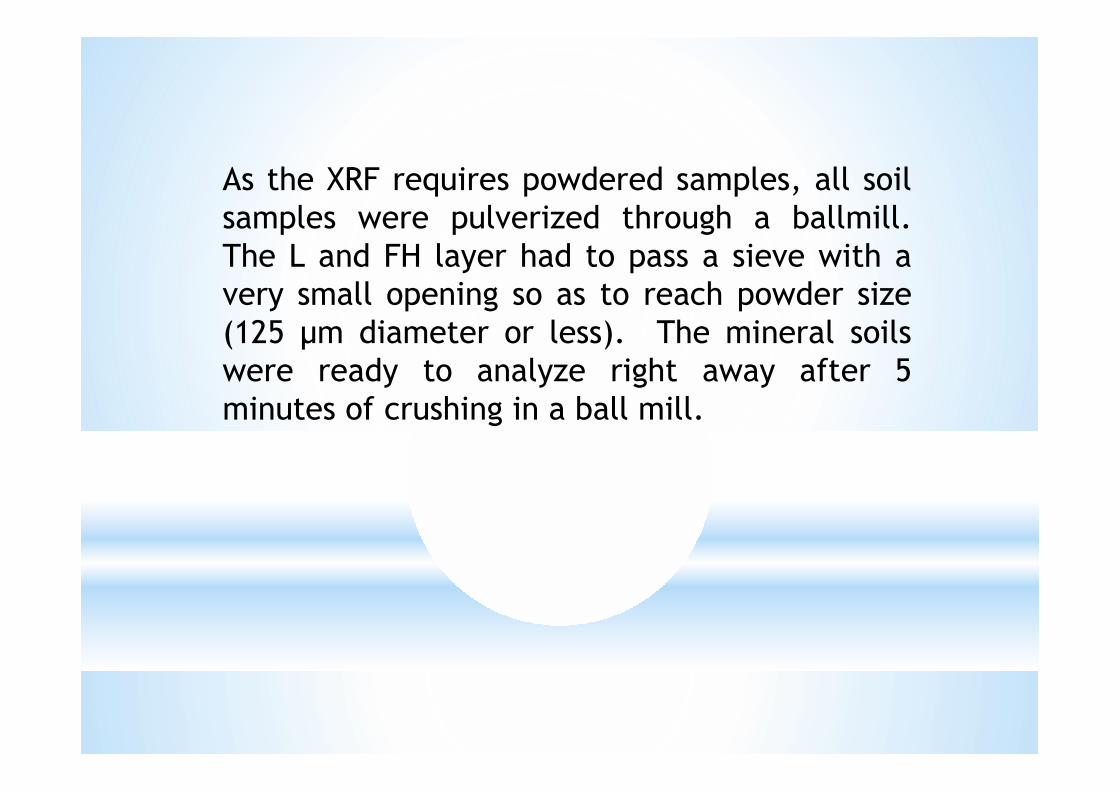
As the XRF requires powdered samples, all soil
samples were pulverized through a ballmill.
The L and FH layer had to pass a sieve with a
very small opening so as to reach powder size
(125 µm diameter or less). The mineral soils
were ready to analyze right away after 5
minutes of crushing in a ball mill.

Elemental analysis of soil samples was conducted
by Energy Dispersive X-Ray Fluorescence (ED-XRF)
Elemental AnalysisElemental Analysis

MethodMethod’’s operating principles operating principle
Ø Materials are excited with high energy-short wavelength radiation and they
become ionized
Ø The atom becomes unstable and an outer e- replaces the missing inner e-
Ø Energy is released due to the decreased binding energy of the inner e- orbital
compared with an outer one
Ø Emitted radiation is of lower energy than the primary X-rays and is termed
fluorescent radiation
Ø The energy of the emitted photon is characteristic thus the resulting
fluorescent X-rays are used to detect the abundances of elements in the sample

The analysis was carried out on tablets made of each soil sample
Standard Reference Materials MESS-1 and BCSS-1 (geo-
standards) were used for data validation

Four g of soil were compressed by hydraulic
pressure to create tablets of 32 mm width. Prior to
compressing the soil had been homogenized and an
inert cohesive material was added. The pressure
exerted was 15 tons.

The laboratory that uses XRF also analyzes standard
reference material. These standards (for metals) were
bought from the National Research Council of Canada.
Sediment for Mess-1 and BCSS-1 were collected in the
Bale des Chaleurs, Gulf of St. Lawrence. The
sediments were freeze dried, screened to pass through
a 125 µm screen, blended, bottled and radiation
sterilized.
For P and S a standard material of a coal fly ash was
used
USE OF STANDARD REFERENCE MATERIAL

Ca Mg K Fe Al Si Na Mn Cu Zn Ni Pb
5.4a 14.7 18.0 32.9 62.6 309 20.2 0.2 18.5 119 55.3 22.7
107b 85 92 111 78 68 44 150 105 78 84 95
15c 12 21 10 13 8 24 0 0.5 0.1 1 10
a Value of the reference standard
b percentage (%) of the found value with regard to the reference value
c variability (%) of the repetitions with regard to the reference value
Values of the standard material and deviations after the XRF analysis
Ca, Ma, K, Fe, Al, Si, Na, Mn are in mg/g and Cu, Zn, Ni and Pb in mg/kg

P (mg/g) S (mg/g)
5.0a 8.3
114b 96
6c 0
a Value of the reference standard
b percentage (%) of the found value with regard to the reference value
c variability (%) of the repetitions with regard to the reference value
Values of the standard material and deviations after the XRF analysis

After the analysis and the calculations of results, one
should first check if the found values fall within the
range of values mentioned in literature for total
elemental analysis of soils. For this reason the results
for each element and each soil layer were averaged out
and the results are presented in the following tables:

Ca
mg/g
Mg
mg/g
K
mg/g
P
mg/g
S
mg/g
Fe
mg/g
Al
mg/g
Si
mg/g
L 13.2 1.56 2.09 0.638 0.793 1.83 2.81 10.4
FH 17.0 6.42 5.53 1.016 1.030 26.7 28.5 91.2
0-10 cm 11.5 11.9 9.35 0.682 0.247 51.1 60.5 176
10-20 cm 10.8 12.6 9.94 0.640 0.171 54.4 65.2 183
20-40 cm 10.1 13.1 10.4 0.641 0.139 57.4 67.5 181
40-80 cm 10.0 14.0 10.9 0.597 0.098 60.2 67.8 176
Total elemental analysis in soils by XRF
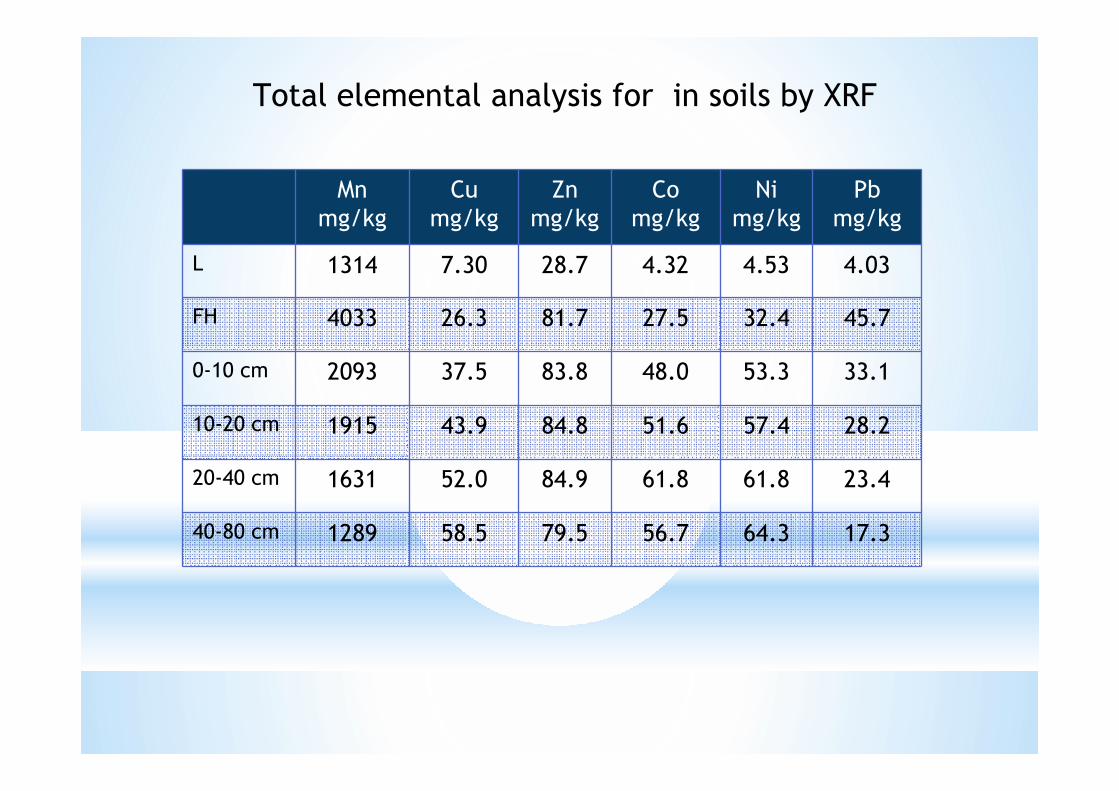
Mn
mg/kg
Cu
mg/kg
Zn
mg/kg
Co
mg/kg
Ni
mg/kg
Pb
mg/kg
L 1314 7.30 28.7 4.32 4.53 4.03
FH 4033 26.3 81.7 27.5 32.4 45.7
0-10 cm 2093 37.5 83.8 48.0 53.3 33.1
10-20 cm 1915 43.9 84.8 51.6 57.4 28.2
20-40 cm 1631 52.0 84.9 61.8 61.8 23.4
40-80 cm 1289 58.5 79.5 56.7 64.3 17.3
Total elemental analysis for in soils by XRF

Na
mg/g
Cd
mg/kg
Mo
mg/kg
L 3.70 0.140 0.572
FH 4.32 0.687 0.684
0-10 cm 6.05 0.281 0.807
10-20 cm 5.86 0.220 0.900
20-40 cm 4.87 0.154 0.993
40-80 cm 4.42 0.152 1.098
Total concentrations of Na, Cd and Mo
in soils found by the HF acid method

Ø The estimated precision of the XRF analysis were
found to range from 0.1% to 5% for the individual
elements
Ø Duplicate sample analyses were performed for some
samples (10%) in order to assure the accuracy of the
results

For comparison reasons the soil samples were
analyzed after digestion with HF acid and
determination with ICP.
Na had too high values for soils (I omitted them) and
Cd as well as Mo were below the detection limit of
the XRF instrument
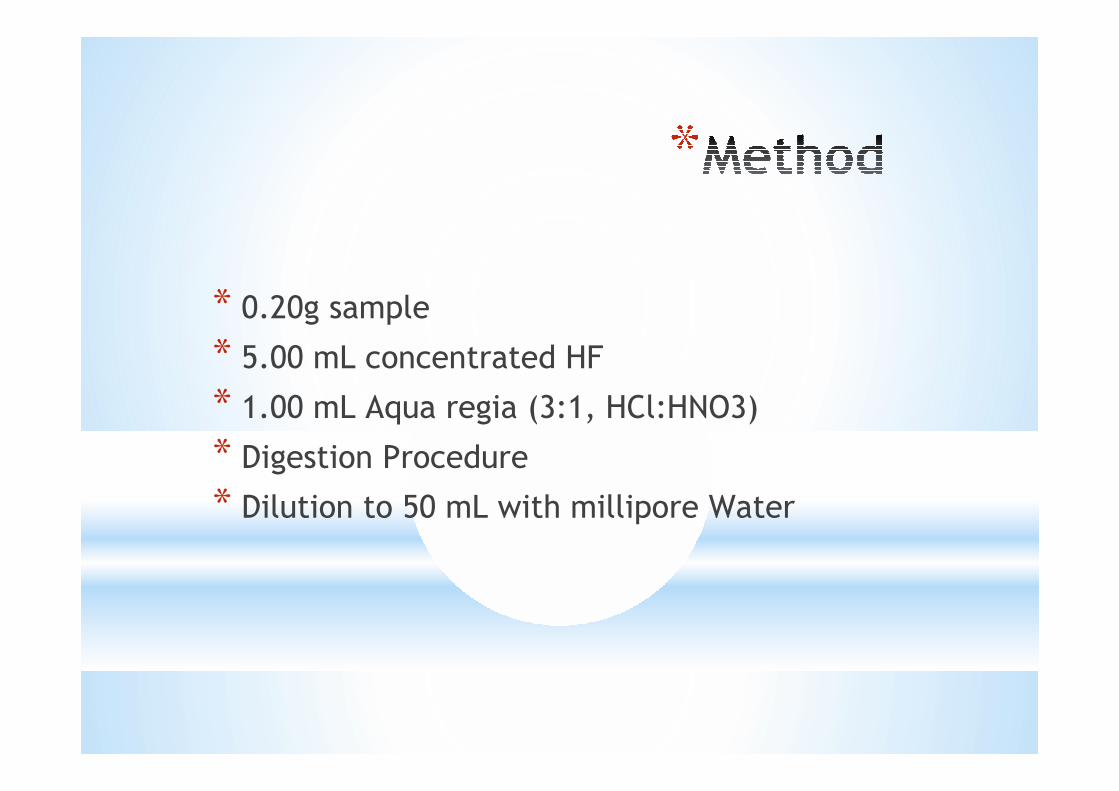
* 0.20g sample
* 5.00 mL concentrated HF
* 1.00 mL Aqua regia (3:1, HCl:HNO3)
* Digestion Procedure
* Dilution to 50 mL with millipore Water
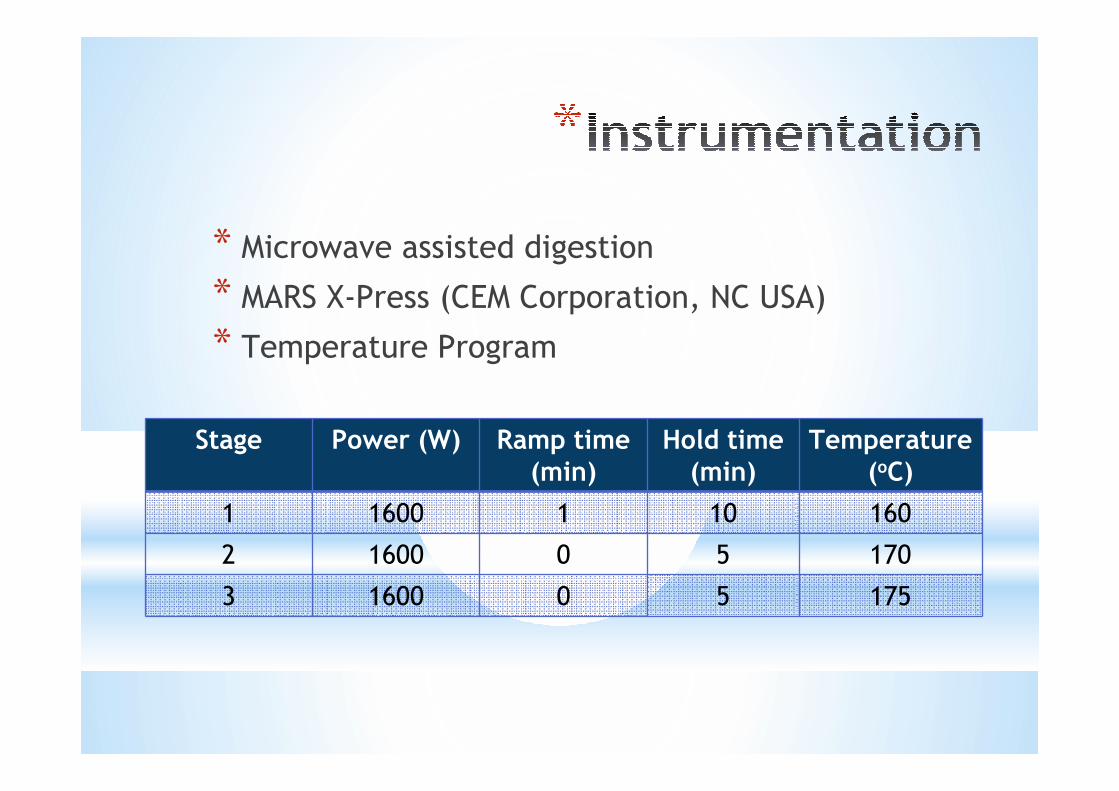
* Microwave assisted digestion
* MARS X-Press (CEM Corporation, NC USA)
* Temperature Program
Stage Power (W) Ramp time (min)
Hold time (min)
Temperature (oC)
1 1600 1 10 160
2 1600 0 5 170
3 1600 0 5 175

Internal Quality Control Sample:
TAQC1-River Sediment, Training on Analytical Quality Control - Water Framework Directive
Mean Value found (mg/kg)
Reference Value (mg/kg)
As 29.3 ± 1.0 24.1 ± 11.2
Cr 123 ± 4.3 95.9 ± 14.1
Cu 102 ± 4.0 87.3 ± 12.1
Ni 42.7 ± 1.8 34.6 ± 4.8
Zn 514 ± 21 431 ± 46
Pb 68.1 ± 4.0 75.5 ± 8.8
Cd 3.20 ± 0.19 2.72 ± 1.10
Unfortunately, during the digestion with HF acid there
was no addition of boric acid. The latter is absolutely
necessary in order to avoid the strong complexes of
the fluoride anion with Ca, Mg and Al (Michael et al.
2006). As a result the recovery of Ca and Mg was really
poor. For this reason in the following slides the Ca and
Mg concentrations are not plotted against the
respective concentrations of Ca and Mg found by the
XRF method. The Al was not as poor but the
correlation had problems and for this reason it is
plotted to have a picture of those problems.
Michael et al. 2006. Improved elemental recoveries in sols with heating
boric acid following microwave total digestion. Comm. Soil Sci. Plant
Analysis, 37: 513-524.


The other statistics used was a paired comparison between
the values (in each soil layer) found by the XRF method and
HF acid. As the values are not independent from each other,
i.e. the elemental concentration values in the FH layer
depend on the L layer decomposition, non parametric
statistics was employed.
The test used was a sign test.
It was found that K and Fe concentrations did not differ
significantly and the others did.
However, the differences imply that the two methods give a
systematic difference (lower or higher) and not how close the
values are. For example, as we saw the correlation between
Cu concentrations was really good. Nevertheless, there is a
significant difference between them due to a systematic
variation.

CONCLUSIONS
Advantages of the XRF method
1. It is completely harmless in comparison with the concentrated acids
2. It is relatively fast
3. It Is the best method for total S and probably for total P

Disadvantages of the XRF method
1. It is not accurate for light elements like Na
2. Its detection limit for Mo and Cd is not low
CONCLUSIONS